Abstract
The fluorinated phosphate lithium bis (2,2,2-trifluoroethyl) phosphate (LiBFEP) has been investigated as a film-forming additive employed to passivate the cathode and hinder continuous oxidation of the electrolyte. Cyclic voltammetry (CV) and linear sweep voltammetry coupled with online electrochemical mass spectrometry (LSV-OEMS) on a conductive carbon electrode (i.e., a C65/PVDF composite) showed that LiBFEP decreases electrolyte oxidation (CV and LSV) and LiPF6 decomposition at high potentials. Incorporation of LiBFEP (0.1 and 0.5 wt%) into LiPF6 in ethylene carbonate (EC)/ethyl methyl carbonate (EMC) (3:7 wt) results in improved coulombic efficiency and capacity retention for LNMO/graphite cells. Ex-situ surface analysis of the electrodes suggests that incorporation of LiBFEP results in the formation of a cathode electrolyte interface (CEI) and modification of the solid electrolyte interface (SEI) on the anode. The formation of the CEI mitigates electrolyte oxidation and prevents the decomposition of LiPF6, which in turn prevents HF-induced manganese dissolution from the cathode and destabilization of the SEI. The passivation of the cathode and stabilization of the SEI is responsible for the increased coulombic efficiency and capacity retention.
Export citation and abstract BibTeX RIS

This is an open access article distributed under the terms of the Creative Commons Attribution 4.0 License (CC BY, http://creativecommons.org/licenses/by/4.0/), which permits unrestricted reuse of the work in any medium, provided the original work is properly cited.
Since their debut in 1991, lithium ion batteries (LIB) have become the universal power source for consumer electronics.1 Larger format LIBs such as those needed to power electric vehicles (EVs), an important future market, have amassed considerable interest; however higher specific energy densities are required for larger format LIBs.1,2 The practical way to increase energy density is to employ cathode materials with increased theoretical capacities and/or high discharge plateaus, and thus high energy (HE) or high voltage (HV) cathodes are required in order for LIBs to meet the demands of the EV market.3 While both HE and HV cathodes have been implemented, current research efforts are focused on overcoming the caveats associated with these materials. The oxidative instability of carbonate-based electrolytes is a central limitation for cells with various cathode chemistries operated above 4.4 V.3–7 In addition to the instability of the electrolyte, cathodes such as nickel-rich layered oxides (LiNixMnyCozO2), lithium-rich layered oxides (0.6 Li2MnO3 • 0.4 Li(Ni1/3Co1/3Mn1/3)O2), and HV spinel (LiNi0.5Mn1.5O4) (LNMO) all suffer from structural instability when operated at high potentials.5–11 While the layered oxides are capable of delivering higher practical energy densities, the lack of cobalt in LNMO alleviates the issues of cost and resource limitations.7 As the higher energy densities associated with HE materials can only be obtained at higher cutoff potentials, oxidation of the electrolyte is a universal problem to both HE and HV cathodes. This work focuses on improving the performance of LNMO/Graphite cells.
The capacity fading observed in LNMO/Graphite cells is due to continuous oxidation of the electrolyte and transition metal dissolution.3,7 While the former results in the formation of unstable species on the surface of the cathode, the latter results in degradation of the LNMO material (due to loss of manganese) and increased resistance of the SEI (due to deposition of manganese on the anode).9,12 Although altering the individual components (electrolyte solvents, electrolyte salts, and cathode material) prior to cell construction have been explored extensively, electrolyte additives have also been investigated to stabilize the existing electrolyte and/or to passivate the cathode in situ. The types of additives investigated in LNMO/Graphite cells include, but are not limited to, borates, sultones, anhydrides and phosphorous-based compounds. Xu et al. showed that lithium bis(oxolato)borate (LiBOB) and lithium 4-pyridyl trimethyl borate (LPTB) displayed much better capacity retention after 30 cycles at 55°C, compared to the baseline electrolyte (1.0 M LiPF6 in EC/EMC (3/7, v/v).13–15 In situ gas analysis as well as ex situ surface analysis suggests that LiBOB is sacrificially oxidized to generate a cathode electrolyte interface (CEI) which decreases manganese dissolution. The improvement observed in the presence of LPTB has been attributed to a borate-rich CEI formed from the sacrificial oxidation of LPTB, which inhibits electrolyte oxidation on the surface of the cathode and transition metal dissolution induced damage to the anode SEI.13–15 Lee et al. have shown that vinylene carbonate (VC) is a poor additive for the LNMO/Graphite system due to its poor anodic stability, even though a recent study showed that very small amounts of VC can improve LNMO/Graphite performance.16 On the other hand, electrolytes containing 1,3-propane sultone (PS) and succinic anhydride (SA) both have better capacity retention than the baseline electrolyte (1.0 M LiPF6 in EC/EMC (1/2, v/v). The improved performance has been attributed to the formation of a stable, non-EC derived SEI.17
Phosphorous based organic compounds have been investigated as additives and co-solvents with a strong focus on their flame retardant properties. This class of compounds includes phosphazenes, phosphates and phosphonates bearing the phosphorous atom in the oxidation state V. Another class of phosphorous-based compounds which have been investigated as additives in LIBs includes phosphites, phosphonites, and phosphines with phosphorous being in the oxidation state III.18–20 The usefulness of P-based additives for HV applications has been recently reported.11,21,22 P(V)-compounds including hexakis(2,2,2-trifluoroethoxy)cyclotriphosphazene (A),23 tris(hexafluoro-isopropoxy)phosphate (B),24 tris(trimethylsilyl)phosphate (C),25 dimethyl methylphosphonate (D)26 have been reported to be promising additives for LiNi0.5Mn1.5O4 cathodes by enabling prolonged cycling and suppressing Mn dissolution (Scheme 1). Although lithium dimethyl phosphate has been reported as an anode film-forming additive which reduces cell impedance in NCM111/Graphite cells,27 to the best of our knowledge, anionic dialkylphosphates have not been investigated as additives for HV LIBs. Among the P(III) compounds tris(pentafluorophenyl)-phosphine,28 various phosphites,29 dimethylphenylphosphonite30 and bis(trifluoroethyl)phosphite31 have been investigated with LNMOs as additives and lead to less capacity fade and prolonged cycling.
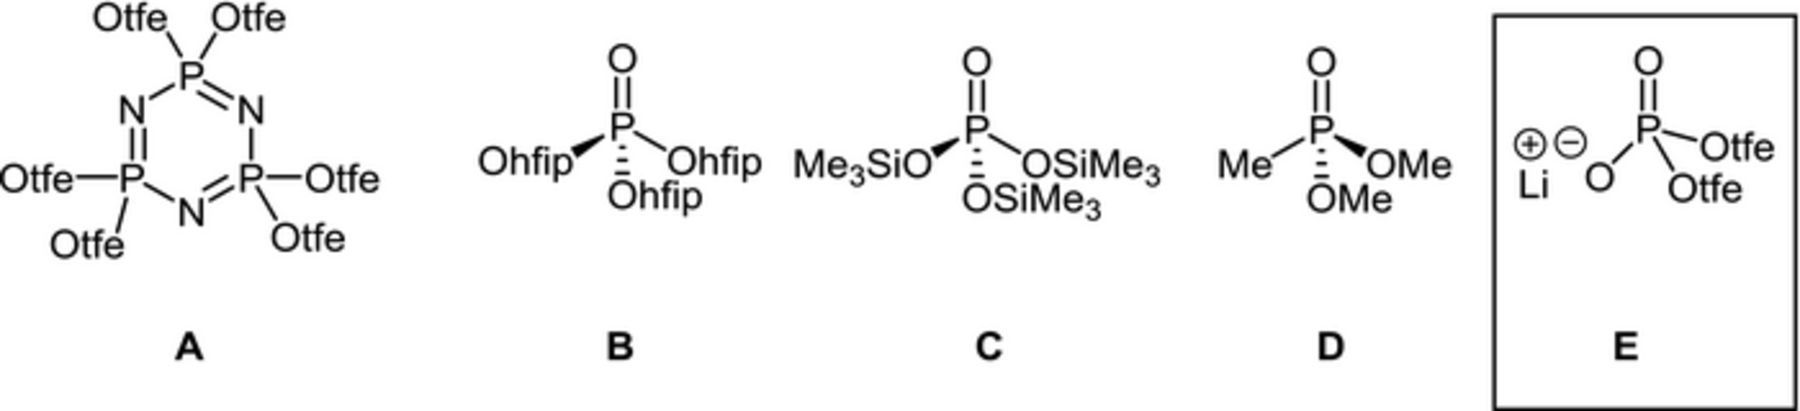
Scheme 1. Molecular structures of electrolyte additives for LNMO cathodes (tfe = CH2CF3, hfip = CH(CF3)2).
The fluorinated phosphate, lithium bis(2,2,2-trifluoroethyl)phosphate (Li[O2P(OCH2CF3)2], also referred to as LiBFEP; see E in Scheme 1) has been used as a coordination-polymer-based gel electrolyte in our recent work.32 LiBFEP forms a viscous gel in EC/DMC (1/1 g:g) at 0.5 M with a rather low conductivity of 41.8 μS·cm−1 at room temperature. However, when added to 1 M LiPF6 in EC/DMC (1/1 g:g), also referred to as LP30, the conductivity of the electrolyte is largely retained within the range of 6.0 mS·cm−1 (w. 1.0 M LiBFEP) and 10.25 mS·cm−1 (w. 0.2 M LiBFEP), still forming a viscous gel at concentrations above 0.5 M. The good conductivity for electrolytes containing LiBFEP coupled with the film forming properties of similar P-based compounds suggests investigation of LiBFEP in LNMO/graphite cells. The present work aims to evaluate the performance of LiBFEP as an additive in LNMO/graphite cells and investigate the mode of operation of LiBFEP via cyclic voltammetry (CV), linear sweep voltammetry (LSV) coupled with Online Electrochemical Mass Spectrometry (OEMS), as well as ex situ X-ray photoelectron spectroscopy (XPS) and attenuated total reflectance infrared (ATR-IR) spectroscopy on pristine and cycled electrodes.
Experimental
General
LiBFEP was synthesized in a two-step procedure as described by Schleep et al.32
Electrode preparation, CV in one-compartment cells, and LSV coupled with OEMS in two-compartment cells
To produce carbon cathodes for CV and LSV-OEMS experiments, carbon black (Super C65, Timcal, Switzerland) and polyvinylidene difluoride (PVDF, HSV 900, Kynar, Arkema, France) were mixed in a C65/PVDF ratio of 1/1 g/g. Then, 12.5 g of N-methylpyrrolidone (NMP, Sigma-Aldrich, Germany) per gram of solid were added and the mixture was homogenized with an ultrasonic horn probe for 20 min (digital sonifier 250, Branson, USA). The resulting ink was coated onto a stainless steel mesh support (SS mesh with quadratic windows of 190 μm edge length and wires of 65 μm diameter, Spörl OHG, Germany) with a 4-edge blade and dried at 50°C for 3 h in a convection oven. Cathodes with 15 mm diameter and areal loadings of 0.91 ± 0.02 mgC65/cm2 (for CV) and 1.45 ± 0.02 mgC65/cm2 (for LSV-OEMS) were prepared from coatings with 300 μm and 500 μm wet film thickness, respectively. Cathodes were vacuum-dried overnight at 120°C in a glass oven (Büchi, Switzerland) and directly transferred into an Ar-filled glove box (M. Braun, Germany) for cell assembly.
The one-compartment battery cells used for CV experiments have been described previously.33 Cathodes were separated from Li foil anodes by one glass fiber separator (glass microfiber filter No.691, VWR, Germany) soaked with 200 μL of pure LP30 or LP30 + 0.5 wt% LiBFEP electrolyte. CVs were recorded in the potential range from 5.5 to 0 V vs. Li/Li+ at a sweep rate of 0.1 mV/s. After 1 h at OCV, the first CV cycle starts from OCV with a reductive scan followed by an oxidative scan. Four CV cycles were recorded in total.
Previous publications contain detailed descriptions of the Online Electrochemical Mass Spectrometer34 the two-compartment cell,35 and the Al-sealed laminated Ohara glass36 that were used for LSV-OEMS experiments, demonstrating that it provides a gastight barrier between anode and cathode compartment of the OEMS cell.37 Cathodes were separated from Li foil anodes by an Al-sealed laminated Ohara glass and one glass fiber separator on each side of the Ohara glass. Each glass fiber separator was soaked with 200 μL of pure LP30 or LP30 + 0.5 wt% LiBFEP electrolyte. LSVs were recorded in the potential range from 5.5 to 0 V vs. Li/Li+ at a sweep rate of 0.1 mV/s. After 4 h at OCV, the linear sweep starts from OCV with a reductive scan, followed by an oxidative scan.
Electrode preparation, cell assembly, and cycling of LNMO/graphite full cells
Lithium ion coin cells containing a graphite anode and LiNi0.5Mn1.5O4 as the active cathode material were prepared with the LP57.2 electrolyte formulation containing higher LiPF6 concentration (1.2 M LiPF6 in EC/EMC 3:7 v/v (LP57.2)) with and without 0.1 wt% and 0.5 wt% added LiBFEP. The LP57.2 electrolyte was provided by a commercial supplier and has comparable performance to the LP30 electrolyte. The negative electrodes (15 mm diameter and with an areal loading of 7.1 mg/cm2) were provided by a commercial supplier and composed of 95.7 wt% graphite, 3.8 wt% carboxymethyl cellulose (CMC) binder, and 0.5 wt% conductive carbon (Super P). The positive electrodes (14.7 mm and with an areal loading of 15.9 mg/cm2) were provided by a commercial supplier and composed of 92 wt% LiNi0.5Mn1.5O4, 4 wt% (PVDF) binder, and 4 wt% conductive carbon (Super P). The coin cells contained 90 μL electrolyte, 2 separators (celgard 2500 and Whatman GF/D glass fiber), and were used for both electrochemical testing of the cells and ex situ analysis of the electrodes. Handling of the electrolyte and the electrode materials (after drying in a vacuum oven for 24 h at 110°C), as well as assembling of the coin cells were performed inside an argon filled glove box.
Coin cells were cycled with a constant current (CC) charge to 4.8 V, held at a constant voltage (CV = 4.8 V) until the current reaches a tenth of the applied current from the CC step, and a constant current (CC) discharge between to 3.3 V using a battery cycler (BT-2000 Arbin, College Station, TX). The cells were cycled with the following formation procedure: first cycle at C/20, second and third cycles at C/10, and the fourth and fifth cycles at C/5. After the initial five formation cycles, the cells were cycled at a C/5 rate for 195 cycles at room temperature. All cells were prepared in duplicate to confirm reproducibility of the cycling behavior. Representative cycling data are presented.
Ex-situ surface analysis
The cells were disassembled in an argon glove box. The electrodes were rinsed twice with 500 μL of dimethyl carbonate (DMC) to remove residual EC and LiPF6, and evacuated overnight prior to surface analysis. X-ray photoelectron spectroscopy (XPS) spectra were acquired with a Thermo K-alpha XPS using Al Kα radiation (hυ = 1486.6 eV) under ultra-high vacuum and a measured spot size of 400 μm. The pass energy for the detector was 50.0 eV, and the ion energy used during depth profiling was 200 eV. The binding energy was corrected based on the C 1s of C-C at 284.8 eV. The spectra obtained were analyzed by and fitted using Thermo Advantage software (version 5.926). A mixture of 30% Lorentzian and 70% Gaussian functions was used for the least-squares curves fitting procedure utilizing the Thermo Advantage Smart background subtraction; it is based on the Shirley background, but mandates that the background be of lesser intensity than any data point in the region.
IR measurements were conducted on a Thermo Scientific Nicolet iS10 spectrometer with an attenuated total reflection (ATR) accessory. The electrodes were transferred from the argon glove box to the nitrogen-filled glove box in a sealed argon-filled vial. The spectra were acquired in a nitrogen glove box with a resolution of 4 cm−1 and a total of 512 scans.
Results and Discussion
Electrochemical testing
In order to get insight into the electrochemical activity of LiBFEP, CVs were recorded for the blank electrolyte LP30 and the electrolyte with 0.5 wt% of added LiBFEP (Figure 1). The pure redox activity of the compound was investigated by using a C65 based composite electrode (C65/PVDF), which excludes reactivity of the active electrode materials. To allow comparison between electrochemical processes during the initial cycle and subsequent cycles, while preserving a clear presentation, Figure 1 shows cycles 1 and 3 of the CV procedure, which comprises 4 cycles. The initial reductive scan of the LP30 reference voltammogram shows the bulk reduction of EC at 0.7 V (marked by the left-most vertical dashed line in Figure 1), which decreases in intensity in subsequent cycles due to the formation of a protective layer.38 In the oxidative scan, a weak oxidative current, observed at 4.8 V (marked by the right-most vertical dashed line), increases significantly in subsequent cycles. An additional weak oxidative feature at 4.2 V emerges in cycles 2–4. The associated electrochemical processes will be discussed further in the OEMS section. When 0.5 wt% LiBFEP was added to the LP30 electrolyte, the reductive currents remain unchanged. The same holds for the appearance of oxidative features, but the oxidative current at 4.8 V decreases in comparison to pure LP30, especially in cycles 3 and 4. This implies an enhanced formation of a passivation film due to the presence of LiBFEP, which decreases further electrolyte oxidation at high potentials.

Figure 1. Cyclic voltammograms (1st and 3rd cycle) on a C65/PVDF composite electrode (vs. metallic lithium) in LP30 (upper panel) and in LP30 with 0.5 wt% LiBFEP (lower panel) in the potential range of 5.5 to 0 V at a scan rate of 0.1 mV/s, starting from OCV with reductive scan. The electrodes were coated onto a SS-mesh and a GF separator was used.
In an effort to obtain mechanistic insight into the observed redox features, OEMS measurements were conducted. Figure 2 shows the reference voltammograms of (a) pure LP30 and (b) LP30 with 0.5 wt% LiBFEP, together with their respective quantified integral gas evolution of CO2, CO, ethylene and H2 in ppm, as well as the integral gas evolution of POF3 normalized by m/z 36. Each linear potential sweep starts from OCV with a reductive scan to 0 V, followed by an oxidative scan to 5.5 V in the same manner as the CV measurements discussed above. The primary reductive and oxidative peaks (at ∼0.7 and ∼4.8 V, respectively) are in good agreement with the CV measurements in one-compartment cells.
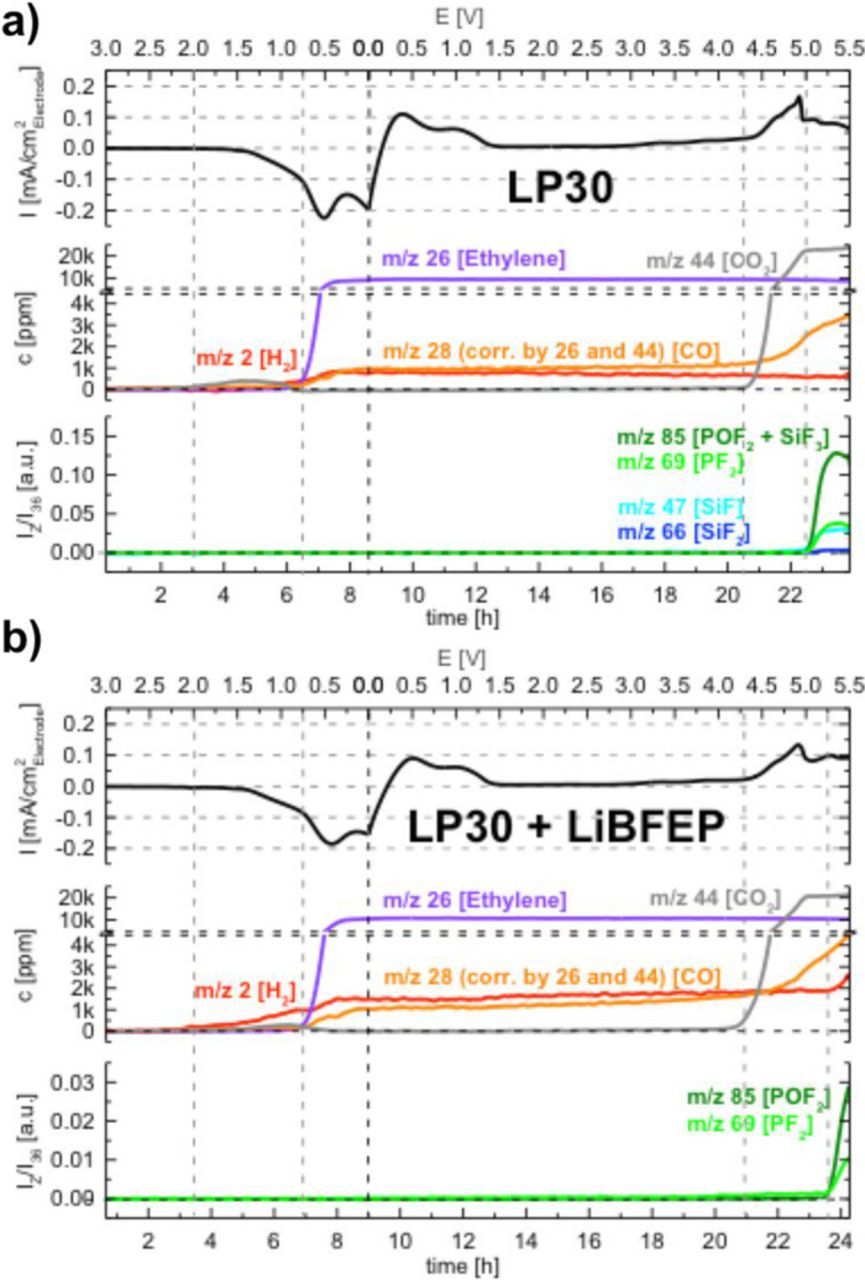
Figure 2. Upper panels: Linear sweep voltammograms at 0.1 mV/s on a C65/PVDF composite electrode (vs. metallic lithium) in (a) LP30 and (b) in LP30 with 0.5 wt% LiBFEP, recorded in a two-compartment cell, scanning negatively from OCV (∼3 V) to 0 V and followed by a positive scan to 5.5 V (potentials referenced vs. a metallic lithium counter electrode). The electrodes were coated onto a SS-mesh, The two-compartment cell uses an Al-sealed Ohara glass solid lithium ion conductor as diffusion barrier, sandwiched between 2 GF separators. Middle panels: quantified integral gas evolution of CO2, CO, ethylene and H2 in ppm; upper panels: integral gas evolution of OPF3 as indicated by PF2+, POF2+, SiF+ and SiF2+ fragments (mass signals are normalized by m/z 36).
With pure LP30 (Figure 2a), a small amount of CO2 (∼400 ppm) is detected upon the initial onset of reductive processes. The onset of the main reduction peak at ∼0.7 V is accompanied by a massive evolution of ethylene (∼9,000 ppm) as well as hydrogen (∼800 ppm) and CO (∼900 ppm). The gas evolution pattern is typical for the bulk reduction of carbonate solvents during the SEI formation on graphite.36,39 Reduction of EC results in ring opening followed by the reaction of two reduced EC molecules to generate lithium ethylene dicarbonate (LEDC) and ethylene on the graphite surface.40 During the subsequent oxidative scan, the onset of electrolyte oxidation at 4.3 V is marked by a strong evolution of CO2 (∼23,000 ppm) and a weak evolution of CO (∼3,400 ppm) at the end of the scan. In addition, the evolution of significant amounts of POF3 is observed at 5.0 V, which is identified by m/z = 104, 85, 69, 50, 47 and 88.41 The most distinctive fragments PF2+ and POF2+ have m/z of 69 and 85, respectively, and are depicted in Figure 2a. This is in line with the decomposition of LiPF6 to PF5 and the subsequent reaction of PF5 with traces of H2O formed during the decomposition of alkyl carbonates to yield HF and POF3, as reported by Metzger et al.41 Simultaneously, SiF4 evolution is supported by the presence of peaks with m/z 47 (SiF+), 66 (SiF2+) and presumably also contributing to m/z 85 (SiF3+). The occurrence of SiF4 is most probably related to the reaction of HF with the glass fiber separator. This indicates that the amount of HF formed by LiPF6 decomposition, as described above, is sufficient to detect the product of its subsequent reaction with the glass fiber separator.
The analogous measurement, performed with LP30 containing 0.5 wt% LiBFEP, is displayed in Figure 2b. As expected from the CV experiments, the reductive scan is similar to pure LP30, with a slightly earlier onset and an increased quantity of H2 evolution (∼1500 ppm compared to ∼800 ppm with pure LP30), as well as a slightly later onset of CO2 formation. Electrolyte oxidation starting at 4.3 V is the same, except for a slight decrease in oxidative currents. It has to be noted that since the present LSV-OEMS measurement is an analogue to the first CV cycle shown in Figure 1, this decrease is less pronounced than in subsequent CV cycles. A striking effect of LiBFEP is seen at potentials above 5 V, where POF3 formation is greatly diminished and its onset shifted to 5.2 V. Also, SiF4 formation is no longer detectable by OEMS (m/z 47 and 66 not shown in Figure 2b for the sake of clarity). This leads to the conclusion that LiBFEP effectively suppresses the decomposition of LiPF6 at high potentials. Another noteworthy observation is the additional release of ∼700 ppm (or 0.29 μmol) H2 above 5.2 V, which we hypothesize to originate from the partial decomposition of LiBFEP. Since incorporation of LiBFEP results in a significant decrease in the concentration of species related to HF generation, LiBFEP is promising as an additive to improve performance at high voltage and has been further investigated in LNMO/Graphite cells as described below.
Cycling of LNMO/Graphite full cells
The LP57.2 has been used for LNMO/Graphite full cell investigations. Similar performance is observed for LP30 and LP57.2 electrolytes in this system. The capacity retention and coulombic efficiency (CE) of LNMO/Graphite cells cycled with the LP57.2 electrolyte, with LP57.2 + 0.1 wt% LiBFEP, and with LP57.2 + 0.5 wt% LiBFEP at 25°C is depicted in Figure 3. Cells have first cycle specific discharge capacities of 129.3 ± 0.3 mAh/g, irrespective of the electrolyte formulation. Cells cycled with the LP57.2 electrolyte have a first cycle Coulombic efficiency of 86%, the lowest capacity retention of the 3 formulations, and reproducible rapid cell failure after 196 cycles (see last four black data points in Figure 3). Incorporation of 0.1 wt% of LiBFEP into LP57.2 does not significantly alter the first cycle Coulombic efficiency (87%). However, a small increase in capacity retention is observed, and the cells complete 200 cycles without rapid capacity loss. Increasing the concentration of LiBFEP to 0.5 wt% again results in a similar first cycle CE (87%), but the capacity retention is further improved. Cells cycled with LP57.2 have 73% capacity retention after 190 cycles, while cells cycled with 0.1 wt% LiBFEP and 0.5 wt% LiBFEP have 76% and 79% capacity retention after 190 cycles, respectively. The improved capacity retention observed from cells cycled with 0.5 wt% LiBFEP is in agreement with the decreased oxidative current observed in CV measurements after the first cycle (see Figure 1b, cycle 3) as well as the inhibition of the oxidative decomposition of LiPF6 observed in the OEMS experiments (see Figure 2b). LiPF6 decomposition generates HF, which leads to Mn dissolution and is detrimental to both the cathode and the anode, as discussed below.

Figure 3. Cycling performance and coulombic efficiency of LP57.2, LP57.2 + 0.1 wt% LiBFEP, and LP57.2 + 0.5 wt% LiBFEP in LNMO/graphite cells at 25°C. After the five initial formation cycles, the cycle-life test was conducted at C/5.
Post-mortem analysis of LNMO and graphite electrodes with ATR-IR
In order to gain insight into LiBFEP's role in surface film formation, ex-situ surface analysis of both electrodes were performed after formation cycling. ATR-IR spectra of graphite electrodes harvested from cells after formation cycling with the LP57.2 electrolyte, with LP57.2 + 0.1 wt% LiBFEP, and with LP57.2 + 0.5 wt% LiBFEP at 25°C are provided in Figure 4a. The surface of graphite after formation cycling with LP57.2 contains IR signals consistent with the presence of Li2CO3 (1431 cm−1) and ROCO2Li (1611 cm−1).42,43 While the surface of graphite after formation with LiBFEP also displays Li2CO3 and ROCO2Li peaks, the intensities of these peaks are reduced significantly in the presence of LiBFEP. Additional peaks (1152 and 1206 cm−1) are observed in the presence of LiBFEP, which are consistent with the presence of C-F and P-O bonds.44 The intensity of these bands increases with increasing concentration of LiBFEP. The ATR-IR spectra of LNMO electrodes harvested from cells after formation cycling with LP57.2, with LP57.2 + 0.1 wt% LiBFEP, and with LP57.2 + 0.5 wt% LiBFEP at 25°C are provided in Figure 4b. Absorptions characteristic of PVDF binder are observed at 833, 1166, and 1401 cm−1 and absorptions characteristic of polycarbonate are observed at ∼1780 cm−1 on the surface of LNMO, irrespective of the electrolyte formulation used; however, the spectrum of the LNMO cathode cycled with 0.5 wt% LiBFEP has the lowest relative intensity of the absorptions of the polycarbonate compared to the absorptions of PVDF.

Figure 4. ATR-IR surface analysis of (a) graphite and (b) LNMO electrodes harvested after formation cycling with LP57.2, with LP57.2 + 0.1 wt% LiBFEP, and with LP57.2 + 0.5 wt% LiBFEP 25°C.
Post-mortem analysis of graphite and LNMO electrodes with XPS
In order to gain further understanding of LiBFEP's impact on the chemical composition of the graphite surface film, XPS surface analysis was carried out on graphite electrodes extracted from cells after formation cycling with LP57.2, with LP57.2 + 0.1 wt% LiBFEP, and with LP57.2 + 0.5 wt% LiBFEP at 25°C. The relative atomic concentrations of a fresh graphite electrode and graphite electrodes cycled with the 3 electrolyte formulations are displayed in Table I. In comparison to fresh graphite, the surface of graphite cycled with LP57.2 has an increase in O, a decrease in C, and signals indicating the presence of F, Li, P, and Mn. This suggests the presence of a surface film consisting of electrolyte decomposition products (LiF, LixPOyFz, and Li2CO3) as well as Mn released from the cathode and deposited onto the graphite electrode. While the surface of graphite cycled with 0.1 wt% LiBFEP contains less C, O, P, and Mn, increases in F and Li are observed. This suggests that the addition of 0.1 wt% LiBFEP to LP57.2 based electrolyte decreases manganese dissolution and results in a fluorine-rich SEI. The surface of graphite extracted from cells cycled with 0.5 wt% LiBFEP displays a consistent trend in relative atomic concentrations as graphite cycled with 0.1 wt% LiBFEP added to LP57.2. An increase in the concentration of LiBFEP results in an increase in the concentration of F and Li, whereby the most notable difference is the absence of Mn with 0.5 wt% LiBFEP, demonstrating that LiBFEP is highly effective in preventing Mn dissolution.
Table I. Relative atomic concentrations of a fresh graphite electrode and of graphite electrodes harvested after 5 formation cycles with LP57.2, with LP57.2 + 0.1 wt% LiBFEP, and with LP57.2 + 0.5 wt% LiBFEP at 25°C.
| Relative Atomic Concentrations (%) | ||||||
|---|---|---|---|---|---|---|
| C 1s | O 1s | F 1s | Li 1s | P 2p | Mn 3p | |
| Fresh Graphite | 79.7 | 20.3 | 0 | 0 | 0 | 0 |
| LP57.2 | 45.7 | 30.7 | 8.6 | 10.2 | 3.1 | 1.7 |
| 0.1 wt% LiBFEP | 31.0 | 18.5 | 23.7 | 24.1 | 1.8 | 0.9 |
| 0.5 wt% LiBFEP | 34.1 | 19.3 | 20.2 | 24.7 | 1.7 | 0 |
C 1s, F 1s, and Li 1s XPS spectra of the cycled graphite electrodes are provided in Figure 5. The surface of graphite cycled with LP57.2 contains Li2CO3 (290.0 eV, C 1s), ROCO2Li (286.5 and 288.8 eV, C 1s), and LiF (685.0 eV, F 1s). With increasing concentrations of LiBFEP, the F 1s signal representative of LiF increases substantially, while the C 1s signals characteristic of ROCO2Li and Li2CO3 decrease slightly. In addition, the surface of graphite cycled with 0.5 wt% LiBFEP displays CF3 peaks (292.2 and 689.2 eV, C 1s and F 1s, respectively), which suggests the formation of a surface film comprised of LiBFEP decomposition products. The Mn 3p (48.5 eV) peak observed in the Li 1s – Mn 3p spectrum of graphite cycled with LP57.2 is consistent with transition metal dissolution from the cathode.45 A substantial decrease in the intensity of this peak can be observed on the surface of the graphite electrode cycled with the 0.1 wt% LiBFEP containing electrolyte, while this peak is absent in the presence of 0.5 wt% LiBFEP (shown quantitatively in Table I). This clearly demonstrates that LiBFEP suppresses transition metal dissolution. The inhibition of Mn dissolution is consistent with the inhibition of POF3 generation as observed by the OEMS results described above, where the onset of the POF3 related signals is shifted from ∼5.0 to ∼5.2 V (see Figure 3). The generation of POF3 and related acidic species leads to Mn dissolution, which has been reported to damage the anode SEI, resulting in thickening of the SEI over long-term cycling.46–48
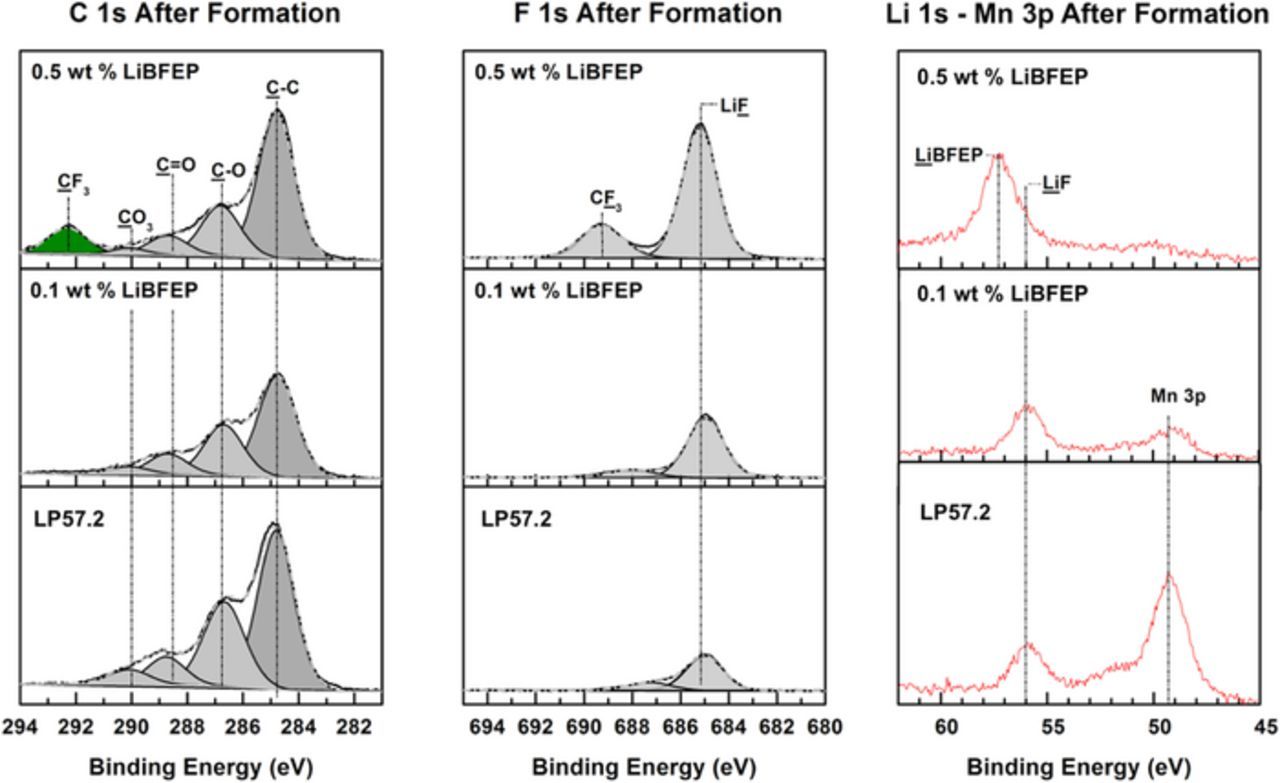
Figure 5. XPS surface analysis of graphite anodes after 5 formation cycles with LP57.2, with LP57.2 + 0.1 wt% LiBFEP, and with LP57.2 + 0.5 wt% LiBFEP conducted at 25°C.
XPS surface analysis was also carried out on LNMO electrodes harvested from the above described cells (i.e., after 5 formation cycles without or with LiBFEP in LP57.2 electrolyte at 25°C) in order to develop a better mechanistic understanding of the performance improvement observed with LiBFEP. The relative atomic concentrations of a fresh LNMO electrode and LNMO electrodes cycled with the three electrolyte formulations are displayed in Table II. In comparison with fresh LNMO, a slight decrease in carbon and the addition of phosphorous was detected on the surface of LNMO electrodes cycled with the LP57.2 electrolyte. Less carbon and more fluorine was detected on the surface of LNMO electrodes cycled with 0.1 wt% LiBFEP than the surface of LNMO electrodes cycled with LP57.2. The surface of LNMO electrodes cycled with 0.5 wt% LiBFEP contained less carbon and more fluorine and phosphorous than the surface of LNMO electrodes cycled with 0.1 wt% LiBFEP. The carbon detected on the surface of fresh LNMO electrodes is from the conductive carbon and the fluorine is from the PVDF binder (blue colored peaks in the F 1s spectra). The combination of the decrease in carbon and increase in both fluorine and phosphorous detected with increased LiBFEP concentration suggests the presence of LiBFEP decomposition products in the CEI.
Table II. Relative atomic concentrations of a fresh LNMO electrode of and LNMO electrodes harvested after 5 formation cycles with LP57.2, with LP57.2 + 0.1 wt% LiBFEP, and with LP57.2 + 0.5 wt% LiBFEP at 25°C.
| Relative Atomic Concentrations (%) | ||||||
|---|---|---|---|---|---|---|
| C 1s | O 1s | F 1s | P 2p | Mn 2p | Ni 2p | |
| Fresh LNMO | 55.0 | 14.1 | 25.7 | 0 | 3.4 | 1.8 |
| LP57.2 | 53.9 | 15.4 | 24.9 | 1.8 | 3.4 | 1.6 |
| 0.1 wt% LiBFEP | 52.7 | 15.3 | 26.0 | 0.8 | 3.6 | 1.7 |
| 0.5 wt% LiBFEP | 50.2 | 15.6 | 27.3 | 1.4 | 3.4 | 1.7 |
The C 1s, O 1s, and F 1s spectra of LNMO electrodes cycled with the three electrolyte formulations are displayed in Figure 6. The surface of LNMO after formation cycling displays LiF (685 eV, F 1s) peaks for all 3 electrolyte formulations. Additionally, CF3 peaks (292.2 and 689.2 eV, C 1s and F 1s, respectively) are detected on the surface of LNMO cycled with LiBFEP, which increase with LiBFEP concentration. This indicates the presence of a CEI comprised of LiBFEP decomposition products that may passivate some of the active sites24 on the cathode surface and supports the decrease in oxidative current observed during consecutive CV cycles (see Figure 1b) in the presence of LiBFEP.
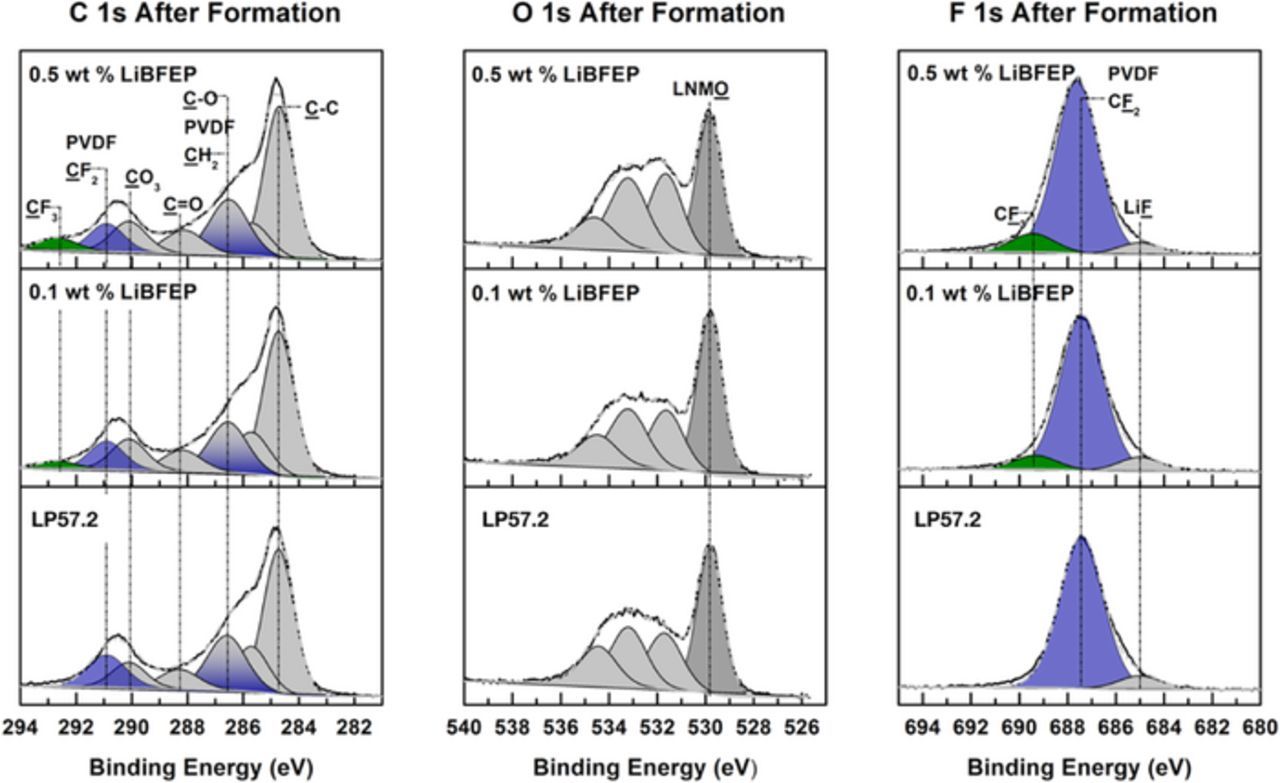
Figure 6. XPS surface analysis of LNMO cathodes after 5 formation cycles with LP57.2, with LP57.2 + 0.1 wt% LiBFEP, and with LP57.2 + 0.5 wt% LiBFEP at 25°C.
Conclusions
The implementation of LiBFEP as an additive in carbonate electrolytes improves the capacity retention and the Coulombic efficiency of LNMO/Graphite cells during long-term cycling. The improved electrochemical cycling performance correlates well with the decreased oxidative current observed in cyclic voltammograms, with the inhibition of LiPF6 decomposition at high potentials observed by OEMS, and with the inhibition of Mn dissolution and its concomitant deposition on the anode as observed by XPS. A combination of XPS and IR-ATR analysis of the cathode surface suggests the presence of LiBFEP decomposition products on the cathode surface, which may result in cathode passivation via the generation of a CEI. Thus, LiBFEP is a promising electrolyte additive for LNMO/Graphite cells.
Acknowledgments
Financial support of this research by BASF SE through the framework of its Scientific Network on Electrochemistry and Batteries is gratefully acknowledged by TUM, URI and UoF.
ORCID
Witali Beichel 0000-0001-9894-3338
Brett L. Lucht 0000-0002-4660-0840