Abstract
Platinum electrocatalysts supported on high surface area and Vulcan carbon blacks (Pt/HSC, Pt/V) were characterized in rotating disk electrode (RDE) setups for electrochemical area (ECA) and oxygen reduction reaction (ORR) area specific activity (SA) and mass specific activity (MA) at 0.9 V. Films fabricated using several ink formulations and film-drying techniques were characterized for a statistically significant number of independent samples. The highest quality Pt/HSC films exhibited MA 870 ± 91 mA/mgPt and SA 864 ± 56 μA/cm2Pt while Pt/V had MA 706 ± 42 mA/mgPt and SA 1120 ± 70 μA/cm2Pt when measured in 0.1 M HClO4, 20 mV/s, 100 kPa O2 and 23 ± 2°C. An enhancement factor of 2.8 in the measured SA was observable on eliminating Nafion ionomer and employing extremely thin, uniform films (∼4.5 μg/cm2Pt) of Pt/HSC. The ECA for Pt/HSC (99 ± 7 m2/gPt) and Pt/V (65 ± 5 m2/gPt) were statistically invariant and insensitive to film uniformity/thickness/fabrication technique; accordingly, enhancements in MA are wholly attributable to increases in SA. Impedance measurements coupled with scanning electron microscopy were used to de-convolute the losses within the catalyst layer and ascribed to the catalyst layer resistance, oxygen diffusion, and sulfonate anion adsorption/blocking. The ramifications of these results for proton exchange membrane fuel cells have also been examined.
Export citation and abstract BibTeX RIS

This is an open access article distributed under the terms of the Creative Commons Attribution 4.0 License (CC BY, http://creativecommons.org/licenses/by/4.0/), which permits unrestricted reuse of the work in any medium, provided the original work is properly cited.
With the initiation of commercialization of automotive proton exchange membrane fuel cells (PEMFCs) rapidly approaching, a reduction in the cathode platinum electrocatalyst loading by a factor of ∼4, while maintaining the performance, has become imperative to meet the cost targets (∼10 gPt/100 kW stack; ∼$50/gPt).1–3 A technique to rapidly screen novel advanced electrocatalysts that are typically synthesized in mg batches is indispensable to researchers pursuing this objective. Over the last two decades, commercially obtainable rotating disk electrode (RDE) systems have gained in popularity since they can be conveniently adapted for deposition of catalyst films on glassy carbon (GC) disks. The modified thin film RDE (TF-RDE) technique is well suited for the screening of oxygen reduction reaction (ORR) catalyst candidates as a first step to limit the time and expense invested in an expensive scale-up of catalyst synthesis and a necessarily time-consuming and elaborate evaluation in a practical subscale PEMFC platform.
A survey of the TF-RDE literature is indispensable in delineating the evolution of the technique from its beginnings to its current status and future as a standard method for screening electrocatalysts. For early works starting from the initiating work to obtain kinetic information for high surface area catalysts using rotating electrode system reported by Stonehart and Ross in 1976,4 Gasteiger and Schmidt provide an excellent detailed review.5 The TF-RDE technique reported 22 years after the initiating work owes its inception to the seminal work of Gloaguen et al. in 19946 who elucidated a method for fabricating electrodes using Nafion-based Pt/V inks to obtain the SA and MA. They analyzed Pt/V catalyst layers having 1.1 μm and 5.6 μm thicknesses (calculated for a mixed catalyst/ionomer layer) using ORR Tafel analysis coupled with a macro-homogeneous model (uniformly distributed catalytic sites and electrolyte) to account for O2 diffusion within the catalyst layer. For thinner films, they concluded that kinetic parameters were extractable directly from Tafel plots at low current densities after applying the Koutecký-Levich (K-L) correction for O2 diffusion in the bulk electrolyte. Chien et al.7 were some of the first researchers who investigated mass transport through a polymer film coated on RDE by applying the K-L equation without modification for film contribution. Later, Gough et al.8,9 treated the mass transport resistance on poly-Pt RDE disks coated with an ionomer film by introducing an additional term in the K-L equation, viz., 1/if = 1/(–neFDfCf/δf), where ne, F, Df, Cf, δf represent electron number, Faraday's constant, diffusivity and solubility of a reactant in the film, and film thickness respectively. Gottesfeld et al.10 were the first to invoke the 1/if term to de-convolute Df and Cf of O2 from steady-state currents (limiting currents) and transient currents (LSVs) for thick recast Nafion films on roughened poly-Pt disks; Lawson et al.11 followed this work using solution-processed Nafion on poly-Pt. Watanabe et al.12 studied the effect of Nafion cap thickness (on bulk poly-Pt) on the magnitude of the H2 and O2 diffusion limiting currents and ascertained that the limiting currents were not affected for film thicknesses <0.2 μm.
Following these findings on the impact of Nafion caps on bulk electrodes, Schmidt et al.13 proceeded to refine the technique to obtain kinetics on high surface area catalysts and named it as TF-RDE technique. Their film formation process included depositing a Pt/C catalyst ink on GC, drying, and lastly deposition of an aliquot of Nafion ionomer producing a capped structure (∼7 μg/cm2Pt, thickness <∼10 μm by microscopy). They argued that their measured kinetic currents (ik) bypassed the necessity for mathematical modeling employed by Gloaguen et al.6 They conducted a limiting current study for Nafion cap thickness between 0.1–15 μm (calculated from Nafion density 2.0 g/cm3 and geometrical area) and determined that the H2 diffusion resistance became negligible for cap thicknesses below 0.5 μm. The ensuing work of Gojkovic et al.14 involved a broader set of experiments for Pt/C catalysts mixed in with Nafion that were also analyzed using the K-L modification (1/if). They explored the ORR kinetics for Pt supported on various carbon black supports in 0.1 M H2SO4, H3PO4, HClO4 and NaOH. Paulus et al.15 subsequently extended the study of Schmidt et al.13 to ORR kinetics with Pt/V (14 μg/cm2Pt) and inferred from the magnitude of limiting currents that when using <0.2 μm Nafion caps (profilometer) O2 diffusion losses can be safely disregarded. Higuchi et al.16 fabricated catalyst films with low loadings of 1.37–9.66 μg/cm2Pt and calculated thickness ∼0.03 μm. They asserted that the Nafion cap thickness needed to be <0.1 μm to obtain ORR kinetics but did not support their claims with SA values under comparable conditions to the work of Paulus et al.15 In employing Nafion caps, researchers often implicitly postulate a discrete Nafion film located over the catalyst layer and calculate a hypothetical cap thickness based on density and volume of ionomer used. These assumptions are unrealistic and only applicable when present over a smooth non-porous bulk material like poly-Pt; for a porous Pt/C catalyst layer, the aliquot of Nafion used to form a cap penetrates and distributes itself over the depth of the catalyst layer. Additionally, the literature does not offer adequate descriptions of the admittedly non-trivial measurement of the thickness and uniformity of the catalyst layer itself until very recently.17
Nevertheless, the refinement and advanced implementation of the TF-RDE technique reported by the groups discussed so far6,13–16 has had a profound influence in the field of electrocatalyst characterization leading to its widespread adoption. TF-RDE has been use to determine the ORR activity of Pt-alloy catalysts,18–26 core-shell catalysts,27–32 extended thin film structures,19–21,33,34 non-precious metal catalysts,35–41 Pt on alternative supports,42,43 as well as particle size effects,14,17,44–50 oxygen reaction order,15,51 activation energy, durability,27,31,32,42,51–60 Pt surface oxidation,61,62 and peroxide formation (RRDE).36,63–67
One of the few systematic studies that engaged in optimizing the catalyst ink to improve film properties is that by Takahashi et al.51 Conventional inks used to fabricate TF-RDE electrodes are normally formulated by sonication of inks composed of the electrocatalyst, water, alcohol and Nafion ionomer. Takahashi et al.51 varied the proportion of water to isopropanol (IPA) and sonication times to obtain optimal IPA contents that resulted in ECAs that were markedly higher by ∼20% compared to IPA-free inks. They also highlighted the fact that an arbitrary ink formulation was unlikely to produce good quality films for different catalysts.
In a series of three papers, Garsany et al.68–70 highlighted a number of issues relating to catalyst layer quality. They showed that the so-called 'coffee ring' structure71 observed for catalyst layers fabricated using stationary techniques could be significantly reduced by depositing the ink on an inverted RDE rotator. The catalyst layers fabricated by the rotational drying technique resulted in improvements in SA at 0.9 V by as much as a factor of 1.9 (no iR correction). In recent advancements, Ke et al.17 employed a novel, proprietary automated ink-dispensing device capable of depositing thousands of 'nanoliter sized droplets' onto the GC to generate a series of Nafion-based uniform catalyst layers of varying thickness. They reported an increase in SA at 0.9 V by a factor of ∼1.4 (no iR correction) when the loading was reduced from 70.4 μgPt/cm2 to 3.91 μgPt/cm2.
The ionomer in the catalyst layer has been characterized to have a micelle-like structure composed of a PTFE backbone with –SO3H pendant mobile side chains that differ from both thin ionomer continuous films and free acids. The ionomer has also been postulated to consist of discontinuous fragments that form a non-uniform coating on nano-particle platinum dispersed on carbon black and is highly influenced by interfacial interactions. Although some studies have discussed a blocking effect by Nafion10,11,72–74 as well as a higher O2 solubility,10,11,75 specific adsorption of the sulfonate anion has been traditionally disregarded in both descriptive and mathematical models. Recently, Subbaraman et al.76,77 in a series of publications have reported observing irreversible peaks attributable to sulfonate anion adsorption on either HUPD region or double layer region on well-defined Pt and poly-Pt surfaces, combined with a positive shift in the onset of oxides and ORR activity loss. The activity loss on Pt(111), (110) and (100) surfaces by ionomer paralleled that observed at bare Pt surfaces in sulfuric acid solution and they drew the conclusion that sulfonate anion adsorption was the main source of ORR activity loss. They also report on a similar but less pronounced effect on the 3M nanostructured thin film (NSTF, ∼10 m2/g) catalysts with the extent of loss following the sequence Pt(111)>poly-Pt>NSTF. Several complementary studies have reported the detrimental effects of sulfonate anion adsorption.78–80
A common factor in a majority of the TF-RDE studies for Pt/C catalysts encountered in the literature is the incorporation of Nafion ionomer either mixed in with the catalyst ink formulation or applied as a cap over the dried catalyst film on RDE disk.6,13–15,17,48–51,61,62,69,81–84 However, the ORR activity values that are measured with added Nafion represent a complex, poorly defined, and variable electrochemical interface that can be represented as "Pt/C | discontinuous Nafion film soaked in 0.1 M HClO4, free 0.1 M HClO4". We use this notation to describe two parallel interfaces, Pt/C in contact with HClO4 soaked Nafion and Pt/C directly in contact with free HClO4 as shown in Fig. S1 (supplementary information, SI). Previous ionomer cap studies have predominantly addressed O2 diffusion within the Nafion cap and the need to minimize the cap thickness to directly obtain kinetic values from the basic K-L expression without incorporation of the additional term (1/if) corresponding to film resistance. Although it is a well-established fact that a calculated Nafion cap thickness <0.1–0.2 μm has no measurable effect on the O2 limiting current,15,16 it does not imply that the ionomer impact on ORR kinetics can be disregarded.
Current status of TF-RDE technique
Our discussion of the TF-RDE literature delineates the evolution of the technique through: i) the development of an ink mixed with Nafion that produced fairly thick catalyst layers, ii) understanding the impact of Nafion film thickness (cap) on diffusion limiting currents, iii) improvements in ink dispersion, and, iv) advancements in catalyst layer quality. Despite all these advancements, there continues to be a spread in the ORR activity reported using TF-RDE; the absence of a baseline for Pt/C obtained using an established protocol and best practices for catalyst layer fabrication leads to difficulties in benchmarking novel catalyst candidates. It is evident that values of "kinetic currents" and "activity" reported in the literature actually represent a "measured activity" that may not be completely free from losses associated with O2 diffusion, protonic resistances 'within the catalyst layer' as well as blocking/adsorption by species at the catalyst-electrolyte interface.15,17,69,85–87
Focus of this study
The objectives of this study are: i) to obtain the ORR activity using conventional and advanced film fabrication techniques with statistically significant number of samples using down-selected protocols established and defined in Part I, and understand the difference in measured ORR activity;88 ii) to obtain 'true' kinetics on Nafion-free catalyst layers (Pt/C | free 0.1 M HClO4 interface), iii) to understand the impact of Nafion ionomer on the activity, and, lastly iv) to emphasize the implications of ionomer adsorption in PEMFCs and the causes for differences in the absolute magnitude of activity between MEAs and TF-RDE.
Experimental
Catalysts, chemicals and reactant gases
Two commercial TKK Pt/C electrocatalysts, namely, TEC10E50E (Pt/HSC; 132.6 m2/gPt CO chemisorption) and TEC10V50E (Pt/V; 77.6 m2/gPt CO chemisorption) were employed. Deionized (DI) water, IPA, Nafion solution, conc. sulfuric acid, Nochromix, alumina dispersion, and reactant gases used in this study have identical specifications as detailed in Part I of this manuscript.88 A non-ionic surfactant (Triton X-100, Sigma, #T-9284) was incorporated into surfactant-based ink formulations. 70% perchloric acid sourced from Veritas Doubly Distilled (GFS chemicals) for poly-Pt studies and Superior Reagent (ACS) (GFS chemicals) for Pt/C studies were diluted to prepare electrolytes in this work.
Instrumentation
Details of the specifications of microbalance, AutoLab potentiostats, as well as Pine rotators, rotator shafts, GC and poly-Pt electrode tips (ϕ = 5 mm, 0.196 cm2) are specified in Part I of this manuscript.88 A bath sonicator (FS30H, Fisher Scientific, output: 42 kHz, 100 W) as well as a horn sonicator (S-4000, QSONICA, LLC., output: 20 kHz, 600 W max) were employed in the preparation of catalyst inks. An optical microscope (AM4815ZT Dino-Lite Edge, Dino-Lite Digital Microscope) was routinely used to facilitate low-resolution inspection of catalyst layers on GC. JEOL JSM-7000F Field Emission Microscope with EDAX Genesis Energy Dispersive X-Ray Spectrometer was employed to conduct secondary electron microscopy (SEM) and energy dispersive X-ray spectroscopy (EDX) and detailed examination and analysis of the distribution of catalyst on GC.
Electrochemical cell apparatus
The electrochemical cell design (130 mL; counter electrode, CE: Pt gauze; reference electrode, RE: reversible hydrogen electrode, RHE; working electrode, WE: GC with catalyst layer or bulk poly-Pt disk) as well as detailed cleaning procedure that includes acid/oxidizing agent soak and subsequent 3–6 DI water rinses are exhaustively described in Part I of this manuscript.88 The cell was repeatedly rinsed with dilute HClO4 solution 2–3 times prior to being filled with a measured amount for experimentation.
Electrochemical measurements
Protocols for break-in/conditioning, CVs and ORR I-V curve measurements (Tables It2–III) that were established based on comprehensive experimental studies were reported in Part I,88 and have been meticulously adhered to in this manuscript except when clearly stated otherwise. Correction for background (b.g.) currents and solution resistance (Rsoln) were applied to all electrochemical data. All measurements were conducted at 23 ± 2°C; ORR kinetic currents have been corrected to 100 kPa O2 and the SA (μA/cm2Pt) and MA (mA/mgPt) reported at 0.9 V vs. RHE.15,89,90
Table I. Schematic representation of the potential profile and detailed protocol for conditioning of Pt/C electrocatalysts in 0.1 M HClO4 at 100 kPa.
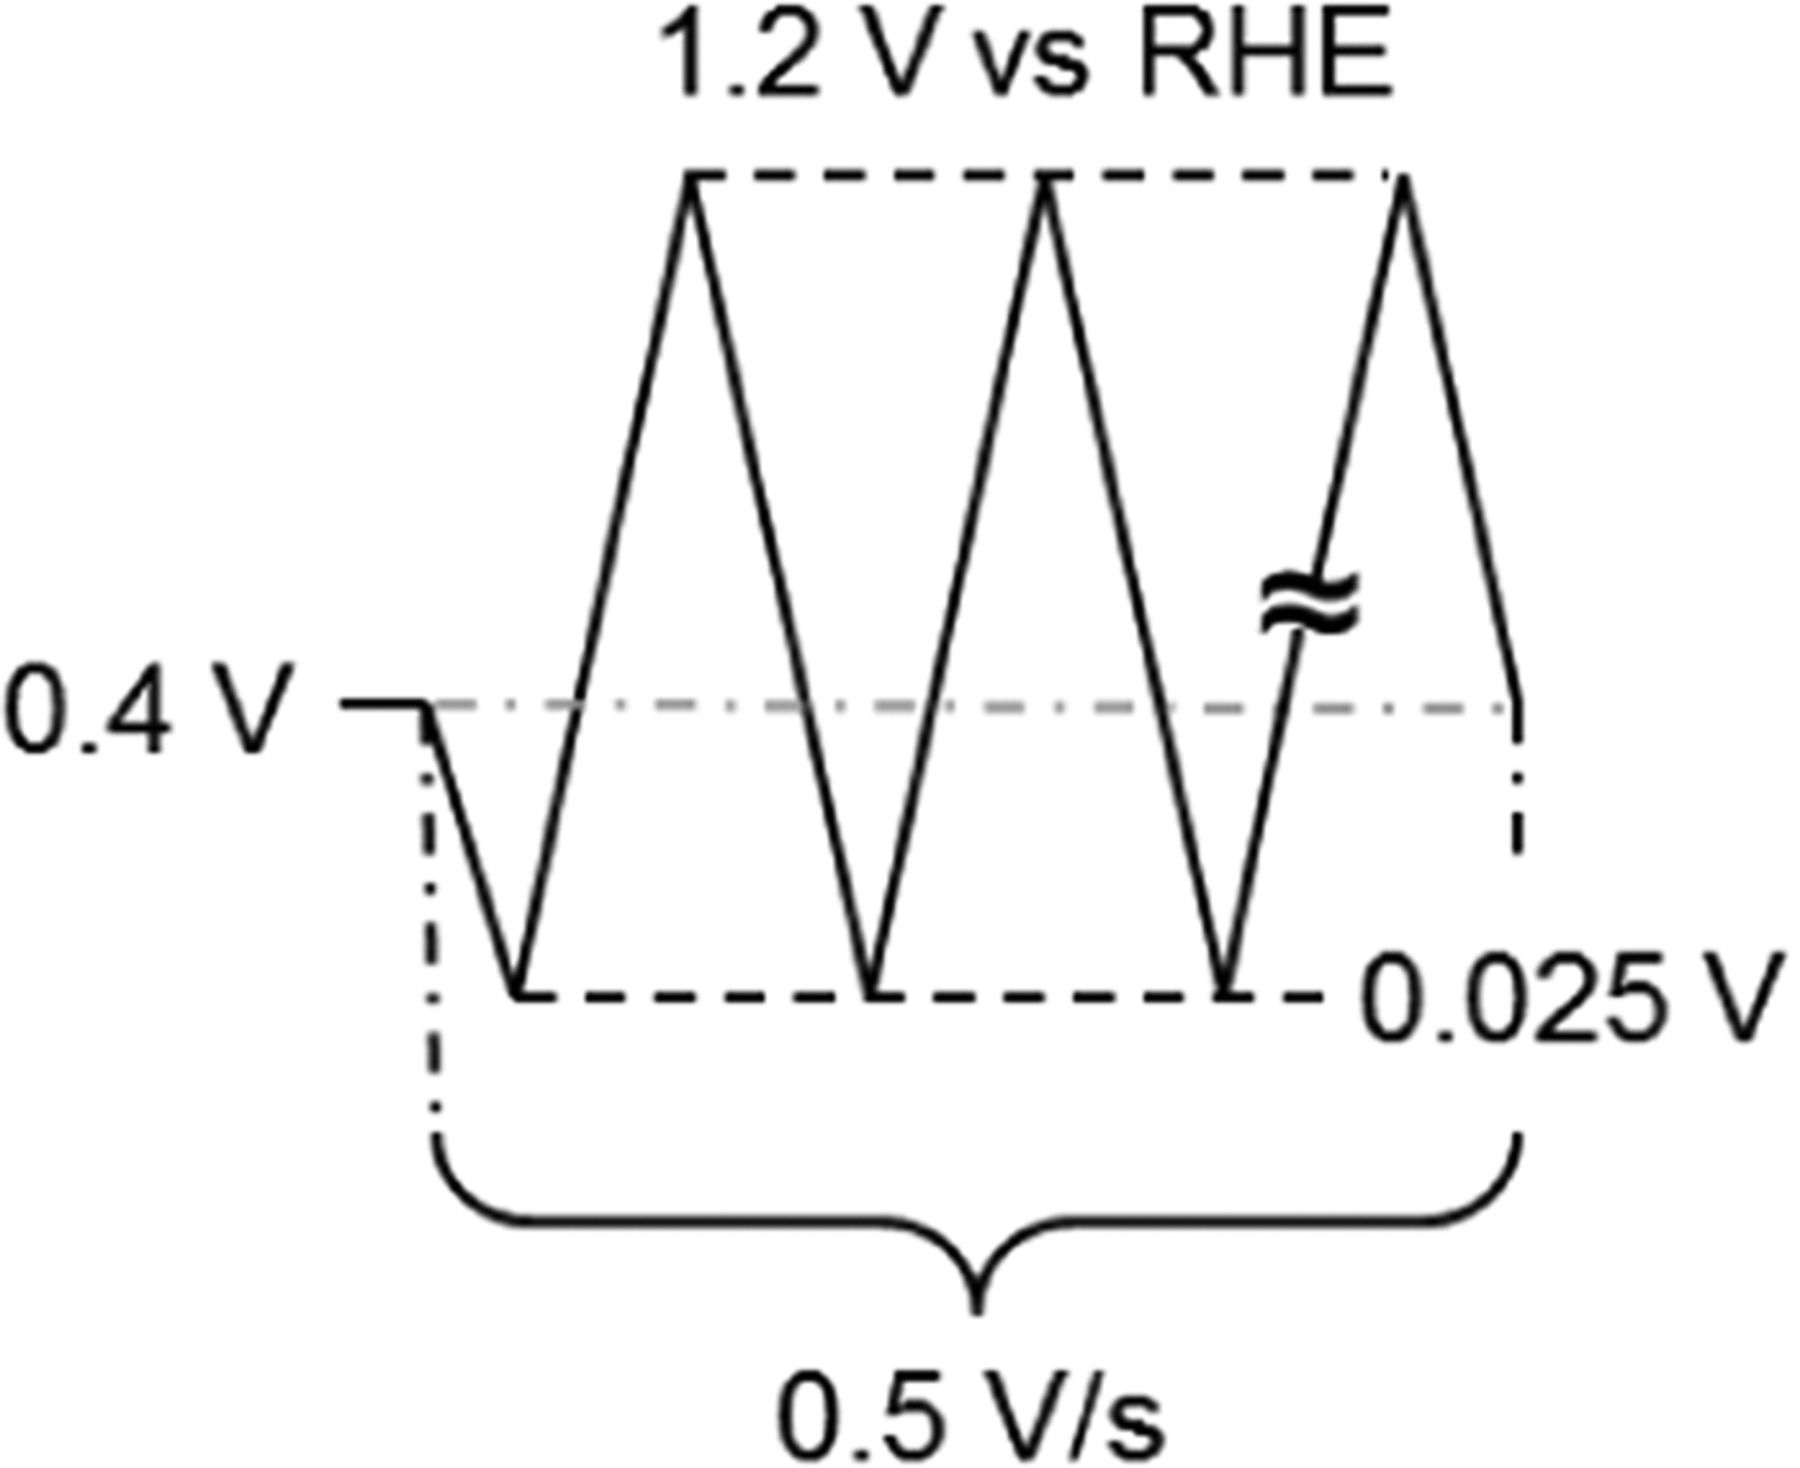 | Gas | N2 |
| Temperature (°C) | 23 | |
| Rotation Rate (rpm) | 1600–2500 | |
| Potential Range (V vs. RHE) | 0.025–1.2 | |
| Scan Rate (mV/s) | 500 | |
| Potential Cycle Number | 50–100 |
Table II. Schematic representation of the potential profile and detailed protocol for ECA measurement of Pt/C electrocatalysts in 0.1 M HClO4 at 100 kPa.
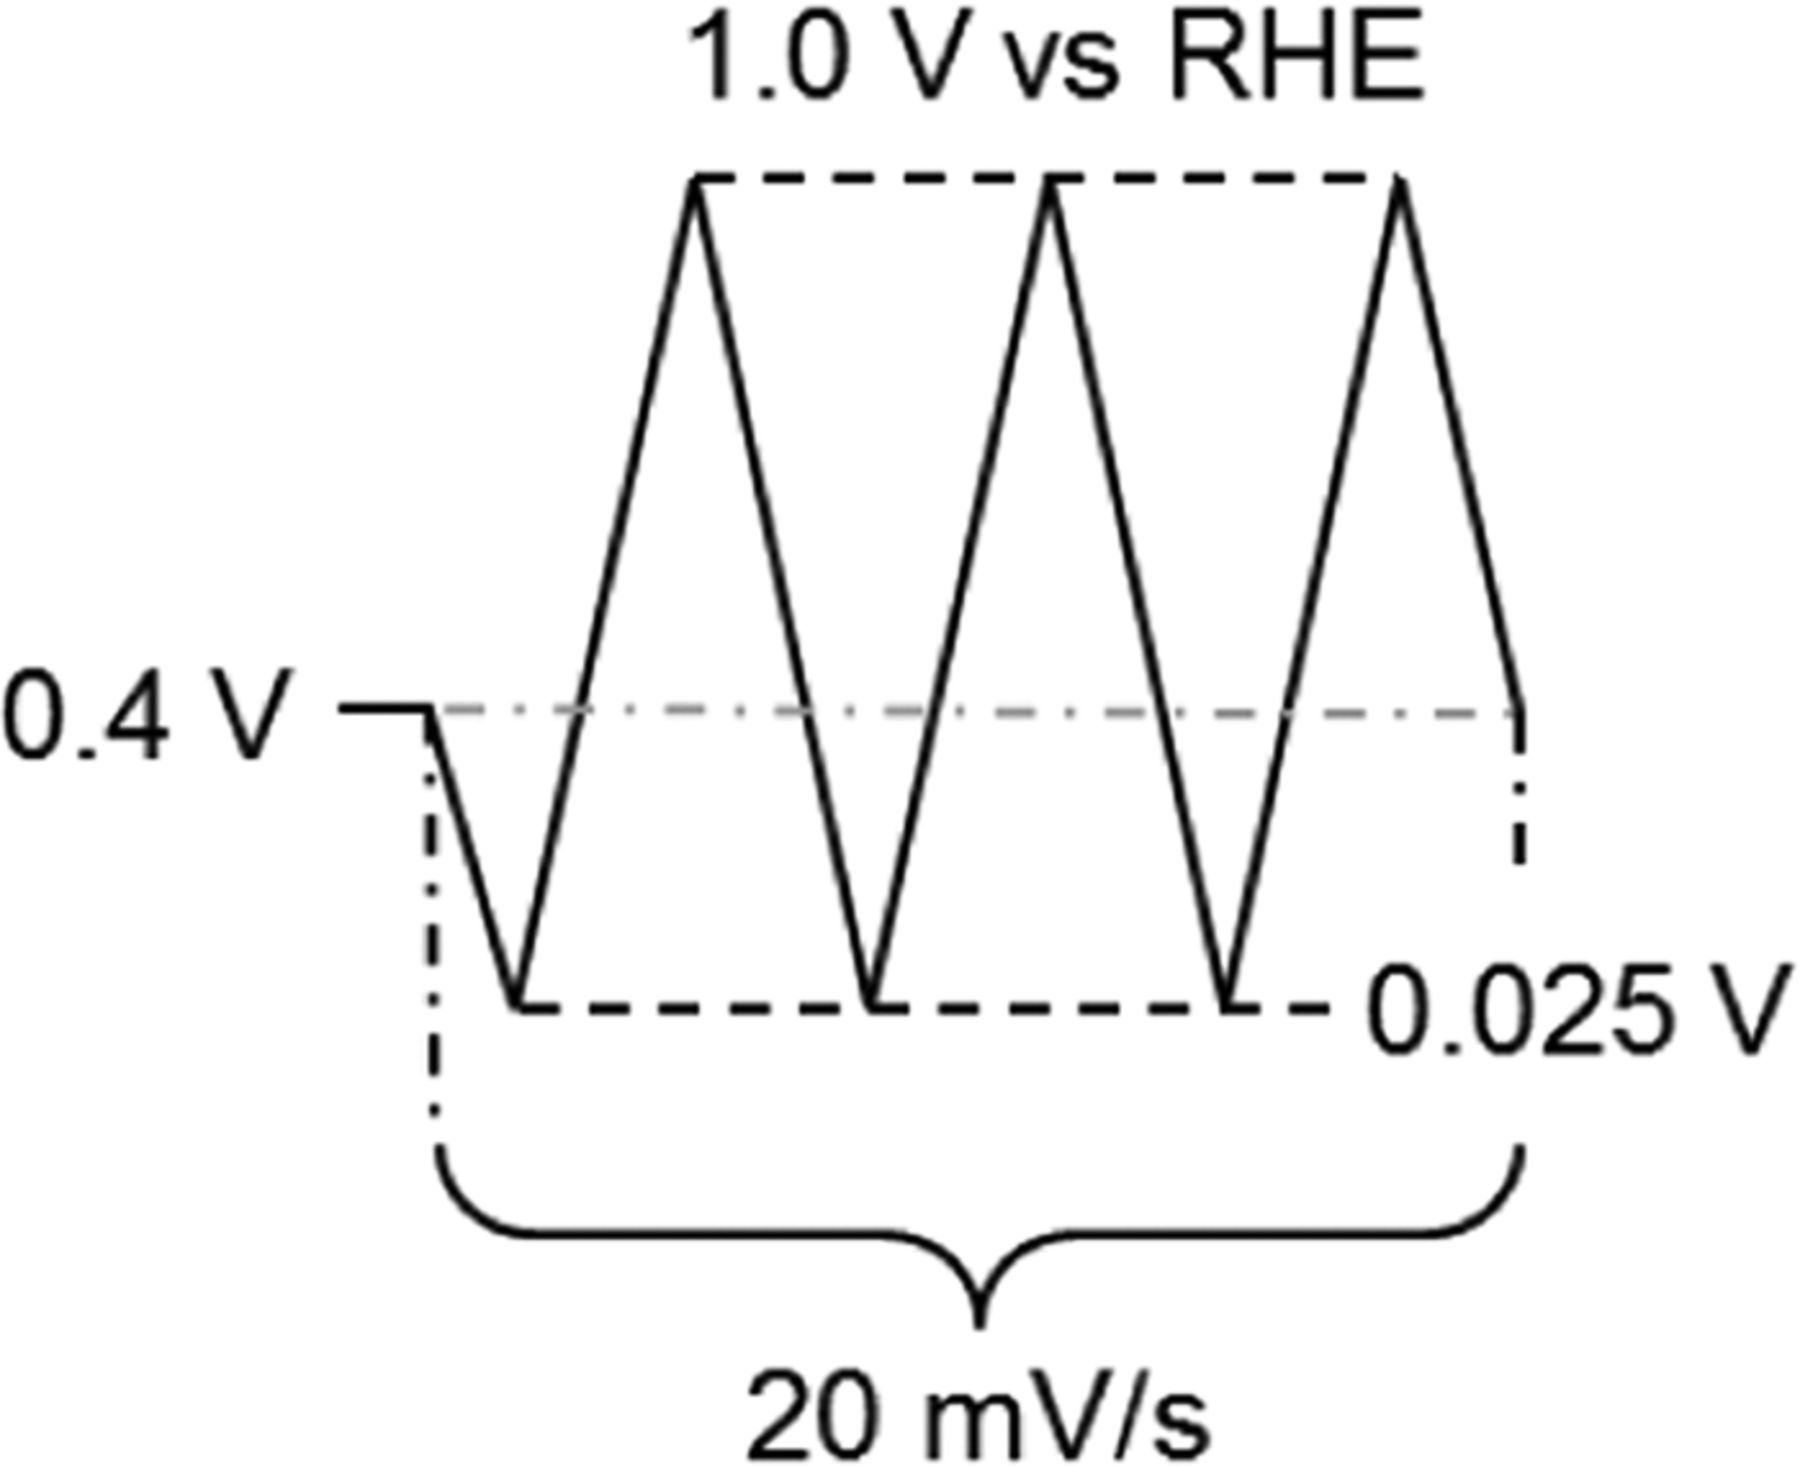 | Gas | N2 |
| Temperature (°C) | 23 | |
| Rotation Rate (rpm) | 0 | |
| Potential Range (V vs. RHE) | 0.025–1.0 | |
| Scan Rate (mV/s) | 20 | |
| Number of Cycles | 3 | |
| Scan Type | Linear (Analog) | |
| HUPD Charge Estimation | Adsorption (∼0.05–∼0.4 V) |
Table III. Schematic representation of the potential profile and protocol for ORR activity measurement of Pt/C electrocatalysts in 0.1 M HClO4 at 100 kPa.
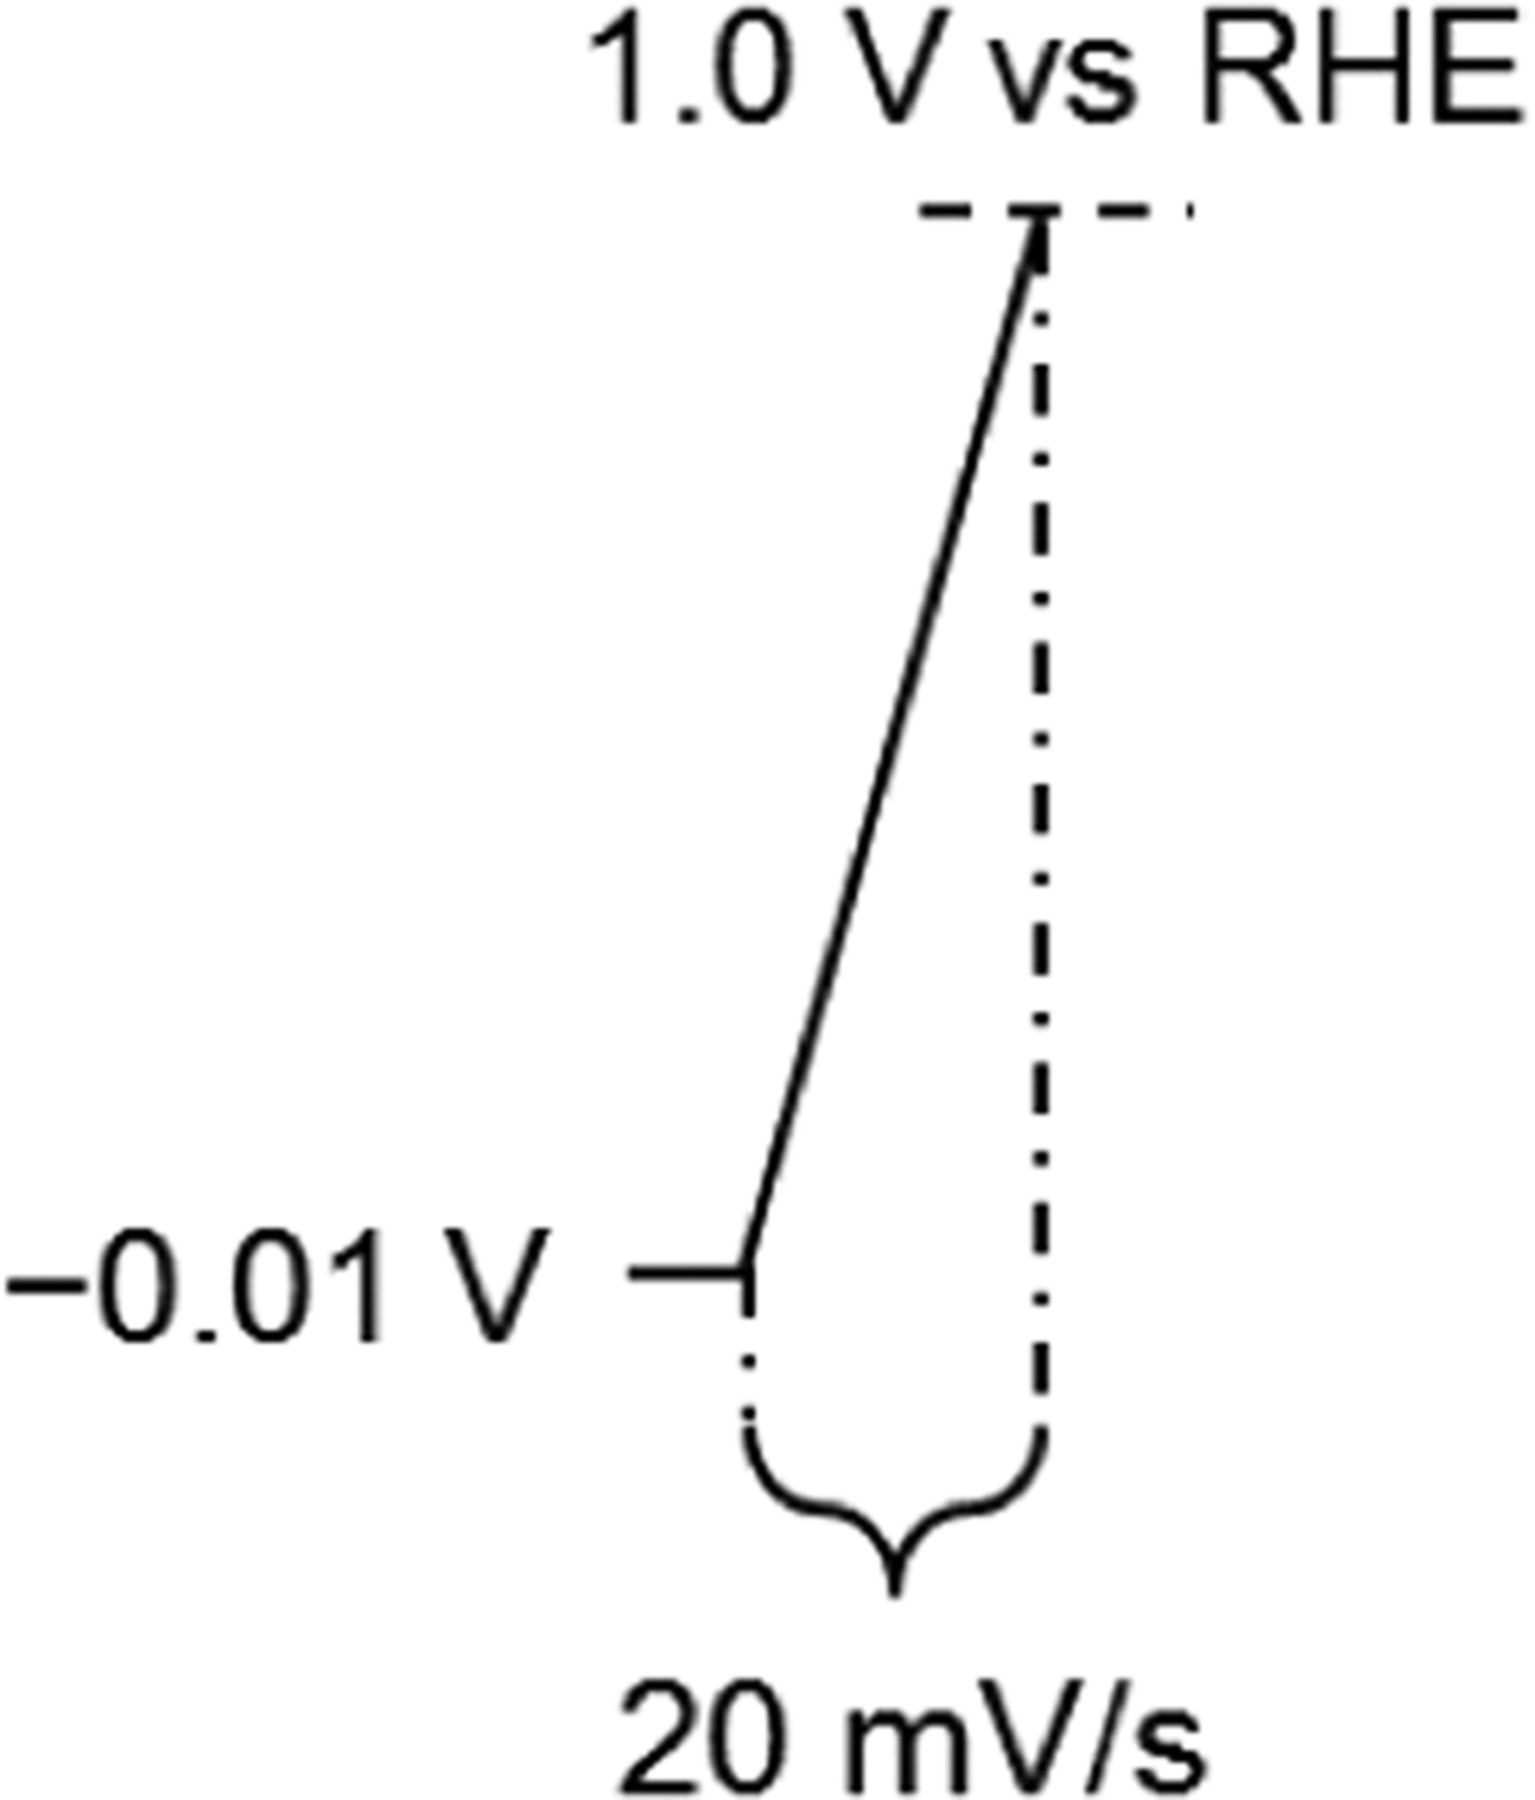 | Gas | N2 or O2 |
| Temperature (°C) | 23 | |
| Rotation Rate (rpm) | 1600 | |
| Potential Range (V vs. RHE) | −0.01 to 1.0 (Anodic) | |
| Scan Rate (mV/s) | 20 | |
| Rsoln Measurement Method | i-interrupter or EIS [high frequency resistance (HFR)] | |
| iRsoln Compensation | Positive Feedback | |
| Background Correction | iO2 – iN2 |
Electrochemical impedance spectra were acquired for RDE catalyst layers using a frequency response analyzer (FRA, AutoLab) at a constant potential (0.1–0.9 V) under N2 atmosphere (2500 rpm) or O2 atmosphere (1600 rpm) with a 5 mV amplitude voltage perturbation. The potential was initially set to 0.1 V for 5 sec and subsequently stepped to a desired potential (0.45 V unless stated otherwise) and held for 5 sec prior to measurement of the impedance spectrum. Impedance spectra (single sine measurement) were obtained in frequency range from 10 kHz to 0.1 Hz with a sampling rate of 5 or 10 points/decade. The spectra under N2 atmosphere were fitted with a transmission line model by using Z view software (Scribner) to obtain catalyst layer protonic resistance. In order to obtain spectra for a wider frequency regime that includes fast kinetics as well as slower diffusion processes that compete with adsorption processes, the multi sine measurement (15 waves) was conducted. The spectra were collected at constant DC current (0.51–3.57 mA/cm2) under O2 atmosphere (10 μA/cm2 amplitude, 0.1 Hz to 10 kHz, 1 point/decade, 1600 rpm). The catalyst was first reduced by setting the potential to –0.01 V for 3 sec; after switching to galvanostatic mode, the current was stepped to a desired value followed by acquisition of the spectrum under pseudo-steady state conditions.
Ink formulation/catalyst layer fabrication
Ink formulations discussed in the work may be classified into Nafion-based (N) and Nafion-free (NF) formulations. The accompanying film drying processes may be described as: stationary (S), rotational (R), air dry (AD) and IPA atmosphere dry (IPAD); drying was either carried out at 23 ± 2°C or in an oven at 40°C. The nomenclature for the different combinations of ink formulation and film drying can thus be represented by the following acronyms: i) Nafion-based Stationary Air Drying (N-SAD); ii) Nafion-free Stationary Air Drying (NF-SAD), iii) Nafion-based Rotational Air Drying (N-RAD), iv) Nafion-free Stationary IPA drying (NF-SIPAD). The quality of the catalyst layers on GC tips were monitored using an optical microscope as a standard practice (Fig. S2, SI). Both Pt/HSC and Pt/V catalysts were evaluated with the four catalyst layer fabrication techniques.
Nafion-based catalyst layers.—N-SAD, N-RAD techniques
An example of standard ink formulation for the preparation of a catalyst layer with a loading of 18 μg/cm2Pt pipetted onto the GC with a 10 μL aliquot is as follows. Catalyst inks were prepared by mixing 7.6 mg Pt/C catalyst powder with 7.6 mL DI water, 2.4 mL IPA, and 40 μL of 5 wt% Nafion solution.86,87 The sample bottles containing inks were placed in an ice bath and dispersed either using bath sonication (100 W, 20 min) or horn sonication (6 W, 30 s). For the N-SAD technique, the GC tip with the aliquot of ink was placed on a custom-built stainless steel holder and air dried at 40°C in an oven.86 For the N-RAD technique, the aliquot of ink was pipetted onto the GC tip mounted on an inverted rotator shaft (while gently spinning at 0–100 rpm); the rotator speed was gradually raised to 700 rpm and the ink allowed to dry over 15 min in air at 23 ± 2°C.68
Nafion-free catalyst layers.—NF-SAD technique
An example of standard ink formulation for the preparation of a catalyst layer with a loading of 18 μg/cm2Pt pipetted onto the GC with a 10 μL aliquot is as follows. For the NF-SAD technique, Pt/HSC catalyst inks were prepared by mixing 7.6 mg catalyst powder with 6.5 mL DI water, 3.5 mL IPA and 2.5 μL of 10 times diluted TRITON X-100.86 Pt/V catalyst inks were prepared by mixing 7.6 mg catalyst powder with 6.5 mL DI water and 3.5 mL IPA with no added surfactant. The sample bottle containing catalyst inks were placed in an ice bath to form a dispersion using horn sonication (6 W, 60 s). For the NF-SAD technique, the GC tip with the aliquot was placed on a custom-built stainless steel holder and air dried at 40°C in an oven.86 For the case of extremely low loadings of 4.5 μg/cm2Pt, a 2.5 μL aliquot was deposited to obtain thin uniform catalyst layers comparable to that obtained by applying the NF-SIPAD technique described below.
Nafion-free catalyst layers.—NF-SIPAD technique
An example of standard ink formulation for the preparation of a catalyst layer with a loading of 4.5 μg/cm2Pt pipetted onto the GC with a 5 μL aliquot is as follows. For NF-SIPAD technique, Pt/C catalyst inks were prepared by mixing 7.6 mg catalyst powder with 7.6 mL DI water, 2.4 mL IPA.87 The catalyst inks were placed in an ice bath to form a dispersion using horn sonication (6 W, 30 s). The aliquot of ink was subsequently pipetted onto the GC disk placed on a custom-built stainless steel holder and positioned in a beaker (400 mL) filled with 5 mL of IPA. The beaker was sealed with a polymer film that was perforated (Fig. S3, SI). The beaker with the electrodes and IPA were placed in an oven heated to 40°C to gradually (∼3 hours) dry the inks under IPA vapor (∼13 kPa) and form the catalyst layer.16,87 The NF-SIPAD technique resulted in the thinnest and most uniform films.
Results
Foundation for ink formulation/film fabrication
Before proceeding to discuss the details of the specific techniques that we have developed and modified recently, we describe the general understanding that we have gained in our work from refinements in ink formulation and dispersion. Both Pt/HSC and Pt/V were candidate catalysts for all of the techniques discussed in the present study. At the outset, we embarked on an evaluation of a large number of electrodes using inks incorporating only Pt/C and water to investigate if the typical constituents used (IPA, Nafion ionomer) were absolutely essential. Although we observed sporadic high values for the SA (0.9 V, 25°C, 100 kPa and 20 mV/s), we encountered great difficulty in obtaining reproducible results with a low spread (number of samples: n = 44, sample mean:  = 450 μA/cm2Pt, sample standard deviation: s = 130 μA/cm2Pt, relative standard deviation: RSD = 30%). We re-introduced IPA, (and Nafion for some techniques) progressively in an attempt to obtain narrower Gaussian distributions for ORR parameters. An IPA content of about 24% was found to result in optimally dispersed inks and confirmed the findings of Takahashi et al.51 and resulted in peak ECA values approaching 100 m2/gPt for Pt/HSC. Thereafter, we conducted a methodical study of the impact of ionomer (ionomer to carbon weight ratio: I/C 0–1.4) in the catalyst ink as shown in Fig. 1; based on the flattening of the response, an I/C ratio of 0.5 was selected for techniques where Nafion was incorporated. Nafion-free films required the development of new drying techniques and the introduction of a non-ionic surfactant viz., Triton X-100 that will be discussed in the section devoted to Nafion-free catalyst layers. A systematic study of the effect of Pt loading (LPt 4–80 μg/cm2Pt) (and hence thickness) was also performed, but since the results are specific to a particular film fabrication technique, they will be discussed later. One of the studies that we pursued was the influence of the type, intensity and duration of ultra-sonication of the catalyst inks. During sonication under ambient conditions, heat is generated and the temperature of catalyst ink rises noticeably resulting in lower (by ∼30%) ECA values. Placing the sample bottles completely in an ice-water bath during the sonication process was found to mitigate the thermally induced degradation of smaller Pt particles. Figure 2 depicts the change in ECA, SA and MA for measurements performed on films fabricated from inks that were sonicated with and without an ice-water bath. In cases where the more aggressive horn sonication was applied, raising sonication intensities resulted in increasingly deleterious effects observable as a loss in ECA and activity (Fig. 2) as previously reported by Pollet et al.91 Based on our observations, an ice bath was consistently employed for ink preparation; a bath sonication time of ∼20 min and/or a horn sonication intensity of ∼6 W for 30 s was typically used in our studies.
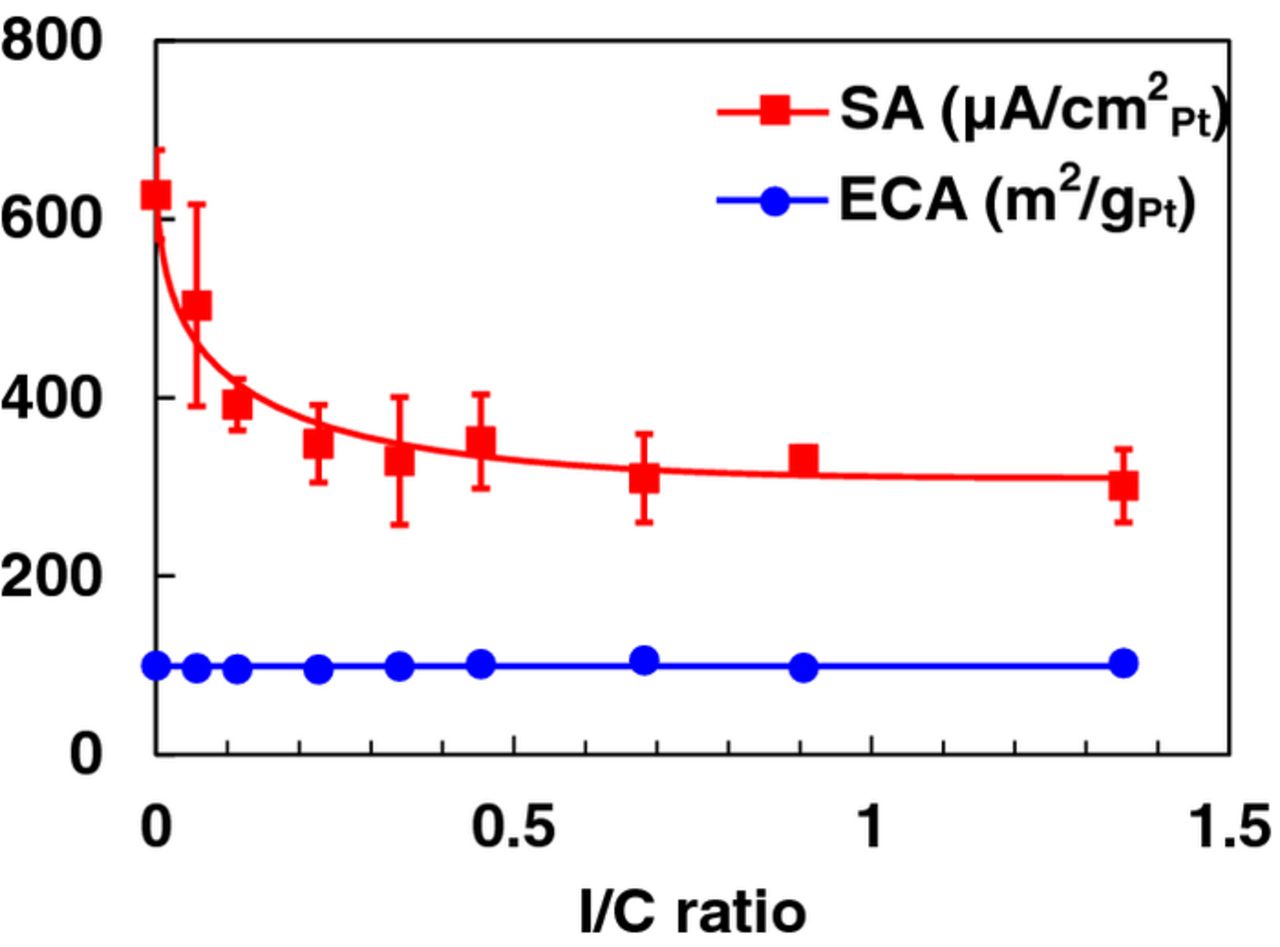
Figure 1. Influence of the I/C ratio on the ECA and SA at 0.9 V of Pt/HSC (18 μgPt/cm2). All measurements conducted in 0.1 M HClO4 at 20 mV/s.
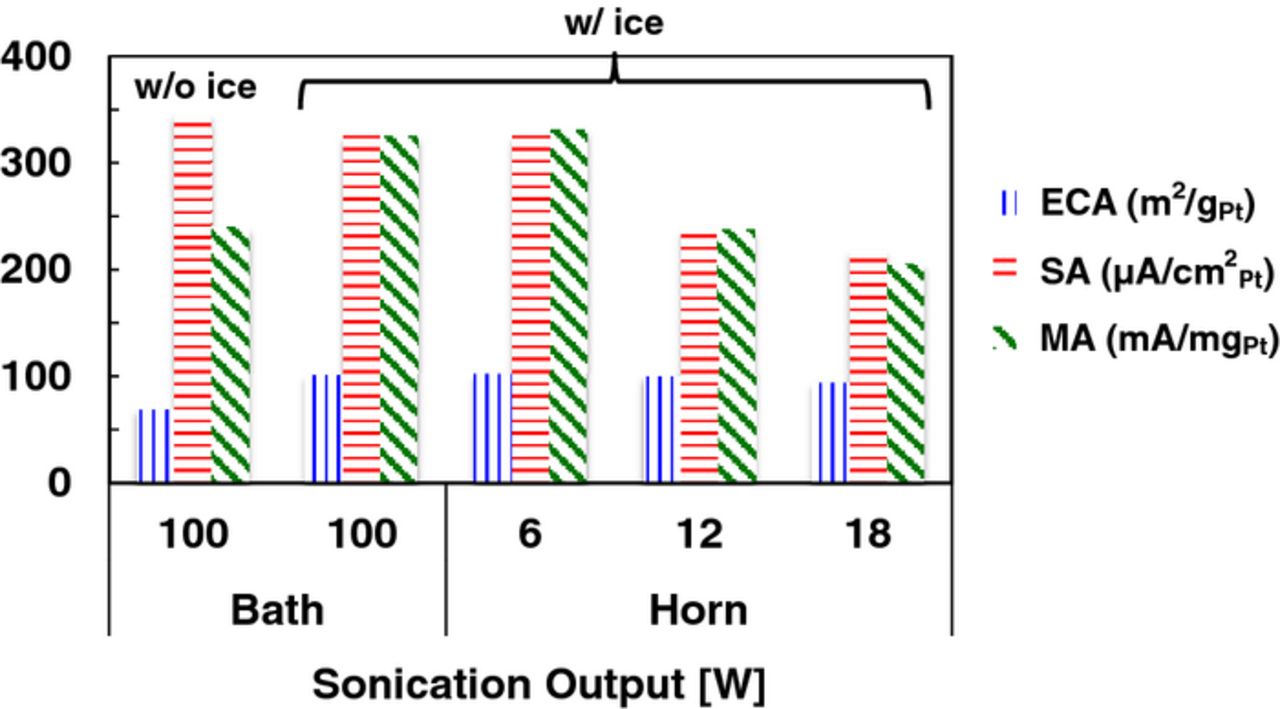
Figure 2. Impact of cooling of catalyst ink using an ice bath during sonication as well as sonicator type and sonication time on ECA, SA and MA of Pt/HSC fabricated using the N-SAD technique.
Nafion-based stationary air dry (N-SAD) technique
A series of ink formulations having varying formulation/aliquot volume/Pt loadings were systematically evaluated to arrive at an optimal ink formulation for the N-SAD technique expressible as Pt/C:water:IPA:Nafion = 7.6 mg:7.6 mL:2.4 mL:40 μL (10 μL aliquot, 18 μgPt/cm2). The aliquot of ink is pipetted onto the GC disk and the film dried in an oven at 40°C under air atmosphere. Major groups have reported using similar techniques in the literature and obtained fairly similar ORR activity results despite variations in the measurement protocol.17,48,51,68,85,86 Figure S4 (SI) illustrates SEM images for Pt/HSC that illustrates film non-uniformity/coffee ring and complemented with EDAX images that show elemental maps of Pt and F. Additionally, SEM images for Pt/HSC at low magnification of the entire electrode (a), central region (b), and peripheral region (c) for each of the techniques are depicted in Fig. S5 (SI). Figure 3 depicts Gaussian distributions for the SA of Pt/HSC and Pt/V films prepared using the standard ink formulation for N-SAD technique and measured using the protocol established in Part I.88 For all histograms presented in this work, the bar widths were determined based on chi-squared tests for 95% confidence interval. Magnitudes of ECA, SA and MA can be found in Tables IV and V.
Table IV. Comparison of the ECA, SA and MA at 0.9 V vs. RHE in 0.1 M HClO4, 100 kPa O2, for 46 wt% Pt/HSC (TKK) catalyst layers fabricated in-house (N-SAD, N-RAD, NF-SAD, NF-SIPAD) with literature.
| LPt (μgPt/cm2) | I/C | Drying condition | # of samples | ECA (m2/gPt) | T (°C) | Scan rate (mV/s) | Potential range (V) | Corrections | SA (μA/cm2Pt) | MA (mA/mgPt) | Ref. |
|---|---|---|---|---|---|---|---|---|---|---|---|
| 18 | 0.5 (mixed) | Stationary, air | 28 | 98 ± 6 | 23 | 20 | −0.01→1.0 | iRsoln, b.g. | 311 ± 37 | 303 ± 33 | This work |
| 12.7 | 0.3−0.8 (mixed) | Stationary, air | 2 | 80 | 60 | 20 | 0→1.0 | b.g. | 305a | 242a | 85 |
| 17.3 | 0.5 (mixed) | Stationary, air | 10 | 91 | 25 | 10 | 0.2→1.2 | b.g. | 292 | 266 | 51 |
| 11.7 | 0.65 (mixed) | Stationary, air | ― | 79 | 30 | 20 | 0.06 (30s)→1 | b.g. | 360 ± 70b | 280b | 17 |
| 9.9 | 0.96 (cap) | Stationary, air | 3 | 96 | 25 | 10 | 0.1→1.1 | iRsoln, b.g. | 360 ± 20 | 340 ± 20 | 95 |
| 14 | 1.4 (cap) | Stationary, EtOH | ― | 71 | 25 | 10 | 0.05→1.2 | none | 310c | 220c | 96 |
| 18 | 0.5 (mixed) | Rotational, air | 49 | 99 ± 5 | 23 | 20 | −0.01→1.0 | iRsoln, b.g. | 485 ± 50 | 477 ± 42 | This work |
| 20 | 0.9 (added to ink droplet) | Rotational (w/ EG) →vaccum | ― | 84 | 25 | 25 | 0.05→1.1 | iRsoln, b.g. | 602 ± 75 | 507 ± 77 | 84 |
| 3.91 | 1.9 (mixed) | Stationary (3 nL/droplet), air | ― | 79 | 30 | 20 | 0.06 (30s)→1 | b.g. | 570 ± 30b | 450b | 17 |
| 18 | 0 | Stationary, air | 34 | 98 ± 5 | 23 | 20 | −0.01→1.0 | iRsoln, b.g. | 597 ± 45 | 586 ± 52 | This work |
| 4.5 | 0 | Stationary, IPA | 44 | 101 ± 7 | 23 | 20 | −0.01→1.0 | iRsoln, b.g. | 864 ± 56 | 870 ± 91 | This work |
| 14 | 0 | Stationary, N2 stream | > 8 | 74 | r.t. | 50 | 0.05→1.1 | iRsoln, b.g. | 490 | 374 | 47 |
| 6.4−7.4 | 0 | Stationary, air | > 4 | 79 | 25 | 10 | 0.03→1.1 | b.g. | 355 ± 12 (560d) | 280 ± 10 (460d) | 97 |
a 1.15 times correction was applied for background subtraction based on the statement in the manuscript.85 b SA was extracted from Fig. 10 in Ke et al.17 and 1.12 times correction was applied to covert the extracted SA at 10 mV/s to that at 20 mV/s based on the statement in the manuscript. MA was calculated from the SA and ECA. c SA and MA were extracted from Fig. 6 in the manuscript.96 d SA when iRsoln correction is applied assuming the correction factor (1.57) reported for the same catalyst and measurement protocol in Kim et al.95 by the same group.EtOH: ethanol. EG: ethylene glycol. cap: Nafion is deposited after drying catalyst on GCs. mixed: Nafion is incorporated in catalyst ink and sonicated. added to ink droplet: Nafion solution is added to an aliquot of catalyst ink on GCs. b.g.: background current subtraction, iRsoln: iRsoln correction.
Table V. Comparison of the ECA, SA and MA at 0.9 V vs. RHE in 0.1 M HClO4, 100 kPa O2, for 46 wt% Pt/Vulcan (TKK) catalyst layers fabricated in-home (N-SAD, N-RAD, NF-SAD, NF-SIPAD) with literature.
| Manufacturer | Pt wt% | LPt (μgPt/cm2) | I/C | drying condition | # of samples | ECA (m2/gPt) | T (°C) | Scan rate (mV/s) | Potential range (V) | SA (μA/cm2Pt) | MA (mA/mgPt) | Ref. |
|---|---|---|---|---|---|---|---|---|---|---|---|---|
| TKK | 46.4 | 18 | 0.5 | Stationary, air | 42 | 66 ± 4 | 23 | 20 | −0.01→1.0 | 548 ± 86 | 363 ± 63 | This work |
| TKK | 46.4 | 18 | 0.5 | Rotational, air | 29 | 72 ± 3 | 23 | 20 | −0.01→1.0 | 670 ± 25 | 482 ± 24 | This work |
| TKK | 46.4 | 18 | 0 | Stationary, air | 20 | 63 ± 4 | 23 | 20 | −0.01→1.0 | 1050 ± 120 | 661 ± 78 | This work |
| TKK | 46.4 | 4.5 | 0 | Stationary, IPA | 20 | 63 ± 3 | 23 | 20 | −0.01→1.0 | 1120 ± 70 | 706 ± 42 | This work |
| E-TEK | 19.7 | 20 | 0.5 | Rotational, air | 7 | 63 ± 2 | 30 | 20 | 0.05→1.03 | 746 ± 26 | 470 ± 27 | 69 |
| JM | 40 | 20 | 0.5 | Rotational, air | 5 | 49 ± 1 | 30 | 20 | 0.05→1.03 | 725 ± 26 | 359 ± 14 | 68 |
| JM | 40 | 20 | 0.5 | Rotational, air | 5 | 48 ± 2 | 30 | 20 | 0.05→1.03 | 696 ± 27 | 332 ± 26 | 68 |
| IP | 46.6 | 20 | 0.5 | Rotational, air | 5 | 80 ± 1 | 30 | 20 | 0.05→1.03 | 527 ± 35 | 414 ± 27 | 68 |
| IP | 46.6 | 20 | 0.5 | Rotational, air | 5 | 83 ± 2 | 30 | 20 | 0.05→1.03 | 460 ± 34 | 386 ± 27 | 68 |
JM: Johnson Matthey, IP: Ion Power. All data are corrected for background current and iRsoln. Nafion ionomer is mixed in ink dispersion and sonicated for the samples with I/C 0.5.
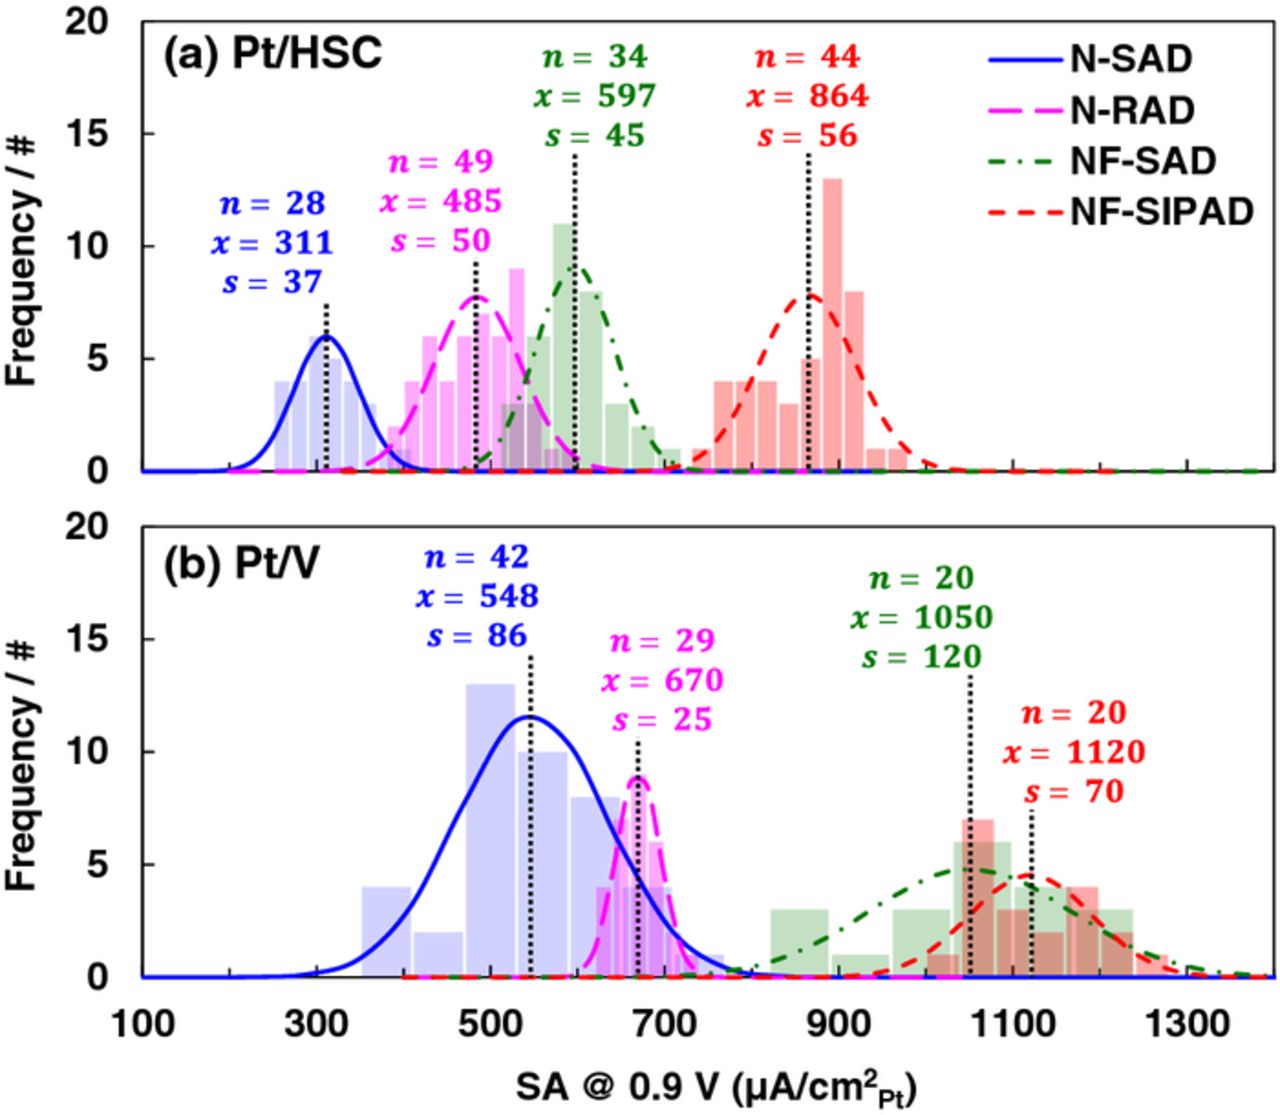
Figure 3. Gaussian distributions for the SA of (a) Pt/HSC and (b) Pt/V catalyst layers fabricated using N-SAD, N-RAD, NF-SAD, NF-SIPAD techniques. Number of independent samples 'n', mean ' ' and standard deviation 's' for each of the distributions are as labeled. ORR activity measured in 0.1 M HClO4 under the following conditions: 1600 rpm, 20 mV/s, −0.01 to 1.0 V, anodic sweep.
Nafion-based rotational air dry (N-RAD) technique
In order to suppress the coffee ring effect dominant in stationary drying methods, we applied a rotational drying technique originally introduced by Garsany et al.70 A series of ink formulations having varying formulation/aliquot volume/Pt loadings were systematically evaluated to arrive at an optimal ink formulation for the N-RAD technique expressible as Pt/C:water:IPA:Nafion = 7.6 mg:7.6 mL:2.4 mL:40 μL (10 μL aliquot, 18 μgPt/cm2). The aliquot of ink is deposited on an inverted rotator shaft and dried in air at 23°C for 15 min. Based on a trial and error approach, we found rotation speeds in the range 500–800 rpm were ideal to obtain the best quality films. Figure 3 shows Gaussian distributions for the specific activity for Pt/HSC and Pt/V films prepared using the standard ink formulation for N-RAD technique measured using the protocol established in Part I.88 The N-RAD technique produces films with higher uniformity than N-SAD technique in the central region although a narrower coffee ring is still observed; it is also the most conducive technique for fabricating films with higher loadings/thicknesses (Fig S5, SI). Magnitudes of ECA, SA and MA can be found in Tables IV and V.
Nafion-free catalyst layers
Our first attempt to alter the ink composition involved the elimination of Nafion ionomer mixed in the ink. Ionomer incorporation in the catalyst ink was hitherto thought to provide functions of a binder and enhance dispersion; however, a binder was not essential for adhesion of the catalyst to the GC. Low loaded ionomer free catalyst (≤∼18 μgPt/cm2) was found to adhere with sufficient strength so that no flaking or loss of catalyst occurred during measurements for ORR activity evaluation at room temperature. In fact, the catalyst layer exhibits as high initial ECA as that of Nafion-based catalyst layers coupled with a lower ECA loss than that of Nafion-based catalyst layers after a potential cycling durability tests under N2 atmosphere (30,000 cycles at 23°C, 0.60–1.0 V, 500 mV/s, triangular wave, 0 rpm). Higher loadings or thicker non-uniform films flake off more easily. Although binding of catalyst to GC was not an issue with the loading (≤∼18 μgPt/cm2), for Pt/HSC, the quality of the dispersion was severely diminished with the absence of ionomer. After substantial experimentation, harsher horn-sonication was introduced and a non-ionic surfactant, Triton X-100 was added to obtain well-dispersed inks and uniform films on the GC. An adverse effect of the surfactant was that the films tended to wash off when immersed in the electrolyte and rotated during experiments. A systematic and significant dilution of surfactant led to an optimum (x10 dilution of Triton X-100 with water, 2.5 μL in 10 mL ink) where a good dispersion and well-adhered films were simultaneously achieved.
Nafion-free stationary air dry (NF-SAD) technique
A series of ink formulations having varying formulation/aliquot volume/Pt loadings were systematically evaluated to arrive at an optimal ink formulation for the NF-SAD technique expressible as Pt/C:water:IPA:surfactant = 7.6 mg:6.5 mL:3.5 mL:2.5 μL (10 μL aliquot, 18 μgPt/cm2). The aliquot of ink is pipetted onto the GC disk and the film dried in an oven at 40°C under air atmosphere. The film quality and uniformity using the NF-SAD technique can be seen in the SEMs (Fig. S5, SI). The NF-SAD technique, despite the presence of a coffee ring, resulted in higher ORR SA by a factor of 1.9 compared to N-SAD films. The ECA, however, stayed invariant at ∼100 m2/gPt. Figure 3 shows Gaussian distributions for the SA for Pt/HSC and Pt/V films prepared using the standard formulation for NF-SAD technique measured using the protocol established in Part I.88 Unfortunately, for Pt/V, the introduction of surfactant produced a deleterious effect comparable to that produced by ionomer and activity improvement was not observable. As a result, we reformulated the inks and eliminated the surfactant for Pt/V. The resulting surfactant and Nafion-free Pt/V inks produced films with higher SA (x1.9) compared to that of N-SAD Pt/V. Magnitudes of ECA, SA and MA can be found in Tables IV and V.
Nafion-free stationary IPA dry (NF-SIPAD) technique
Lastly, in our attempt to obtain the highest measurable activity, we refined and developed two stationary techniques that both produced thin films with greatly improved uniformity. A series of ink formulations having varying formulation/aliquot volume/Pt loadings were systematically evaluated to arrive at an optimal ink formulation for the NF-SIPAD technique expressible as Pt/C:water:IPA = 3.8 mg:7.6 mL:2.4 mL (5 μL aliquot, 4.5 μgPt/cm2). The aliquot of ink is pipetted onto the GC disk and the film dried in an oven at 40°C under IPA atmosphere.16,87 Films prepared using the NF-SIPAD technique (Pt/HSC and Pt/V) are extremely thin and uniform in the central region with almost no coffee ring as observed in the SEM images (Fig. S5, SI). Pt/V (carbon black, ∼240 m2/g) inks, in general, form more uniformly distributed films than Pt/HSC (carbon black, 800 m2/g) most likely due to their lower carbon black surface area. High quality SIPAD films are more difficult to obtain consistently since the elevated proportion of IPA in the ink results in a decreased surface tension which in turn causes the ink to spill outside the GC and re-deposit on the PTFE. Such samples that had incomplete coverage with catalyst after drying were rejected based on visual inspection. An alternative technique that we employed in some cases is essentially a low loading variation of surfactant-based NF-SAD technique. A series of ink formulations having varying formulation/aliquot volume/Pt loadings was evaluated to arrive at a standard for the second technique that can be expressed as Pt/C:water:IPA:10x-diluted-surfactant = 7.6 mg:7.6 mL:2.4 mL:2.5 μL (2.5 μL aliquot, 4.5 μgPt/cm2). The aliquot of ink is pipetted onto the GC disk and the film dried in an oven at 40°C under air atmosphere. Figure 3 shows Gaussian distributions for the SA for Pt/HSC and Pt/V films prepared using the standard ink formulation for NF-SIPAD technique measured using the protocol established in Part I.88 Magnitudes of ECA, SA and MA can be found in Tables IV and V.
Consolidated magnitudes of ECA, SA, MA and ilim
Regardless of the film fabrication technique and inclusion of ionomer, the magnitude of the ECA for catalyst layers remained remarkably unchanged within measurement error. Sources of error introduced in ECA measurements originate from weight measurements of catalyst, evaporation of IPA from the ink during horn sonication, pipetting accuracy, dissolution/detachment of extremely small Pt nanoparticles during sonication, as well as those associated with the selection of the inflection point in HUPD integration. A combined Gaussian distribution for samples evaluated using all techniques as well as sub-distributions for each technique are presented in Fig. 4. The combined average ECA for Pt/HSC for 155 samples fabricated using standard N-SAD, NF-SAD, N-RAD and NF-SIPAD techniques was 99 ± 6 m2/gPt, while corresponding values for Pt/V for 111 samples was 67 ± 5 m2/gPt. All ECA values in Fig. 4 are based on HUPD integration, however, we conducted CO stripping measurements on a limited number of samples to corroborate magnitude of the ECA and found the CO stripping charge was ∼1.9–2.0 times the corresponding HUPD charge as expected.92 A notable corollary of the observed technique-independent ECA is that changes in measured MA (due to film quality) are solely the outcome of a concomitant change in measured SA.
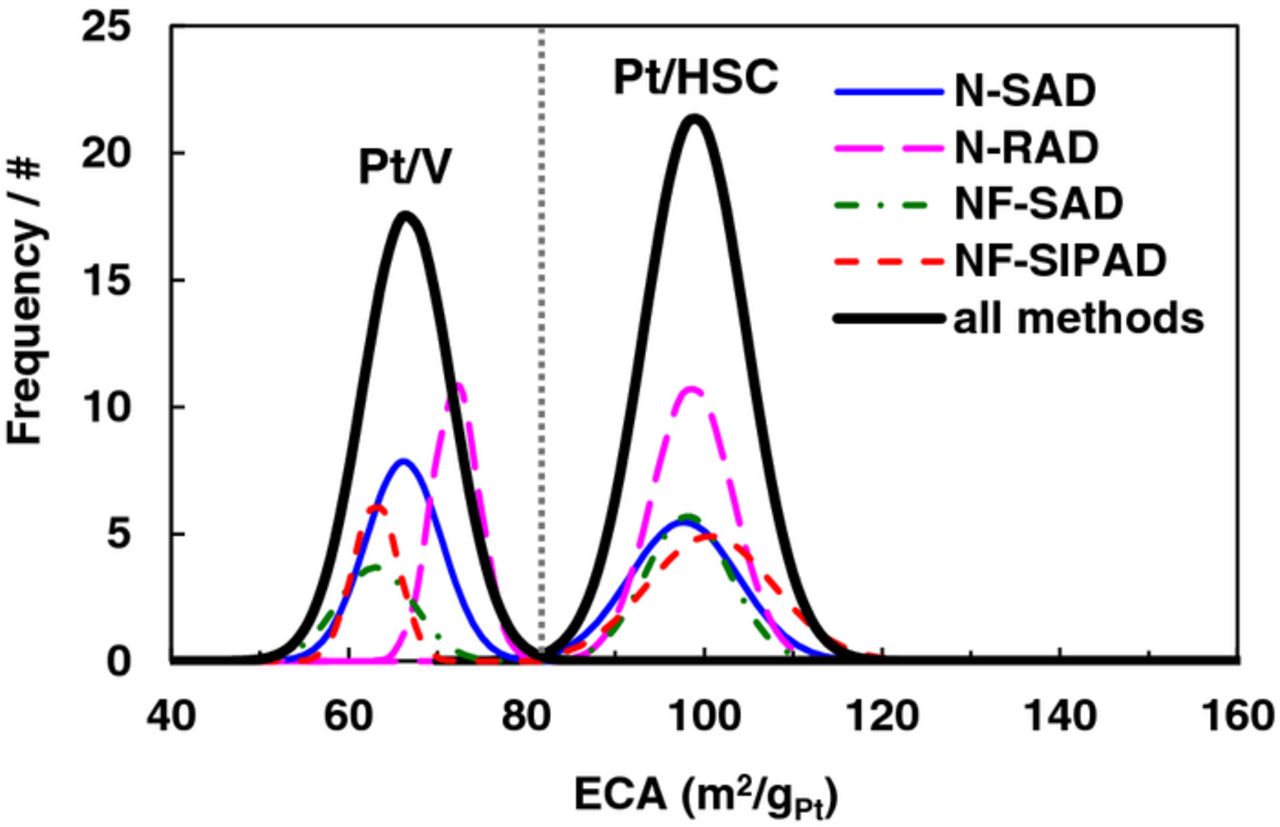
Figure 4. Gaussian distributions for the ECA of Pt/HSC and Pt/V catalyst layers on GC fabricated using N-SAD, NF-SAD, N-RAD and NF-SIPAD techniques. Gaussians representing the combined data (n = 155 for Pt/HSC and n = 111 for Pt/V) depicted by solid lines.
Figure 5 concisely consolidates the ECA, SA, MA and ilim for Pt/HSC and Pt/V catalysts evaluated using different fabrication techniques and indisputably substantiates the enhancement in measured MA for uniform, thin films with a high degree of reproducibility. The measured SA for electrodes prepared by the NF-SIPAD techniques is 2.8 times higher for Pt/HSC and 2.0 times higher for Pt/V than the conventional stationary drying, N-SAD, technique commonly reported in the literature. The O2 diffusion limiting currents in RDE studies are recognized to be function of the rotation speed and the geometric area (poly-Pt) or coverage and distribution of catalyst over the geometric area (Pt/C). Additionally, a discrete Nafion film >0.2 μm (for an O2 diffusion boundary layer in the electrolyte δd ∼15 μm, 1600 rpm) present over the catalyst layer introduces an O2 diffusion resistance proportional to 1/if to attenuate the limiting current.15,16 The limiting currents for Pt/HSC and Pt/V catalyst layers show no discernible trend (Pt/HSC: 5.8 ± 0.2 mA/cm2, n = 155; Pt/V: 5.9 ± 0.1 mA/cm2, n = 111) or dependence on fabrication technique within the limits of error. The limiting currents for Pt/HSC and Pt/V are comparable to that for a poly-Pt (6.06 ± 0.02 mA/cm2, n = 30) as well as a calculated values at 1600 rpm (5.99 mA/cm2) using kinematic viscosity (1.009×10⁻² cm2/s93), solubility (1.26 mol/dm393) and diffusivity (1.90 × 10⁻⁵ cm2/s94). Lastly, we have tabulated ORR activity results (Table IV and V) from this work and pertinent literature17,47,51,68,69,84,85,95–97 exhaustively detailing test conditions and film fabrication techniques where possible.
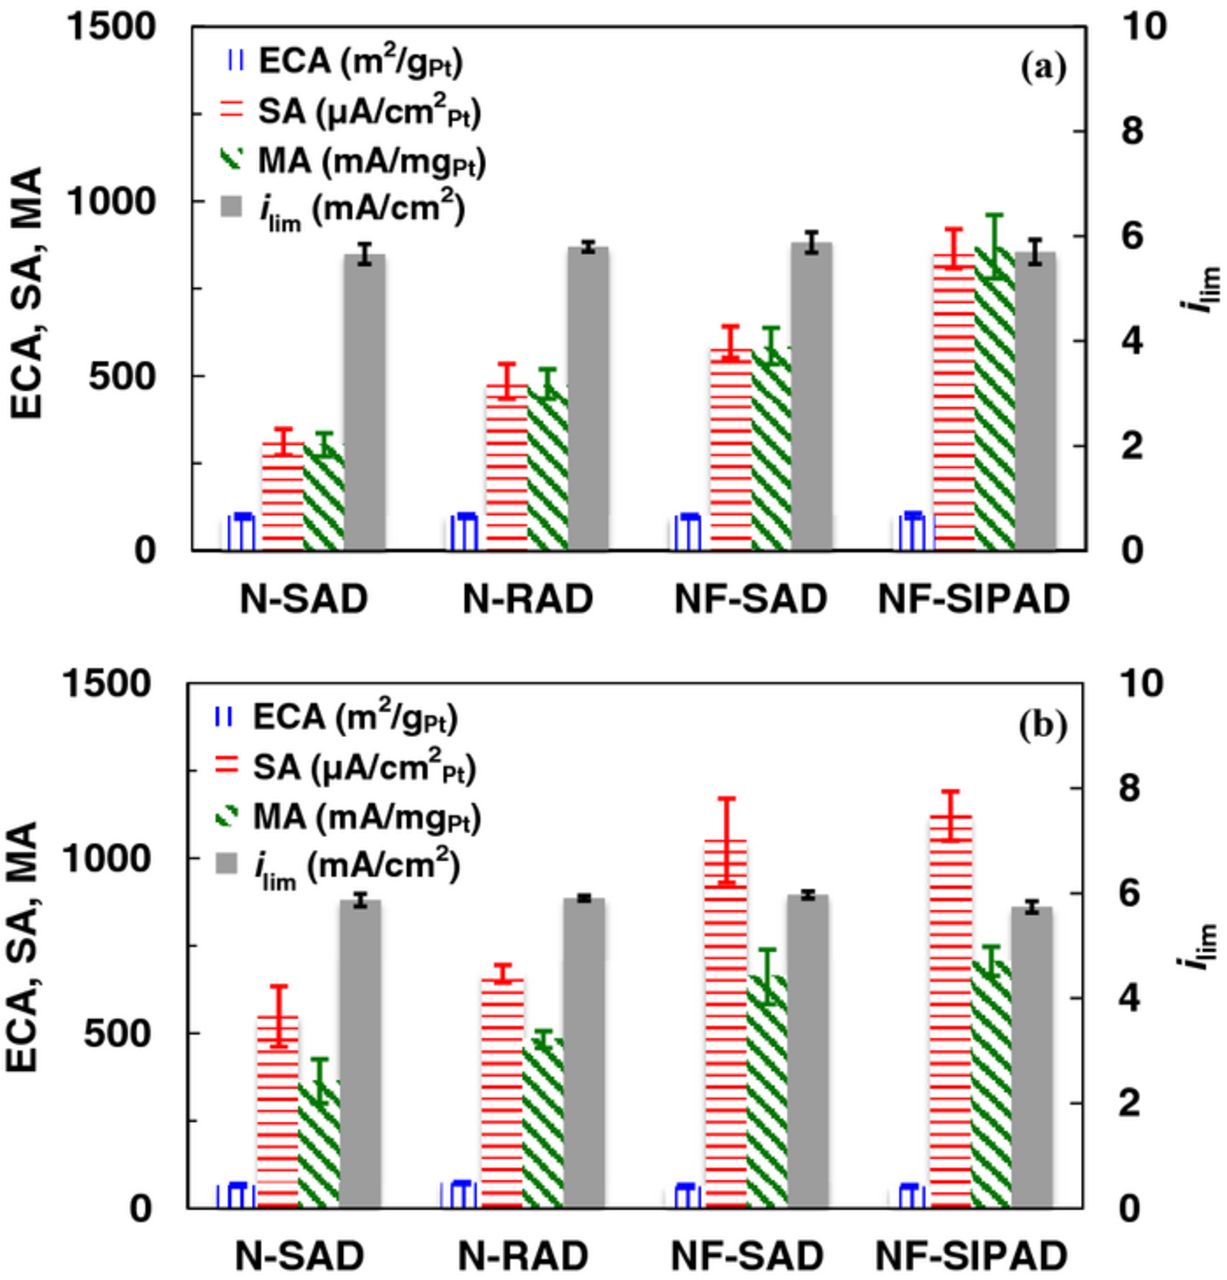
Figure 5. ECA, SA and MA at 0.9 V in 0.1 M HClO4 for (a) Pt/HSC, and (b) Pt/V catalyst layers fabricated using N-SAD, NF-SAD, N-RAD and NF-SIPAD techniques for 20–49 independent samples.
Effect of I/C ratio and loading
We conducted RDE experiments using inks having various I/C ratios in the range 0–30; a precipitous loss in the ECA was observed (not shown) only at excessive I/C ratios ∼30, with 80% loss for N-SAD and 60% loss for N-RAD techniques; no noticeable losses were observable at lower ionomer contents within experimental error. Using exclusively the N-RAD technique that is suitable for fabricating films over a wide range of thickness, we conducted an extensive study of the loading/thickness (Fig. 6) to identify the sources of the losses within the catalyst layer. The limiting current and ECA are fairly constant over the range of catalyst loadings (4.5–144 μgPt/cm2) albeit a small drop in limiting current noticeable at very low loadings is ascribable to incomplete coverage of the GC with catalyst. The SA stays relatively flat until a loading of 50 μgPt/cm2 is reached, at which point a downward trend emerges.
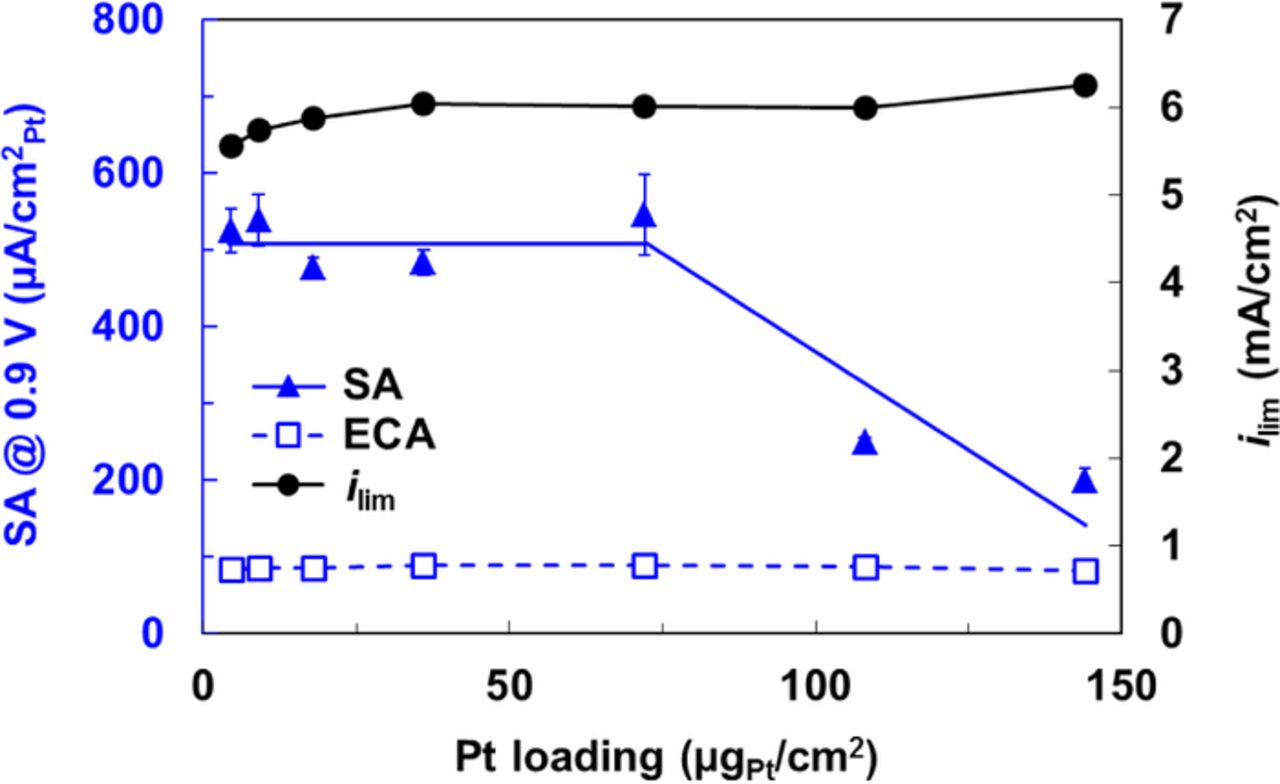
Figure 6. Dependence of the ECA, SA at 0.9 V, ilim on Pt loading. All ORR measurements conducted in 0.1 M HClO4 for Pt/HSC catalyst films (N-RAD technique).
Electrochemical impedance spectroscopy (EIS)
A majority of researchers have applied EIS to bulk smooth metal surfaces and TF-RDEs with the primary goal of understanding fundamental ORR kinetic parameters and the double layer capacitance.44,50,83,98–106 Attempts to study kinetics have generally been hampered by difficulties in de-convoluting overlapping time constants of kinetics from O2 diffusion. Two notable studies on EIS applied to Pt/C catalyst layers in RDE setups include the work of Easton et al.107 focused on H+ resistance within the RDE catalyst layer for relatively high loadings while the work of Perez et al.44 coupled experiments with modeling in an attempt to separate kinetics from O2 diffusion.
We have applied EIS to obtain the Rsoln, electronic resistance ( ), protonic resistance (
 ) and ionomer distribution within the catalyst layer, and double layer capacitance (Cdl) using an uniform RC 'transmission line' model with additional parallel complex impedance elements to simulate kinetics and mass transport faradaic processes (under O2, air), when necessary, as shown in Fig. 7.108,109 However, significant contribution from bulk diffusion persists even at 0.9 V making it extremely difficult to separate kinetics from O2 diffusion as discussed later. Thus, our results on EIS are restricted primarily to inert atmospheres as we encounter overlapping time constants associated with oxide coverage on Pt, trace impurities in electrolyte, O2 diffusion in conjunction with a time dependent response resulting in unresolved complexities arising in our analyses.
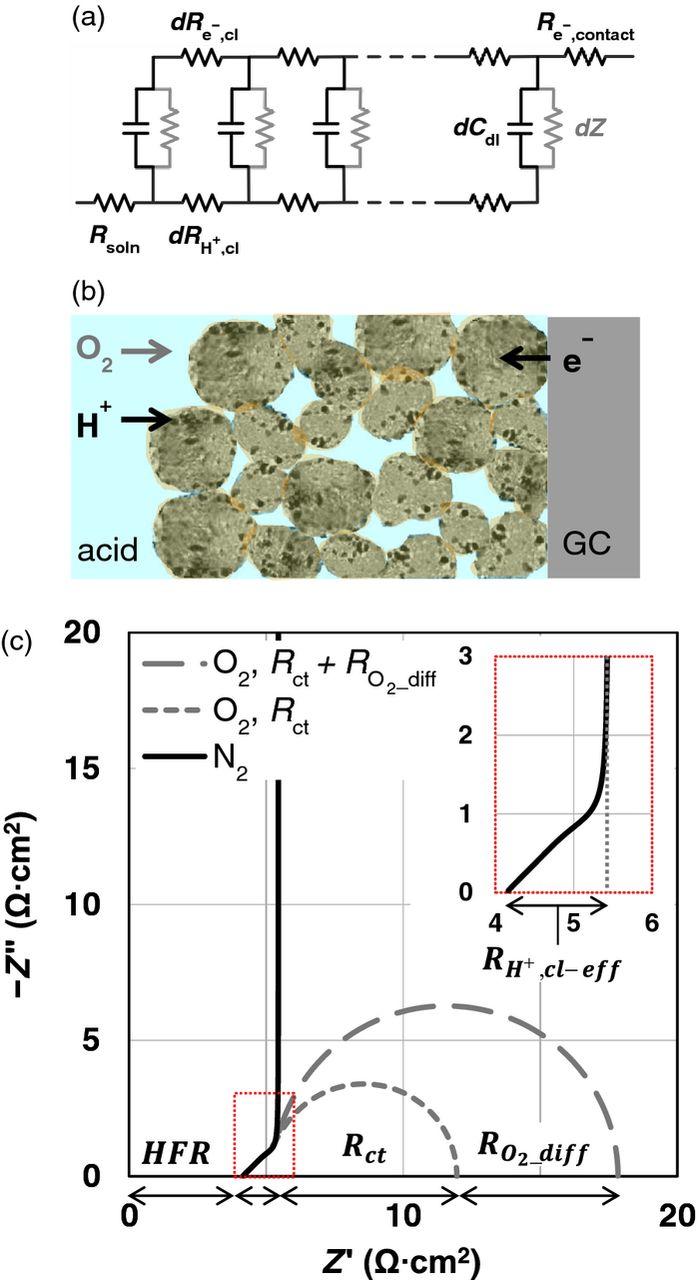
Figure 7. (a) Equivalent electric circuit of transmission line model for TF-RDE that describes the general case of Rsoln, uniformly distributed capacitance per unit length (dCdl), the reaction/diffusion related impedance (dZ) (gray) as well as protonic resistance (d ) and electronic resistance (d
 ), representing the impedances in the catalyst layer, and
  . (b) Schematic of catalyst layer on a GC disk depicting the reactant gas, proton and electron pathways. (c) Nyquist plot that describes curves under N2 and O2; real part of the 45o response corresponds to
  when
when  is negligibly small.
EIS—Catalyst layer electronic resistance ( )
)

Since the electronic conductivity of carbon black is extremely high (10's of S/cm110), it has been conventionally assumed that the contribution of electronic resistances in the 10 μm cathode catalyst layers of PEMFCs is inconsequential. If electronic resistances in the catalyst layer (RDE) were comparable to the ionomer resistance, they would manifest at the high frequency real intercept of the Nyquist plot (Fig. 7c) as follows (when contact resistance  ):111
):111
![Equation ([1])](https://content.cld.iop.org/journals/1945-7111/162/12/F1384/revision1/jes_162_12_F1384eqn1.jpg)
where Rcombined can be expressed with  and
and  as
as
![Equation ([2])](https://content.cld.iop.org/journals/1945-7111/162/12/F1384/revision1/jes_162_12_F1384eqn2.jpg)
Eq. 1 can be reduced to Rsoln when  is negligible. Figure 8 depicts EIS spectra for poly-Pt at 0.1 V and Pt/C at 0.1, 0.45 and 0.9 V; impedance attributable to electronic resistance was not detected at high frequencies after accounting for the solution resistance. The lack of dependence with potential suggests that oxide formation on Pt has an imperceptible effect on
  , and we do not anticipate appreciable electronic resistances in the catalyst layer or contact resistances between the catalyst and the GC surface for reasonable I/C ratios.
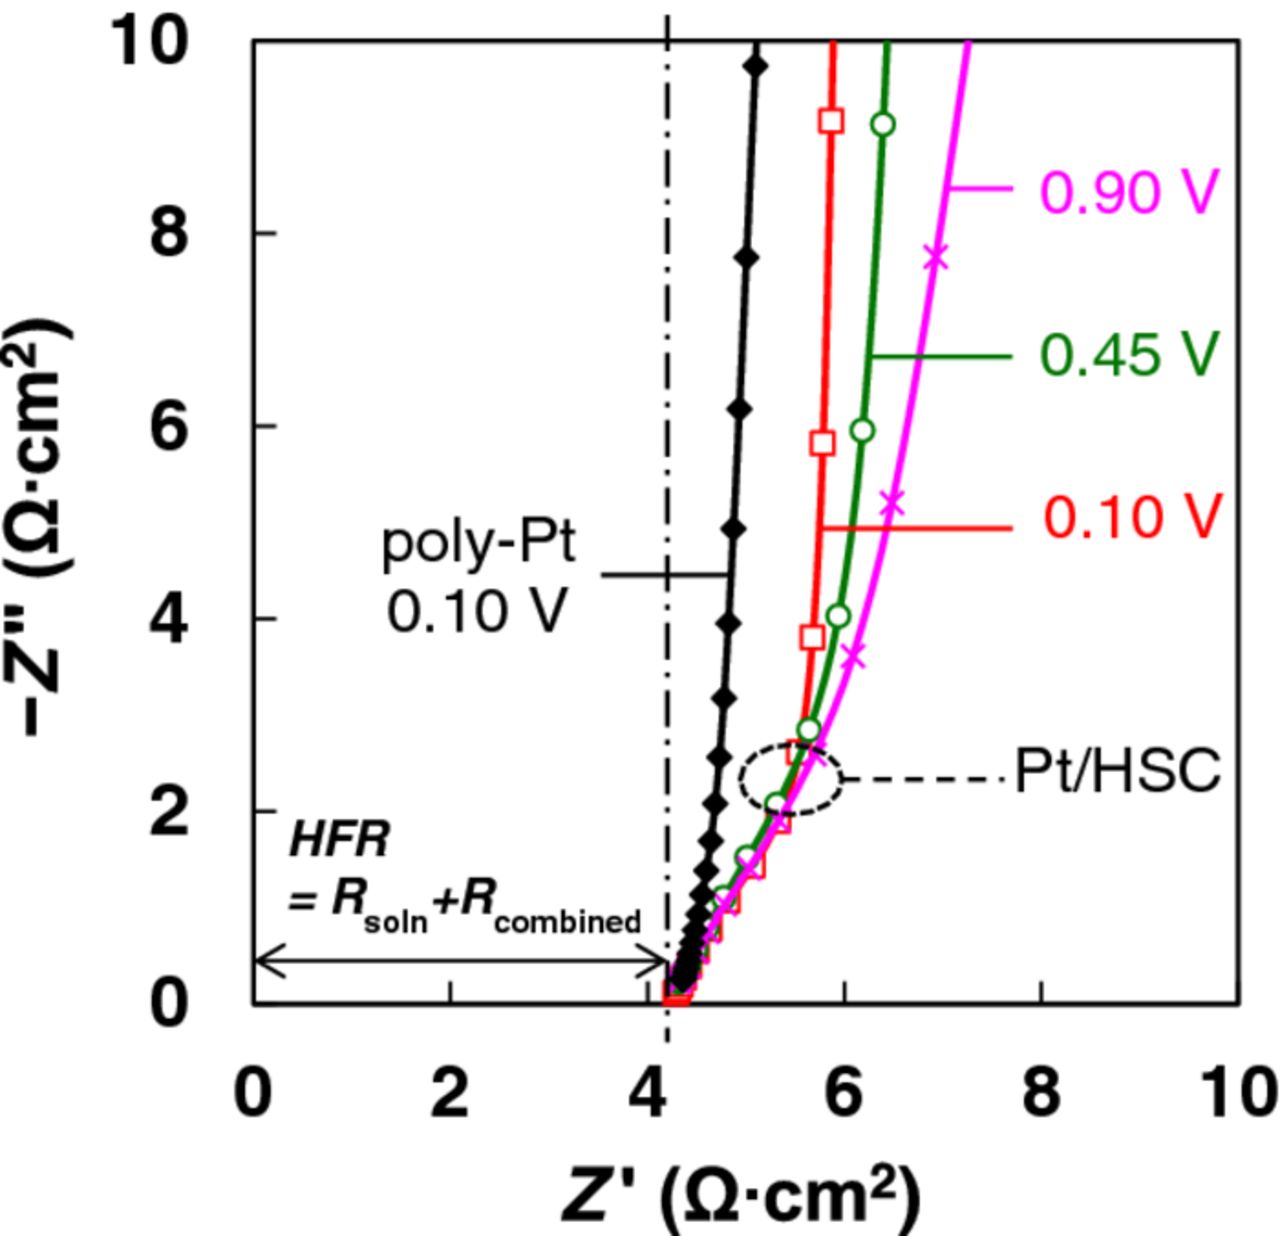
Figure 8. Nyquist plots of impedance spectra (3 repeats) measured under N2 for poly-Pt and Pt/HSC catalyst layer (18 μgPt/cm2) fabricated using N-SAD technique. 0.1 M HClO4 electrolytes from a single source were employed for all experiments.
EIS—Catalyst layer protonic resistance ()

The catalyst layer on the RDE GC is composed of Pt/C covered with a discontinuous Nafion film soaked in 0.1 M HClO4 with a porous structure that is completely flooded with acid electrolyte. Hinged on the underlying premise that the RDE catalyst layers are extremely thin, the associated resistance has been seldom studied comprehensively. In practice, the catalyst layers can range in thickness from ∼0.2–6 μm (4.5–18 μgPt/cm2) over the geometric area especially for non-uniform films having a 'coffee ring' structure. EIS spectra corresponding to the data shown in Fig. 6 are presented in Fig. 9a as a Nyquist plot with an inset depicting the non-linear trend of analyzed catalyst layer resistance as a function of loading. The extracted values of effective catalyst layer protonic resistance ( ) fall in the range ∼0.4–1.6 Ω·cm2 for loadings ∼4.5–144 μgPt/cm2 in 0.1 M HClO4. The response of the catalyst layer to reactant gas and potential is informative and detailed in Fig. 9b. The protonic resistance extracted from the high frequency 45° segment of the spectra (5 kHz–5 Hz at 0.1 V, 5 kHz–30 Hz at ≥0.45 V) is found to be independent of both reactant and potential. Under N2 at low frequencies, a purely capacitive response is observable at low reducing potentials (0.1–0.45 V) corresponding with an oxide-free Pt surface. As the potentials are raised (0.45–0.9 V), the response of the oxide covered Pt manifests as a tilted semi-circular arc that represents the emergence of a time constant related to adsorption/desorption processes that have not been taken into account in this work. Lastly, under O2 at potentials >0.6 V and low frequencies (<30 Hz), overlapping time constants associated with larger charge transfer resistance (Rct) and O2 diffusion resistance (RO2_diff) appear. Thus, the catalyst layer resistance can be obtained from EIS spectra at any potential although we advocate the use of reducing potentials under N2 for facile extraction of
  . The effective protonic conductivity of the catalyst layer is anticipated to be dominated by the conductivity of 0.1 M HClO4 since the ionomer (nm thickness112–115) is soaked in it.75 Since
  is directly proportional to the acid conductivity (hence acid molarity) it confirms our interpretation that the real intercept of the Nyquist plot does indeed provide a measure of the catalyst layer resistance. Likewise,
  was to be almost identical in both perchloric and sulfuric acids in the range 0.004–0.5 M (not shown). It is worth noting that a pure ORR kinetic response emerges around ∼30–2 Hz but significant overlap with O2 diffusion at lower frequencies renders it difficult to de-convolute the individual components. Prolonged oxide growth and impurity adsorption from electrolyte interferes with our ability to carry out constant current steady-state measurements (constant iRsoln loss and O2 flux from the bulk) as they are accompanied by a low frequency time constant that broadens with time. The typical
  for catalyst layers produced by the four different techniques (Fig. S6, SI) ranges from ∼0.1 Ω·cm2 to ∼1.5 Ω·cm2 (RN-SAD > RN-RAD ≈ RNF-SAD > RNF-SIPAD).
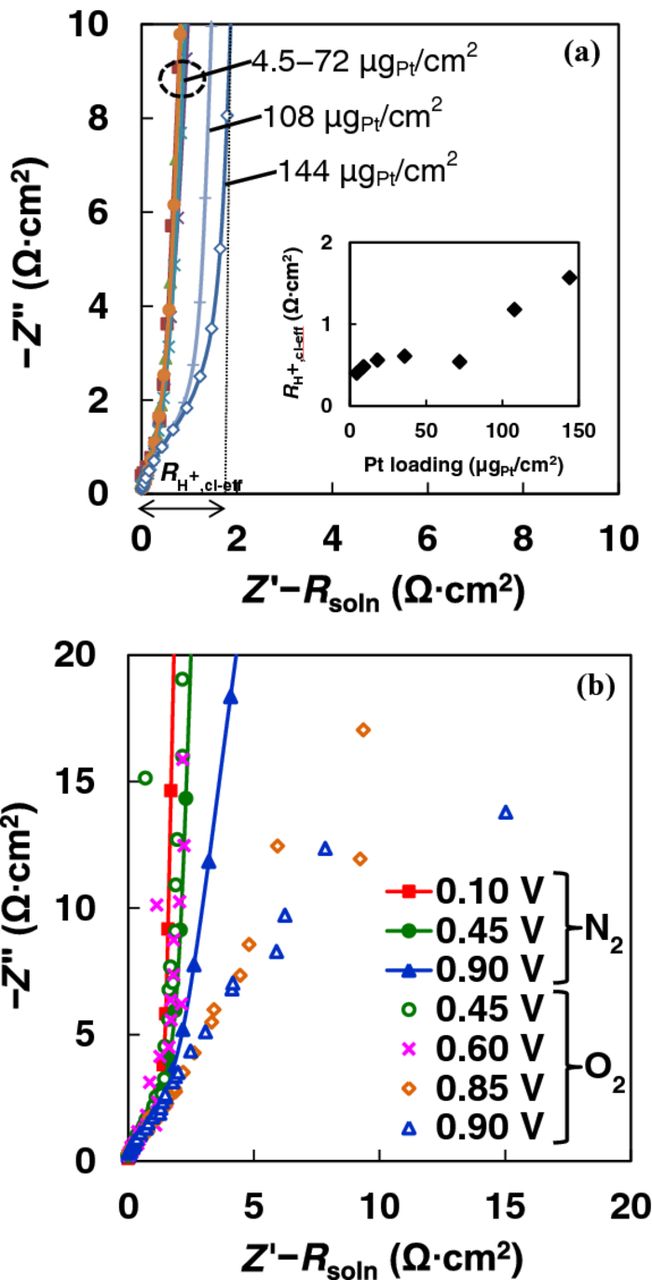
Figure 9. (a) Dependence of catalyst layer resistance on Pt loading. (b) Nyquist plot showing convergence of N2 and O2 data at higher frequencies. All EIS measurements conducted in 0.1 M HClO4 for Pt/HSC catalyst films (N-RAD technique for (a), N-SAD technique for (b), I/C 0.5).
EIS—Catalyst layer oxygen diffusion
A series of reasonably uniform films of Nafion-free Pt/V (NF-SIPAD) in a narrow loading and thickness range of 4.5–36 μgPt/cm2 were fabricated and the corresponding Tafel plots are depicted in Fig. 10. At 0.9 V, the SA for 4.5 μgPt/cm2 Pt/V layers is independent of the rotation rate (Fig. S7, SI) coupled with an I-V profile that approaches poly-Pt (∼zero film thickness); the O2 diffusion losses can be safely disregarded at 0.9 V allowing us to draw the conclusion that thin uniform films fabricated by the NF-SIPAD technique provides a true measure of the ORR kinetics.
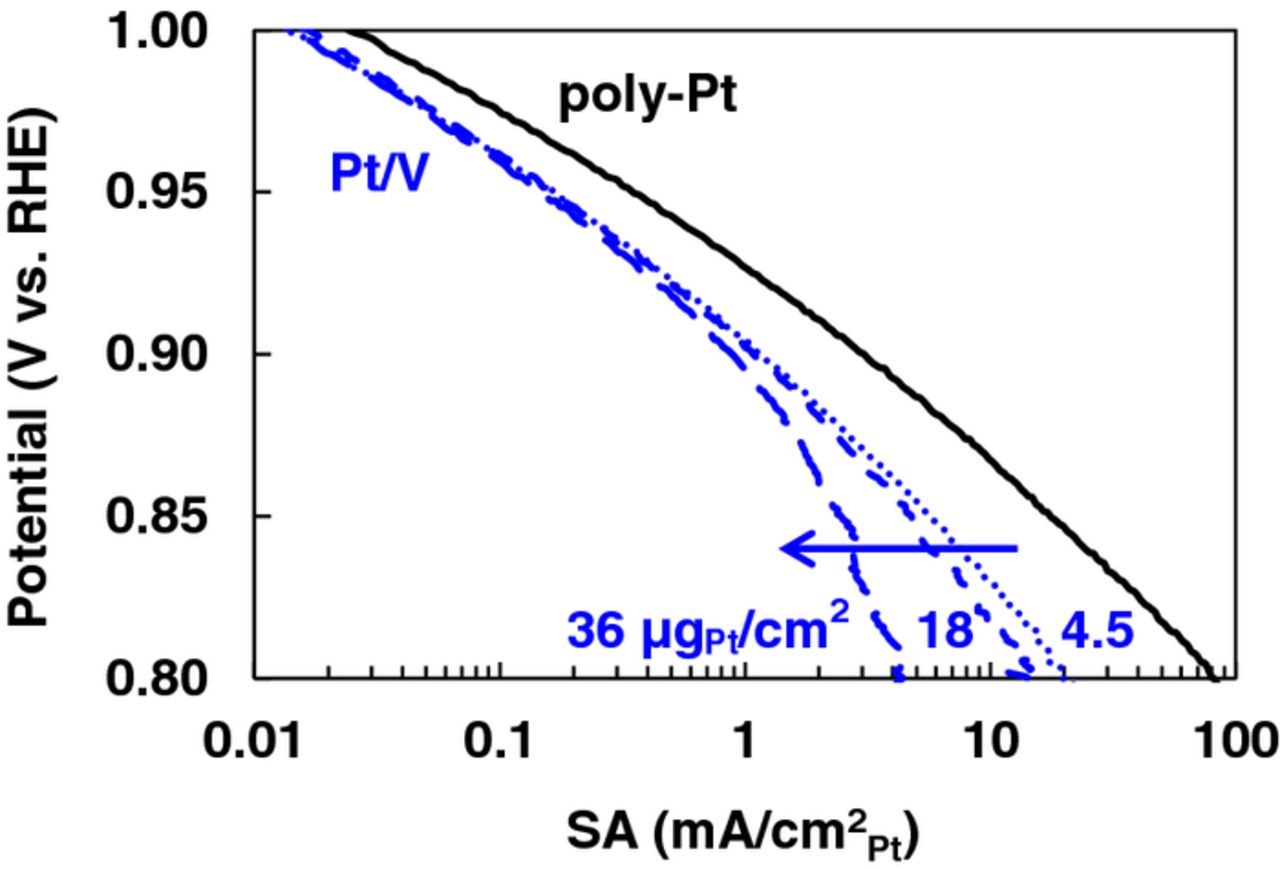
Figure 10. ORR I-V curves at 400 rpm in 0.1 M HClO4 for poly-Pt and Pt/V catalyst layers fabricated using NF-SIPAD (4.5 μgPt/cm2) and NF-RAD (18 and 36 μgPt/cm2).
We estimated the O2 diffusion of the non-uniform catalyst layers using the magnitude of protonic resistance ( ) obtained from EIS in combination with an 'effective thickness' from SEM images. Figure 11a is a schematic representation of the procedure used to estimate the effective thickness on uniform and non-uniform catalyst layers, and Fig. 11b shows the correlation between the effective catalyst layer thickness and protonic resistance obtained from EIS. It should be pointed out that ∼70% of the catalyst is located at the coffee ring band for films fabricated by the N-SAD technique in contrast to negligible amounts for NF-SIPAD films. The effective thickness was calculated from thickness and the vol% of its thickness (vol% weighted thickness) to account for longer diffusion paths in non-uniform films. Figure 12 depicts SEM images of tilted catalyst layer samples used to parameters used to estimate the effective thickness. Non-uniform films exhibit a thick coffee ring structure at the periphery of GC while the rest of the central GC area has a relatively constant thickness; the effective thickness was determined from dimensions of these two areas. Although our estimation process involves approximations, the resultant porosity of the catalyst layers (65–75%), calculated from the total volume of the catalyst layer, carbon and ionomer loading, and carbon and ionomer densities (2 g/cm3), agrees closely with that reported in literature for MEAs of PEMFCs.108,113
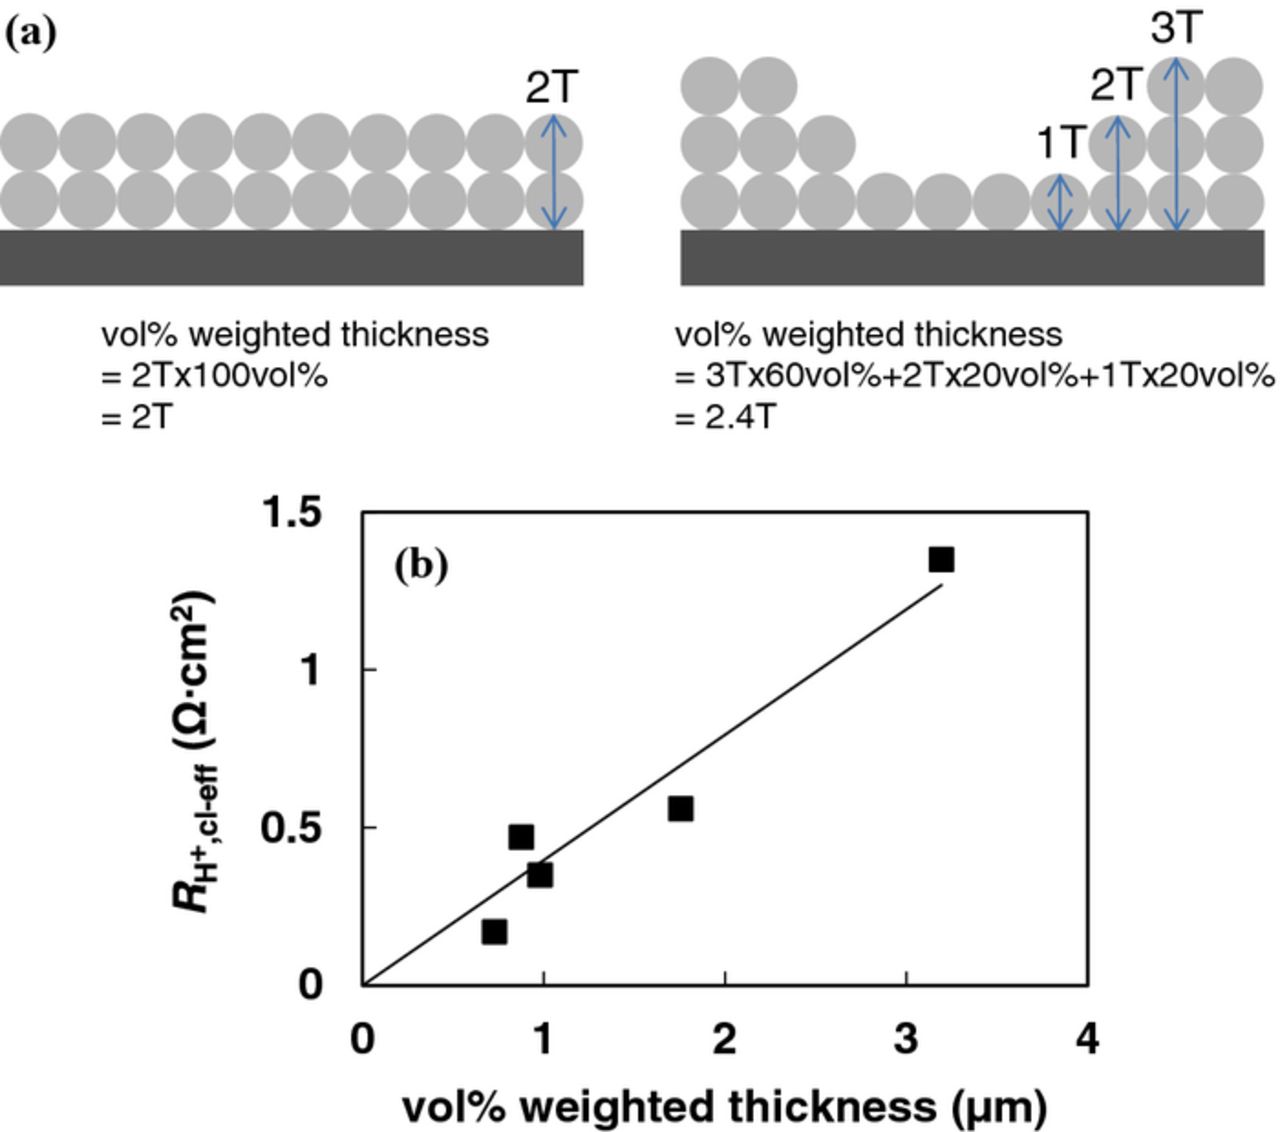
Figure 11. (a) Schematic representation of vol% weighted effective catalyst layer thickness estimation procedure for uniform and non-uniform catalyst films. (b) effective (vol% weighted) estimated from SEM images vs. catalyst layer effective protonic resistance for Pt/HSC and Pt/V.
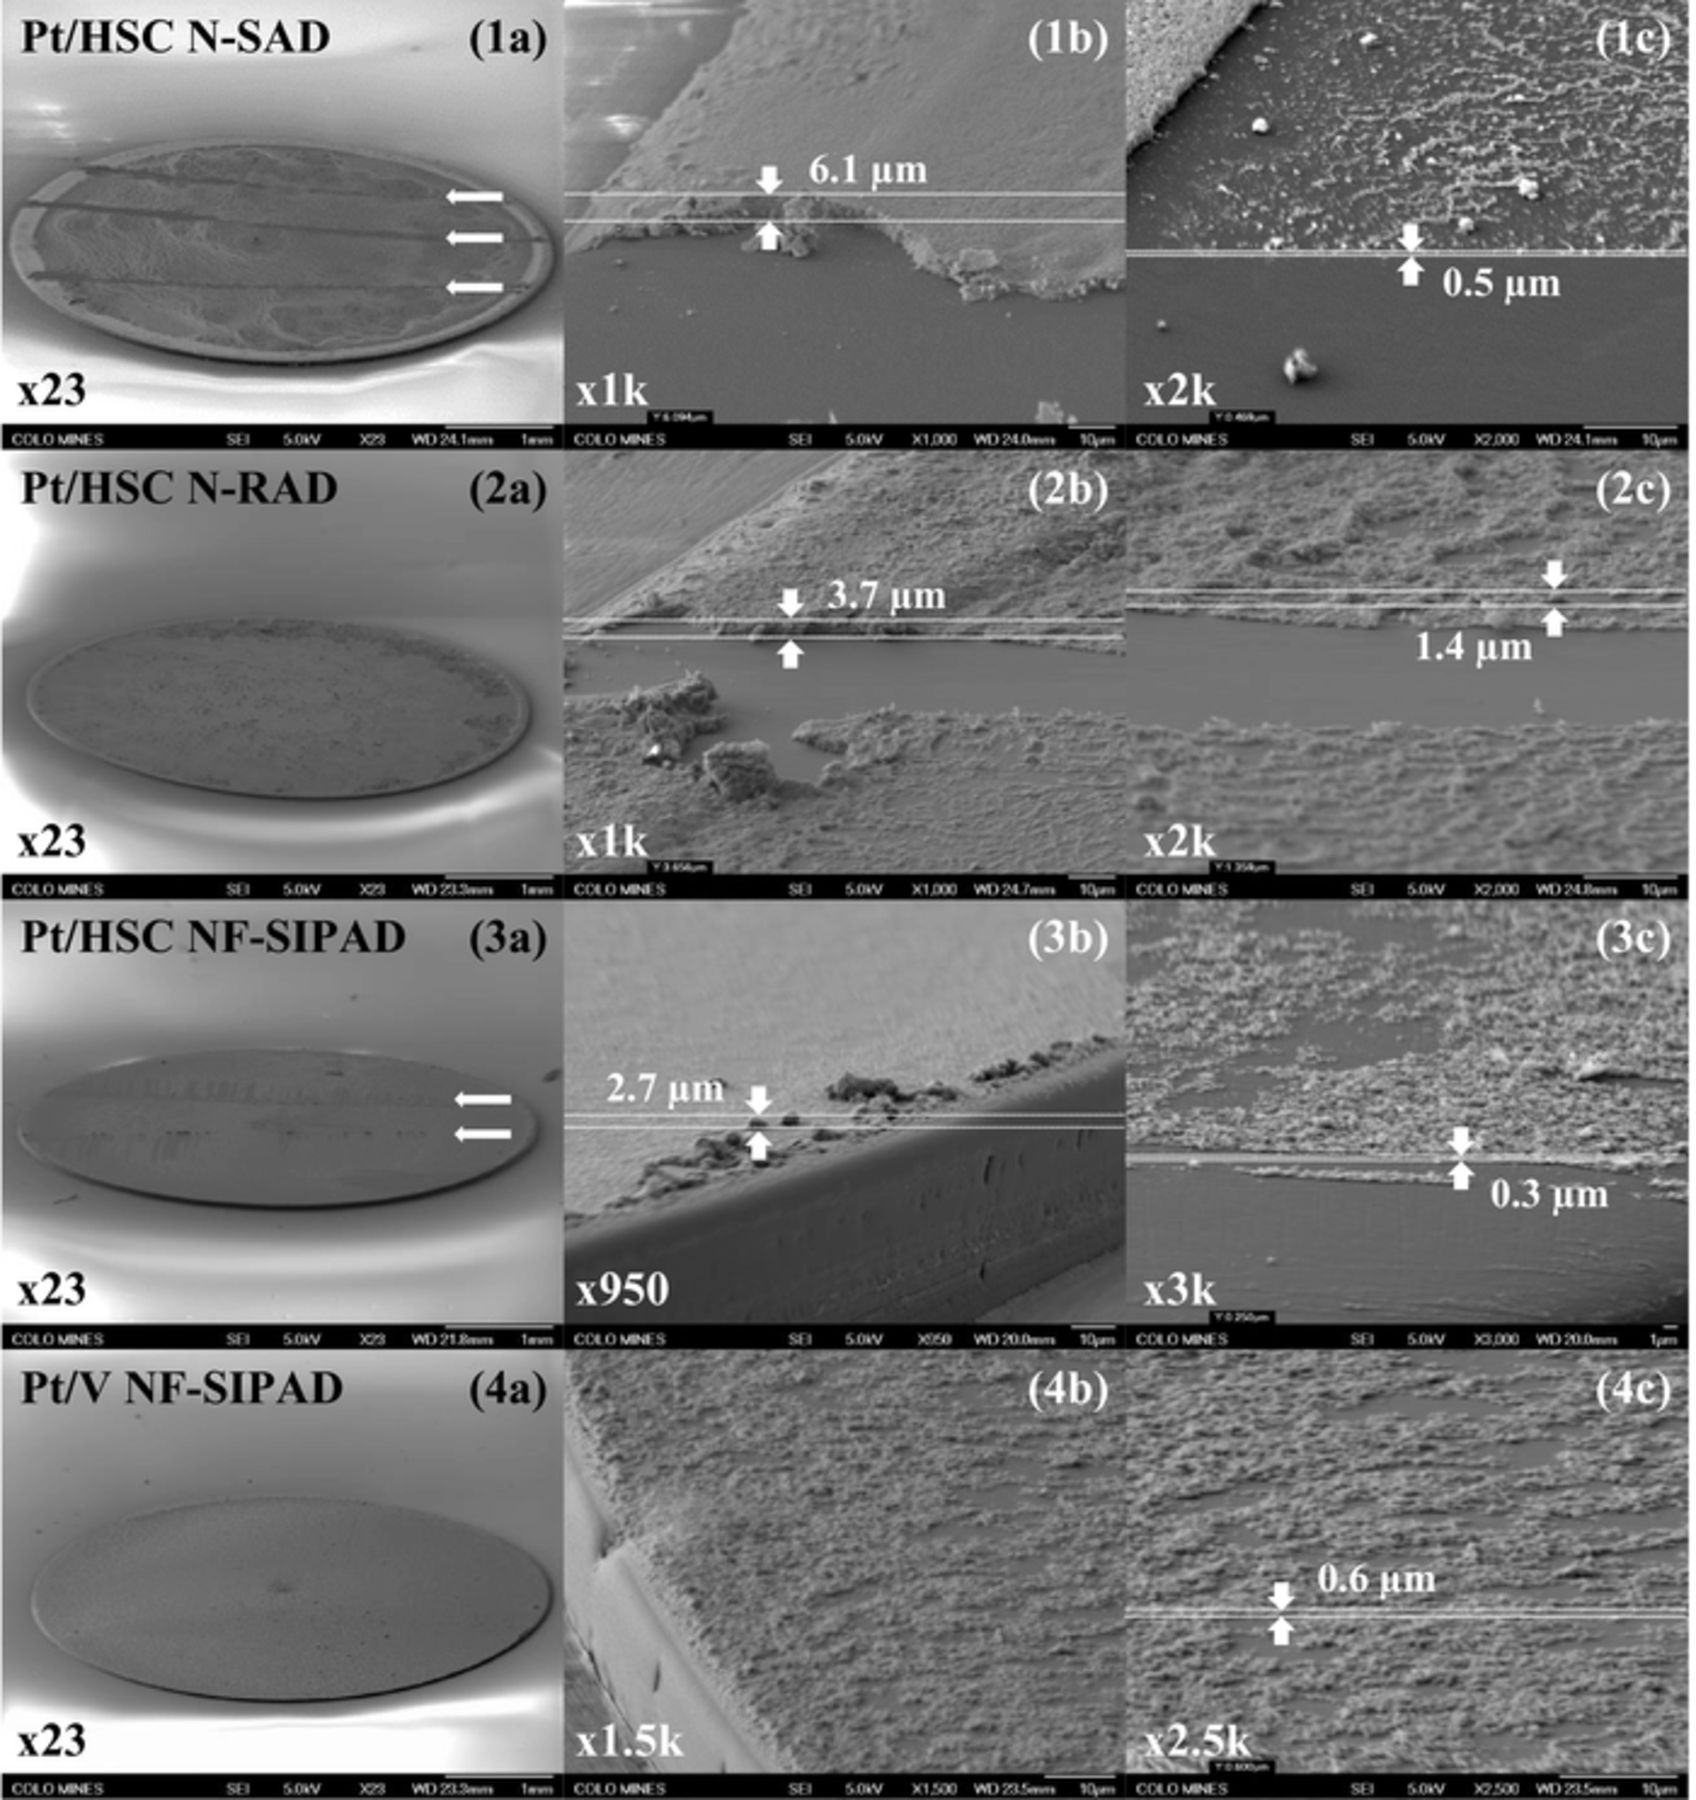
Figure 12. Catalyst layer thickness estimation from tilted sample SEM images: Pt/HSC (1) N-SAD, (2) N-RAD, (3) NF-IPAD, (4) Pt/V NF-SIPAD, (a) entire area, (b) edge area, (c) near edge area. Catalyst removed over a narrow band (horizontal arrows) to facilitate observation and analysis of catalyst layer thickness for each local area.
We conducted additional studies on catalyst layers fabricated by the four techniques for ORR activity in 0.1 M and 0.5 M H2SO4 to probe the effect of thickness in the presence of strong anion adsorption ((Bi)sulfate anions). In the presence of sulfuric acid, the losses due to anion adsorption are overwhelming but we continue to clearly observe additional losses that are proportional to thickness of the catalyst layers of films.
Discussion
Activity losses within the catalyst layer
The film fabrication techniques described in the Results section yield catalyst layers that exhibit a broad range of properties in terms of thickness and distribution of catalyst agglomerates and ionomer over the GC geometric area. As mentioned before, researchers have provided guidelines restricting the allowable thickness of the Nafion cap (δf <0.2 μm for δd ∼15 μm at 1600 rpm) to prevent suppression of O2 diffusion limiting currents. It has been implicitly assumed in past studies that the catalyst layer is fairly uniform and losses solely 'outside the catalyst layer' have been identified and corrected. Specifically, corrections have been conventionally applied to account for O2 diffusion in bulk electrolyte, background correction, and solution resistance while losses 'within the catalyst layer' have been generally overlooked. It should be strikingly evident from our results that achieving predicted diffusion limiting currents is a necessary but not sufficient condition for a loss-free kinetic measurement. In the light of these results, we propose that prior assumptions are not valid, in that, both the incorporation of Nafion ionomer and the effective film thickness can significantly depress the measured ORR activity. Accordingly, losses 'within the catalyst layer' must be scrutinized and quantified in relation to film quality to obtain a true measure of catalyst activity. It is worth pointing out that MEAs of PEMFCs are routinely and systematically investigated and analyzed to account for over-potential losses in the cathode catalyst layer; analogous investigations have not been implemented for TF-RDE catalyst layers (except for the flooded macro homogeneous model6 and flooded agglomerate model44 to simulate O2 diffusion). Prior to embarking on a detailed analysis to identify, resolve and separate loss contributions 'within the catalyst layer', we attempt a qualitative assessment of the symptoms of losses from ORR I-V curve profiles.
Typical bulk poly-Pt disks having roughness factors ∼1.2–1.4 may be postulated to physically approximate films approaching zero thickness; the applicability of this treatment becomes evident when Tafel plots (and inset I-Vs) for bulk poly-Pt are compared with representative profiles for catalyst layers fabricated by the different techniques and having finite thicknesses and non-uniformity as depicted in Fig. 13. ORR I-V profiles for poly-Pt approach ideal behavior with respect to Tafel slopes and the sharp transition from mixed kinetic/diffusion regime to O2 diffusion limiting currents. The Tafel slope for the ultra-thin uniform film fabricated using the NF-SIPAD technique closely follows poly-Pt in the kinetic regime with a minor departure that is barely detectable in the transition regime to the limiting current (Fig. 13 inset). It would be a reasonable interpretation that ultra-thin films fabricated by NF-SIPAD technique allow us to extract a true measure of the kinetic current at lower current densities where ORR activity values are reported. In contrast, for the N-SAD technique, a significant divergence from poly-Pt profile is observable and thus demands detailed investigation and analysis of losses. The deeper meaning and fundamental implications of the magnitude of (single and double) Tafel slopes for bulk poly-Pt and Pt/C have been extensively debated over decades and continue to be a contentious subject; for the purposes of this work, we have confined ourselves to a qualitative analysis. It should also be apparent that the absolute magnitude Tafel slopes have fundamental significance only after corrections have been made for losses 'within the catalyst layer'.
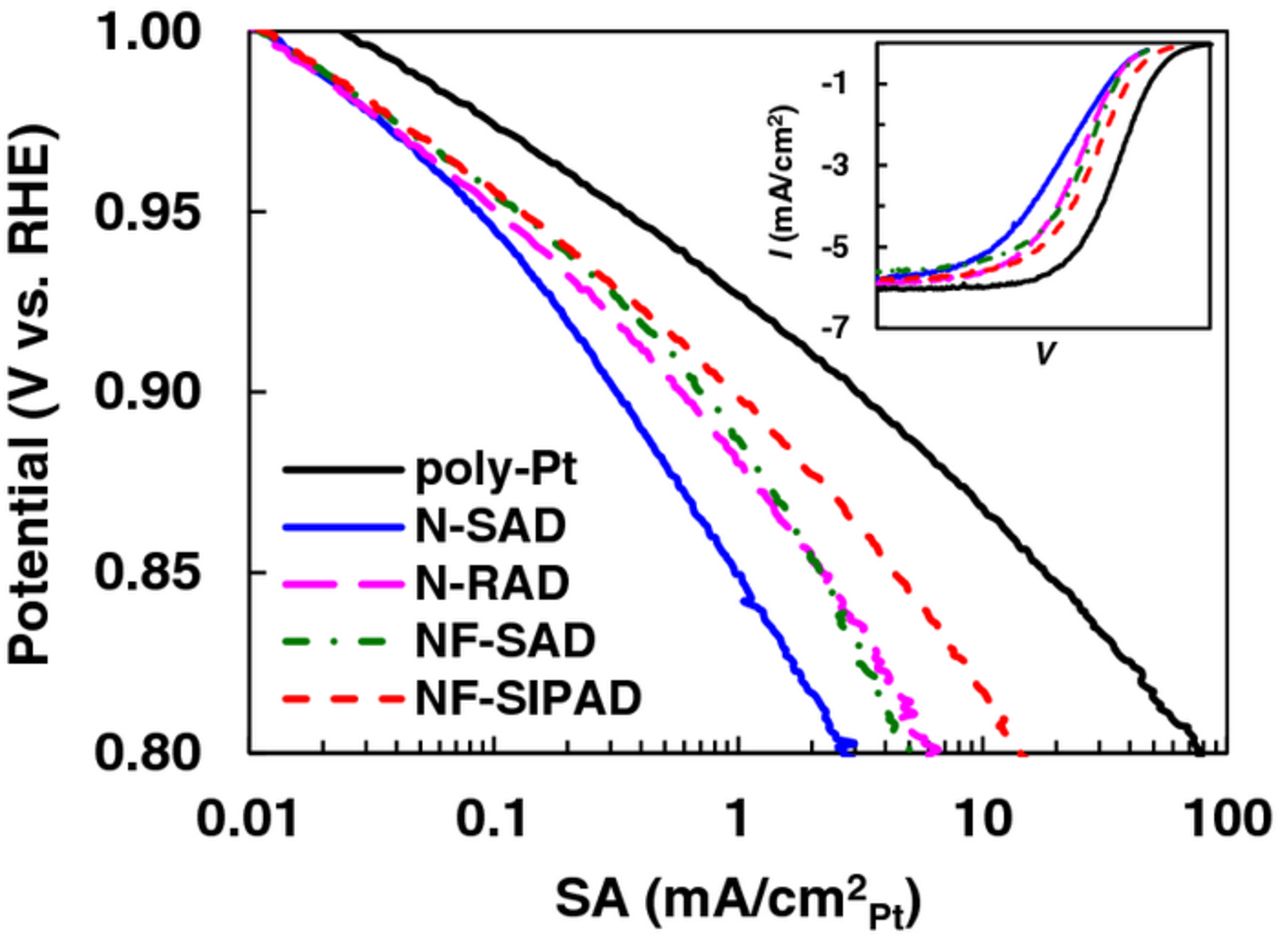
Figure 13. ORR Tafel plots of poly-Pt and Pt/HSC catalyst layers fabricated using N-SAD, NF-SAD, N-RAD and NF-SIPAD techniques. ORR activity measured in 0.1 M HClO4 under the following conditions: 1600 rpm, 20 mV/s, −0.01 to 1.0 V, anodic sweep.
Breakdown of losses within the catalyst layer
Prior to this analysis, all data were corrected for losses incurred 'outside the catalyst layer' related to the solution resistance, K-L, and b.g. current corrections. To identify and de-convolute the losses, and account for the varying magnitude of the measured electrochemical activity, we utilized the magnitude of  ,
,  and estimates of O2 diffusion from EIS results. Figure 14 elucidates the breakdown of losses for identical samples as shown in Fig. 13 associated with the measured kinetic currents (gray), losses associated with the catalyst layer resistance (orange), ionomer adsorption/blocking related losses (green) and O2 diffusion (blue) for each of the four film fabrication techniques at a fixed potential of interest viz., 0.9 V. In all cases, the effective catalyst layer resistance (
 ) was extracted directly from the EIS measurements and used to correct the loss due to the ohmic drop. Although the magnitude of the catalyst layer resistance is large, the currents in RDE studies especially at 0.9 V are low, resulting in a non-negligible finite loss (orange bars) due to i
 at 0.9 V.
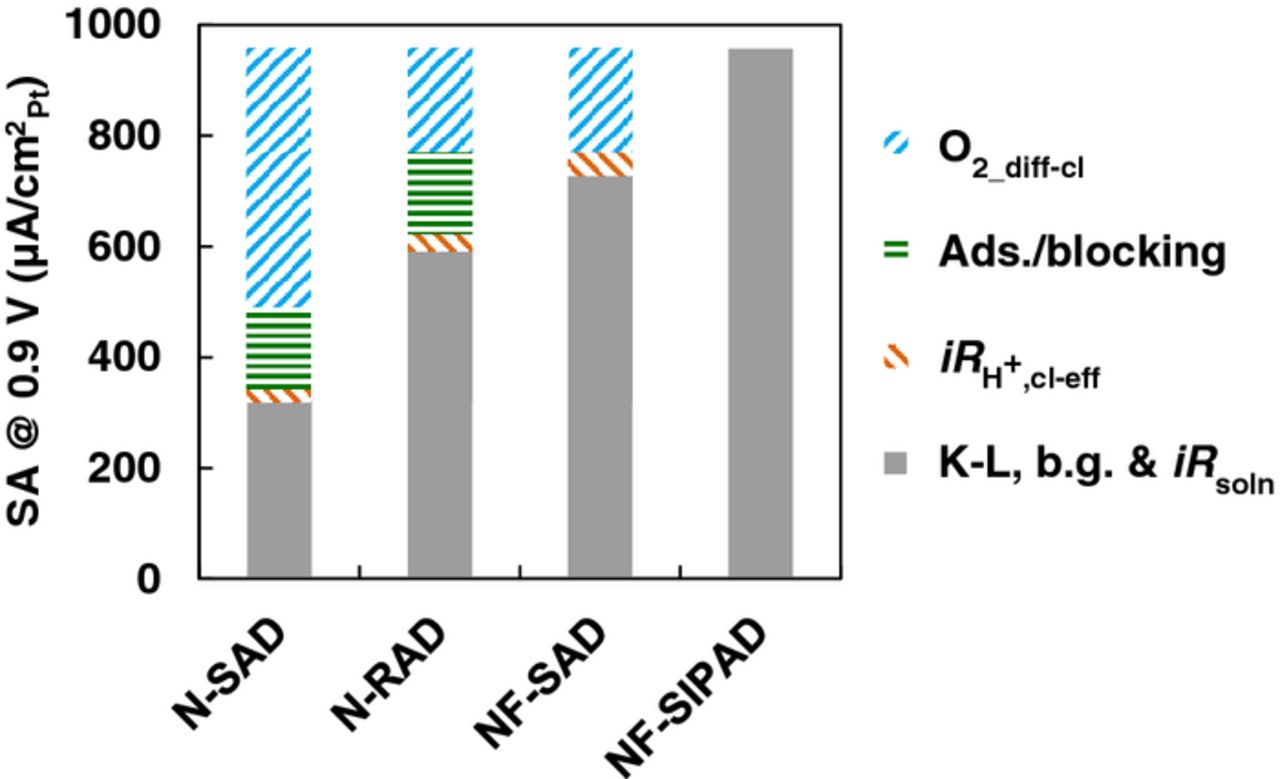
Figure 14. Breakdown of SA losses at 0.9 V for Pt/HSC catalyst layers fabricated using N-SAD, N-RAD, NF-SAD, NF-SIPAD techniques. N-RAD and NF-SAD catalyst layers had identical thickness and N-SAD and N-RAD layers had identical I/C ratio.
The NF-SIPAD technique produces the thinnest and most uniform catalyst layers and results in the highest kinetic currents (Pt/HSC) that have been reported; consequently, the ORR I-V profiles closely resemble that of poly-Pt and the loss due to i at 0.9 V is negligible. We also conducted limited experiments using an automated nano-liter ink deposition system identical to that used by Ke et al.17 to fabricate extremely thin and highly uniform films. The SA obtained using NF-SIPAD technique was comparable to that obtained with the automated system. Thus, for the purposes of this discussion, we assume that these films are free from contributions arising from O2 diffusion as well as anion adsorption/blocking. A departure from these values observed for various films fabricated by other techniques can therefore be assigned to losses arising within the catalyst layer. The primary difference between catalyst layers fabricated by the NF-SAD technique (4.5 μgPt/cm2) and the NF-SIPAD technique (18 μgPt/cm2) arises from the effective thickness of the two films. Using inductive reasoning, we can directly attribute the residual difference between these two techniques (after correction for i
 ) to O2 diffusion losses.
The loss contribution from the interaction of Pt with ionomer can be separated as follows. Catalyst layers fabricated by the NF-SAD and N-RAD techniques (18 μgPt/cm2) exhibit nearly identical catalyst layer resistances, which in turn is a measure of O2 diffusion loss. Assigning identical O2 diffusion losses, the residual difference between these two techniques can then be credited to ionomer-related losses (∼150 μA/cm2Pt). The magnitude of the ionomer-related losses can be substantiated from the plots of SA vs. effective catalyst layer resistance/effective thickness with and without ionomer (∼200 μA/cm2Pt) as well as SA as a function of ionomer cap as exemplified in Fig. S8 (SI).
Catalyst layers fabricated by the N-RAD and N-SAD techniques share identical ionomer related losses (I/C 0.5) but suffer from dissimilar O2 diffusion losses due to significant differences in the degree of non-uniformity and hence effective thicknesses. Therefore, the residual difference from the kinetic currents obtained from the N-RAD and N-SAD technique can be attributed to higher O2 diffusion for the N-SAD technique due to its thick and highly non-uniform coffee ring films. To further support our argument, we correlated the effective catalyst layer resistance for the various catalyst layers to O2 diffusion. It was found that N-SAD films have 2.5x the effective thickness as the N-RAD technique and the NF-SAD films corroborating the validity of our analysis. Thus, using estimates obtained from various diagnostics and induction, we have obtained a reasonable break-down of losses within the RDE catalyst layers having varying film properties fabricated by different techniques.
Implications for PEMFCs
A comprehensive paper85 originated from General Motors in which the status of baseline Pt/C catalyst activity (in RDE and subscale PEMFC platforms) as well as target performance projected for successful automotive commercialization was delineated. They compared the ORR activity (for identical catalysts) in TF-RDE and MEAs of PEMFCs under quite different conditions (0.9 V, 60°C, 100 kPa, 20 mV/s in 0.1 M HClO4 vs. 0.9 V, 80°C, 103 kPa, 100% RH and 15 min/point) to obtain MA values that ranged from 200 mA/mgPt to 160 mA/mgPt. Based on these results, they argued that the ORR activity obtained from RDE experiments measured in non-adsorbing electrolytes such as 0.1 M HClO4 was a valid predictor of the performance in PEMFCs incorporating PFSA ionomers in their catalyst layers. Previously, Paulus et al.15 had also conducted a detailed analysis to demonstrate equivalence between the measured ORR activity in their RDE studies in 0.5 M HClO4 to the kinetic limit reported for PEMFCs by Wilson et al.;116 they rationalized a factor of 3x higher activity found in PEMFCs to a 3x higher O2 solubility in recast Nafion. Bearing in mind the significant differences between RDE and PEMFC electrode, electrolyte, measurement protocol and operating conditions, it is debatable whether the absolute magnitudes of activity measured in the two systems can be compared meaningfully. Firstly, the evaluation protocols are vastly different between RDE and MEA studies and cannot be reconciled. As emphasized in part I of this manuscript and literature,117 the measured activity strongly depends on temperature, scan rate, scan direction and initial potential. Scan rates employed for activity measurements in RDE studies are in contrast to pseudo-steady state measurements in fuel cells, in part, due to the facile poisoning of the Pt catalyst by the perchloric acid electrolyte. For a given rotation speed (impurity flux), the impact of poisoning and activity loss is accelerated at low Pt loadings (low roughness factor) leading to additional complexities. Secondly, although the catalyst layer structure in MEAs and Nafion-based RDE films is analogous w.r.t. porosity and ionomer coverage, the pores of the RDE films are completely flooded with acid. Over and above, significant O2 diffusion losses are present within the catalyst layer in the Nafion-based thick RDE films (Fig. 14, N-SAD) that are typically left uncorrected. Based on the discussion above, neither Nafion-based nor Nafion-free catalyst layers can be expected to result in ORR activities having comparable absolute magnitudes to that in MEAs of PEMFCs. Nevertheless, rough trends in ORR specific activity for some Pt based catalysts in RDEs and MEAs (e.g. PtCo/C, PtNi/C) have been found to be consistent.20,51,117–120 Any departure that may be observed between RDE and MEA trends may be ascribed to due to thick non-uniform films in some RDE studies as well as the detrimental effect of base metal leachants on the limited protonic sites of the ionomer in the cathode catalyst layer.85
A critical and unresolved challenge in PEMFCs that has arisen with the attempts at reducing Pt loading and cost is the lower than projected peak power for cathodes incorporating ultra-low Pt loadings. The issue is being studied intensively and different groups114,121–125 have identified several possible routes including catalyst interaction with Nafion. In MEAs of PEMFCs, since it is not possible to carry out an investigation in the absence of ionomer (ionomer is indispensable for proton conduction), the contribution of the ionomer adsorption/blocking cannot be easily examined. In our studies it is possible to include Nafion ionomer in the catalyst layer of RDEs to partially simulate the environment of Pt in MEAs (as a function of potential) and quantify the percentage loss in kinetics due to adsorption/blocking. A similar phenomenon along with kinetic losses at peak power may be predicted to take place in MEAs of PEMFCs.
Conclusions
We draw the following conclusions from the key experimental findings and analysis discussed in the paper:
- (1)The ORR activity for Pt/HSC films fabricated using the NF-SIPAD technique was determined to be: MA 870 ± 91 mA/mgPt and SA 864 ± 56 μA/cm2Pt; and corresponding values for Pt/V were: MA 706 ± 42 mA/mgPt and SA 1120 ± 70 μA/cm2Pt measured in 0.1 M HClO4 at 20 mV/s, 100 kPa O2 and 23°C. This corresponds to a three-fold enhancement of measured SA and MA compared to the traditional N-SAD technique widely used in the literature.
- (2)On comparing Nafion-based and Nafion-free Pt/HSC and Pt/V catalyst layers for RDE evaluation of the SA using N-SAD, N-RAD and NF-SIPAD techniques, it was found that the reproducibility was higher for N-RAD (Pt/HSC: 29 samples, 10% RSD, Pt/V: 49 samples, 4% RSD) and NF-SIPAD (Pt/HSC: 44 samples, 7% RSD, Pt/V: 20 samples, 6% RSD) techniques as compared to traditional N-SAD (Pt/HSC: 28 samples, 12% RSD, Pt/V: 42 samples, 16% RSD). The RAD technique was least influenced by operator skill while the SIPAD technique was sensitive to operator skill, precise leveling of the sample holder and humidity.
- (3)A breakdown of losses based on EIS, SEM, and electrochemical measurements reveals that O2 diffusion through thick non-uniform films and Nafion ionomer adsorption have a deleterious effect on ORR kinetics on Pt/HSC catalyst. Due to the variability in these losses, the conventional N-SAD technique may not be the best predictor of activity trends.
- (4)Nafion-free catalyst layers fabricated using the NF-SIPAD technique have thinnest and most uniform films and results in the highest measured SA at given scan rate. The negligibly low catalyst layer resistance and I-V profiles that approach poly-Pt leads us to believe that we are approaching a true measure of kinetics.
- (5)It is not possible to predict the absolute value of ORR activity in MEAs of PEMFCs based on the absolute values obtained from TF-RDE studies, even for identical protocols, based on the dissimilarities of the Pt | Electrolyte interface in the two systems and poisoning from electrolyte in RDE experiments. However, the trends in activity between the two systems have generally been shown to be valid for Pt based catalysts.
Acknowledgments
Shyam S. Kocha gratefully acknowledges funding from the U.S. Department of Energy, Fuel Cells Technologies Program under Contract No. DE-AC36-08-GO28308 to the National Renewable Energy Laboratory (NREL). Kazuma Shinozaki greatly acknowledges his Ph.D advisor Dr. Ryan Richards (Colorado School of Mines, CSM), Dr. Yu Morimoto, Tatsuya Hatanaka and Dr. Masaya Kawasumi (Toyota Central R&D Labs., Inc., TCRDL)) for advice on his thesis work. Kazuma Shinozaki's stay at NREL and CSM was funded by TCRDL. We thank Dr. Bruce E. Liebert (University of Hawai'i) for discussions on EIS measurements, Dr. Jung Yi for sharing his expertise on EIS modeling and Dr. Guido Bender for electrical equivalent circuit schematics. We would also like to thank Dr. Yannick Garsany for consulting on the rotation air dry (RAD) technique.