Abstract
To quantify the impact of non-uniform current distribution in a large-format Li-ion cell on its overall energy density, five cell configurations with different positive tab numbers and locations were developed. This was enabled by a specially designed segmented cell with reconfigurable positive tabs on the outside. Current distribution and overall discharge performance were measured and correlated with each other for all five cell configurations. It is shown that tab number and location have significant effects on the performance and current distribution of a Li-ion battery cell. Fewer tabs typically cause lower performance but excessive tabs do not help. The 1-tab-co-located configuration causes both very non-uniform current distribution and very low overall discharge performance, and should be avoided in tab design for cells bigger than ∼2.4Ah. The effects of tab configuration on overall performance can be attributed to and explained by current distribution. Discharge energy of the experimental cell decreases almost linearly with a current density non-uniformity factor. Non-uniform current distribution results in non-uniform utilization of active materials, reducing energy density, and likely also accelerating degradation of the Li-ion cell. Future research on diagnosing and improving current density uniformity in large format Li-ion batteries that enable vehicle- and grid-energy storage is highly warranted.
Export citation and abstract BibTeX RIS
Although great progress has been made in improving the energy density of Li-ion battery during the past two decades,1–3 the demand for higher energy density is stronger than ever, particularly driven by the boom in electric vehicles in recent years.3–5 Higher energy density can reduce weight, space and possibly also cost of battery packs, all of which are desired for development of electric vehicles.
While tremendous efforts6–8 have been devoted to the search for a higher energy density Li-ion battery, commonly starting with development of new electrode materials, the optimization of battery design with available materials, such as improvement in uniformity of current distribution and hence active material utilization, has not been pursued, especially for large-format cells used in vehicle- and grid-energy storage. Additionally, non-uniform current distribution and ensuing non-uniform depth of discharge (DOD) distribution will lend profound consequence to battery aging,9–11 creating a new mode of battery failure – localized failure. A recent modeling study by Zhao et al12 revealed a direct and significant correlation between energy density and the non-uniformity in current distribution, demonstrating a potential to gain as much as 50% in energy density through improved current distribution in a large Li-ion battery cell. Such significant potential in boosting energy density through cell engineering underscores the paramount importance of measuring and improving the current distribution in large-format cells, as advocated by us in a recent study,13 where we described a novel technique to measure current distribution in a 2.4 Ah Li-ion battery cell and showed current distribution data under a range of C-rates and temperatures.
Few studies have shown the strong influence of tab configurations in Li-ion batteries. Chen et al.14 experimentally demonstrated the impact of two tab designs on discharge performance in a 18650 cylindrical cell. Most recently, Lee et al.15 and Zhao et al.12 carried out computational studies of tab location and number on discharge performance. However, no quantitative relationship between cell energy density and current distribution has ever been established experimentally in the literature. Built upon our previous work on local current density distribution measurements,13 we hypothesize that the effects of tab configurations on the energy density of Li-ion battery can be attributed to the effects on current distribution.
In this work, we examine 5 tab configurations shown schematically in Fig. 1, all with the same negative tab but different positive tab configurations: 10 positive tabs in parallel, 5 positive tabs in parallel, 2 positive tabs in parallel, 1 positive tab located counter to the negative tab and 1 positive tab located at the same end of negative tab. Local current density distribution is measured via a segmented cell technique developed in our previous work,13 and the discharge performance in different cases is characterized to yield energy density. The spatial-temporal current distributions in different cases are then presented and discussed to show how the tab configurations influence current density non-uniformity. Based on the current distribution results, distributions of local DOD are obtained and analyzed. The correlation between current density non-uniformity and energy density is explored. Additionally, the current distribution data in various tab configuration cases are useful for validation of multi-dimensional battery models that recently have become prevalent in the development of Li-ion batteries for improved energy density, durability, and safety.16–27
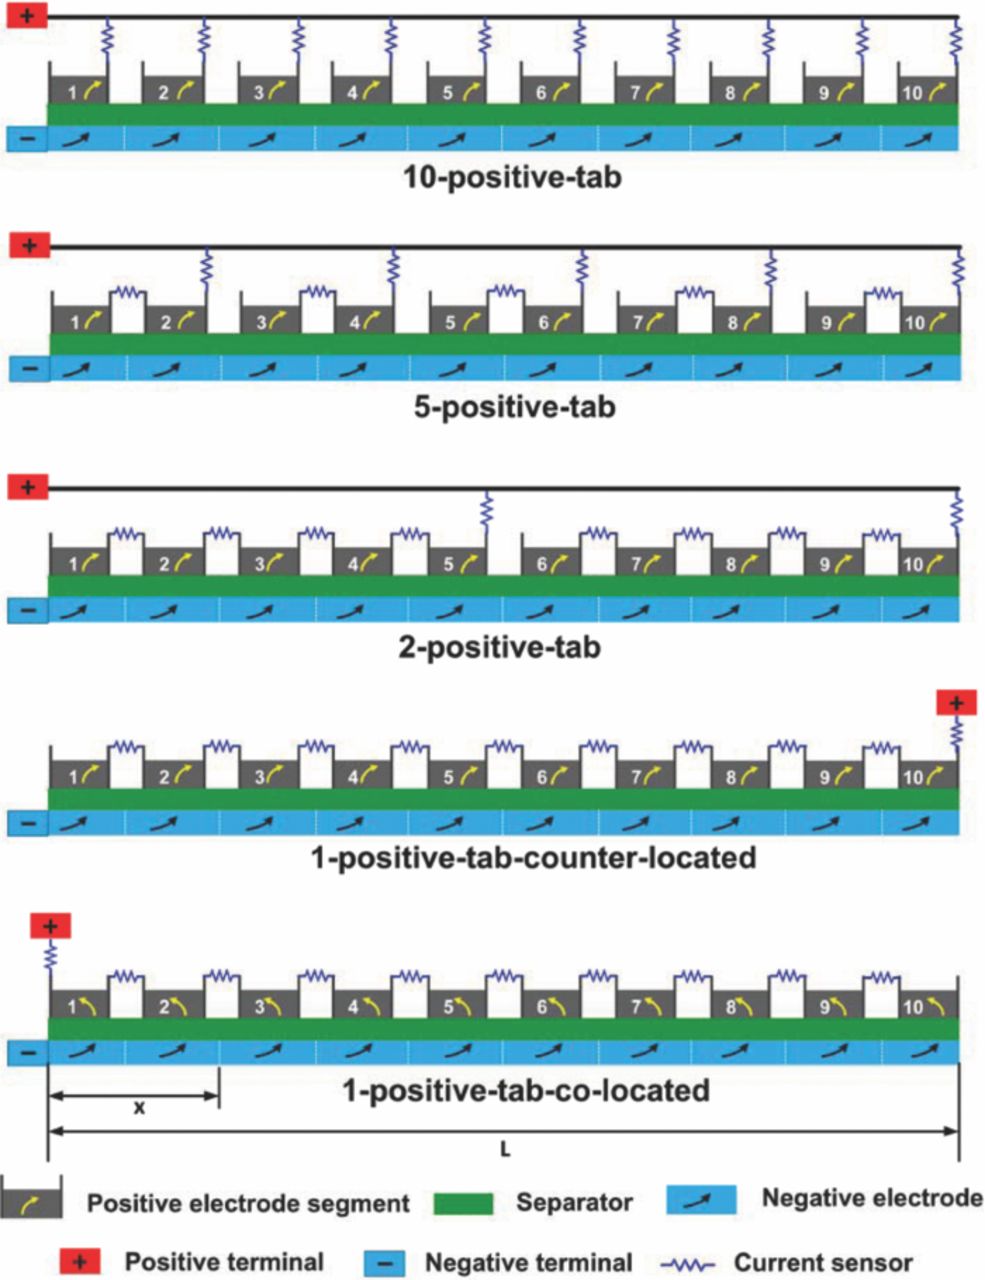
Figure 1. Schematic of 5 cell configurations with different positive tab numbers and locations.
Experimental
Test cell
The experimental cell used in this study is the same as reported in our previous paper.13 It consists of a pouch cell using lithium iron phosphate and graphite as positive and negative electrode materials. Aluminum foil (15 um thick) and copper foil (10 um thick) are used as positive and negative current collectors, respectively. Celgard 2320 PP/PE/PP trilayer membrane (20 um thick) is used as separator. 1.2 M LiPF6 in EC:EMC:PC (45:50:5 v%) is used as electrolyte. As schematically shown in Fig. 1, the positive electrode consists of 10 segments while the negative electrode and separator are non-segmented. The negative electrode has one tab which serves as the negative terminal of the battery cell. Every positive electrode segment has two tabs, which make it possible to reconfigure the battery cell with different positive tab numbers and locations. For more details about this cell design, please refer our previous paper.13
Experimental system
To generate different current distribution and overall performance, the 10 positive electrode segments are connected in five different ways to represent cases with different tab configurations, as can be seen from Fig. 1. For example, in the 10-positive-tab case, all the 10 segments are connected in parallel to a bus wire, representing a cell design with 10 positive tabs and 1 negative tab. In the 1-positive-tab-co-located case, all the 10 segments are connected in series and one tab of segment 1 is used as positive tab, representing a cell design with one positive tab located at the same end of negative tab.
To measure local currents in each segment, a current sensor (shunt resistor, PLV7AL, 2 mΩ ± 0.5%, Precision Resistor Co., USA) is connected between every segment and bus wire or between two adjacent segments according to the configurations in Fig. 1. Voltage drops across these shunt resistors are measured by a multi-channel data acquisition (DAQ) unit (34970A, Agilent Technologies, USA), which are then converted to local currents. A battery tester (BT2000, Arbin Instruments, USA) is used to control the overall current/voltage of the experimental cell. Overall cell voltage is also recorded by the DAQ. All the data reported in this paper are recorded by the DAQ with a time interval of one second.
Test procedures
Before every test, the battery tester and DAQ are started and rested for one hour, then the experimental cell is fully charged at room temperature (21 ± 1°C) using a Constant Current-Constant Voltage (CC-CV) protocol (1.2 A, 3.6 V max, 0.05 A cutoff). The experimental cell is rested for one hour after charge, allowing open circuit voltage (OCV) and temperature of the cell to reach equilibrium before discharge. For all the tests in this paper, the experimental cell is discharged at constant current of 2.4 A (1 C) until its voltage drops to 2.7 V.
Results and Discussion
Comparison of overall performance
Fig. 2 shows overall performance of the experimental cell with different tab configurations. For convenience of comparison, the discharge capacity with 10-positive-tab configuration is used to calculate overall DOD for all the cases. It was verified that the capacity in the 10-tab case agreed within 1% with a coin cell constructed with same materials. Thus, the overall DOD in 10-tab case is 100%. As expected, tab number and location have significant effects on the overall performance of the experimental Li-ion battery cell. The cell voltage and discharge capacity are generally lower with fewer tabs, although the difference between 5-tab case and 10-tab case is very small. With same positive tab number, the 1-tab-co-located case has initially higher but then lower cell voltage than 1-tab-counter-located case. Further quantitative examination shows that discharge capacity in 1-tab-co-located case is ∼79% of that in 10-tab case, and discharge energy is even lower, ∼75%. Discharge capacity and energy in 1-tab-co-located case are ∼90% of that in 1-tab-counter-located case.
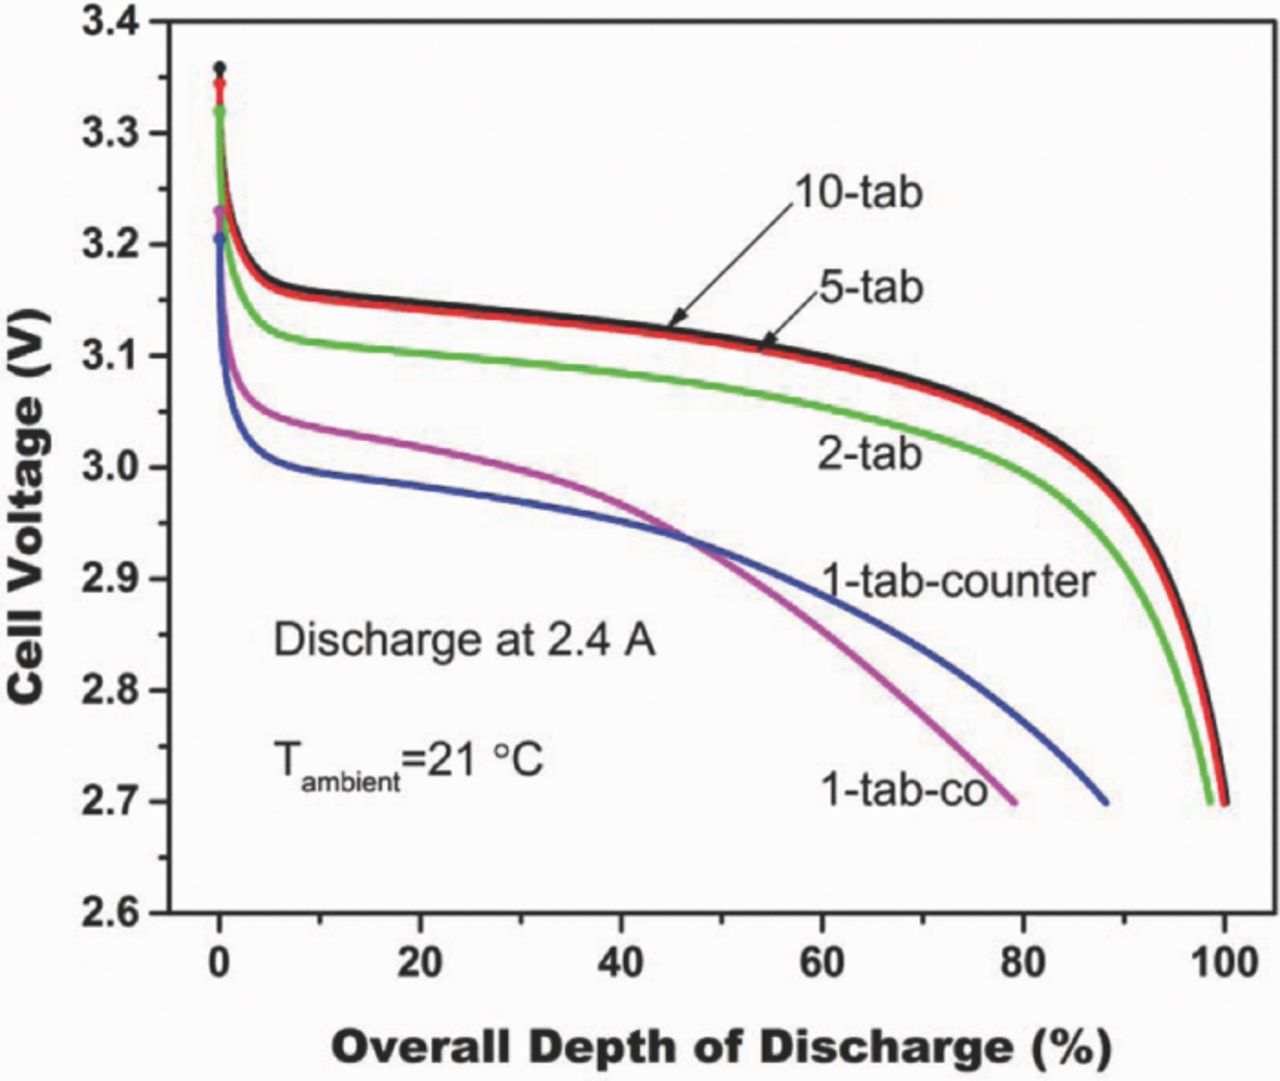
Figure 2. Overall performance with different positive tab configurations.
The generally lower cell performance with fewer tabs results directly from higher cell resistance. As can be seen from Fig. 1, with separator and negative electrode the same, all the 10 positive electrode segments are connected in parallel in the 10-tab case, the overall cell resistance is lower than that in other cases in which some or all positive segments are connected in series. Lower internal resistance leads to lower voltage drop for the same current, so the cell voltage of the 10-tab case is higher than that in other cases at the same DOD. As to be shown in the following section, the higher resistances in cases with fewer tabs can be correlated with less uniformity of current distribution.
Causes of the very different performance between 1-tab-coutner-located case and 1-tab-co-located case are not straight forward from overall performance comparison. But as will be shown later, the large variation in performance can be explained clearly by current density distributions in the two cases.
Current distribution with different tab numbers
Spatial-temporal current distributions in the experimental battery cell with different tab numbers are obtained in this study. The results of 10-tab case are reported in details in our previous paper10 and not repeated here. Results of 5-tab case, temporal variation and spatial distribution of local currents, are shown in Fig. 3 and Fig. 4, respectively. Note that the local current defined in this work is the current generated from a segment of the electrode and is not the current flowing through a current collector. Results of 2-tab cases and 1-tab-counter-located cases are shown from Figs. 5 to Fig. 8. For convenient comparison among different cases, the local currents, IN, are made dimensionless after being normalized by the average current, IAverage. The cell is discharged at 1 C in this study, so the dimensionless local current can be also considered as local C rate. In the temporal variation results, the discharge time is made dimensionless by using overall DOD. In the spatial distribution results, the location of segment electrode is made dimensionless by using relative distance from the negative terminal, as schematically indicated in Fig. 1. Note that all the data points (recorded every second) are used to plot the temporal variation curves of local currents, but numbers of symbols on the curves are purposely reduced for convenient identification of different local currents.
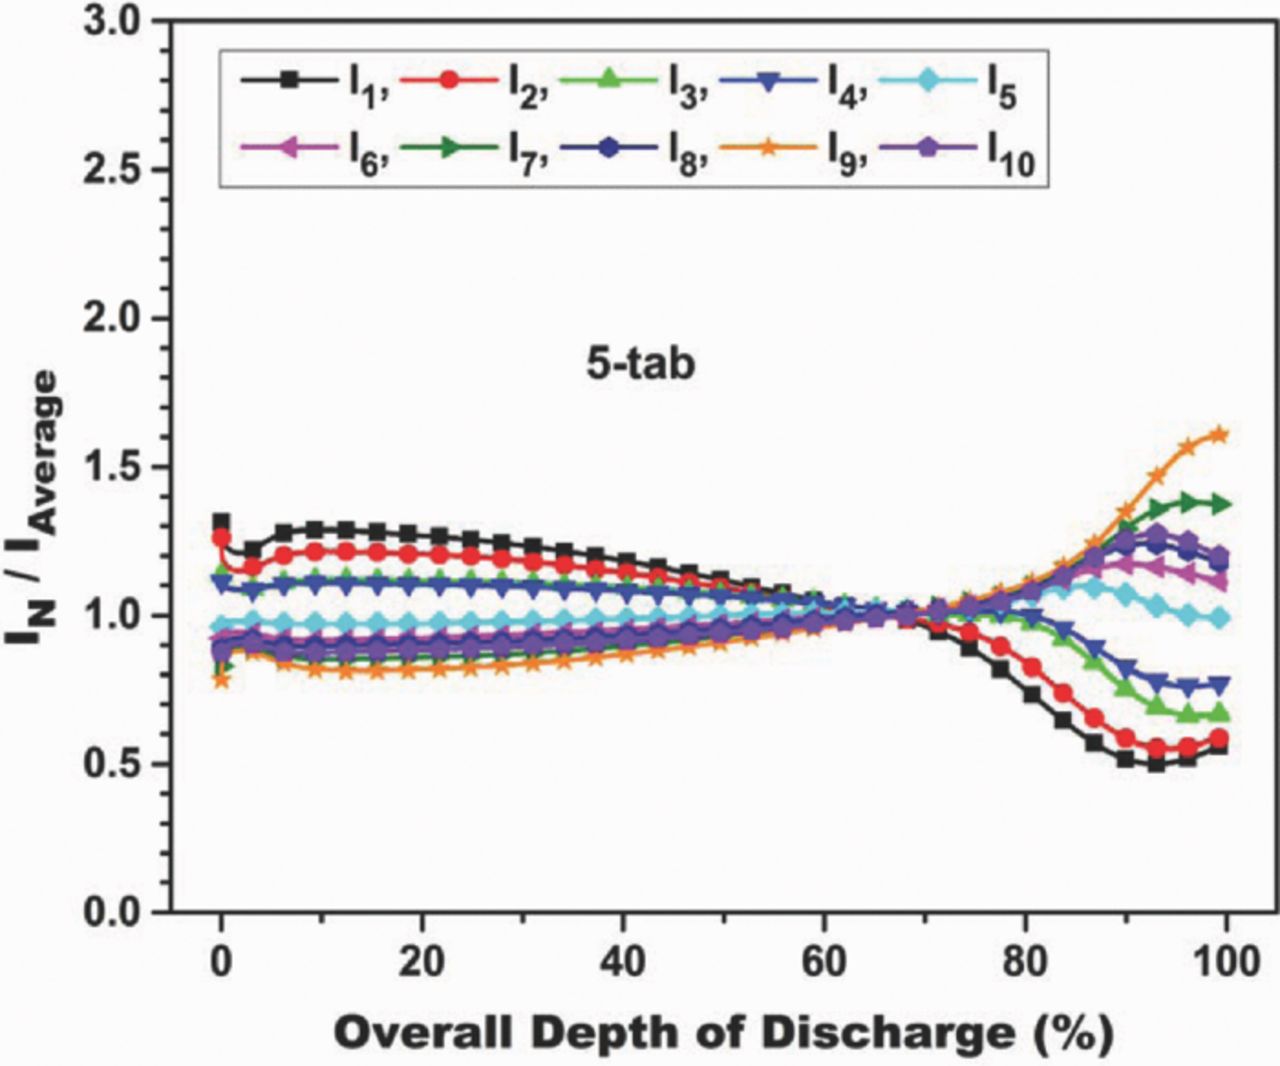
Figure 3. Variation of local currents during discharge in 5-tab case.
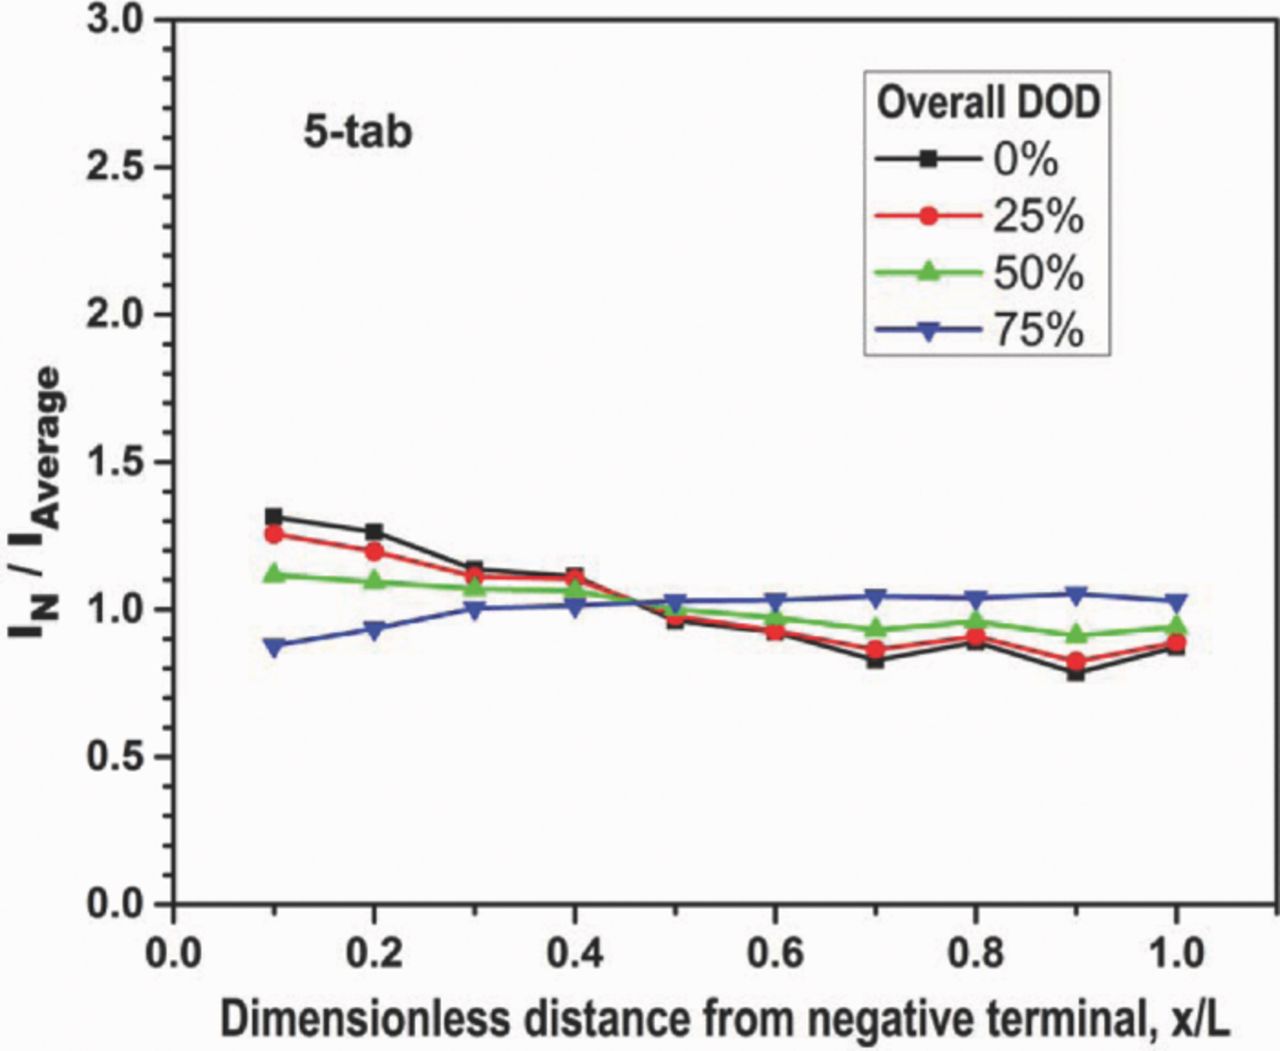
Figure 4. Spatial current distribution in 5-tab case.
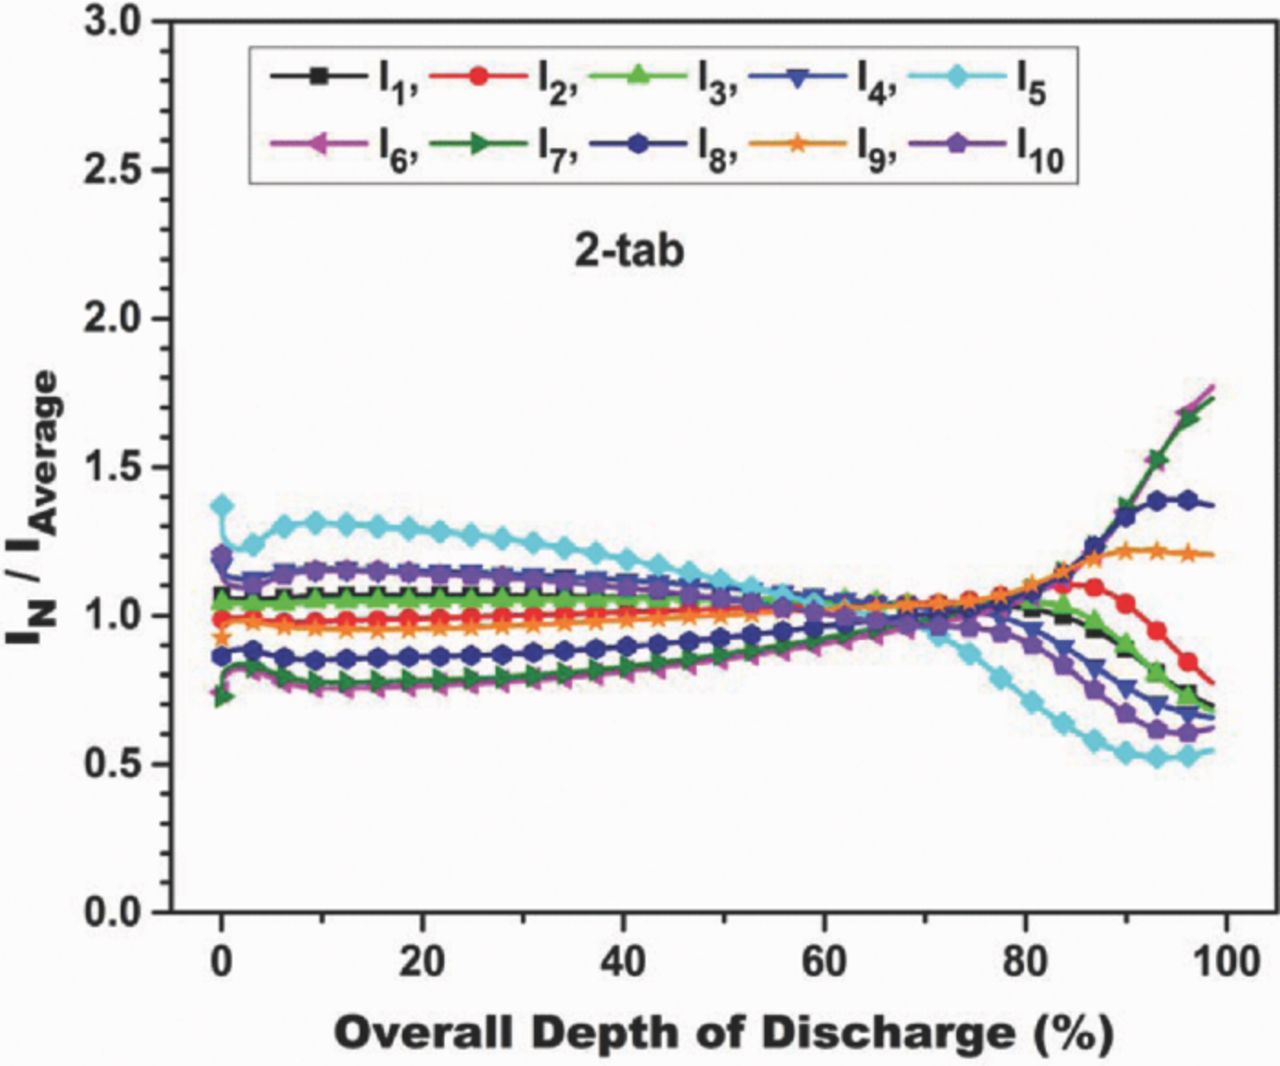
Figure 5. Variation of local currents during discharge in 2-tab case.
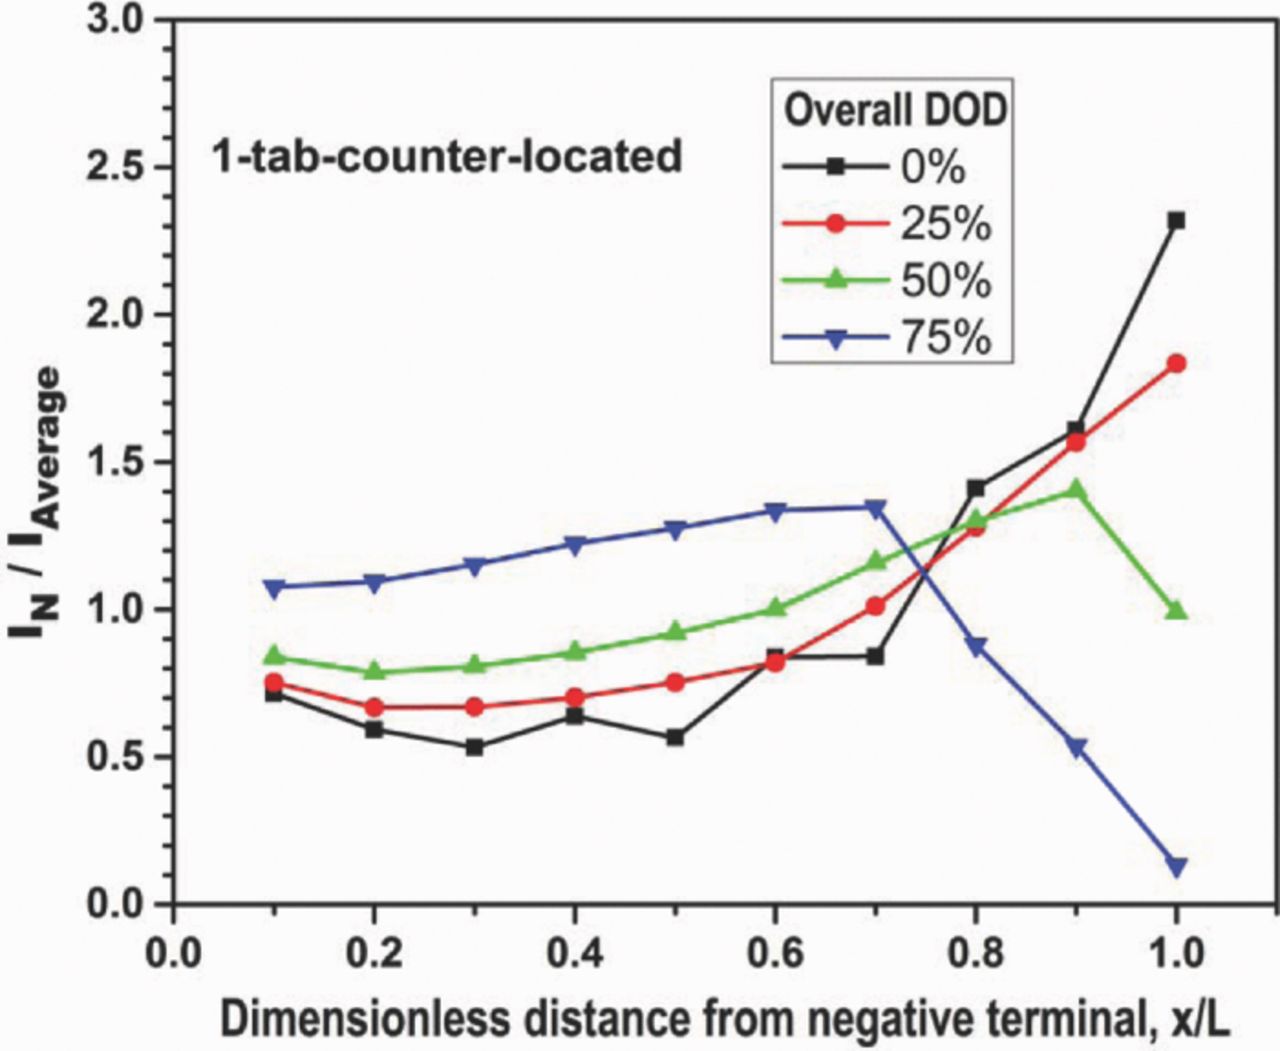
Figure 8. Spatial current distribution in 1-tab-counter-located case.
Fig. 3 and Fig. 4 show that current distribution in the 5-tab case is very similar to that in the 10-tab case.13 Initially, segments closer to the negative tab have higher local currents. Towards the end of discharge the current distribution reverses in pattern. As revealed in our previous paper,13 the non-uniformity of initial current distribution can be attributed to the ohmic potential drop along the negative current collector, and the reversal in current distribution pattern can be attributed to the non-uniformity of local state of charge (SOC) caused by uneven current production in early stages.
Fig. 5 and Fig. 6 show the temporal variation and spatial distribution of local currents in the 2-tab case. While the temporal variation of local currents seems similar to that in 5-tab case, the spatial distribution results show that the distribution is actually quite different. In particular, current distribution in the upstream segments (1 to 3) is rather uniform and remains almost unchanged during a wide range of discharge. This can be attributed to the counteracting effects of positive side current collector resistance and negative side resistance. As can be seen from Fig. 1, on the positive side, segments 1 to 5 are connected in series in 2-tab case. Local current in segment 5 flows directly to the bus wire while local currents in segments 1 to 4 must flow through downstream segments before flowing into the bus wire. Longer travel distance through positive side current collector, thus higher resistance, tend to make upstream local currents lower. On the contrary, the negative side current collector resistance tends to make upstream local currents higher as discussed earlier. The uniform current distribution in upstream segments 1 to 3 suggests that counteracting effects of positive side current collector resistance and negative side current collector resistance reach balance in these segments.
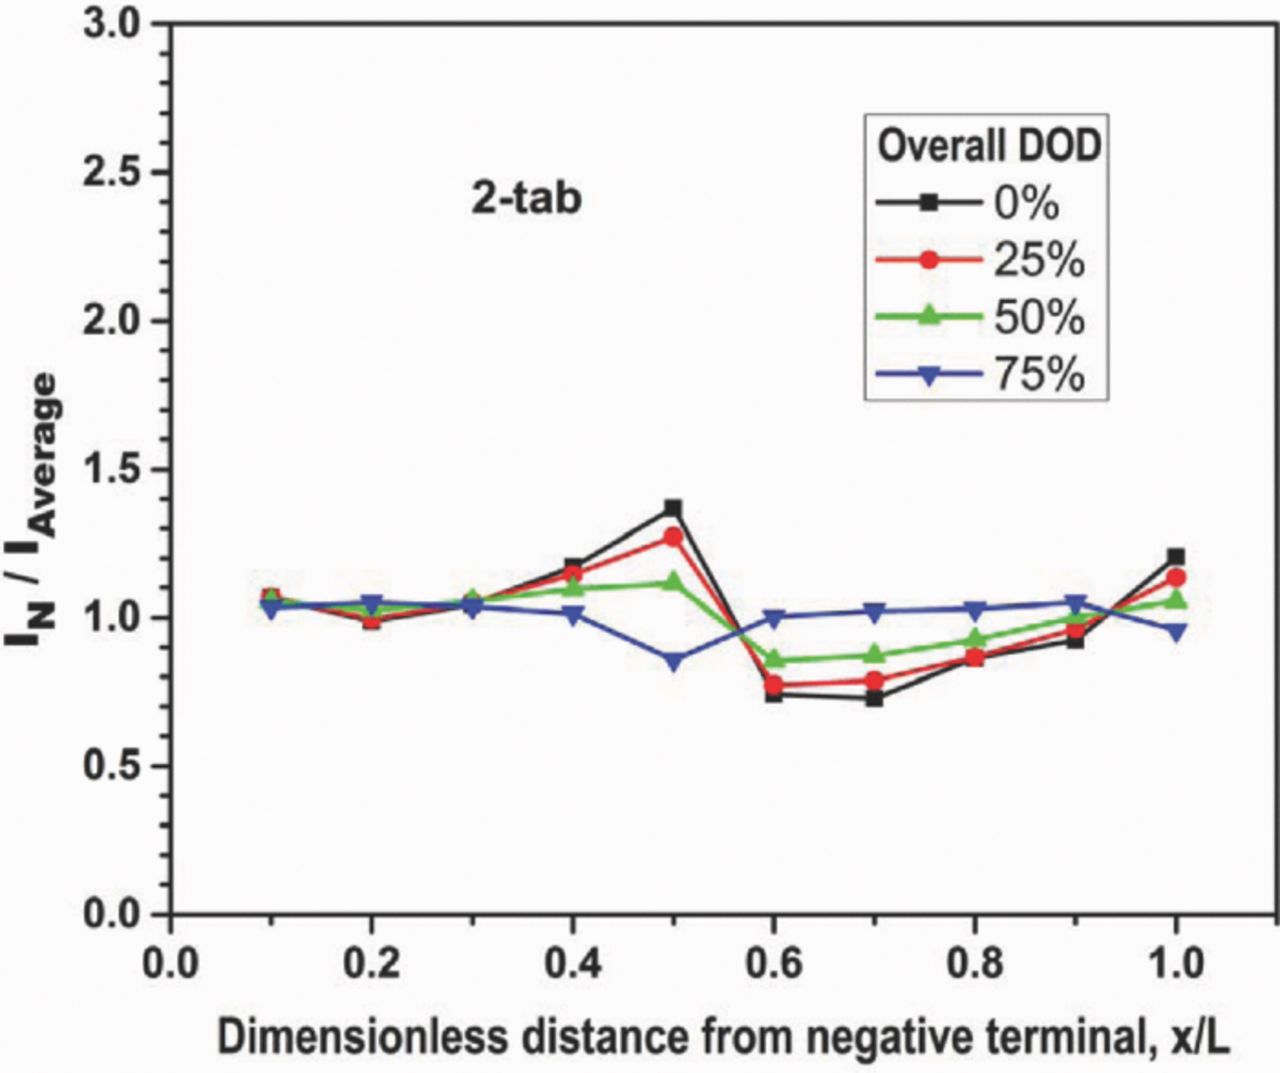
Figure 6. Spatial current distribution in 2-tab case.
Fig. 7 and Fig. 8 show temporal variation and spatial distribution of local currents in the 1-tab-countered-located case. It can be seen that the current distribution is very different from that in above cases. First, the current distribution is less uniform. Second, local current in segment 10 has the highest initial value and becomes lowest near the end of discharge. The very non-uniform current distribution at beginning of discharge can be also attributed to the effects of current collector resistance, especially the positive side. As shown in Fig. 1, segments 1 to 10 are connected in series in this 1-tab-counter-located case. Local currents in segments 1 to 9 must flow through downstream segments, and the positive side resistance of downstream segments tends to make upstream local currents lower and downstream local currents higher. In this experimental cell, the resistance of current collector on positive side consists of segment aluminum foil resistance, segment tab resistance, and current sensor resistance, making positive side resistance higher than the negative side. As a result, the effects of positive side resistance on current distribution are dominant and segment 10 generates the highest initial local current. Nevertheless, the counteracting effects of negative side current collector resistance can be still observed from the initial current distribution, in which segments 1 and 2 generate higher local currents than segment 3.
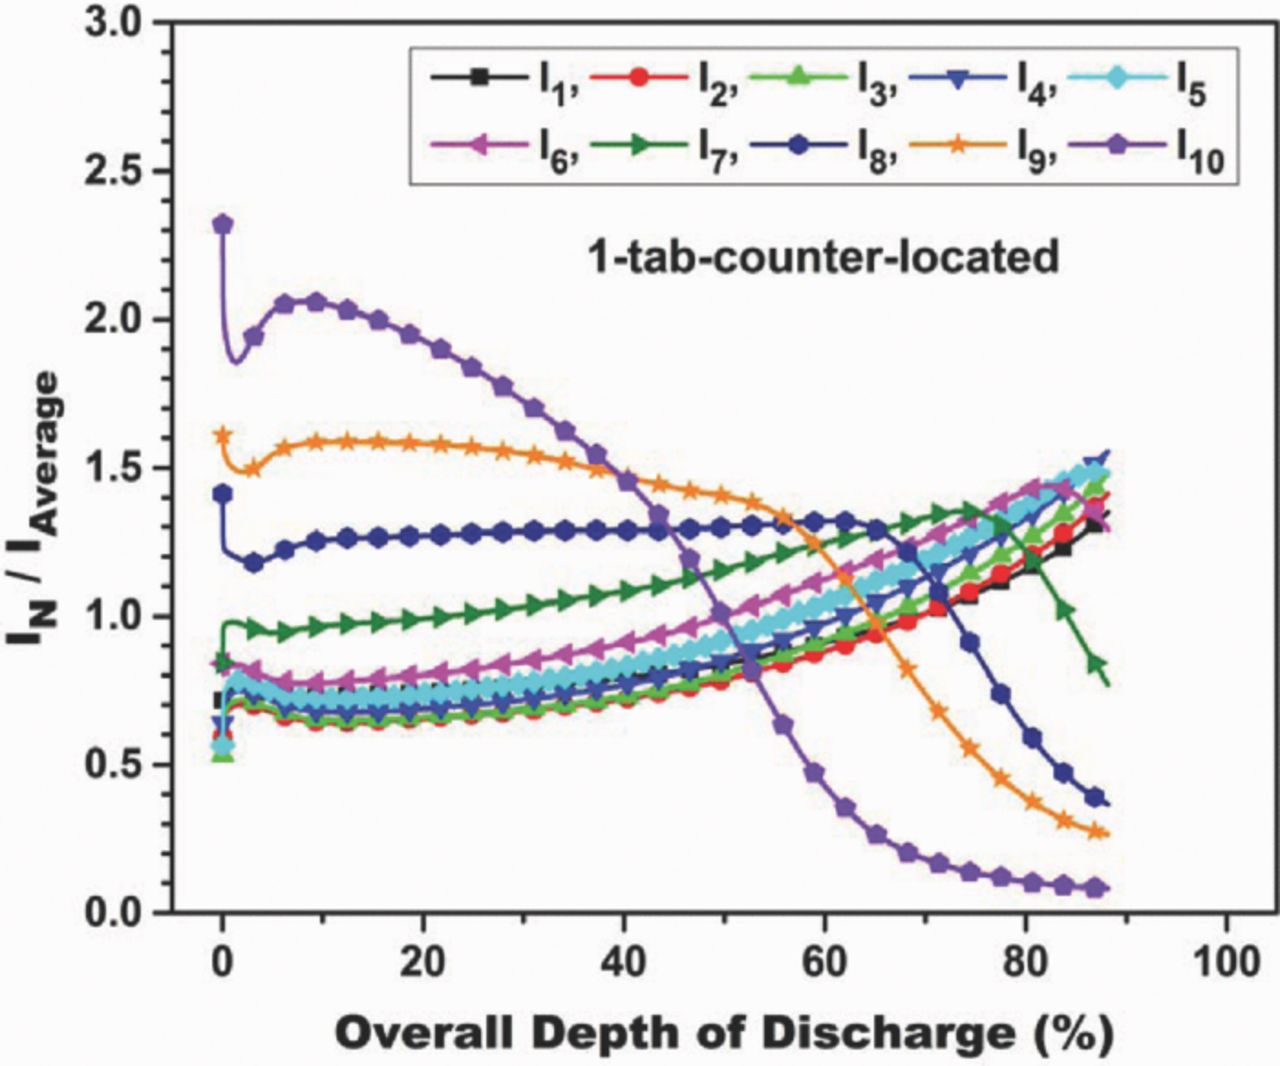
Figure 7. Variation of local currents during discharge in 1-tab-counter-located case.
Higher initial local current leads to faster depletion of active material. As can be seen in Fig. 7, the local current in segment 10, which has highest initial value, quickly depletes and becomes lowest. The depletion then propagates upstream as discharge proceeds.
The additional resistance of positive segment tabs and current sensors make the total resistance of positive side current collector in this segmented cell higher than that of a conventional non-segmented cell. It should be noted, however, that battery models validated by the distribution data in this work can be used to explore various cases, including the case that both positive and negative electrodes are non-segmented.
Current distribution with different tab location
As schematically shown in Fig. 1, the only difference between 1-tab-co-located case and 1-tab-counter-located case is the positive tab location. So comparison of current distribution between these two cases shows the effects of tab location. Fig. 9 and Fig. 10 show the temporal variation and spatial distribution of local currents in the 1-tab-co-located case. From comparison with Fig. 7 and Fig. 8, it can be seen that the current distribution in this case is almost opposite to that in the 1-tab-counter-located case, and the current distribution is even less uniform.
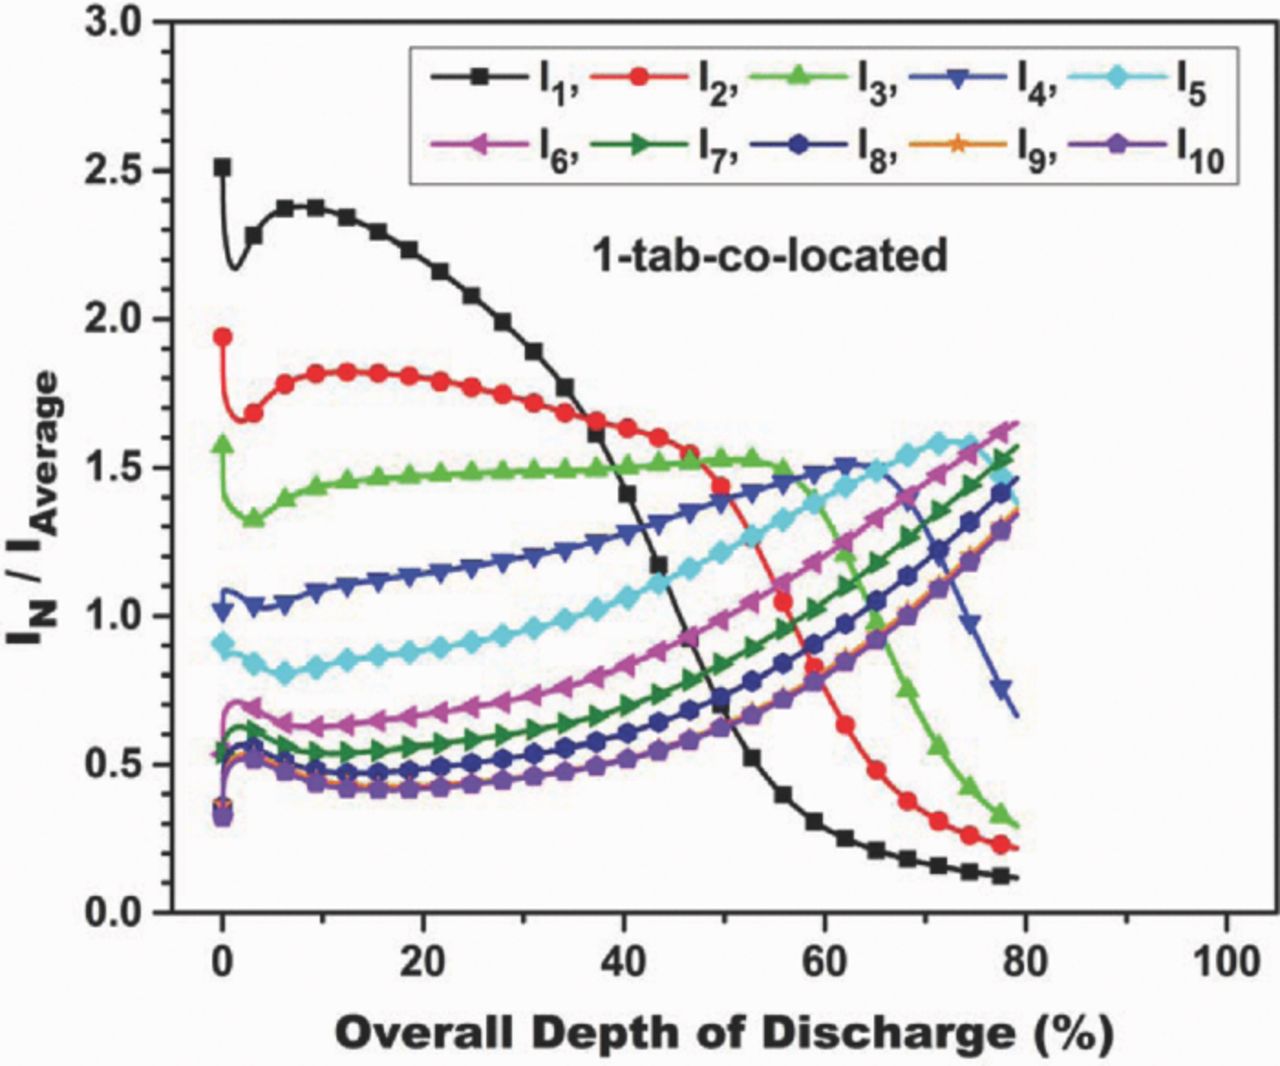
Figure 9. Variation of local currents during discharge in 1-tab-co-located case.
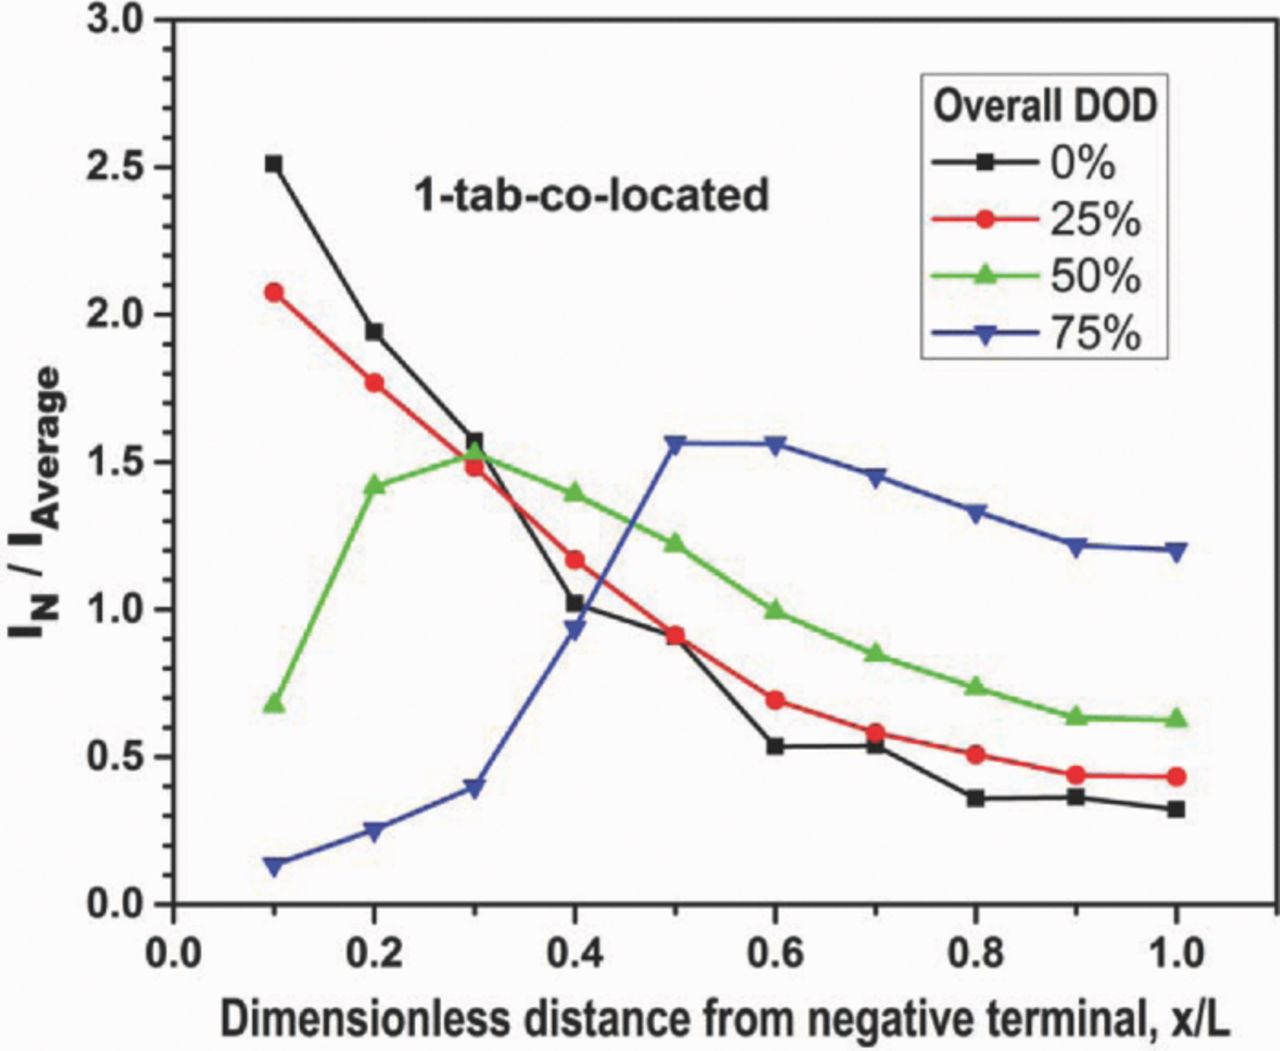
Figure 10. Spatial current distribution in 1-tab-co-located case.
Difference of current distribution in the two cases can be attributed to how the effects of positive current collector resistance and negative current collector resistance interact. As discussed above, in the 1-tab-counter-located case, the effects of positive side resistance and negative side resistance are counteracting. In the 1-tab-co-located case, however, the effects are synergizing, both favoring higher local currents in upstream segments. Therefore, in the 1-tab-co-locate case, the local current in segment 1 is exceptionally high and that in segment 10 exceptionally low during initial period of discharge. As discharge proceeds, the stored energy in segment 1 is more quickly depleted and local current becomes lowest very quickly.
With detailed results of current distribution in the 1-tab-co-located case and the 1-tab-counter-located case, the difference of overall cell performance shown in Fig. 2 can be clearly explained. Initially, a great portion of total current is generated in upstream segments in the 1-tab-co-located case, while the situation is opposite in the 1-tab-counter-located case. So the average travel distance of local currents through the positive and negative and current collectors is much shorter in the 1-tab-co-located case. Consequently, the average resistance is lower. With the battery cell discharged at same total current, the voltage drop is lower in 1-tab-co-located case, resulting in increased utilization. As discharge proceeds, however, stored energy in upstream segments is depleted quickly due to very high initial local currents. As the depletion moves downstream, reactions in downstream segments are accelerated to keep the total current constant. As a result, the average travel distance of the total current becomes longer, with the average resistance and voltage drop becoming higher. The variation of current distribution, the average travel distance of total current and the average resistance is essentially opposite in the 1-tab-counter-located case. Therefore, the difference of cell voltage between the two cases becomes smaller as the discharge proceeds. Eventually the cell voltage in the 1-tab-co-located case becomes equal to, and then lower than, that in the 1-tab-counter-located case.
Distribution of local DOD
The current distribution results shown above indicate that non-uniform current distribution result in non-uniform utilization of active materials. To show the effects more directly, spatial distribution of local DOD is obtained from current distribution data. Fig. 11 shows the distribution of local DOD during discharge in 1-tab-co-located case. Fig. 12 shows comparison of local DOD distribution at cutoff with different tab configurations. Note that overall DOD with 10-tab configuration is assumed to be 100%, so local DOD in some segments can be higher than 100% due to non-uniform distribution of DOD.
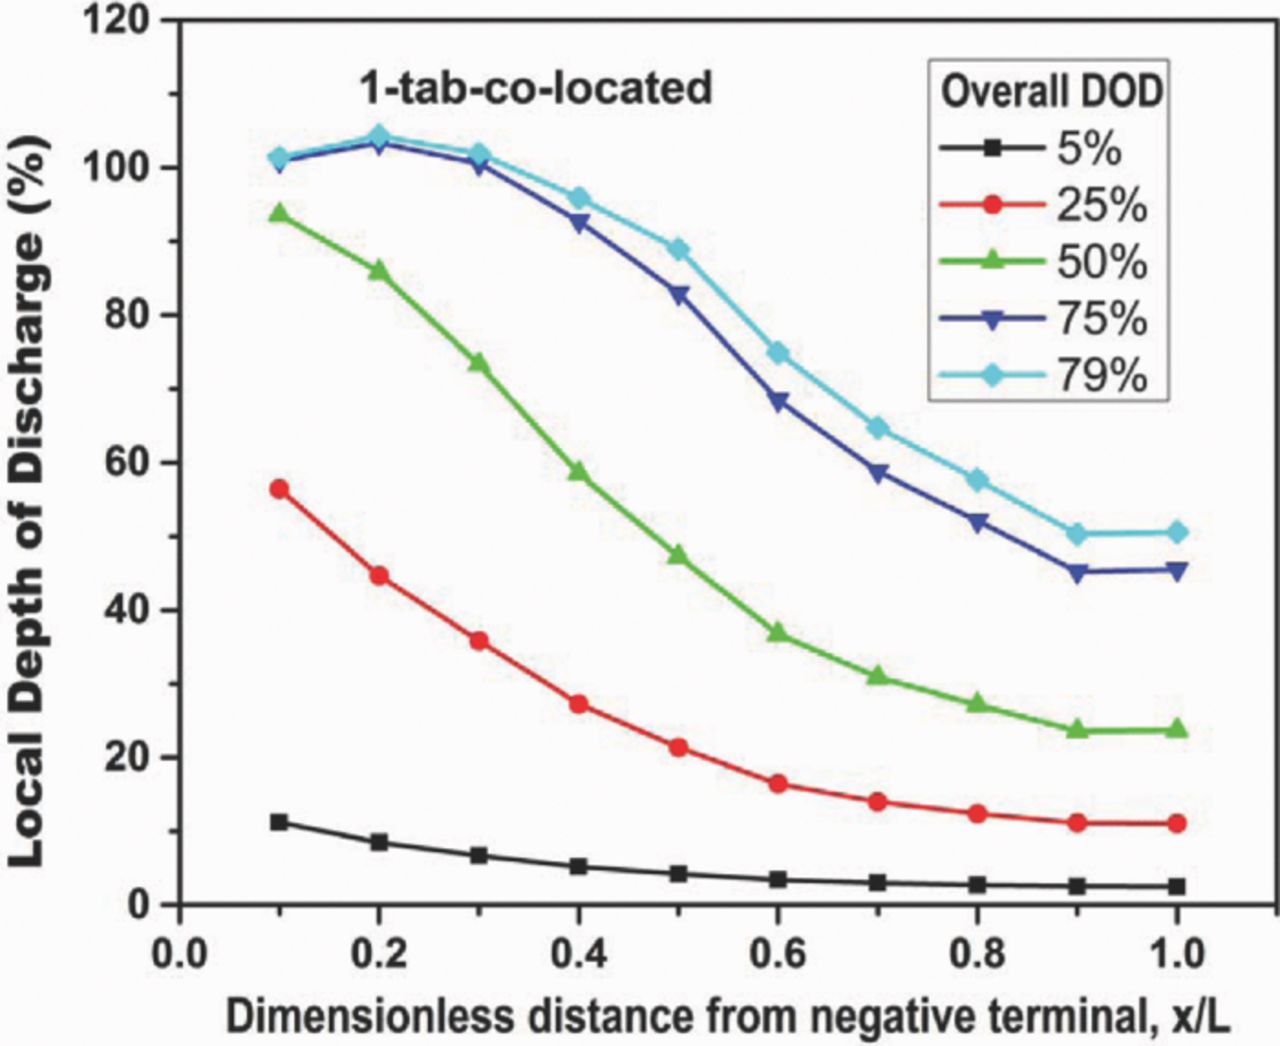
Figure 11. Distribution of local DOD during discharge in 1-tab-co-located case.
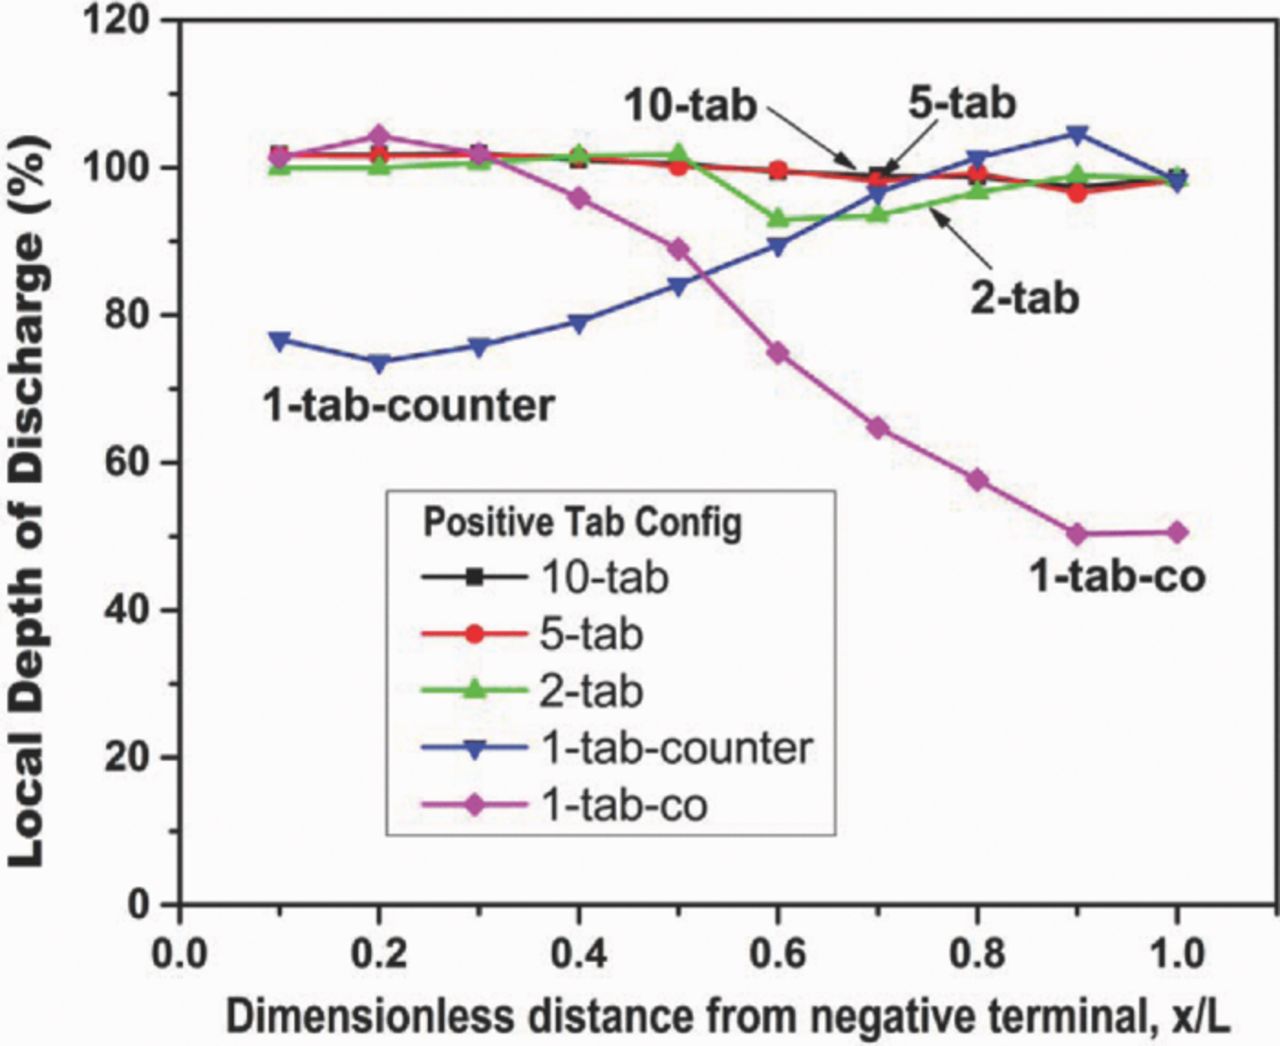
Figure 12. Comparison of local DOD distribution at cutoff with different tab configurations.
It can be seen from Fig. 11 that DOD distribution is very non-uniform due to non-uniform current distribution. When the overall DOD is 50%, the DOD of segment 1 is already above 90% while that of segment 10 is less than 25%. The DOD distribution then becomes less non-uniform due to the reversal of current distribution. When the overall DOD is 75%, the DOD of segment 1 reaches 101%, indicating depletion of active material there. By the end of discharge, with overall DOD of 79%, the local DOD of segment 10 is only 50%, suggesting a significant under-utilization of active materials due to non-uniform current distribution. It explains clearly the much lower discharge capacity and energy of 1-tab-co-located case as shown in Fig. 2.
The very non-uniform current distribution and DOD distribution in 1-tab-co-located case suggests two potential problems that can be caused by non-uniform current distribution. First, energy storage materials in downstream segments are significantly underutilized, leading to reduced energy density, an undesired waste. Second, electrodes closer to tabs produce higher local currents (higher C rate) than average and experience faster depletion during discharge, even over discharge of active materials. Previous studies show that Li-ion battery degrades faster for higher C rate and higher DOD,9–11 so electrode materials near tabs are likely to degrade faster, eventually causing the whole battery cell to degrade faster than a battery cell with uniform current distribution. Therefore, improving current distribution in Li-ion battery through design optimization is beneficial for energy density and durability, both of which are major challenges for electric vehicle applications. Correlating current distribution non-uniformity with degradation through in-situ measurement of current distribution in aging tests can provide more insights about large format Li-ion battery degradation. Further research efforts along these directions are warranted.
It is worth noting that while the 1-tab-co-located case shows higher cell voltage than the 1-tab-counter-located case during initial discharge, current distribution and DOD distribution are less uniform and discharge energy is lower in the former case. Therefore, the 1-tab-co-located configuration should be avoided in tab design.
The non-uniform utilization of active materials in 1-tab-co-located case is further demonstrated in Fig. 12, in which DOD distributions at cutoff in different cases are compared. It can be seen that the DOD distribution in the 10-tab and 5-tab cases are very similar and rather uniform, with only downstream segments slightly under-utilized. In comparison, some segments are much less utilized in other cases depending on the tab configuration, particularly in the 1-tab-co-located and 1-tab-counter-located cases. It is interesting to note that local DOD of upstream segments in the 1-tab-co-located case is very similar to the 10-tab case and 5-tab case, while that of downstream segments is much lower. This clearly shows the effects of current distribution on energy utilization of Li-ion battery cell.
The very similar overall performance, current distribution and DOD distribution in 5-tab case and 10-tab case suggests that excessive tab number helps little. Actually, excessive tabs increase the complexity and cost of battery cell manufacturing, which is not desired.
Correlation between energy density and current distribution non-uniformity
The current distribution and DOD distribution results presented above indicate that non-uniform current distribution lead to underutilization of active materials and lower energy density. To show the correlation between non-uniform current distribution and energy density more clearly, discharge energy is plotted as a function of current distribution non-uniformity factor in Fig. 13. Discharge energy is normalized by that during C/5 discharge with 10-tab configuration, which is assumed to be the maximum energy available from the experimental cell. The current distribution non-uniformity factor is defined as time-averaged standard deviation of normalized current distribution:12
![Equation ([1])](https://content.cld.iop.org/journals/1945-7111/160/11/A2299/revision1/jes_160_11_A2299eqn1.jpg)
in which Δt is the time step between data recording of local current in each segment (1 second in this study), M is the total time step number during a whole discharge period, σi is the standard deviation of local current at each time step normalized by average current:
![Equation ([2])](https://content.cld.iop.org/journals/1945-7111/160/11/A2299/revision1/jes_160_11_A2299eqn2.jpg)
As Eq. 1 and 2 imply, the less uniform the current distribution is, the larger the non-uniformity factor is. If current distribution is always uniform during whole discharge progress, the non-uniformity factor would be 0.
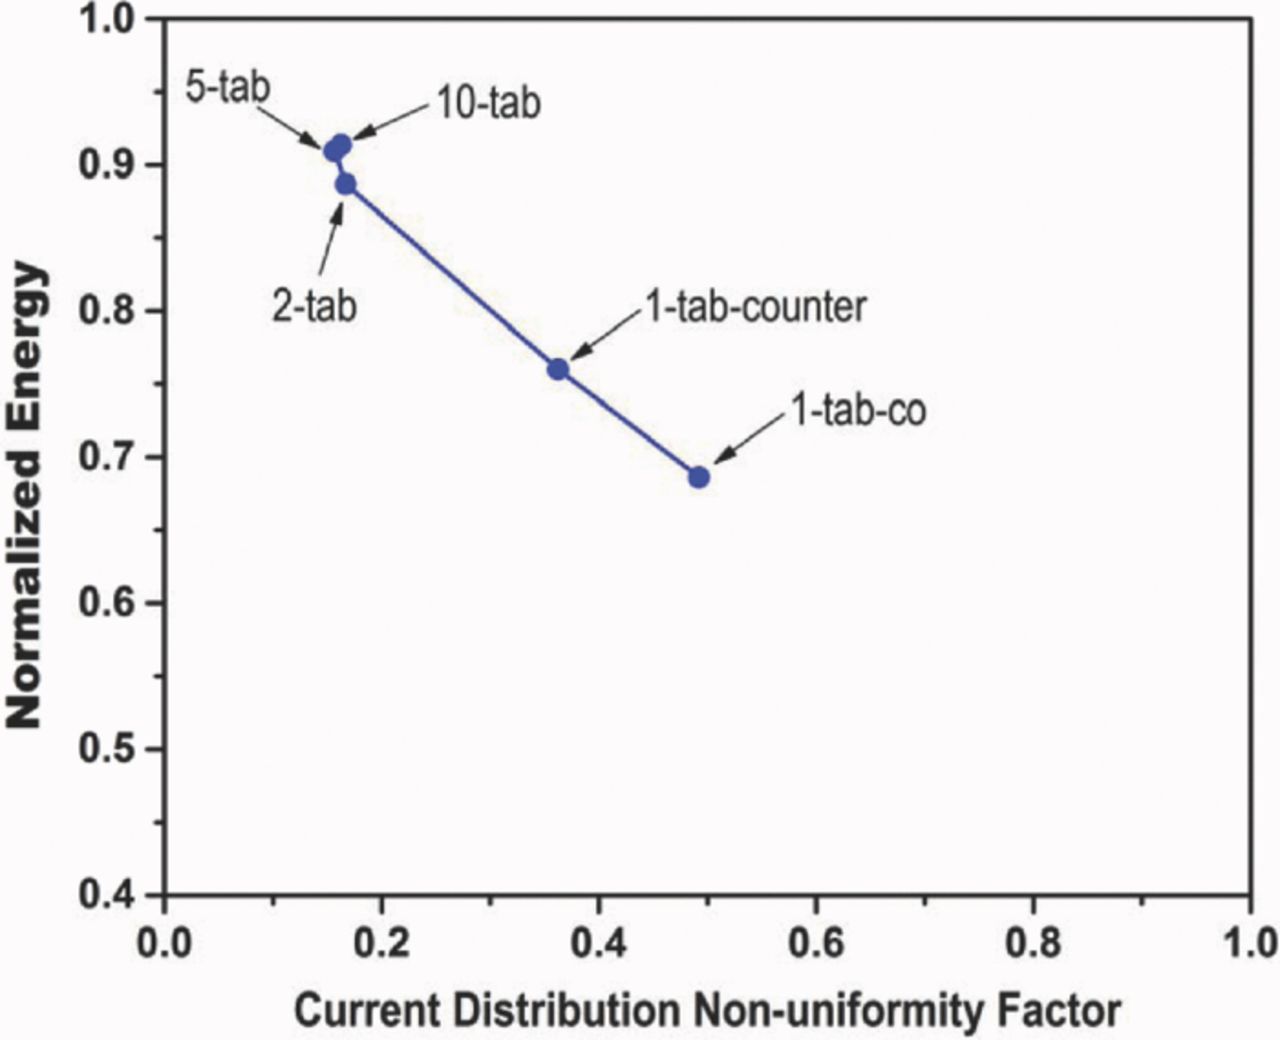
Figure 13. Normalized discharge energy vs. current distribution non-uniformity factor.
Fig. 13 shows a quantitative correlation between discharge energy and current distribution non-uniformity. The normalized energy decreases almost linearly with the increase of current distribution non-uniformity factor. It demonstrates a significant effect of current distribution non-uniformity on energy density and the importance of improving current distribution uniformity in energy-dense Li-ion batteries for vehicle energy storage.
Conclusions
By measuring current distribution in 2.4Ah Li-ion cells with five different tab configurations, we investigate the effects of tab number and location on current distribution and energy density of an otherwise identical battery and have demonstrated their significant influences. Fewer tabs typically cause lower performance but excessive tabs do not help. 1-tab-co-located configuration can cause much lower overall performance and very non-uniform current distribution, and should be avoided in tab design. The effects of tab configuration on overall performance are directly linked to the current distribution. It is experimentally shown for the first time that discharge energy of a Li-ion cell decreases almost linearly with the current distribution non-uniformity factor. Non-uniform current distribution results in non-uniform utilization of active materials, reducing energy density, and likely also accelerating degradation of Li-ion batteries. Further research efforts to improve current distribution uniformity through design optimization and to investigate the effects of current distribution non-uniformity on large format Li-ion battery degradation are warranted. In addition, a companion modeling study should be performed to use the data generated herein for validation.
Acknowledgments
The authors gratefully acknowledge funding from The United States Department of Energy (CAEBAT Program) through a subcontract from EC Power. The authors are also thankful to Wei Zhao and Dr. Yancheng Zhang for many valuable discussions and to EC Power for providing the segmented cell fixture used in this work.