Abstract
The study of particle size effect provides the fundamental understanding of the active sites that is necessary for guiding the design and development of better catalysts. Here we report a systematic investigation of particle size effect of hydrogen oxidation and evolution reaction (HOR/HER) on carbon supported Pd nanoparticles with sizes ranging from 3 to 42 nm in both acidic and alkaline electrolytes using rotating disk electrode (RDE) method. Similar particle size effect was obtained in both acid and base: the HOR/HER activity in terms of specific exchange current density increases as Pd particle size increases from 3 to 19 nm, and then reaches a plateau with activity similar to that of bulk Pd. The enhanced activity with rising particle size could be attributed to the increased ratio of the sites with weaker hydrogen binding energy revealed in cyclic voltammograms (CVs). Pd catalysts with different Pd particle sizes all showed much higher HOR/HER activity in acid than in base, which is largely attributed to their smaller hydrogen binding energy in acid evidenced by the lower potential of the underpotential deposited hydrogen (Hupd) peak in CVs as well as the smaller activation energy in acid.
Export citation and abstract BibTeX RIS

This is an open access article distributed under the terms of the Creative Commons Attribution 4.0 License (CC BY, http://creativecommons.org/licenses/by/4.0/), which permits unrestricted reuse of the work in any medium, provided the original work is properly cited.
Hydrogen oxidation and evolution reactions (HOR/HER) are of substantial practical importance for their application in H2-fueled fuel cells and water electrolyzers. The high HOR/HER activity on Pt in acid (exchange current density of about 216 mA/cm2Pt at 313 K1) enables the low loading of Pt (e.g. ≤0.05 mgPt/cm2) at the anode of a proton exchange membrane fuel cell (PEMFC). The cathode of a PEMFC however still requires a high loading of Pt (e.g. 0.2 mgPt/cm2) because the oxygen reduction reaction (ORR) in acid is sluggish. By contrast, hydroxide exchange membrane fuel cells (HEMFCs) offer the possibility to replace precious metals (e.g. Pt) required for both the ORR on the cathode and HOR on the anode with non-precious metals or metal-free catalysts owing to their alkaline nature, which could reduce the cost of fuel cells substantially. While much progress has been made in the search for non-precious metal or metal-free catalysts for ORR in both acid2–4 and base,5,6 non-precious metal-based catalysts with sufficient activity and stability for HOR remain a challenge.7 Additionally, the HOR/HER activity on Pt in base is about two-orders of magnitude lower than that in acid1,8 and thus a much higher Pt loading is needed on the anode of an HEMFC in order to achieve the same anode performance as a PEMFC. Therefore, the development of affordable and active HOR catalysts is highly desirable.
Pd, a member of the Pt-group-metals, is not only 50% cheaper than Pt ($724/oz for Pd vs. $1449/oz for Pt for 2010 – 2015 averaged price) but also about 50 times more abundant in the known natural reserves. Pd and Pd-based catalysts have been studied as HOR catalysts in fuel cells,9,10 and lower HOR/HER activities were observed on Pd/C than bulk Pd,11–13 suggesting a particle size effect. However, a fundamental understanding of HOR/HER kinetics on Pd and a systematic study of the particle size effect are largely missing.
Particle size effect on Pd/C has been investigated for various reactions including ORR in both acid and base14,15 and formic acid oxidation reaction in acid.16 For HOR/HER, studies are mainly focused on Pt. Antoine et al. reported an increase of specific and mass HOR activity for smallest Pt particles;17 whereas Sheng et al. showed no particle size effect for HOR/HER on Pt in alkaline media as they obtained similar exchange current densities on both 2 nm Pt nanoparticle supported on carbon and bulk polycrystalline Pt.8 Sun et al. reported increased activity with increased particle size for HOR/HER on 2–7 nm Pt nanoparticles in acid,18 and Ohyama et al. reported the same trend for HOR/HER on 2–4 nm Pt nanoparticles in base.19 However, the rotating disk electrode (RDE) method cannot be used to measure HOR/HER activity on Pt in acid due to the overlapping polarization and concentration overpotential curves,8,20 and thus the results from Sun et al.18 via RDE measurements might not be reliable. Using the H2-pump method in a proton exchange membrane fuel cell configuration, Durst et al. characterized the exchange current densities of HOR/HER on 2–9 nm Pt/C and reported no particle size effect.21 Clearly, the discrepancy still exists for HOR/HER on Pt with respect to particle size effects. Ohyama et al. explored the particle size effect of HOR/HER on Ru nanoparticles in 0.1 M NaOH, and their results indicated an optimum exchange current density at particle size of 3 nm due to the optimum ratio of amorphous-like Ru on the surface at 3 nm.19 Zheng et al. reported that the specific HOR/HER exchange current density on Ir/C in 0.1 M KOH increases as particle size increases from 3 to 12 nm.22
In this study, we investigate the particle size effect for HOR/HER via RDE measurements in both acidic and alkaline electrolytes on Pd/C catalysts with the Pd particle size ranging from 3 to 42 nm. The HOR/HER activity in terms of specific exchange current density (i0) increases with rising Pd particle size in both acid and base.
Experimental
Preparation and physical characterization of palladium nanoparticles with different sizes
Carbon-supported Pd nanoparticles with varying particle sizes were prepared by annealing the commercial 20 wt% Pd on Vulcan XC-72 (Pd/C, Premetek Co.) at different temperatures in an Ar/H2 atmosphere in a tube furnace: the quartz tube was first purged with Ar for 30 min at room temperature to remove air. Furnace temperature was then raised to 100 °C at a rate of 10 °C/min in Ar and maintained at 100 °C for 30 min to remove adsorbed H2O on the catalyst. Finally, H2 was introduced into Ar (5 vol. % H2) and the temperature was increased to 300 °C, 400 °C, 500 °C and 600 °C at a rate of 10 °C/min and maintained for 2 h.14 The obtained catalysts are denoted as Pd/C-300C, Pd/C-400C, Pd/C-500C and Pd/C-600C, respectively. Diameters of Pd nanoparticles were measured from transmission electron microscopy (TEM) images obtained on a JEOL JEM-2010F TEM. X-ray diffraction (XRD) patterns of Pd samples were measured using a Philips X'Pert X-ray diffractometer with Cu Kα radiation.
Electrochemical measurements
The electrochemical measurements were conducted in a three-electrode glass cell with a double-junction silver/silver chloride (Ag/AgCl) electrode as the reference electrode, a Pt wire as the counter electrode and a glassy carbon (5 mm diameter, PINE Ins.) as the working electrode. The ink dispersions of Pd/C samples were prepared by dispersing Pd/C (20 wt%) in 0.05 wt% Nafion isopropanol solution to a final concentration of 2 mgPd/C/mL with ultrasonication for 1 h. The thin-film electrodes were prepared by pipetting 2.5 μL of the ink (2 mgPd/C/mL) once, four times or six times to achieve a final loading of 5, 20 or 30 μgPd/cm2disk. The Pd loading on the electrodes were 20 μgPd/cm2disk for all the five Pd samples measured in 0.1 M KOH prepared from KOH tablet (85 wt%, 99.99% metal trace, Sigma Aldrich). For the samples measured in 0.1 M HClO4 prepared by diluting 70 wt% HClO4 (EMD) with DI water, the final loadings for Pd/C, Pd/C-300C, Pd/C-400C were lowered to 5 μgPd/cm2disk so that the HOR/HER polarization curves will not overlap with the concentration overpotential curve, and those for Pd/C-500C and Pd/C-600C were 20 μgPd/cm2disk and 30 μgPd/cm2disk to maintain roughness factors greater than 1 due to their low electrochemical active surface areas (ECSAs).
Cyclic voltammetry experiments were performed in both Ar-saturated 0.1 M KOH and 0.1 M HClO4 electrolytes at a scanning rate of 50 mV/s in the potential range of 0.07 to 1.25 V vs. reversible hydrogen electrode (RHE). All the potentials reported were converted to the RHE scale. The electrochemical surface areas of all the Pd/C samples were determined from PdO reduction peak from cyclic voltammograms (CVs) based on a charge density of 424 μC/cm2Pd.23,24
Activity measurements for hydrogen oxidation and evolution reactions (HOR/HER) on Pd catalysts were carried out in H2-saturated 0.1 M KOH or 0.1 M HClO4 at a scanning rate of 50 mV/s and a rotating speed of 1600 rpm by cycling the potential several times until a stable polarization curve was obtained. The scanning rate was then switched to 1 mV/ to minimize the contribution of capacitance current, and the positive scan of the first cycle at 1 mV/s was reported as the HOR/HER polarization curve. The internal resistance was determined by electrochemical impedance spectroscopy (EIS) measured from 300 kHz to 100 mHz at open circuit voltage right after the HOR/HER measurement, which was then used to correct the measured potential to iR-free potential based on the following equation,
![Equation ([1])](https://content.cld.iop.org/journals/1945-7111/163/6/F499/revision1/d0001.gif)
where E is the measured potential, i is the corresponding current, R is the internal resistance, and EiR − free is the internal-resistance free potential. The internal resistances in 0.1 M KOH and 0.1 M HClO4 were determined to be about 40 and 20 Ω for, respectively.
Results and Discussion
TEM images
The Pd nanoparticle size increases as the annealing temperature rises: the number-averaged particle diameter (dnTEM) calculated by  grows from 3.2 nm for Pd/C to 33.6 nm for Pd/C-600C as shown by the TEM images and the corresponding histograms (Figure 1). The increase of standard deviation of dnTEM as particle size becomes larger (Figure 1f and Table I) is caused by the thermal annealing method, which is consistent with literature.22,25 The volume/area averaged particle diameters (dv/aTEM) calculated by
  are larger than dnTEM (Table I). The dv/aTEM is considered a better measure of average particle diameter than dnTEM for calculating the specific surface area (Sv/aTEM)26 (Table I), according to
![Equation ([2])](https://content.cld.iop.org/journals/1945-7111/163/6/F499/revision1/d0002.gif)
where ρ is the density of the metal (12.02 g/cm3 for Pd), d is the particle diameter in nm, Sv/aTEM is in unit of m2/g.
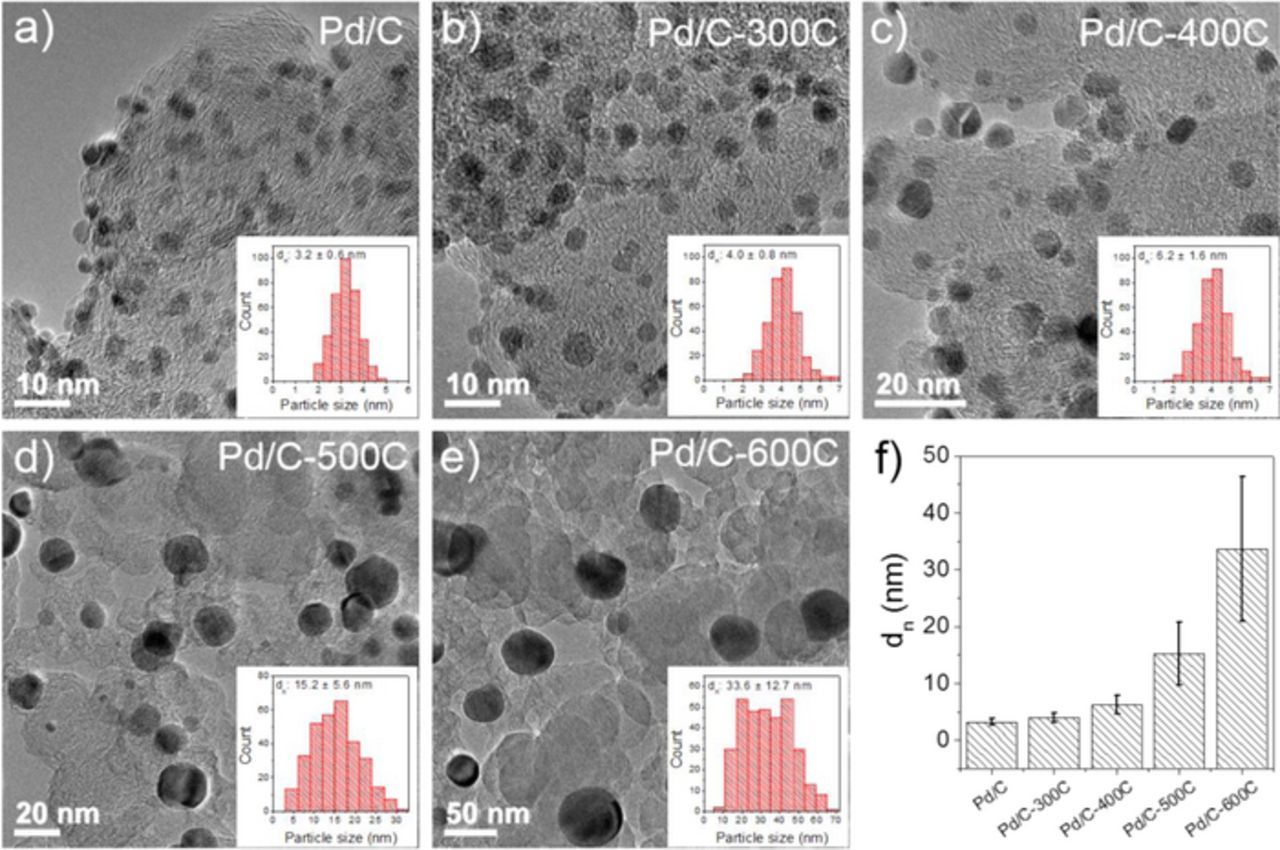
Figure 1. Transmission electron microscopy (TEM) images of (a) Pd/C, (b) Pd/C-300C, (c) Pd/C-400C, (d) Pd/C-500C, (e) Pd/C-600C and (f) number averaged particle size determined from TEM images for all Pd/C samples. Insets of (a-e) are the histograms of the particle size for each sample counted over 300 particles.
Table I. Number averaged (dnTEM) and volume/area averaged (dv/aTEM) particle diameter determined from TEM, volume averaged particle diameter from XRD (dvXRD), specific surface area calculated from dv/aTEM (Sv/aTEM), dvXRD (SvXRD) and electrochemically measured from CVs (SCV).
| dnTEM (nm) | dv/aTEM (nm) | dvXRD (nm) | Sv/aTEM (m2/gPd) | SvXRD (m2/gPd) | SBaseCV (m2/gPd) | SAcidCV (m2/gPd) | |
|---|---|---|---|---|---|---|---|
| Pd/C | 3.2 ± 0.6 | 3.4 | 3.1 | 147 | 161 | 74.9 ± 4.3 | 74.0 ± 7.1 |
| Pd/C-300C | 4.0 ± 0.8 | 4.3 | 5.9 | 116 | 85 | 64.3 ± 4.0 | 63.2 ± 4.2 |
| Pd/C-400C | 6.2 ± 1.6 | 7.1 | 6.9 | 70 | 72 | 33.4 ± 1.0 | 38.1 ± 1.2 |
| Pd/C-500C | 15.2 ± 5.6 | 19.1 | 15.2 | 26 | 33 | 17.0 ± 0.5 | 17.7 ± 0.4 |
| Pd/C-600C | 33.6 ± 12.7 | 42.4 | 19.6 | 12 | 25 | 7.0 ± 2.0 | 7.9 ± 0.2 |
X-ray diffraction
X-ray diffraction (XRD) patterns of all samples (Figure 2) exhibit diffraction peaks at 40.1°, 46.6°, 68.1° and 82.1° corresponding to (111), (200), (220) and (311) facets of Pd (JCPDS card no. 46–1043), respectively. The width of diffraction peaks width becomes narrower as the annealing temperature increases, suggesting an increase in the particle size, which is consistent with the TEM observations. The particle diameter determined from XRD, denoted as the volume-averaged particle diameter (dvXRD),26 can be calculated using the Scherrer equation,
![Equation ([3])](https://content.cld.iop.org/journals/1945-7111/163/6/F499/revision1/d0003.gif)
where λ is the wavelength of the X-ray wavelength (1.54 Å), △(2θ) is the full width of the half maximum (FWHM) of the diffraction peak and θ is the Bragg angle. Pd(111) peak was used in the particle size calculations. The dv/aTEM and dvXRD agree well for Pd/C, Pd/C-300C, Pd/C-400C and Pd/C-500C. However, the average particle diameter determined by TEM is significantly larger than that determined by XRD for Pd/C-600C (Table I), which can be caused by: 1) the width of XRD patterns reflects the primary crystalline size, while particles in TEM images could be polycrystalline, i.e., agglomerates of several primary crystals. The larger the particles are, the more likely the particles are polycrystalline. 2) The particle size distribution of Pd/C-600C is broad (Figure 1f), which could introduce errors in calculating the average particle size with by counting a finite number of particles. Specific surface areas of different Pd samples calculated from dvXRD using Eq. 2, denoted as SvXRD, are comparable with Sv/aTEM (Table I).
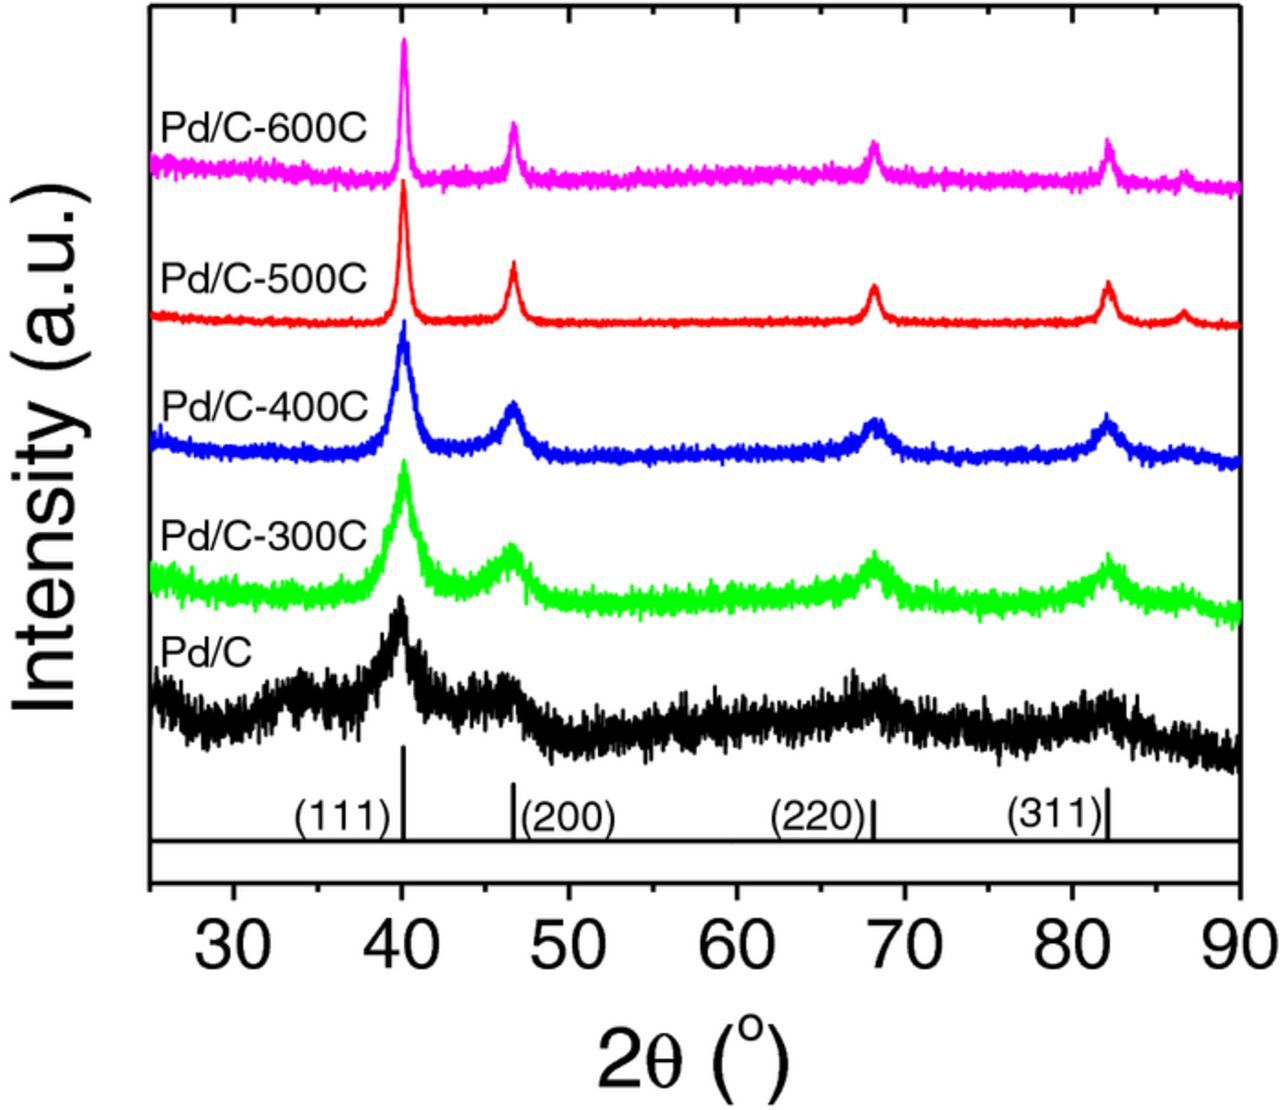
Figure 2. X ray diffraction (XRD) patterns of Pd/C, Pd/C-300C, Pd/C-400C, Pd/C-500C and Pd/C-600C.
Electrochemical surface area (ECSA) measurement from cyclic voltammograms
Specific surface areas of the supported Pd catalysts can also be measured from cyclic voltammograms (Figure 3). The lower limit was chosen to be 0.07 V to avoid the diffusion of H atom into the Pd lattice.11 In 0.1 M KOH, the underpotential deposited hydrogen (Hupd) adsorption and desorption peaks in the potential region of 0.07–0.45 V are very asymmetric and the double layer regions are not well defined (Figure 3a), making it difficult to determine surface areas using the Hupd adsorption and desorption peaks. Additionally, the Hupd desorption peaks for all the samples in 0.1 M KOH are located at around 0.35 V (Figure 3a). By contrast, the Hupd adsorption and desorption peaks are more symmetric in 0.1 M HClO4, with a well-defined Hupd desorption peak at 0.26 V and a shoulder at around 0.19 V (Figure 3b), both of which are at a lower potential than the desorption peak in base (0.35 V), and could represent different facets of Pd. When the current is normalized to the peak current after the double layer current deduction, the height of the Hupd desorption peak at about 0.26 V is fixed while that of the shoulder at about 0.19 V increases with increases of particle size (Figure 3c). The change of line shape of the Hupd desorption peak suggests a redistribution of facets in different Pd samples, which is consistent with a previous report on Pd catalysts.15 The PdO reduction peak shifts to a more positive value as Pd particle size increases (from Pd/C to Pd/C-600C sample) in both KOH and HClO4 (Figures 3a and 3b), indicating a weaker Pd-O binding as the Pd particle size increases. In this study, we use integrated area of the PdO reduction peak to determine the electrochemical surface area (ECSA) of supported Pd catalysts. ECSAs calculated from CV conducted in KOH (SBaseCV) and HClO4 (SAcidCV) are comparable (Table I), in agreement with Henning et al.'s earlier observations.13 Consistent with the surface area determined by TEM and XRD, ECSA decreases with increasing particle size (Table I), however, ECSAs are roughly a factor of two smaller than Sv/aTEM and SvXRD (Table I). One potential cause for this discrepancy is that a fraction of every particle is in contact with the support and thus is not electrochemically accessible. Alternative methods such as Hupd adsorption/desorption peaks and CO-stripping can also be used to determine surface area, all of which have advantages and drawbacks.13 Although the ECSAs derived from PdO reduction might not be the most accurate in absolute terms, the general trend is consistent with values obtained with other methods. Thus, it is still meaningful to compare activities normalized by ECSAs obtained with PdO reduction.
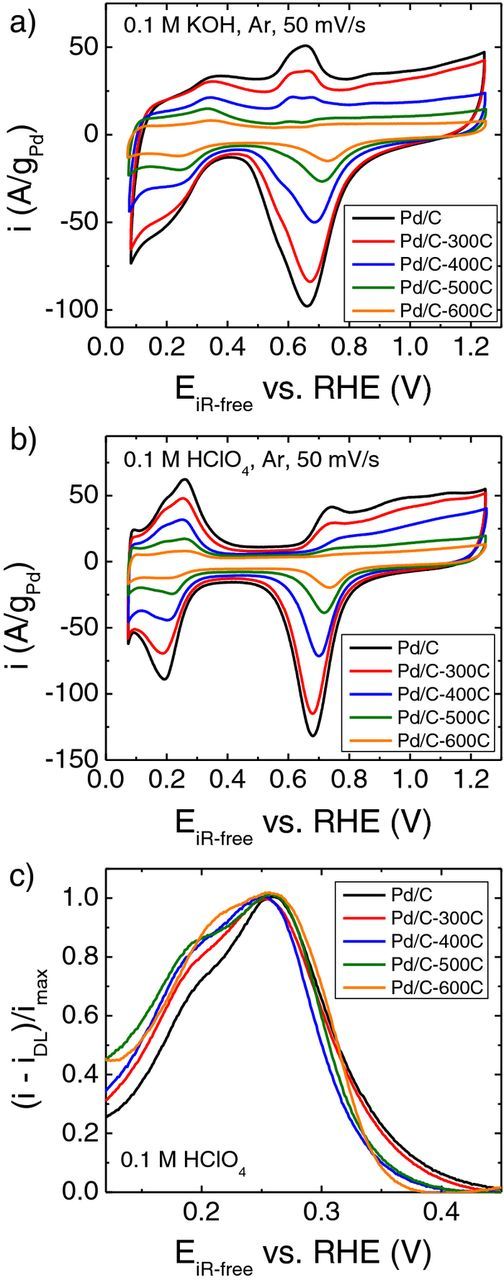
Figure 3. Cyclic voltammograms of Pd/C, Pd/C-300C, Pd/C-400C, Pd/C-500C and Pd/C-600C measured at a scanning rate of 50 mV/s in (a) Ar-saturated 0.1 M KOH and (b) Ar-saturated 0.1 M HClO4. (c) Hupd desorption profiles from cyclic voltammograms measured in 0.1 M HClO4 where the current is normalized to the peak current after double layer current deduction.
HOR/HER kinetics
The HOR/HER polarization curve on Pd/C measured in 0.1 M KOH before (black line) and after (red line) iR correction deviate significantly from the concentration overpotential curve (grey-dash line) and reach the HOR limiting current at overpotentials above 0.3 V (Figure 4a). The concentration overpotential curve can be calculated using the following equation,
![Equation ([4])](https://content.cld.iop.org/journals/1945-7111/163/6/F499/revision1/d0004.gif)
where Id is the diffusion limited current, Il is the maximum HOR limiting current, F is the Faraday constant, η is overpotential, R is the gas constant, and T is temperature in Kelvin. The HOR/HER polarization curve on Pd/C measured in 0.1 M HClO4 reaches the HOR limiting current at overpotential as low as 0.07 V and is close to the concentration overpotential curve (Figure 4b), indicating faster HOR/HER kinetics in acid than in base. The polarization curve after iR-correction (red line in Figure 4b) still show deviation from the concentration overpotential curve, which enables the quantification of kinetic currents. The limiting current densities (il) - limiting current (Il) normalized by the geometric area of the electrode (A) - in both 0.1 M KOH and 0.1 M HClO4 increase as the rotation speed increases from 400 to 2500 rpm (Figures 4c and 4d), which are proportional to the square root of the rotation speed (ω−1/2) according to the Levich equation il = 0.62nFD2/3ν− 1/6c0ω1/2 = Bc0ω1/2, where n is the number of electron transferred, D is the diffusivity of H2 in the electrolyte, ν is the kinematic viscosity of the electrolyte, c0 is the solubility of H2 in the electrolyte. The Koutecky-Levich plots in both base and acid, which show the inverse of limiting current density (il) as a function of the inverse of ω1/2, can be fitted into straight lines, yielding Bc0 values of 0.070 and 0.071 mA/(cm2diskrpm1/2), in reasonable agreement with the calculated Bc0 value (0.068 mA/(cm2diskrpm1/2)).

Figure 4. HOR/HER polarization curves (positive scan) on Pd/C measured at a scanning rate of 1 mV/s and r.t. (293 K). (a) 1600 rpm, 0.1 M KOH, Pd loading = 20 μgPd/cm2; (b) 1600 rpm, 0.1 M HClO4, Pd loading = 5 μgPd/cm2; (c) 400–2500 rpm, 0.1 M KOH, Pd loading = 20 μgPd/cm2; (d) 400–2500 rpm, 0.1 M HClO4, Pd loading = 20 μgPd/cm2. The Gray dash lines in (a) and (b) represent the concentration overpotential curves, and the black and red lines are before and after iR correction. The insets in (c) and (d) show the Koutecky-Levich plots at 0.6 V and 0.3 V vs. RHE, respectively.
The HOR/HER polarization curves were measured for all the Pd samples in H2-saturated 0.1 M KOH and 0.1 M HClO4 at 1600 rpm and 1 mV/s (Figures 5a and 5b). The HOR limiting current densities for all the polarization curves in base are about 2.9 mA/cm2disk (Figure 5a) which agrees with the theoretical values within experimental errors. Similar HOR limiting currents of about 2.9 mA/cm2disk were observed in acid as in base (Figure 5b). Atomic hydrogen is known to be able to diffuse into the Pd lattice (Hbulk), therefore the HOR/HER process might be accompanied by hydrogen absorption/desorption reaction (Eq. 5), which could appear as an extra oxidation peak in the polarization curve.13,27
![Equation ([5])](https://content.cld.iop.org/journals/1945-7111/163/6/F499/revision1/d0005.gif)
Smaller or no extra peaks associated with oxidation of absorbed hydrogen were observed in the polarization curves in 0.1 M KOH (Figure 5a), which might be attributed to the slow HOR reaction and the slow scanning rate used in the measurement to allow the absorbed hydrogen to diffuse back to the surface to be reacted as Hupd. In 0.1 M HClO4, there indeed exists absorbed hydrogen oxidation peaks in the polarization curves for Pd/C-300C, Pd/C-400C, Pd/C-500C and Pd/C-600C at about 0.069 V, 0.079 V 0.086 V and 0.134 V, respectively (Figure 5b).
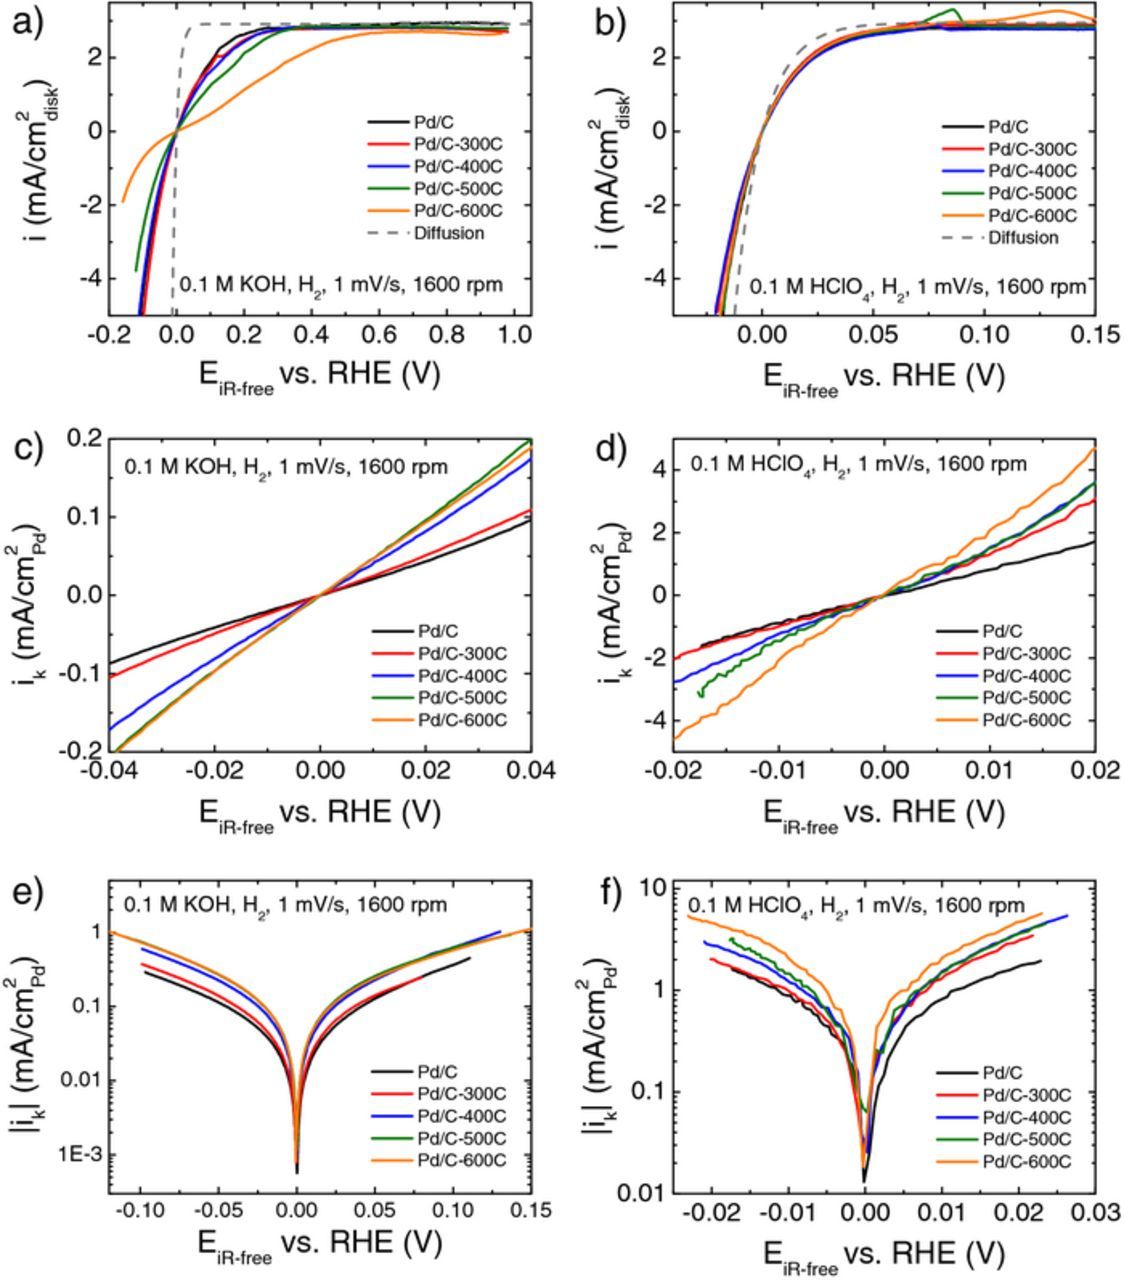
Figure 5. Polarization curves of Pd/C, Pd/C-300C, Pd/C-400C, Pd/C-500C and Pd/C-600C measured at r.t. with a scanning rate of 1 mV/s, a rotating speed of 1600 rpm in (a) H2-saturated 0.1 M KOH with a Pd loading of 20 μgPd/cm2disk, and (b) H2-saturated 0.1 M HClO4 with the Pd loadings of 5 μgPd/cm2disk for Pd/C, Pd/C-300C, Pd/C-400C, 20 μgPd/cm2disk for Pd/C-500C, and 30 μgPd/cm2disk for Pd/C-600C. The grey-dash lines represent concentration overpotential curve. Representative linear plots of kinetic current densities as a function of overpotential in (c) 0.1 M KOH and (d) 0.1 M HClO4. Representative Tafel plots of kinetic current densities in (e) 0.1 M KOH and (f) 0.1 M HClO4. All the potentials are iR-corrected.
To determine the exchange current densities of HOR/HER, the kinetic currents (Ik) were first calculated according to the Koutecky-Levich (Eq. 6),20,22
![Equation ([6])](https://content.cld.iop.org/journals/1945-7111/163/6/F499/revision1/d0006.gif)
where I is the measured current and Id is the diffusion limited current defined in Eq. 4. The kinetic currents are then normalized by their corresponding Pd surface area (which are referred to as specific kinetic current densities, ik) and plotted as a function of overpotential. A linear relationship was observed between ik and η in the micropolarization regions (Figures 5c and 5d) where ik and η can be fitted into the linearized Butler-Volmer equation with the assumption that the summation of anodic and cathodic transfer coefficient equals to 1 (αa + αc = 1) (Eq. 7) to obtain the exchange current density (i0).
![Equation ([7])](https://content.cld.iop.org/journals/1945-7111/163/6/F499/revision1/d0007.gif)
Alternatively, the kinetic currents can also be fitted into the Butler-Volmer equation (Eq. 8) to get the exchange current densities and transfer coefficients (Figures 5e and 5f).
![Equation ([8])](https://content.cld.iop.org/journals/1945-7111/163/6/F499/revision1/d0008.gif)
The specific exchange current density determined using linear fitting for Pd/C in 0.1 M KOH at 293 K is 0.052 ± 0.002 mA/cm2Pd (Table II), which is higher than the value obtained on Pd/C reported (0.06 ± 0.02 mA/cm2Pd at 313 K corresponding to 0.02 mA/cm2Pd at 293 K).1 The Butler-Volmer fitting with αa + αc = 1 yields a very similar exchange current density value of 0.051 ± 0.002 mA/cm2Pd and a αa value of 0.54 ± 0.02 (Table III) which corresponds to an anodic Tafel slope about 108 mV/dec. This suggests that the Volmer-step (Had↔H+ + e) is the rate-determining step, in agreement with Durst et al.'s report.1 Without constraining αa + αc = 1, the best fitting into the Butler-Volmer equation generates αa value of 0.45 ± 0.01 and αc value of 0.38 ± 0.02 (Table III), and a slightly higher exchange current density of 0.060 ± 0.003 mA/cm2Pd. The HOR/HER activity on Pd/C is much higher in 0.1 M HClO4 than in 0.1 M KOH – the specific exchange current densities determined from linear fitting and Butler-Volmer fitting with αa + αc = 1 on Pd/C are 2.56 ± 0.12 and 2.70 ± 0.04 mA/cm2Pd respectively, which represent a 50-fold increase of that in 0.1 M KOH. The exchange current density determined using a H2-pump in a proton exchange membrane fuel cell configuration (which resembles that in electrolyte with pH = 0) is 5.2 ± 1.2 mA/cm2Pd at 313 K,1 which can be converted to 2.3 ± 0.5 mA/cm2Pd at 293 K according to Arrhenius equation with an activation energy of 31 kJ/mol.27 The excellent agreement in the exchange current densities measured using RDE in this work and H2-pump indicates the validity of RDE method to characterize HOR/HER activity on Pd/C in acid.
Table II. Summary of specific and mass exchange current densities determined from linear fitting in the micropolarization regions for all Pd samples in 0.1 M KOH and 0.1 M HClO4
| 0.1 M KOH | 0.1 M HClO4 | |||
|---|---|---|---|---|
| Pd/C | 0.052 ± 0.002 | 0.038 ± 0.004 | 2.56 ± 0.12 | 1.83 ± 0.20 |
| Pd/C-300C | 0.062 ± 0.003 | 0.040 ± 0.004 | 2.84 ± 0.20 | 2.23 ± 0.25 |
| Pd/C-400C | 0.101 ± 0.003 | 0.034 ± 0.001 | 3.32 ± 0.13 | 1.25 ± 0.18 |
| Pd/C-500C | 0.122 ± 0.005 | 0.021 ± 0.001 | 4.44 ± 0.25 | 1.03 ± 0.20 |
| Pd/C-600C | 0.118 ± 0.005 | 0.005 ± 0.001 | 4.49 ± 0.33 | 0.33 ± 0.05 |
Table III. Transfer coefficients
| 0.1 M KOH | 0.1 M HClO4 | |||
|---|---|---|---|---|
| αa + αc = 1 | αa + αc is not constrained | αa + αc = 1 | ||
| αa | αa | αc | αa | |
| Pd/C | 0.54 ± 0.02 | 0.45 ± 0.01 | 0.38 ± 0.02 | 0.65 ± 0.11 |
| Pd/C-300C | 0.52 ± 0.01 | 0.43 ± 0.03 | 0.41 ± 0.01 | 0.71 ± 0.03 |
| Pd/C-400C | 0.49 ± 0.01 | 0.39 ± 0.01 | 0.39 ± 0.01 | 0.64 ± 0.05 |
| Pd/C-500C | 0.46 ± 0.01 | 0.31 ± 0.03 | 0.36 ± 0.02 | 0.57 ± 0.10 |
| Pd/C-600C | 0.45 | 0.32 | 0.38 | 0.57 ± 0.06 |
Particle size effect for HOR/HER
The specific exchange current density of HOR/HER increases as the Pd particle size increases from 3 to 19 nm and then levels off afterward in both acid and base (Table II and Figure 6a). The specific exchange current density in base (from linear fitting) reaches about 0.12 mA/cm2Pd as the particle size exceeds 20 nm. Sheng et al. reported an exchange current density value of 0.13 mA/cm2Pd on polycrystalline bulk Pd disk electrode in 0.1 M KOH by extrapolating from the Tafel plot in the HER region to equilibrium potential (0 V).11 Alia et al. obtained an exchange current density of 0.18 mA/cm2Pd by fitting the kinetic current from HOR/HER polarization curve into the Butler-Volmer equation.12 The specific exchange current density on Pd nanoparticles larger than 20 nm approaches that of a bulk Pd electrode. Specific exchange current densities determined from the following three methods show good agreement: 1) linear fitting (black squares in Figure 6a); 2) Butler-Volmer fitting with αa + αc = 1 (red circles in Figure 6a); and 3) Butler-Volmer fitting with unconstrained αa + αc (blue triangles in Figure 6a). The mass exchange current density shows a general decreasing trend with the growing particle size (Figure 6b), due to the decrease of ECSA.
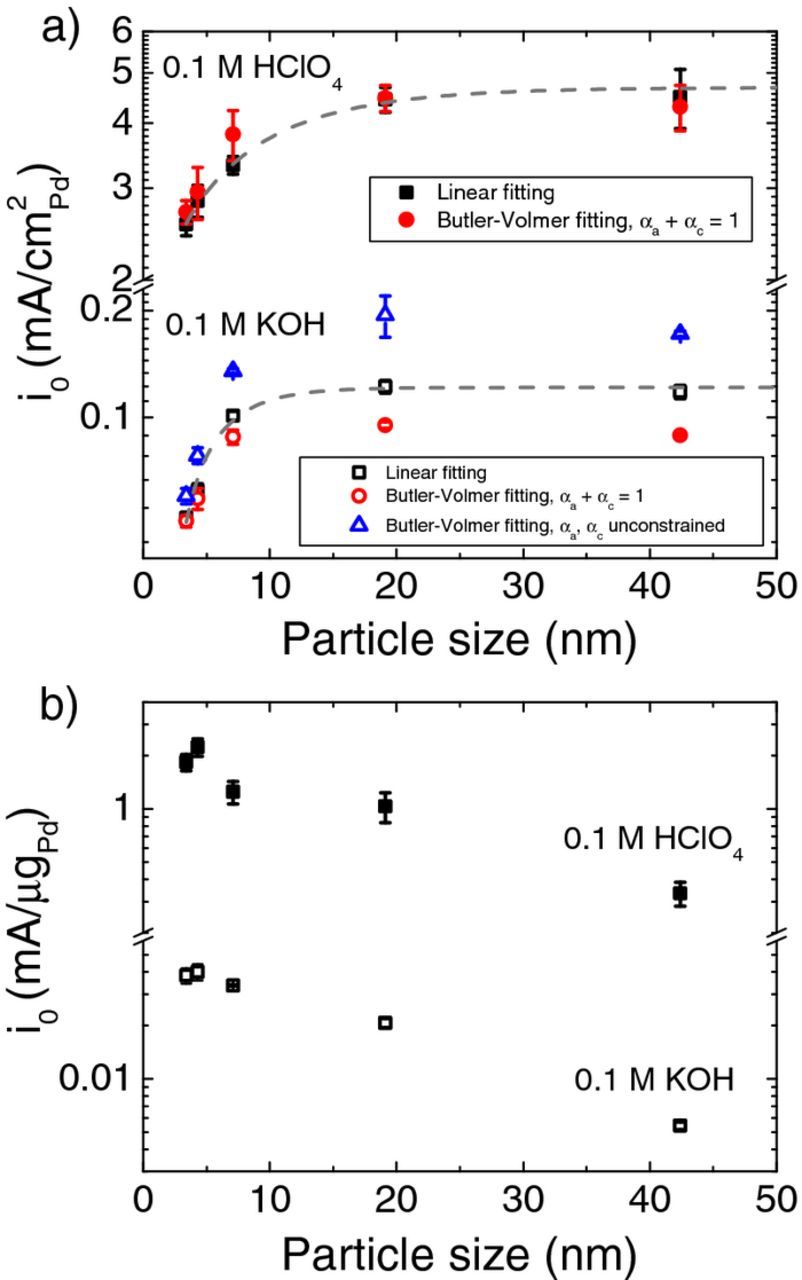
Figure 6. Exchange current density of HOR/HER as a function of Pd particle diameter (dv/aTEM) (a) specific and (b) mass in 0.1 M KOH and 0.1 M HClO4. The specific exchange current densities were determined from linear fitting in the micropolarization regions, Butler-Volmer fitting with αa + αc = 1 and αa + αc unconstrained, and the mass exchange current densities were determined from linear fitting in the micropolarization regions.
Transfer coefficient (α) and Tafel slope (TS) are related according to TS = 2.303 RT/αF, which are important parameters to reveal the reaction mechanism. For HOR/HER on different-sized Pd particles in 0.1 M KOH, the αa obtained from the Butler-Volmer fitting decreases from 0.54 on Pd/C (3 nm) to 0.45 on Pd/C-600C (42 nm) when constraining αa + αc = 1 (Table III), which corresponds to a change of anodic TS from 108 to 129 mV/dec. However, the R2 value for the regression is relatively low (0.991). By contrast, a much better Butler-Volmer fitting can be achieved by removing the constraining of αa + αc = 1 (R2 = 0.999). Still though the αa decreases with increase of Pd particle size (from 0.45 to 0.32) which translates to a TS change from 129 to 182 mV/dec, while the αc's are about 0.38 (TS = 153 mV/dec) and barely change with particle size (Table III). In 0.1 M HClO4, the αa value ranges from 0.57 to 0.71 when the fitting was conducted with αa + αc = 1 (Table III). Only currents in the narrow potential regions (– 20 mV to 20 mV) can be used for data analysis in acid, thus introducing a large degree of uncertainty in the curve fitting. As a result, we did not calculate αa and αc without constraining αa + αc = 1. Sheng et al. reported a TS value of 210 mV/dec (or αc = 0.28) for HER on bulk Pd in 0.1 M KOH at 293 K,11 and Durst et al. reported an αa value of 0.43 ± 0.07 in 0.1 M NaOH and 0.35 ± 0.1 in H2-pump with a PEMFC configuration at 313 K.1 The discrepancy in the transfer coefficient values between our work and the literature might be resulted from the possible diffusion of atomic hydrogen into the Pd lattice, which introduces uncertainty in the transfer coefficient. To mitigate the H absorption into Pd, Henning et al. deposited Pd on polycrystalline Au electrode and measured their HOR/HER activity in 0.1 M NaOH to obtain Pd surface coverage - dependent TS: surfaces with low Pd coverage yield HOR TS of about 240 mV/dec while surface with high Pd coverage generates a HOR TS of 150 mV/dec.13 In 0.1 M HClO4, Schmidt et al. obtained a HOR TS of about 210 mV/dec on Pd/Au(111) at 293 K.28
The particle size effect of HOR/HER activity on Pd/C could be attributed to the redistribution of surface facets among different-sized Pd nanoparticles (known as geometric effect), as revealed by the change in peak ratios in the Hupd desorption peak profiles (Figure 3c), together with the possible structure sensitivity of the reaction activity on different facets. Studies on single crystalline Pt showed that the exchange current density of HOR/HER increases in the order of Pt(111) < Pt(100) < Pt(110) in both acidic29 and alkaline30 electrolytes. HOR/HER activities on single crystalline Pd surfaces have not been reported, which is likely also due to diffusion of hydrogen atoms into the bulk of single crystal samples. It is reasonable to conclude that HOR/HER on Pd is structure sensitive based on the particle size dependence of HOR/HER activities in this study. The particle size effect of HOR/HER on carbon supported Ir nanoparticle in alkaline electrolyte also suggests the possibility of structure sensitivity of HOR/HER on Ir.22 Additionally, the Hupd desorption peak potential is related to hydrogen binding energy (HBE) as in Eq. 9, which has been proposed to be a dominating descriptor for HOR/HER activities.22
![Equation ([9])](https://content.cld.iop.org/journals/1945-7111/163/6/F499/revision1/d0009.gif)
where Epeak is the Hupd desorption peak potential, and S0H2 is the standard entropy of H2. Since Pd belongs to the strongly-binding branch in the "volcano plot" (HOR/HER exchange current densities vs. HBE),11,31 sites with weaker HBE will possess higher HOR/HER activity. Zhou et al. deconvoluted the Hupd desorption in the cyclic voltammogram of Pd/C obtained in 0.1 M HClO4, and attributed the peaks to low-index Pd facets (111), (100) and (110).15 In the current study, the sites associated with the Hupd desorption peak centered at around 0.19 V on Pd samples in 0.1 M HClO4 bind to hydrogen more weakly than those associated with peak centered at around 0.24 V, and thus should have higher HOR/HER activity. The increased ratio of the sites with lower HBE with rising particle size is responsible for the improved HOR/HER activity from untreated Pd/C (about 3 nm) to Pd/C-500C (about 19 nm). Similar result has been observed on Ir/C where the exchange current density and the fraction of sites with lowest HBE increase with particle size and a good correlation between exchange current density and the fraction of sites with lowest HBE is obtained.22 Meanwhile, it is generally accepted that larger particles contain less defect sites compared with smaller particles. The lower ratio of the defect sites with low coordination number and a weaker binding strength to adsorbates (Pd-H binding in this case) in larger nanoparticles could lead to a higher HOR/HER activity. Therefore, Pd nanostructures with extended surfaces and less defect sites such as Pd nanowires (PdNWs) or Pd nanotubes (PdNTs) will have higher activity toward HOR/HER than Pd nanoparticles. Indeed, a much higher exchange current density of 0.96 mA/cm2Pd was obtained on PdNTs synthesized via galvanic displacement reaction using copper nanowires (CuNWs) as templates, which is even about 5 times of bulk Pd possibly attributed to the small amount of Cu left in Pd lattice.12
HOR/HER activities in acid vs. base
The HOR/HER activities in 0.1 M HClO4 are approximately a factor of 50 higher than those in 0.1 M KOH on all Pd samples (Table II and Figure 6a). Durst et al. reported that the exchange current density on Pd/C (about 3 nm) measured using H2 pump in a PEMFC configuration (equivalent to pH = 0) is about 90 times of that obtained in 0.1 M NaOH using RDE method at 313 K,1 which is consistent with our results. Consensus has not been reached regarding the root cause for the higher HOR/HER activity in acid than in base on Pt or Pt group metals so far: whether HBE is the sole and unique descriptor for HOR/HER1,22,32,33 or there is a change in reaction mechanism from acid to base and adsorption OH will facilitate HOR/HER in base.34,35 The Hupd adsorption/desorption peaks on Pd samples in CVs measured in 0.1 M HClO4 are located at more negative potentials compared with those measured in 0.1 M KOH (Figures 3a and 3b), suggesting a weaker Pd-H binding energy in acid than in base. Therefore, HOR/HER should have a smaller activation energy in acid according to the Brønsted-Evans-Polanyi (BEP) principle. In this regard, we measured HOR/HER polarization curves on Pd/C in both 0.1 M HClO4 and 0.1 M KOH at temperatures from 275 to 313 K, and determined the exchange current densities at each temperature to generate the Arrhenius plots (Figure 7). The apparent activation energy of HOR/HER on Pd/C in 0.1 M HClO4 is 32.3 ± 0.7 kJ/mol, which is similar to that reported when the exchange current densities were determined using H2-pump (31 ± 2 kJ/mol).27 A higher activation energy is obtained in 0.1 M KOH (38.9 ± 3.0 kJ/mol) than in 0.1 M HClO4, which confirms our prediction. In addition, the activation energies of HOR/HER on Pt/C, Pd/C and Ir/C in 0.1 M KOH are in the sequence of Pt/C (29.5 ± 4.0 kJ/mol)8 < Ir/C (32.9 ± 1.5 kJ/mol)22 < Pd/C (38.9 ± 3.0 kJ/mol, this work), which correlates well to the sequence of HOR/HER activity in base in the order of Pt/C (0.57 ± 0.07 mA/cm2Pt)8 > Ir/C (0.21 ± 0.02 mA/cm2Ir)22 > Pd/C (0.052 ± 0.002 mA/cm2Pd, this work). Similar correlation between the activation energy and the exchange current density on Pt/C, Pd/C and Ir/C is also valid in acid.27 Therefore, the higher Pd-H binding energy in base is likely responsible for the lower HOR/HER activity.
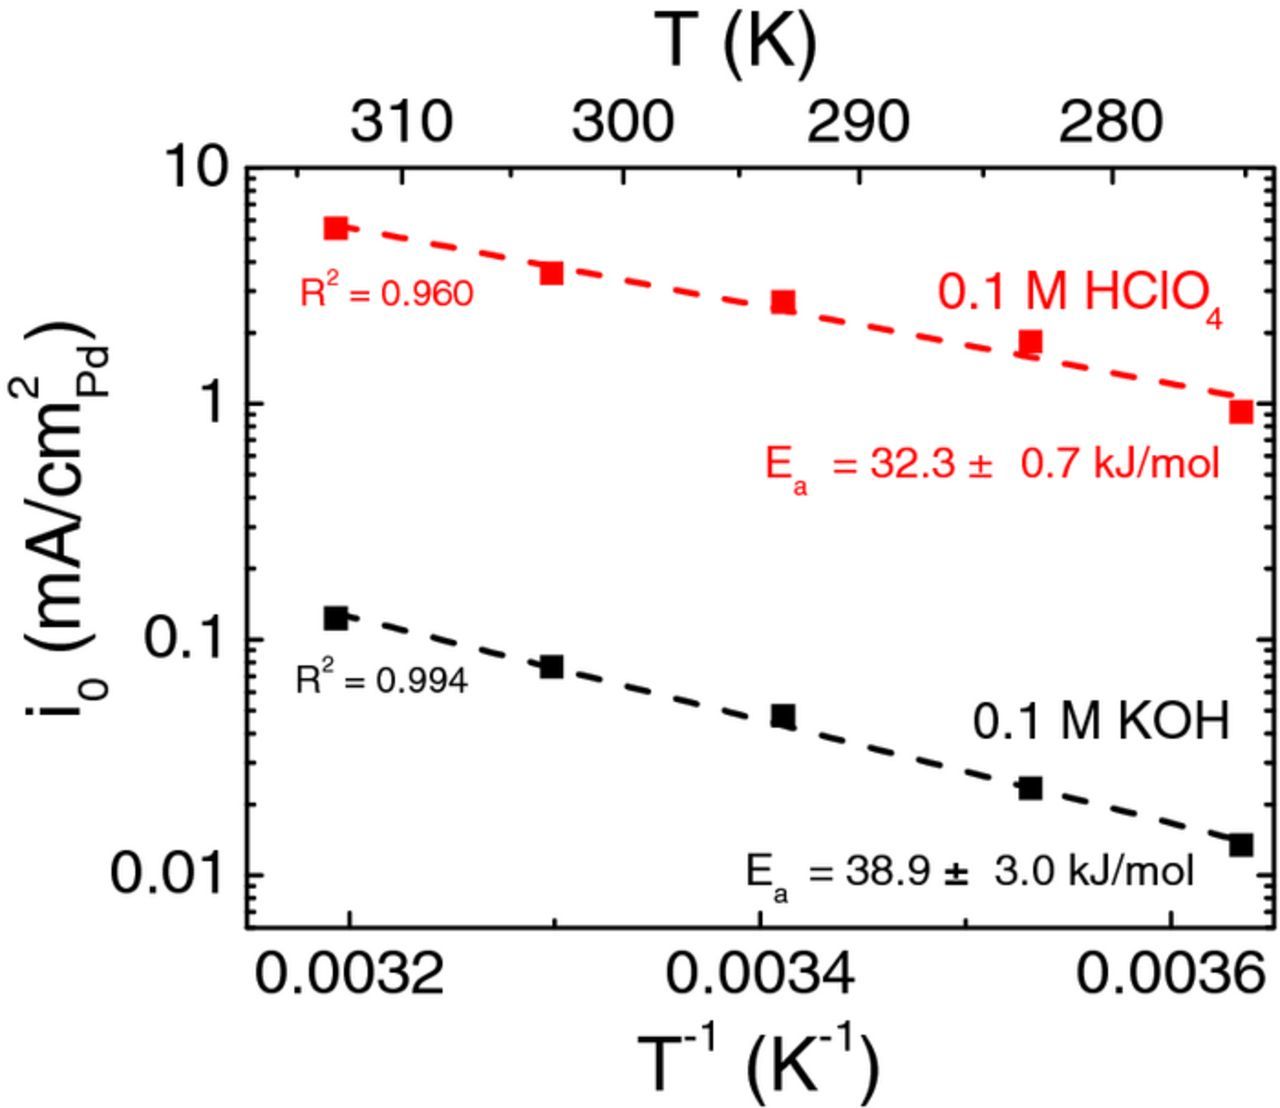
Figure 7. Arrhenius plots of HOR/HER activities on Pd/C (about 3 nm diameter) measured in 0.1 M HClO4 and 0.1 M KOH, yielding activation energies of 32.3 ± 0.7 kJ/mol in 0.1 M HClO4 and 38.9 ± 3.0 kJ/mol in 0.1 M KOH based on two sets of independent measurements.
Conclusions
In summary, we studied the kinetics of HOR/HER on Pd catalysts with different particle sizes ranging from 3 to 42 nm in both acidic and alkaline electrolytes using RDE measurement. Similar particle size effects were observed on Pd in acid and base: the HOR/HER specific exchange current density increases as Pd particle size increases and then levels off at about 19 nm while the mass exchange current density increases slightly initially, and then decreases with the increase of particle size in both acidic and alkaline electrolytes. This particle size effect suggests that HOR/HER activity on Pd is structure sensitive with the sites of lower HBE (possibility low-index facets) being more active. The HOR/HER activities on Pd in acid are about 50 times of those in base, which is likely due to the lower Pd-H binding energy in acid revealed from the negative shift of Hupd peak from base to acid as well as the smaller activation energy obtained in acid (32.3 ± 0.7 kJ/mol) than in base (38.9 ± 3.0 kJ/mol).
Acknowledgment
We acknowledge Dr. Wenchao Sheng and Dr. Zhongbin Zhuang for useful discussion, and ARPA-E Program (DE-AR0000009) for funding.