
Abstract
The impedance of electrodes at 1 kHz is typically reported to assess the signal-to-noise ratio of neural recording electrodes. The impedance response of platinum electrodes modified by poly-3,4-ethylenedioxythiophene doped with dextran sulfate has been examined. The modified electrodes have lower impedance at low and intermediate frequencies compared to unmodified electrodes. The impedance and phase angle at low frequencies is strongly correlated with the electrode area. The geometric and linear diffusion charge densities of the modified electrodes are also dependent on the electrode area and impedance at low frequencies. A 3 time constant equivalent circuit provided a better fit to the impedance than a 2 time constant model. The decrease in impedance at low frequencies indicates PEDOT-DS will be suitable for reducing the thermal noise and increasing the signal-to-noise ratio for neural recording electrodes.
Export citation and abstract BibTeX RIS
Neural electrodes are increasingly being used to understand how the brain functions; for the control of prosthetic devices; and relieving symptoms associated with several neural disorders including Parkinson's disease, epilepsy and chronic pain. Whilst recent developments in electrode technologies have delivered significant improvements in such devices, their performance is variable and progressively degenerative over chronic implantation time frames. Some improvements in short term performance have been achieved through modifying electrode geometry and chemical composition,1,2 but a poor understanding of the electrode-tissue interface has prevented translation of these benefits to chronic implants.
Neural implants function as electrochemical transducers, converting electrical to ionic current. For neural recording applications, variations in ion concentration around excitable cells lead to changes in the local potential. This variation of potential can be measured by an electrode in close proximity to the target cells. To obtain a useful biological signal from the electrode, the measurement must have a large signal-to-noise ratio (SNR). The expected SNR of a neural electrode is typically assessed by measuring its impedance at 1 kHz. However, recently we provided an analytical solution to some common equivalent circuits that revealed that the electrode impedance at the intermediate frequency of 1 kHz has a weak dependence on some electrode properties, including the electrode area. In contrast, the impedance at low frequencies was far more dependent on electrode area and may therefore be a better predictor of SNR.3 The impedance at intermediate frequencies was also greatly affected by electrode modification from the bare metal. Metal electrode modification with a doped conducting polymer changed the electrodes equivalent circuit, leading to a significant reduction of impedance at 1 kHz. However the difference in impedance at low and high frequencies between modified and unmodified electrodes was smaller and more variable. Comparison of different electrodes for neural implantation from a single impedance frequency, especially at 1 kHz, may not provide sufficient information to properly assess the electrodes effectiveness. Until a greater understanding of neural implant behavior is achieved, measurement of the impedance over a wide frequency range is required.
The comparative biostability and biocompatibility of platinum to other electrode materials predicates its use in all commercial neural implants. However, encapsulation by scar tissue during chronic implantation reduces its recording SNR.4–6 Miniaturization of the electrode may reduce the foreign body response to the implanted electrode;7 however this will increase its impedance, which will subsequently increase the electrodes SNR. Modification of the metal electrode surface to improve biocompatibility and reduce impedance has the potential to overcome these issues. A number of different materials, particularly doped conducting polymers, have been proposed for neural electrode modification, although to date, none have been stable over chronic implantation.8
Modification of electrodes with doped poly-3,4-ethylenedioxythiophene (PEDOT) has been shown to reduce electrode impedance at low to intermediate frequencies.9,10 A number of studies have also demonstrated improvements in biocompatibility by varying the dopant ion, including a recent study using dextran sulfate (DS) as the dopant.11,12 DS is a polysaccharide that acts as an antithrombotic. As a dopant ion trapped on the surface of a neural implant it has the potential to reduce the level of fouling and encapsulation on the electrode surface, leading to improved chronic performance. We recently investigated the voltammetric response of PEDOT-DS modified electrodes to gain an understanding of effective electrode area and charge density for neural stimulation.13 In this article we explore the impedance of these electrodes as a predictor of neural recording ability. The results are compared to PEDOT doped with para-toluene sulfonate (pTs) which we have previously recommended for acute neural recording applications.9
Experimental
3,4-ethylenedioxythiophene (EDOT), dextran sulfate sodium salt (DS, average MW > 500,000), sodium para-toluene sulfonate (Na2pTs) (Sigma-Aldrich) and 99.0% di-sodium phosphate (Fluka) were used as received. Electrodes were coated as described previously,13,14 briefly polymer coatings were deposited on 32, 413 μm2 nominal geometric area platinum electrodes (Neuronexus Technologies – A4 × 8–5 mm-200-200-413). Conducting polymer deposition with various dopants were electrochemically deposited onto microelectrodes via a potentiostat (CH660D, CH Instruments) from solutions containing 10 mM EDOT and 0.1 M Na2pTs or 2 mg mL−1 DS in deionized water. Deposition was performed in a three-electrode configuration using one electrode as working electrode, Ag/AgCl (3 M NaCl) as reference electrode and Pt mesh as counter electrode. Solutions were degassed for 30 minutes with nitrogen before depositing the doped conducting polymers. All polymers were deposited at 1 V vs Ag/AgCl. PEDOT-DS was deposited for 4 growth times (15, 30, 45 or 60 s), PEDOT-pTs was grown for 45 s as previously recommended.9,15 2 probes were coated with PEDOT-DS, 4 sites at each deposition time in a staggered format as described previously,9 leaving 12 uncoated platinum electrodes and 4 PEDOT-pTs coated electrodes as controls. Electrodeposition of conducting polymers produces homogeneous thin films,16,17 further details on the morphology of the PEDOT-DS films are detailed in Reference 13.
Electrode areas and charge density were determined optically and electrochemically as previously described.14 Images were collected on a BX61 optical microscope (Olympus) and the geometric area measured with ImageJ. A cross sectional SEM showed a uniform coating of approximately 15 nm thickness (Figure S1). Electrochemical analysis was performed in 0.3 M phosphate buffer in deionized water and the electroactive areas determined by addition of 5 mM Ru(NH3)63+. Test solutions weren't degassed to better represent conditions in vivo. A CHI660B potentiostat with CHI684 multiplexer (CH Instruments) were used to perform cyclic voltammetry and electrochemical impedance spectroscopy (EIS) at each of the individually addressable working electrode sites.3,9,15 A 3 electrode configuration was used with a Ag/AgCl (3 M KCl) reference and Pt mesh counter electrode. Charge density measurements were performed via cyclic voltammetry over a potential window of 0.8 to −0.8 V vs Ag/AgCl at a scan rate of 100 mV s−1. Electroactive area measurements were collected from a potential window of 0 to −0.5 V varying the scan rate from 10 mV s−1 to 1 V s−1. EIS was performed at 0 V with a 10 mV amplitude over a frequency range of 10–100,000 Hz. Equivalent circuit fitting of the EIS data was performed with ZView.
Results
The voltammetric response of the PEDOT-DS (data not shown) was similar and increased with deposition time, indicating the charge movement in the film is consistent across all thicknesses used in this study. The impedance of uncoated platinum microelectrodes was typical for a series RC circuit (Figure 1).3,9 Modification of the electrode with doped PEDOT led to a different response that required a more complex equivalent circuit. PEDOT-DS modified electrodes showed an increase in impedance with decreasing frequency with a plateau region at intermediate frequencies (Figure 1d). The phase angle was around −70° at high frequencies, approached 0° at intermediate frequencies and then became more negative at low frequencies (Figure 1e). The Nyquist plot displayed a semi-circle at high frequencies and approached a vertical response at low frequencies (Figure 1f). This impedance response at 0 V of PEDOT-DS modified electrodes in an electrolyte solution in the presence of dissolved oxygen is similar to PEDOT-pTs and PEDOT-PSS.3 PEDOT-DBSA modified electrodes tested in the same manner had a Nyquist plot where the low frequency region was much closer to 45°. This variation in shape of the Nyquist plot is most likely due to the measurement potential being at 0 V where a faradaic process occurs on PEDOT-DBSA modified electrodes;10 the other modified electrodes do not show faradaic peaks at this potential.

Figure 1. Typical impedance response of electrodes in 0.3 M Na2HPO4 at 0 V and 10 mV amplitude (a-c) uncoated and PEDOT-pTs deposited for 45 s, and (d-f) PEDOT-DS at varying deposition times. (f) data points with calculated curve using model 2.
The impedance (Z) is typically measured to assess thermal noise (Vthrms) and the expected signal-to-noise ratio (SNR) of the electrode for electrophysiological recording, according to
![Equation ([1])](https://content.cld.iop.org/journals/1945-7111/163/7/H534/revision1/d0001.gif)
where kb is Boltzmann's constant, T is the absolute temperature and Δf is the measuring bandwidth.18 Traditionally a frequency of 1 kHz has been used for this assessment. At 1 kHz, increased deposition time of PEDOT-DS led to a slight decrease in impedance and less negative phase angle (Figure 1 and Table I). Recently, we provided an analytical solution to the impedance of a simplified Randles circuit and normal Randles circuit which indicated that while impedance at 1 kHz was affected by changing the equivalent circuit model, it provided little further information on the electrode properties.3 In contrast, low frequency impedance and phase angle were far more dependent on electrode area (A) and may be a better predictor of electrophysiological performance. Clearly, at low frequencies, the impedance of PEDOT-DS modified electrodes is seen to decrease and the phase angle become less negative with longer deposition times (Figure 1 and Table I).
Table I. Average, standard deviation and coefficient of variation of impedance (kOhm).
| Impedance 1 kHz | Impedance 12 Hz | Phase Angle 12 Hz | |||||||
|---|---|---|---|---|---|---|---|---|---|
| Polymer coating | Ave | SD | CV | Ave | SD | CV | Ave | SD | CV |
| 15s PEDOT-DS | 26.8 | 1.4 | 0.05 | 237.5 | 41.6 | 0.17 | −81.1 | 5.0 | 0.06 |
| 30s PEDOT-DS | 24.9 | 4.1 | 0.16 | 98.8 | 15.6 | 0.16 | −70.9 | 9.5 | 0.13 |
| 45s PEDOT-DS | 23.3 | 3.7 | 0.16 | 62.5 | 7.7 | 0.12 | −63.5 | 6.1 | 0.10 |
| 60s PEDOT-DS | 23.5 | 3.2 | 0.13 | 45.3 | 5.7 | 0.12 | −49.7 | 9.1 | 0.18 |
| 45s PEDOT-pTs | 29.7 | 1.8 | 0.06 | 250.7 | 17.8 | 0.07 | −79.6 | 2.3 | 0.03 |
| Uncoated | 307.9 | 22.5 | 0.07 | 23693.9 | 8441.2 | 0.36 | −91.8 | 27.4 | 0.30 |
While the analytical solution to the Randles circuit provides a relationship between electrode area and impedance, this equivalent circuit is not applicable to PEDOT-DS modified electrodes. Doped conducting polymers have been modelled previously as a series resistor, capacitor and finite length Warburg diffusion impedance.10 However, this type of model does not generate a time constant that would accommodate the semi-circle in the Nyquist plot seen in Figure 1. A more complex equivalent circuit is required for PEDOT-DS modified electrodes, beginning with a parallel capacitor and resistor element to fit the high frequency impedance. The time constant is also slightly depressed in height, so that the goodness of fit was still poor with a capacitor; in contrast a constant phase element (CPE1) in parallel with a resistor (R2) fit the high frequency impedance very well. A series finite length Warburg diffusion impedance (W1) is required to fit the low frequency behavior; and another series resistor (R1) is included to account for solution resistance. Fitting of this 2 time constant equivalent circuit (Model 1 - Figure 2a) produced a reasonable average χ2 over 29 electrodes of 9.4 × 10⁻⁴, however the fit to intermediate frequencies was poor (∼50 – 1000 Hz). Inclusion of another time constant consisting of a parallel capacitor (C1) and resistor (R3) led to a significant improvement in the goodness of fit in this region. Using this 3 time constant model (Model 2 - Figure 2b), the average χ2 over 30 electrodes was less than 8 × 10⁻⁵, with an improving goodness of fit with increased PEDOT-DS deposition time. A comparison of the fit to PEDOT-DS deposited for 60 s using the two models is displayed in Figure 2c. Fitting with model 2 produces several fitting parameters including resistance (R) values for R1, R2 and R3; a capacitance (C) value for C1; an admittance (Q0) and power (n) term for the constant phase element; and a diffusion resistance (RD) and diffusional time constant (τD) associated with the Warburg impedance. Table II provides the average fitted values from model 2 with different PEDOT-DS deposition times.
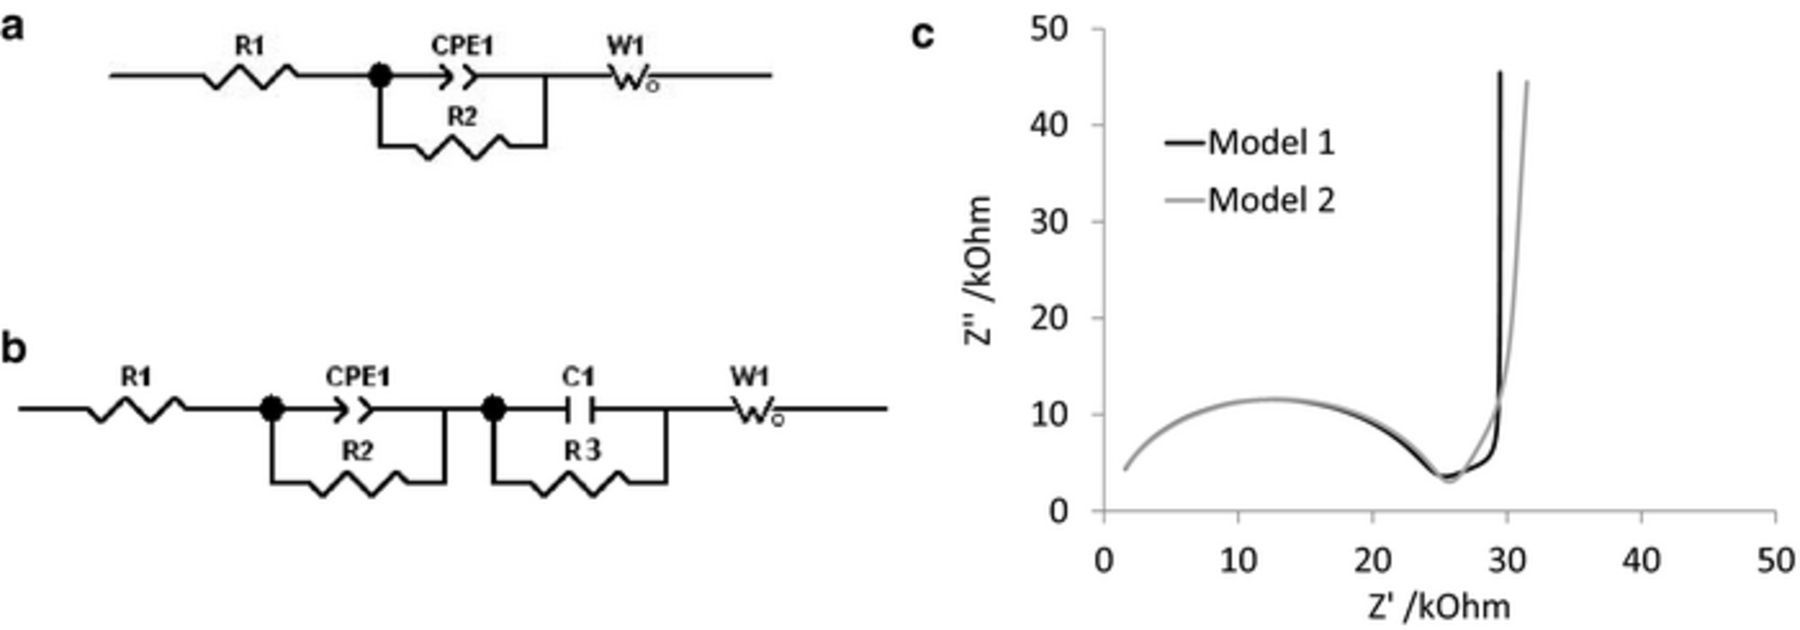
Figure 2. (a) Model 1 and (b) model 2 equivalent circuits used for PEDOT-DS modified electrodes in the presence of oxygen, R1 is the solution resistance, CPE1 is the constant phase element, R2 and R3 are resistors, C1 is a capacitor and W1 is a finite length Warburg diffusion impedance. (c) Comparison of model 1 and 2 fitting to PEDOT-DS deposited for 60 s.
Table II. Average electrochemical impedance parameters from fitting model 2.
| Polymer coating | R1 /Ω | Q0 / 10−9 S s1/2 | n | R2 /kΩ | C1 /nF | R3 /MΩ | RD /kΩ | τD /ms |
|---|---|---|---|---|---|---|---|---|
| 15s PEDOT-DS | 284 | 0.67 | 0.95 | 24.2 | 91.1 | 4.86 | 8.34 | 1.27 |
| 30s PEDOT-DS | 345 | 0.63 | 0.95 | 23.0 | 224.0 | 1.93 | 10.8 | 4.58 |
| 45s PEDOT-DS | 357 | 0.73 | 0.94 | 22.0 | 330.1 | 2.05 | 13.1 | 11.84 |
| 60s PEDOT-DS | 395 | 0.66 | 0.95 | 22.4 | 548.3 | 0.80 | 15.9 | 19.41 |
The real (Z') and imaginary (Z'') components of model 2 can be derived
![Equation ([2])](https://content.cld.iop.org/journals/1945-7111/163/7/H534/revision1/d0002.gif)
![Equation ([3])](https://content.cld.iop.org/journals/1945-7111/163/7/H534/revision1/d0003.gif)
where ω is the perturbation frequency and
![Equation ([4])](https://content.cld.iop.org/journals/1945-7111/163/7/H534/revision1/d0004.gif)
![Equation ([5])](https://content.cld.iop.org/journals/1945-7111/163/7/H534/revision1/d0005.gif)
![Equation ([6])](https://content.cld.iop.org/journals/1945-7111/163/7/H534/revision1/d0006.gif)
![Equation ([7])](https://content.cld.iop.org/journals/1945-7111/163/7/H534/revision1/d0007.gif)
This gives a total impedance
![Equation ([8])](https://content.cld.iop.org/journals/1945-7111/163/7/H534/revision1/d0008.gif)
![Equation ([9])](https://content.cld.iop.org/journals/1945-7111/163/7/H534/revision1/d0009.gif)
The phase angle (ϕ) can also be defined as
![Equation ([10])](https://content.cld.iop.org/journals/1945-7111/163/7/H534/revision1/d0010.gif)
![Equation ([11])](https://content.cld.iop.org/journals/1945-7111/163/7/H534/revision1/d0011.gif)
The dependence on electrode area is achieved by substitution of capacitance according to
![Equation ([12])](https://content.cld.iop.org/journals/1945-7111/163/7/H534/revision1/d0012.gif)
where ɛ is the solution dielectric constant, ɛ0 is the permittivity of free space and d is the double layer thickness. At intermediate and high frequencies, the impedance and phase angle are independent of electrode area. At low frequencies, the relationship between total impedance and electrode area can be fitted to a trend line of the form  while the phase angle can be fitted to
  .
.
The geometric and electroactive electrode areas were determined by optical microscopy and reduction of Ru(NH3)63+ respectively.13 Reduction of Ru(NH3)63+ could be performed at slow and fast voltammetric scan rates to provide steady-state and linear diffusion electroactive areas. However the PEDOT-DS electrodes were too large to produce a steady-state response down to 10 mV s−1. Deposition of PEDOT-DS on metal electrodes increased the geometric and linear diffusion electroactive areas.13 In agreement with theory, plots of impedance at 1 kHz versus geometric or linear diffusion electroactive area displayed no correlation (Figure 3a and 3b). In contrast, very strong correlations of the form  were found between impedance at low frequencies (using 12 Hz as a representative frequency) and geometric and linear diffusion electroactive areas (Figure 3c and 3d). The R2 was only slightly reduced by fitting a trend line of the form
  . A trend line of the form
  was fit to the phase angle at 12 Hz versus geometric and linear diffusion electroactive areas giving good R2 values, which were very similar to a linear trend line (Figure 4).
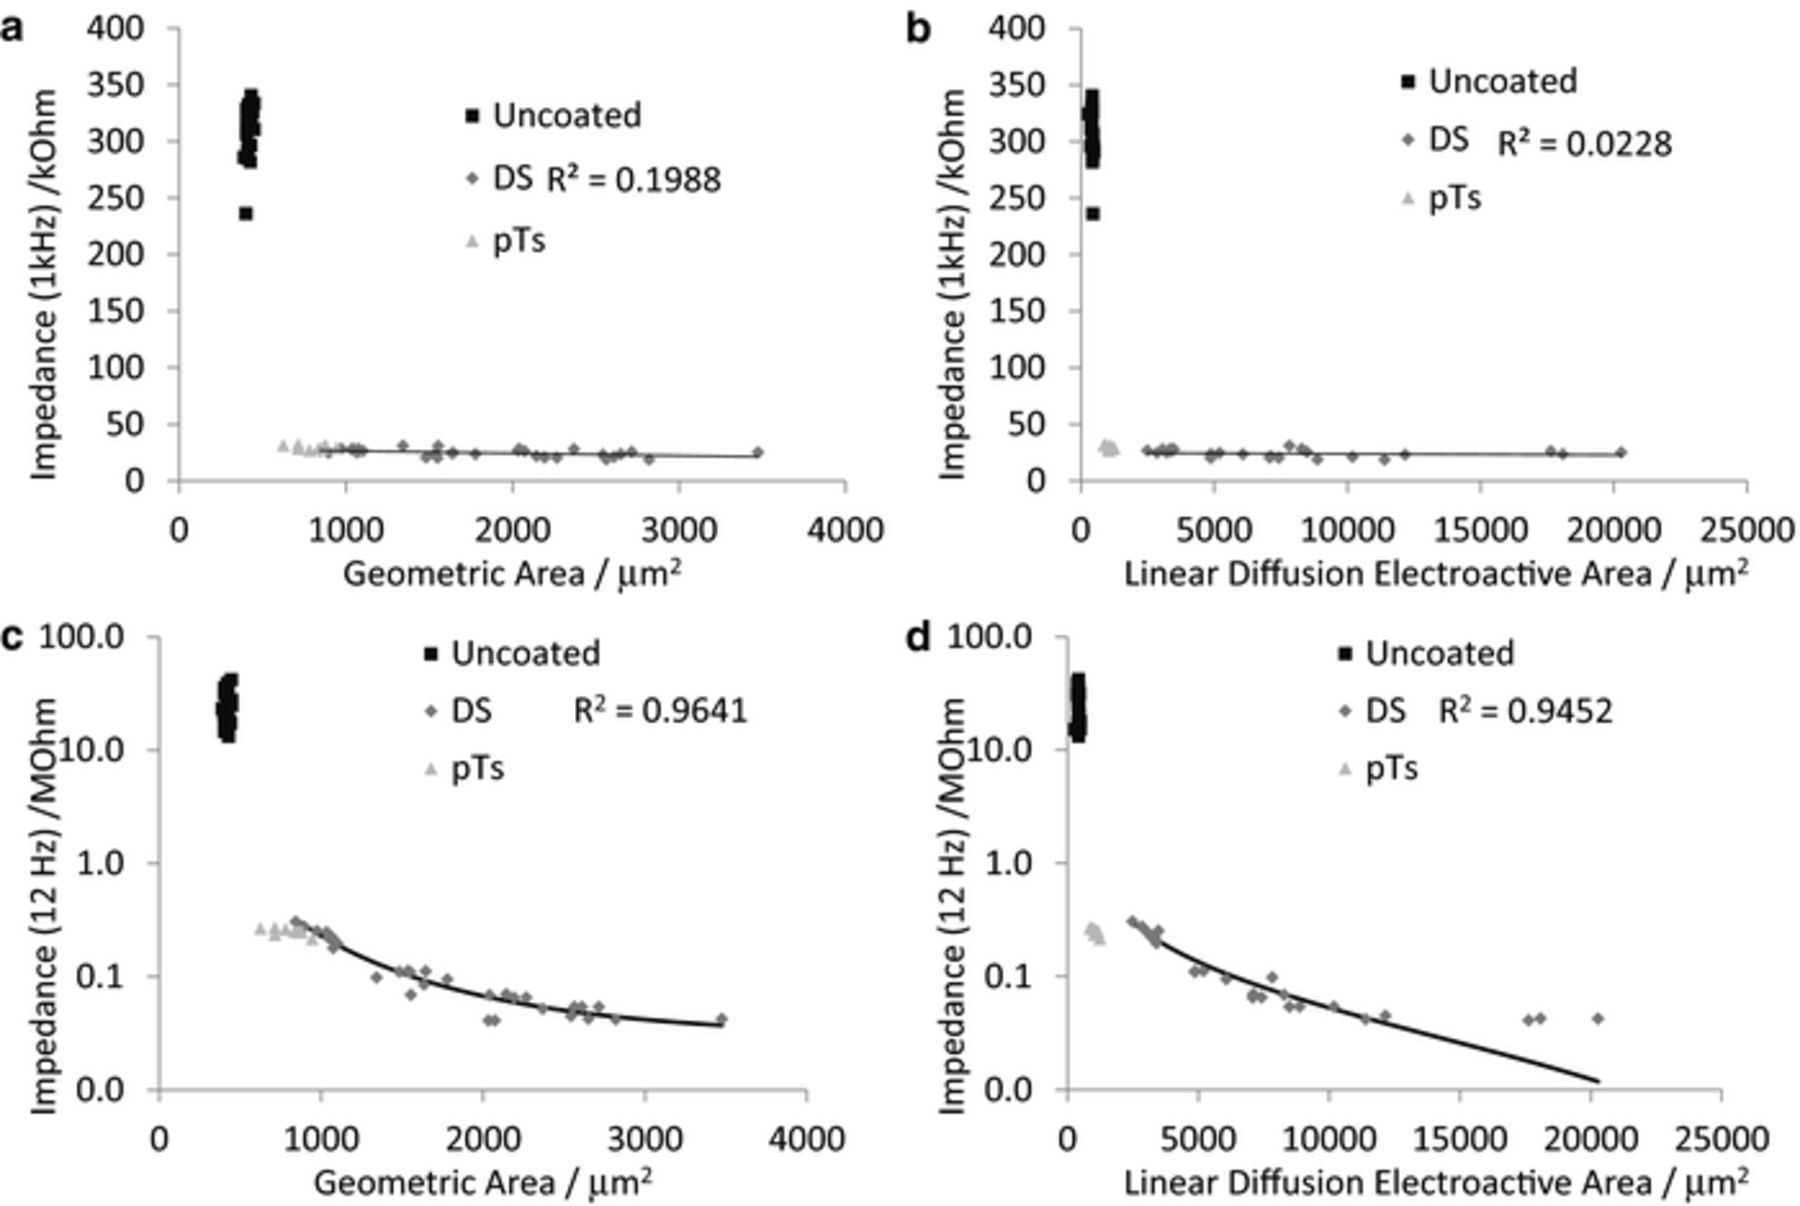
Figure 3. Comparison of impedance at (a and b) 1 kHz and (c and d) 12 Hz of PEDOT-DS modified electrodes measured in 0.3 M Na2HPO4 at 0 V and 10 mV amplitude with electrode area measured (a and c) optically or (b and d) by electrochemical reduction of 5 mM Ru(NH3)63+ at linear diffusion. (a and b) The fitted trendline is linear, (c and d) the trendline is of the form  .
.
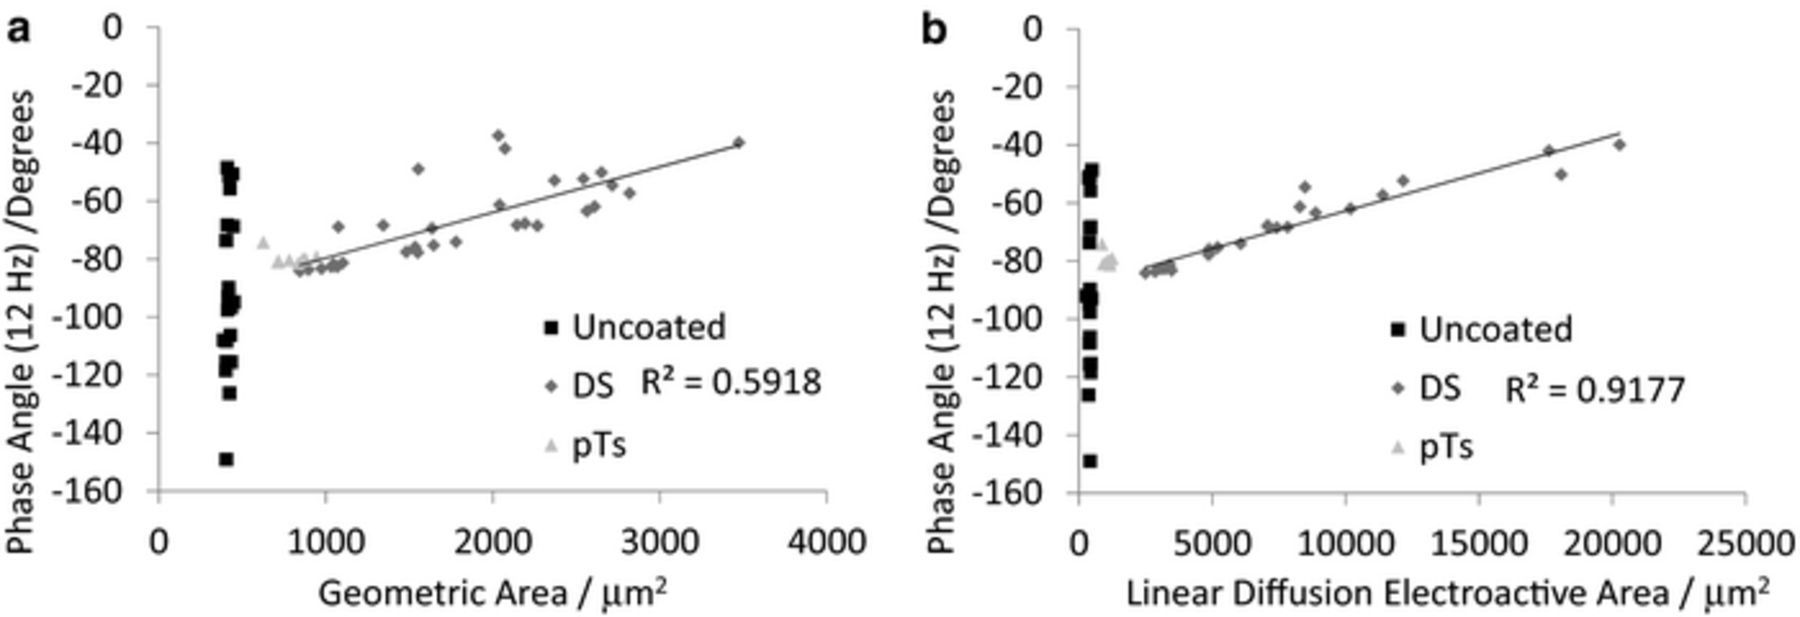
Figure 4. Comparison of phase angle at 12 Hz of PEDOT-DS modified electrodes measured in 0.3 M Na2HPO4 at 0 V and 10 mV amplitude with electrode area measured (a) optically or (b) by electrochemical reduction of 5 mM Ru(NH3)63+ at linear diffusion. The fitted trendline is linear.
After fitting the model 2 equivalent circuit, a number of parameters are obtained (Table II). Each of these can also be plotted against the geometric and linear diffusion electroactive areas (Figure 5). Both Q0 and RD show little correlation with electrode area; C1 and τD displayed a linear trend with electrode area; and R3 had a correlation with electrode area of the form  .
.
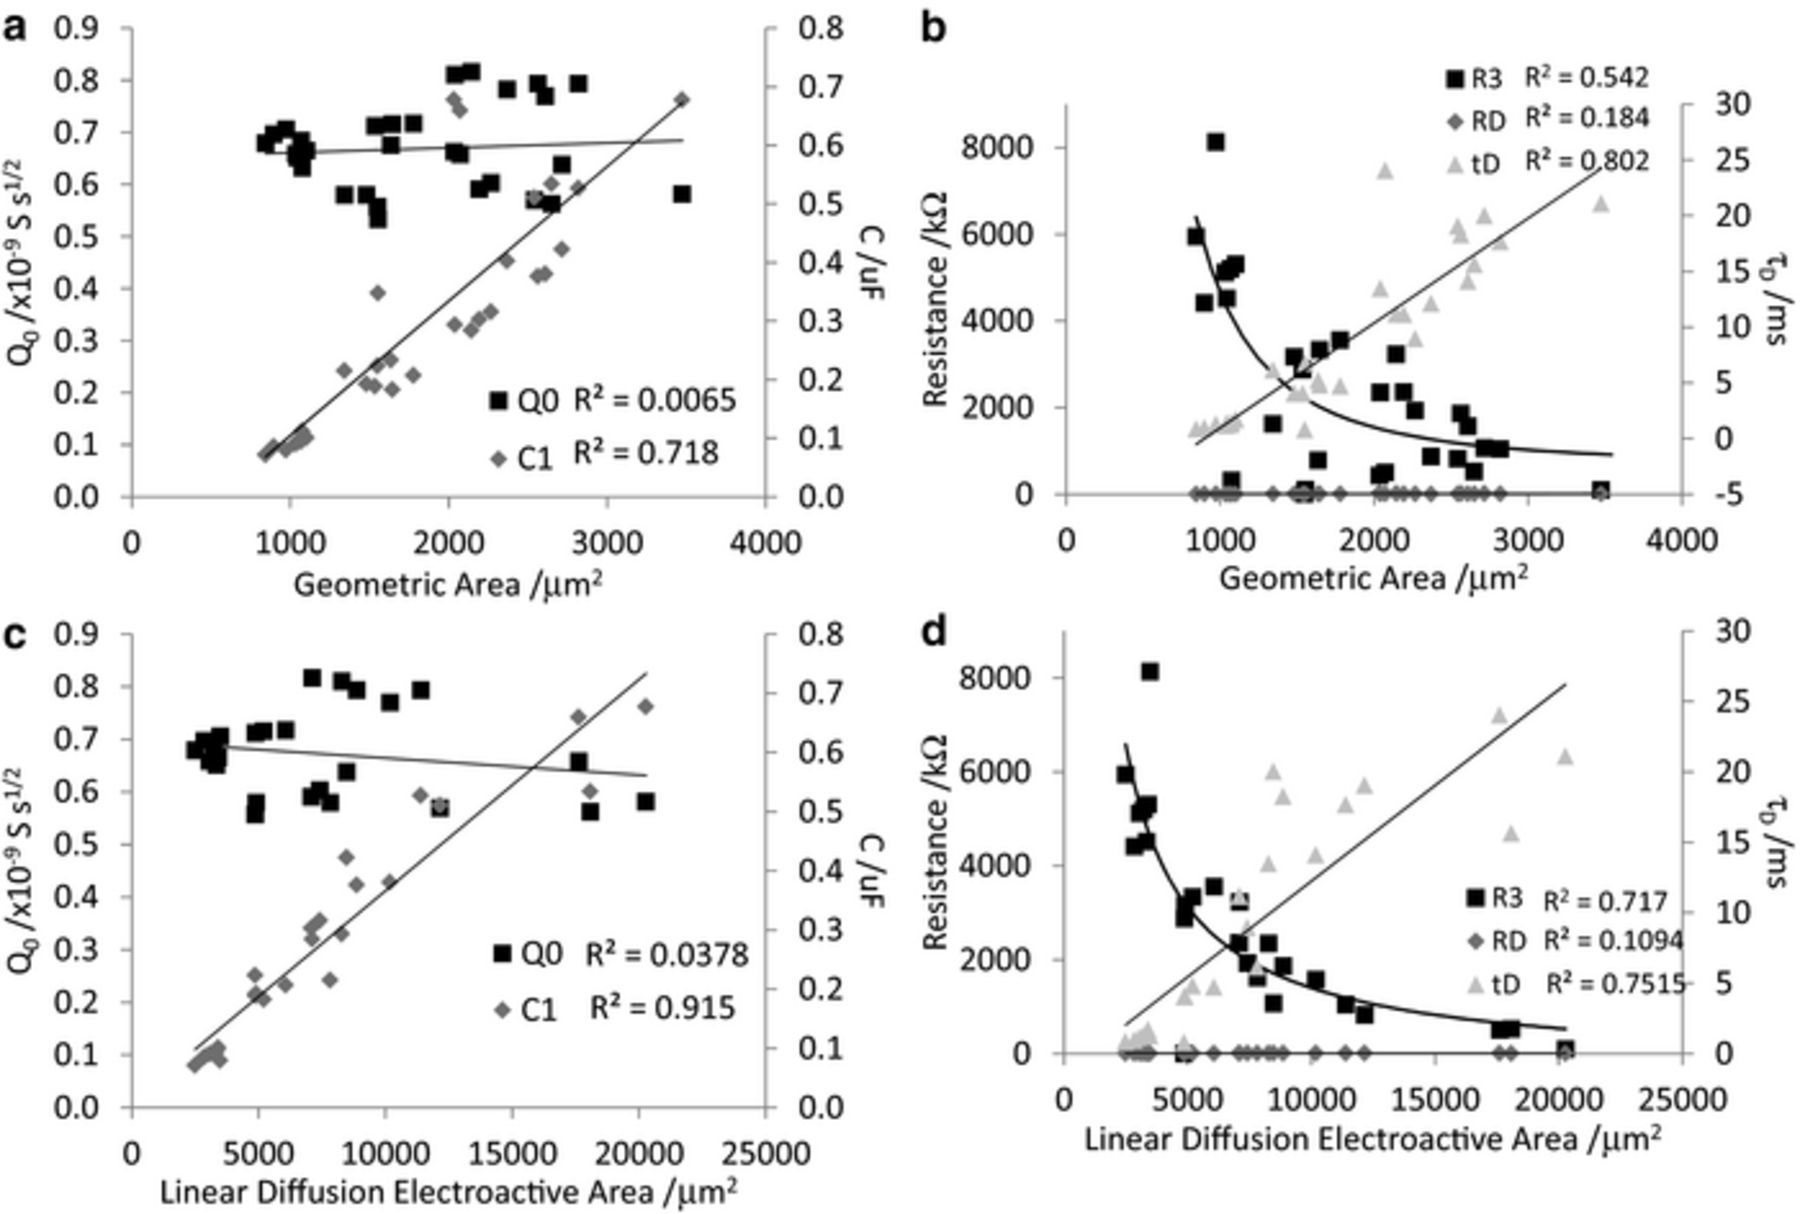
Figure 5. Comparison of model values versus geometric area and linear diffusion electroactive area. The fitted trendlines of Q0, C1, RD and τD are linear, the trendline of R3 is of the form  .
.
The charge density of the electrode is also typically measured to assess the ability of an electrode to stimulate neurons. An electrode with a larger charge density is able to deliver sufficient charge to excite a neuron from a smaller area, allowing the electrode size to be reduced, subsequently increasing the devices biocompatibility and potential ability to stimulate individual neurons. The charge density (mC cm−2) is typically measured from the charge passed during a voltammogram and the nominal electrode area. A greater understanding of charge density was obtained by measuring the geometric and electroactive areas to provide geometric and electroactive charge densities.14 Plots of impedance at 1 kHz versus geometric and linear diffusion charge density displayed no correlation, however all PEDOT-DS modified electrodes possessed larger geometric charge densities and smaller linear diffusion charge densities than unmodified electrodes (Figures 6a and 6b). Plots of impedance at 12 Hz versus charge density also show all PEDOT-DS modified electrodes possessed larger geometric charge densities and smaller linear diffusion charge densities than unmodified electrodes (Figures 6c and 6d). It was found that the charge density of the PEDOT-DS modified electrodes were correlated to electrode area.13 In further agreement with this result, at small charge densities, the impedance at 12 Hz also displayed a trend of increasing charge density with decreasing impedance.
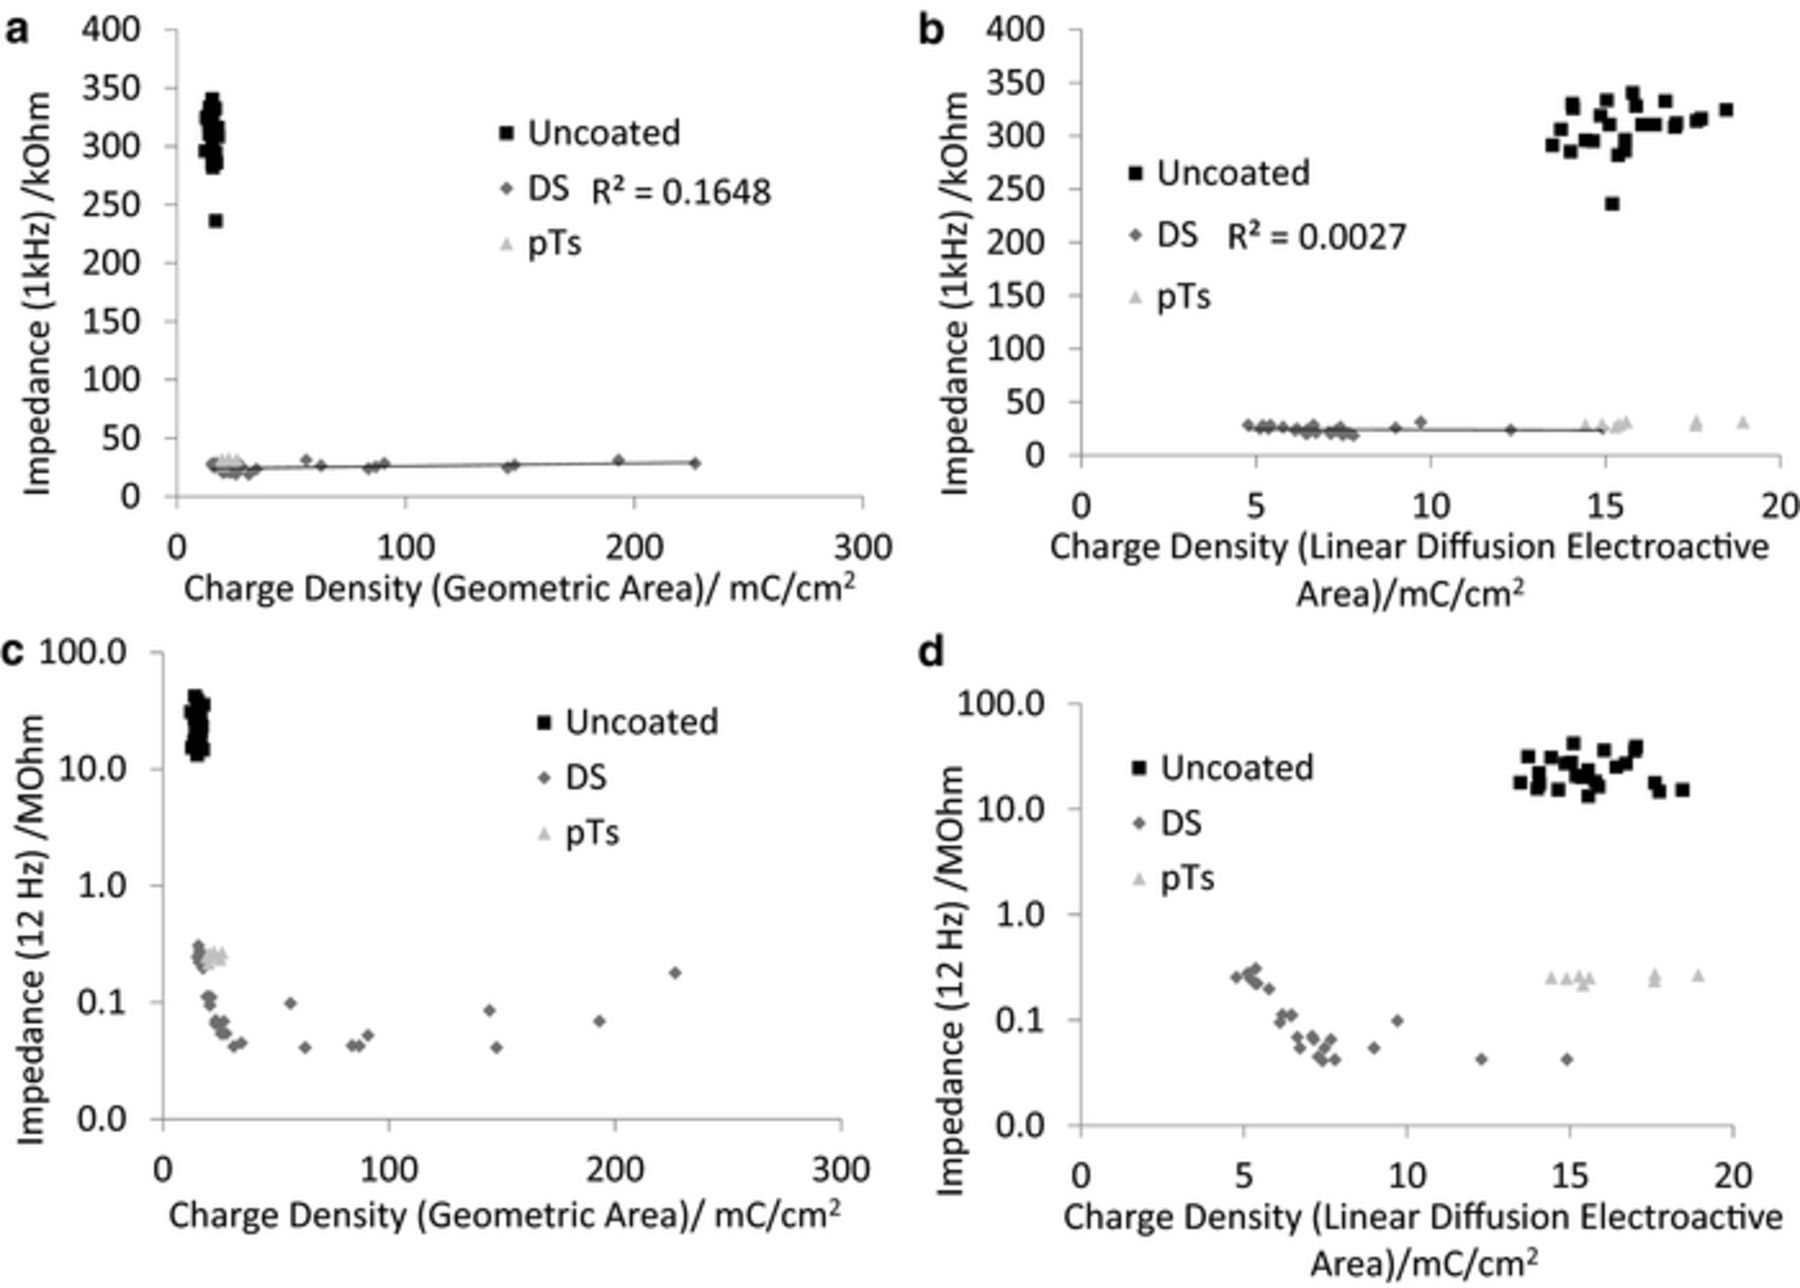
Figure 6. Comparison of impedance at (a and b) 1 kHz and (c and d) 12 Hz of PEDOT-DS modified electrodes measured in 0.3 M Na2HPO4 at 0 V and 10 mV amplitude versus charge density with an electrode area measured (a and c) optically or (b and d) by electrochemical reduction of 5 mM Ru(NH3)63+ at linear diffusion.
Discussion
Modification of neural electrodes with PEDOT-DS led to an increase in effective electrode area and charge density.13 This may result in improved electrode properties for neural stimulation applications. For neural recording, the electrode impedance is usually measured, as the impedance affects the thermal noise (Equation 1) and subsequently the signal-to-noise ratio. Bare metal electrodes display a linear impedance versus frequency response which can be modelled as a simple RC network. This results in an inverse dependence of electrode area with impedance at all frequencies. The impedance of modified electrodes is more complex than bare metal electrodes, the non-linear PEDOT-DS response requiring a 3 time constant equivalent circuit to achieve a good fit. When determining the potential thermal noise and SNR from more complex equivalent circuits, choice of measurement frequency will affect the SNR prediction. Typically SNR for neural electrodes has been assessed at 1 kHz, and it is clear that by simply modifying the electrodes to conform to a number of different equivalent circuits, a reduction in impedance occurs at this intermediate frequency.
It currently isn't known which impedance frequencies lead to a reduction in thermal noise for neural recording. If the impedance at 1 kHz is important, than many forms of electrode modification and their associated equivalent circuits can be utilized to reduce the electrode impedance. However, it is likely that the thermal noise and SNR is dependent on the electrode area. For an RC circuit, the impedance at all frequencies is dependent on electrode area, so that prediction of SNR could be achieved by measuring the impedance at any frequency. On electrodes with more complex equivalent circuits, the impedance at 1 kHz is not dependent on electrode area. In this case, measurement of impedance at 1 kHz may be a poor predictor of SNR. In contrast, the impedance and phase angle at low frequencies is highly dependent on electrode area.
In contrast to previous reports of electrochemical impedance spectroscopy of doped conducting polymers, where a 3 element equivalent circuit has been used,10,19 an equivalent circuit producing 3 time constants was required to fit the impedance of PEDOT-DS modified electrodes in a solution containing oxygen. The first element required accounts for the solution resistance (R1); the interface between the conducting polymer and electrolyte solution double layer includes a parallel constant phase element (CPE1) and polarization resistance (R3), the use of a constant phase element rather than a capacitor is usually explained as surface roughness or inhomogeneity in current distribution at the electrode surface; a finite length Warburg diffusion impedance (W1) is required to account for the conducting polymers faradaic process; finally a parallel capacitor (C1) and resistor (R3) element is included to achieve a good fit in the intermediate frequency region. The appearance of this final time constant may be due to the presence of oxygen in the solution, generating a charge transfer process.10 However attempts to fit a circuit including a second Warburg impedance element in place of C1 and R3 gave a very poor fit, suggesting this process isn't associated with oxygen. There were correlations between the electrode area and fitting parameters C1 and R3. Therefore it is more likely this process is due to dispersion in the electrode surface properties, which is dependent on the PEDOT-DS deposition time. The increased deposition time subsequently affects the electrode geometry and potentially its surface chemical structure. Further work is required to gain a greater understanding of this behavior. The fitted parameters for R1, C1 and τD with model 2 are in very good agreement with corresponding elements from a 3 parameter model used for fitting PEDOT-PSS on gold neural electrodes.19
After fitting a suitable equivalent circuit to the impedance, various fitting parameters also display dependence on electrode area. If the electrode area is an important property for determining thermal noise and SNR, then these parameters may become useful predictors of electrophysiological response. However care must be taken to ensure that the equivalent circuit is a valid physical model. Furthermore, Figure 6 highlights that the relationship between each parameter and electrode area is not a simple linear dependence. The correlation between C1 and electrode area was very strong, particularly the linear diffusion electroactive area. In contrast, the correlation of R3 and τD with electrode area were not as strong (compare Figures 3 and 5). The comparison of the impedance at 12 Hz and 1 kHz as well as each fitting parameter to neural recording data9 will provide great insight into the key electrode properties for determining their SNR.
Regardless of the specific choice of equivalent circuit, PEDOT-DS modification reduced the electrode impedance at all low to intermediate frequencies. The use of this doped conducting polymer should therefore reduce the thermal noise and improve the signal-to-noise ratio of neural recording electrodes. As DS is an antithrombotic, it's inclusion in the electrode coating may also result in improved biocompatibility, resulting in more stable chronic performance.
PEDOT-DS modification also produced larger geometric charge densities and lower linear diffusion charge densities than unmodified electrodes.13 This suggests that a greater, more homogenous charge can be delivered from the electrode surface compared to PEDOT and PPy doped with sulfate, para-toluene sulfonate (pTs), poly(styrenesulfonate) (PSS) and dodecylbenzenesulfonate (DBSA). This could produce more consistent neural stimulation behavior. It was also found that the charge density was dependent on the geometric and linear diffusion electroactive area.13 Correlation of impedance at low frequencies with geometric and linear diffusion charge density further highlights the relationship between effective electrode area and charge density. The charge density of a material is generally assumed to be independent of its geometry. The dependence of charge density on effective electrode area, and hence impedance at low frequencies, has important implications for the reporting of single charge density values for a material. An ability to modify the charge density and impedance of a material by altering its effective area allows significant improvement in the performance of both neural stimulating and recording electrodes.
Electrodes coated with PEDOT-DS displayed similar coefficients of variation in electrode area compared to PEDOT-pTs, but larger coefficients of variation in impedance, phase angle and some charge density measurements. It is unclear as to whether this will lead to an increase in error of electrophysiological performance. Systematic measurement of the electrophysiological performance of these PEDOT-DS modified electrodes will provide important information on the impact of electrochemical variation on neuron-electrode interaction. Overall, the electrochemical characteristics of PEDOT-DS modified electrodes and biocompatibility evident in the adhesion of extracellular matrix proteins and PC12 neuronal cells11 suggest that PEDOT-DS may be of significant value for improving electrode function in vivo, in particular by reducing SNR.
Conclusions
PEDOT-DS modification of microelectrodes can be fit with a 3 time constant equivalent circuit. The impedance at low and intermediate frequencies is reduced compared to unmodified electrodes. The electrode area controls the impedance and phase angle at low frequencies. The geometric and linear diffusion charge densities are also dependant on electrode area. The low impedance of PEDOT-DS modified electrodes indicates they will reduce the thermal noise and increase the signal-to-noise ratio of neural recording electrodes. The large charge density of the electrodes is also favorable for neural stimulating electrodes.
Acknowledgments
Funding from the Australian Research Council Centre of Excellence Scheme (Project Numbers CE0561616 and CE140100012) are gratefully acknowledged. GGW is also grateful to the ARC for support under the Australian Laureate Fellowship scheme (FL110100196). The authors acknowledge the support of the Australian National Fabrication Facility (ANFF). The authors acknowledge use of the facilities and the assistance of Tony Romeo at the UOW Electron Microscopy Centre.