Abstract
A thorough analysis of the evolution of the voltage profiles of silicon nanoparticle electrodes upon cycling has been conducted. The largest changes to the voltage profiles occur at the earlier stages (> 0.16 V vs Li/Li+) of lithiation of the silicon nanoparticles. The changes in the voltage profiles suggest that the predominant failure mechanism of the silicon electrode is related to incomplete delithiation of the silicon electrode during cycling. The incomplete delithiation is attributed to resistance increases during delithiation, which are predominantly contact and solid electrolyte interface (SEI) resistance. The capacity retention can be significantly improved by lowering delithiation cutoff voltage or by introducing electrolyte additives, which generate a superior SEI. The improved capacity retention is attributed to the reduction of the contact and SEI resistance.
Export citation and abstract BibTeX RIS

This is an open access article distributed under the terms of the Creative Commons Attribution 4.0 License (CC BY, http://creativecommons.org/licenses/by/4.0/), which permits unrestricted reuse of the work in any medium, provided the original work is properly cited.
Due to increasing demands for lithium ion batteries with higher energy density, several electrode materials capable of improving lithium ion capacity have been investigated. Among them, silicon has been steadily highlighted as one of the most promising materials for negative electrodes due to excellent electrochemical properties; large theoretical specific capacity and low working potential.1 While these properties make silicon an interesting electrode material with promise to bring innovation to energy storage devices, other electrochemical behavior such as cycling performance, coulombic efficiency, and capacity retention are insufficient for commercial batteries.2
In the context of improving the cycling behavior of silicon electrodes, the mechanism of capacity fade has been investigated extensively. Most reported failure mechanisms are based on problems associated with the large volume change which the silicon particle experiences during lithiation and delithiation. The repeated volume expansion/contraction results in cracking or pulverization of the silicon particles during prolonged cycling.1,3–5 Furthermore, it has been reported that volume contraction of silicon particles upon delithiation is accompanied by loss of electric conductivity of the electrode layer since the contracted silicon particles are poorly connected with surrounding conductive carbon additives and current collector.6,7 The failure of the SEI (solid electrolyte interphase) on the silicon electrode, is another key factor for electrochemical reversibility of lithium ion batteries. The SEI layer does not have mechanical tolerance to endure the large volumetric changes during expansion/contraction of the silicon surface.8–14 As a result, the electrolyte decomposes continuously to cover newly exposed surface and increase the thickness of the SEI. In addition to the problems due to the large volume changes, low conductivity of silicon and structural stress owing to phase transformation have also been reported to contribute to capacity fading.15,16
The widespread approach to overcome the aforementioned failures of volume change is to employ nano-structured silicon particles as active material.17,18 It has been reported that the mechanical stress of volume change is considerably reduced in nano-structured silicon.19 In addition, nano-structured silicon electrodes mitigate the tension that polymeric binders are subjected to during lithiation/delithiation preserving the contact between silicon particles and carbon additives.7 In particular, binders containing hydroxyl substituents on the backbone, such as polyarcrylic acid (PAA) and carboxymethyl cellulose (CMC), have been reported to have chemical bonding between binder and silicon, ensuring stronger adhesion.20–23 Efforts to stabilize the large surface area of nano-structured silicon electrodes have utilized electrolyte additives such as fluoroethylene carbonate (FEC) and vinylene carbonate (VC) which lead to the generation of a more effective SEI.24–30 Even though the electrochemical performance of silicon electrodes can be significantly enhanced by the combination of nano-structured silicon, effective binders, and SEI forming electrolyte additives; the capacity retention and efficiency of the silicon electrodes remain insufficient for commercial application. In addition, the systematic electrochemical analysis of the crucial factors dictating capacity retention of nano-structured silicon electrodes has been limited.19,31–36
The prime focus of this work is to elucidate the dominant mechanisms of capacity fade of nano-structured silicon electrodes. To this end, different sizes of nano-structured silicon particles were investigated and the electrochemical properties, such as voltage profile and differential capacity, have been carefully analyzed. Furthermore, from the comparative study with different electrolyte solutions, the deformation of the SEI layer during delithiation and its detrimental effect to cycle performance have been inferred. Based on these findings, methods to improve cycleability of silicon electrodes have been suggested.
Experimental
The 0.7 μm sized-silicon particles prepared by milling (Wacker Chemie AG) were primarily utilized for electrochemical analysis. Additional smaller silicon particles, 0.05 μm (Alfa Aesar) and 0.2 μm (Umicore), were also used for comparison. The silicon electrodes were composed of active material, conductive carbon (super C), and polymeric binder in a weight ratio of 50:25:25. A 1:1 mixture of PAA and CMC (weight ratio) was used for the binder. Electrodes were prepared from a slurry in which the three components were mixed in distilled water and stirred for 3 hours to ensure homogeneity. The as prepared slurry was coated on copper foil and dried in a vacuum oven at ambient temperature overnight. Electrodes were punched with a diameter of 14 mm (1.54 cm2) followed by vacuum-drying at 110°C for 6 hours. The loading mass of the electrodes were 0.9 mg of Si per cm2.
Coin cells (2032-type cell) were assembled with a silicon electrode as the working electrode, lithium foil as a counter electrode, two separators (a polypropylene and a glass fiber), and 100 μL of electrolyte. The electrolyte was a solution of 1 M LiPF6 (lithium hexafluorophosphate) and carbonate-based solvent (ethylene carbonate (EC):diethyl carbonate (DEC) = 1:1). The FEC was used as an electrolyte additive to the standard electrolyte solution. Cells were produced in triplicate with similar results. Representative data is presented.
Galvanostatic lithiation (charge) and delithiation (discharge) were carried out at a constant current of 0.05 C for the 1st cycle and 0.3 C for the subsequent cycles. The cutoff potentials for lithiation/delithiation were 0.005 V and 1.5 V, respectively, and the potential, at the end of lithiation, was held at 0.005 V until the current decreases to 0.05 C. All electrochemical tests were carried out with an Arbin BT2000 battery cycler at 25°C. To obtain FE-SEM (field emission scanning electron microscopic) images of electrode morphology, silicon electrodes were collected after specific charging/discharging cycles and rinsed with dimethyl carbonate (DMC), and then transferred to the SEM chamber (Zeiss SIGMA VP). All electrodes for SEM measurement were delithiated to 0.7 V on the last cycle.
Results and Discussion
The cycling behavior of a silicon electrode is presented in Figure 1a showing moderate reversible capacity, ca. 3500 mAh g−1 (based on the weight of silicon), during the initial five cycles. In addition, the first cycle efficiency (91.2%) is very good compared to many nano-structured silicon electrodes,32,33,36,37 due to the optimized electrode, binder and conductive carbon, formulation.29 Considering that the theoretical specific capacity of silicon is 3579 mAh g−1 if the silicon is assumed to uptake 3.75 equivalents of lithium ions and electrons per a mole of silicon, the obtained delithiation capacity is very close to the theoretical capacity. Interestingly, the delithiation capacities for cycles 2–4 are very similar to the first cycle despite the significant increase in rate.38 This is likely, due to the high concentration of conductive carbon in the electrode. While the initial five cycles have relatively stable cycling, upon an additional 30 cycles the reversible capacity continuously decreases to 50% of the initial capacity. Mechanisms for changes in capacity can be determined via interpretation of the evolution of voltage profiles, since the deviations of reaction potentials reflect the thermodynamic or kinetic events occurring in electrochemical reactions. An interesting trend in lithiation curves is observed in Figure 1b. The lithiation curve for the 2nd lithiation cycle is comprised of a long plateau at 0.25 V and a short plateau at 0.09 V. As the cycling is increased from the 2nd to the 30th cycle the first plateau (0.25 V) becomes shorter while the later plateau (0.09 V) remains nearly constant. By the 30th cycle the plateau at 0.09 V is longer than the plateau at 0.25 V.
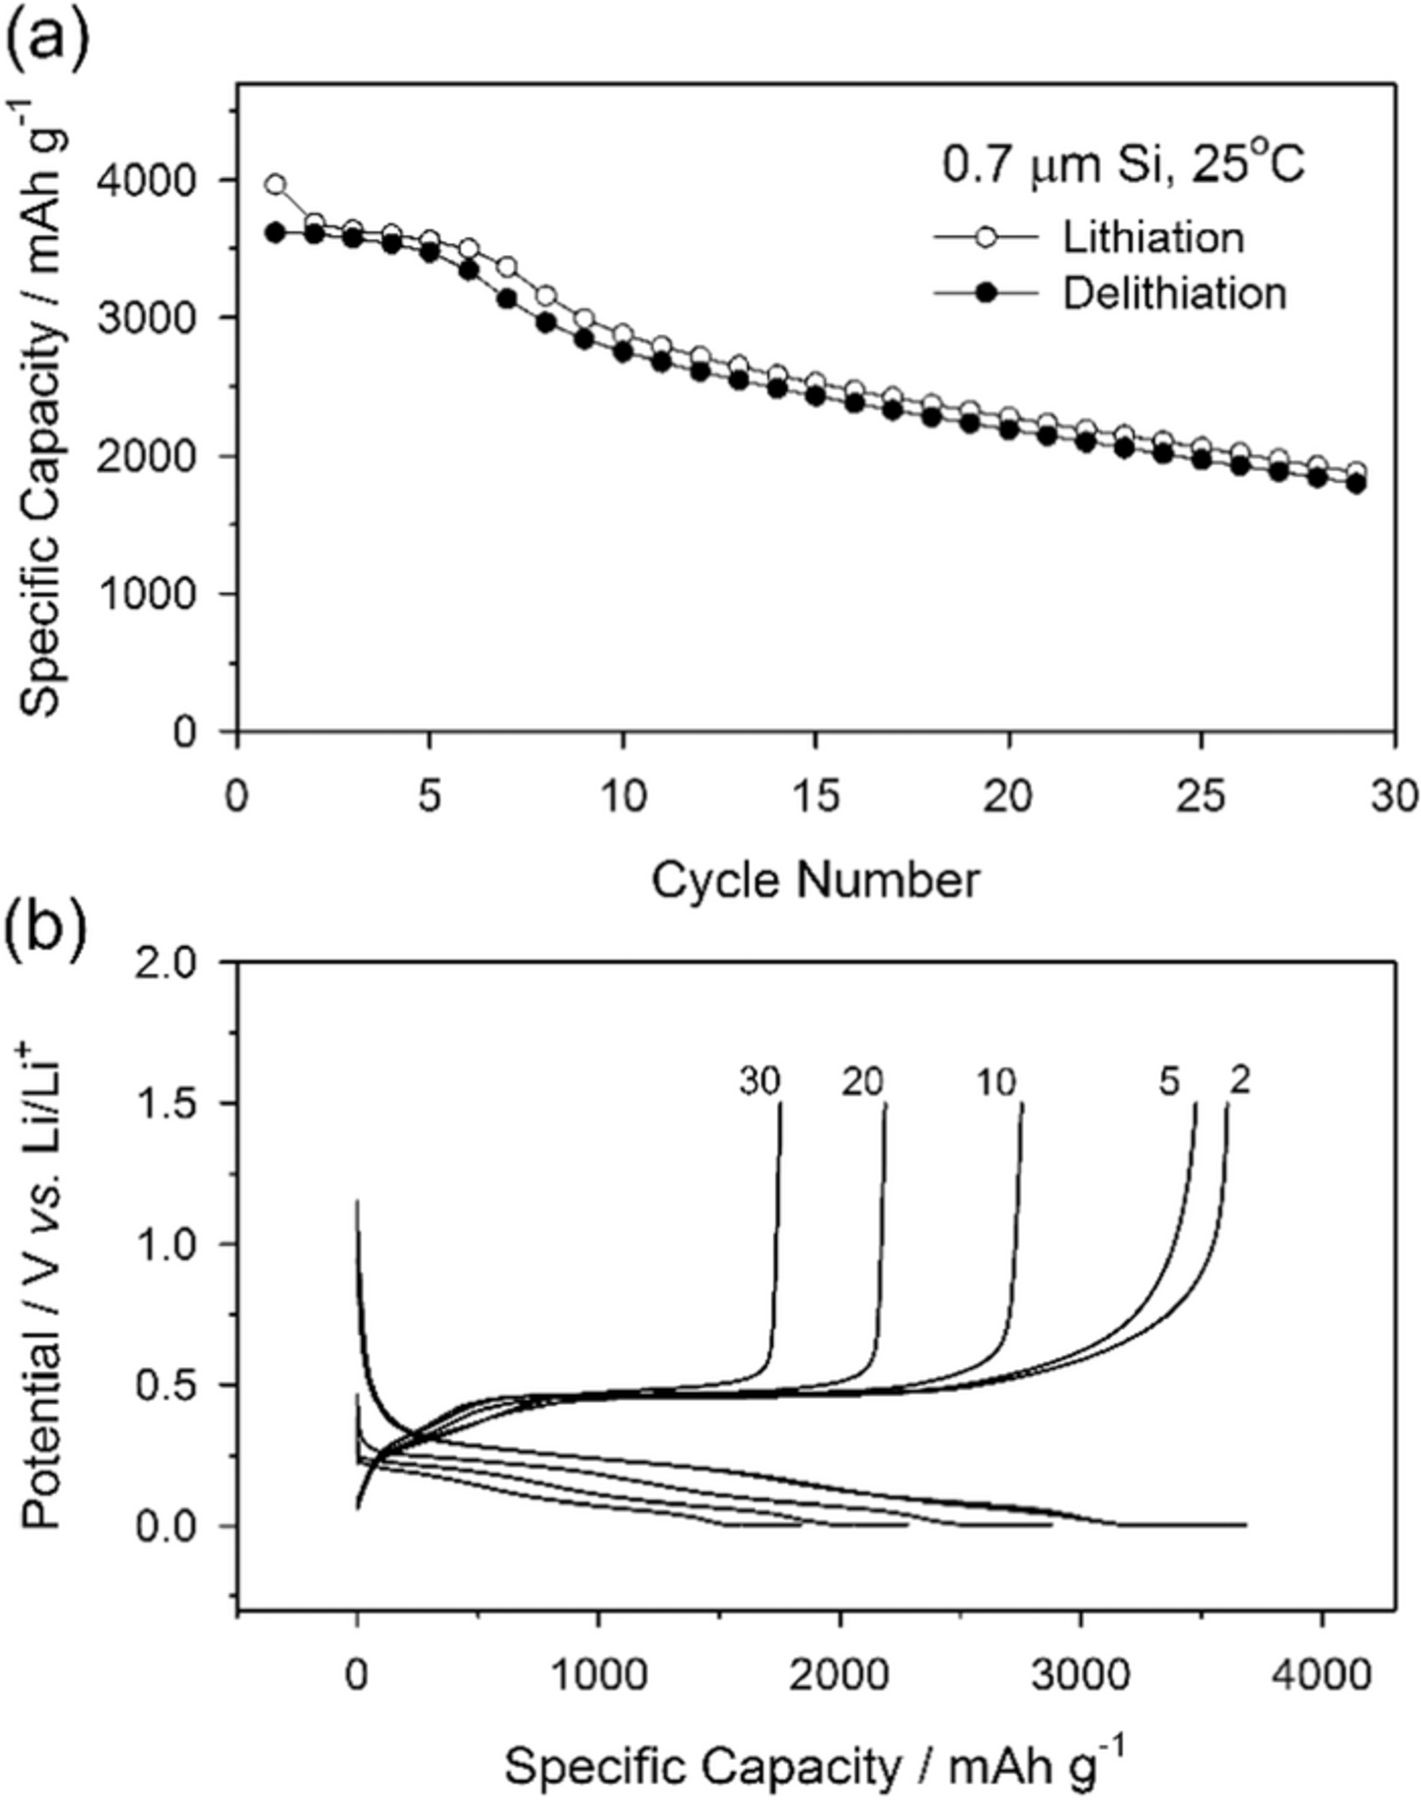
Figure 1. Cycle performance of 0.7 μm silicon electrode at 25°C (a), and the galvanostatic lithiation and delithiation voltage profiles (b). The voltage cutoff was 1.5–0.005 V (vs. Li/Li+).
Capacity loss in the early stage of lithiation, represented by the decreasing plateau at 0.25 V in Figure 1b, is unusual. In typical negative electrodes, such as graphite, the lithiation and delithiation curves are shifted downward and upward, respectively, upon additional cycling.39,40 The changes in the lithiation and delithiation curves result from increases in the polarization of the cell which leads to the measured potential of the cells reaching the cutoff potential prior to that of the thermodynamic state of the electrode. The lost capacity in the later stage of lithiation is due to the polarization increase which results from charge transfer or SEI resistance and has been described as a mechanism for capacity fade.41,42 However, for the silicon electrode, the primary changes to the lithiation/delithiation curves are observed in the earlier charging region, the plateau at 0.25 V, whereas changes due to polarization are much less significant. In addition, the potentials of the plateaus upon both lithiation and delithiation do not significantly change upon cycling.
The capacity fading and polarization behavior are more clearly depicted in the differential capacity plot in Figure 2. The dQ/dV plots contain three peaks in the lithiation curves and two peaks in delithiation curves. The lithiation, peaks centered at 0.25 and 0.09 V correspond to the plateaus at 0.25 and 0.09 V in Figure 1b, respectively. The peak at the end of lithiation, 0.005 V, has been ascribed to a phase transformation from amorphous to crystalline, which occurs when the stoichiometry reaches Li3.75Si (Li15Si4).29 The delithiation, peak at 0.3 V corresponds to delithiation of the amorphous phase and the intensity decreases as the silicon particles are converted to the crystalline phase, while the peak at 0.45 V, which corresponds to delithiation of crystalline phase, becomes larger and sharper.16 The relative intensities of these two peaks are primarily dependent on the ratio of the amorphous and crystalline phase at the end of lithiation.

Figure 2. Differential capacity plot of Li/Si cell. Note that the lithiation peak at 0.25 V is disappearing with cycling.
In Figure 2, the lithiation peaks are gradually shifted to the left characteristic of increased polarization upon cycling. The shifting of the peak causes the cells to obtain the cutoff potential earlier leading to incomplete lithiation of the silicon anode. Therefore, polarization contributes to the decrease of the delithiation capacity. However, the contribution of the increase in polarization to the decrease in delithiation capacity is limited since the lithiation peaks at 0.09 and 0.005 V are only slightly shifted. The primary source of the capacity loss is due to decreases in the intensity of the peak at 0.25 V during lithiation. The high potential shoulder at 0.3 V completely disappears by the 15th cycle while the remaining peak at 0.25 V continues to decrease considerably with prolonged cycling.
To monitor the evolution of the lithiation peaks quantitatively in the differential capacity plot, and estimate their contributions to total capacity fade, the lithiation profile was divided into four regions. The voltage range of each region and their final stoichiometry are presented in Figure 3a. The regions are assigned as R1, R2, R3, and R4 and the corresponding potential ranges are 0.8–0.27 V, 0.27–0.16 V, 0.16–0.03 V, and 0.03–0.005 V, respectively. The regions were divided based on shape of the lithiation curve without considering the structural/physical meaning of the each region. Note that the peak at 0.25 V was divided into two peaks based on asymmetry and the presence of a shoulder at 0.3 V and R4 includes the constant voltage step at end of charging. The dotted lines in Figure 3a are delithiation profiles obtained when the electrodes were only lithiated to the corresponding stoichiometry for each region. Since the intensities of the delithiation peaks and the broad shoulder above 0.55 V are dependent upon the ratio of amorphous to crystalline phases and have significant overlap (Fig. 3a), the delithiation peaks were not further analyzed.
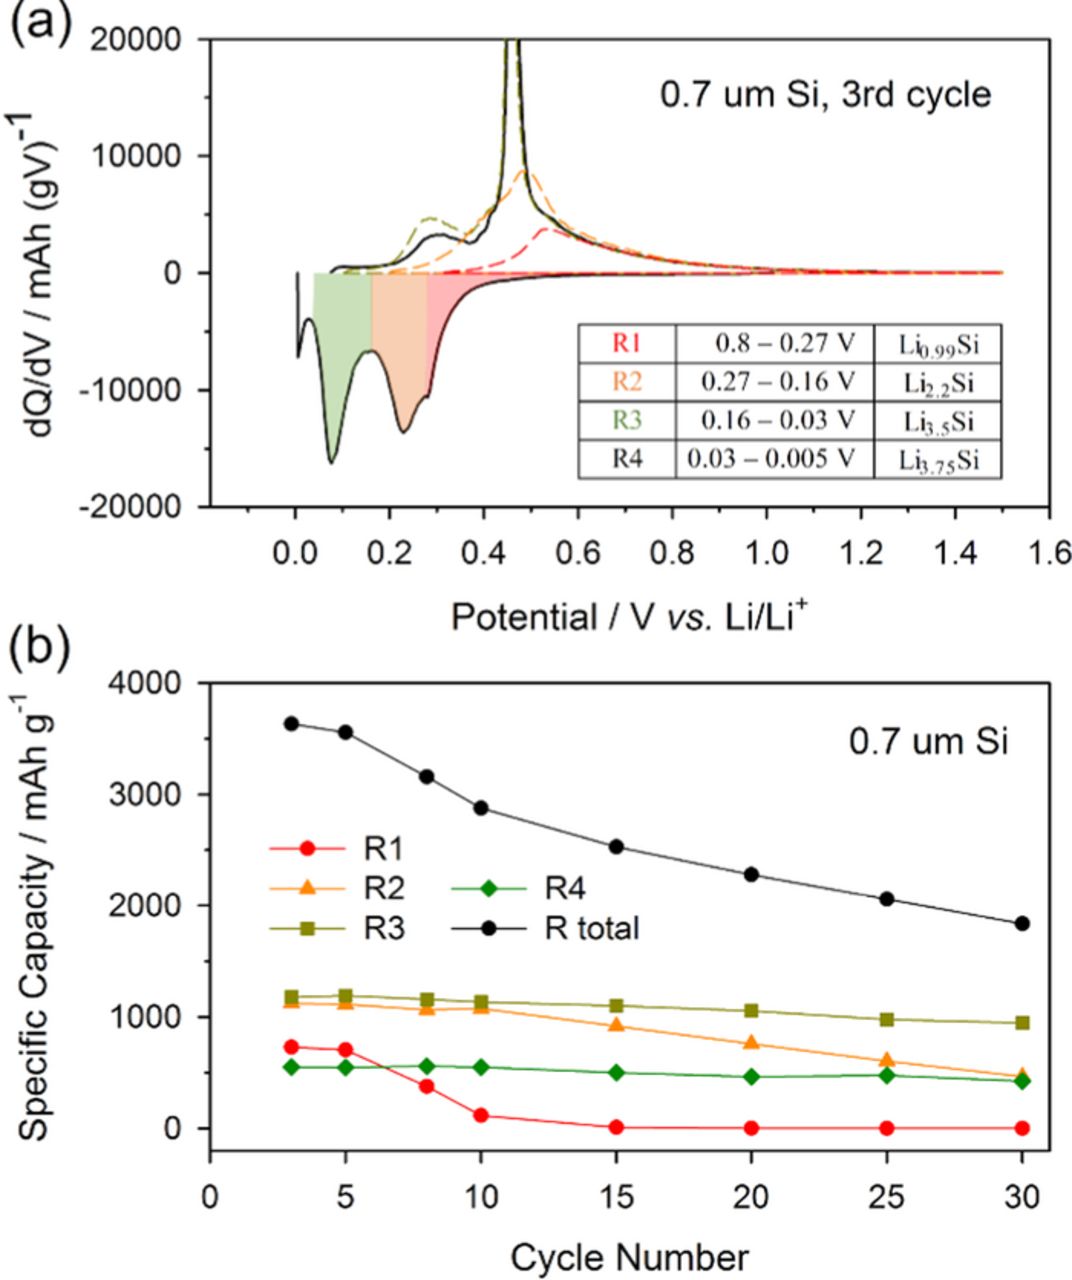
Figure 3. Lithiation curve of 0.7 μm silicon electrode was divided into four regions as R1, R2, R3, and R4 (a), and the specific capacity of each region was plotted versus cycle number (b). Dotted lines are delithiation profile of the electrode which was lithiated to corresponding stoichiometry. The voltage range and the stoichiometry of each region were indicated in inset table.
The change in capacity for each region as a function of cycle number is plotted in Figure 3b. The plot of R total reveals reasonable capacity retention during the initial five cycles, but the capacity decreases significantly after the 5th cycle in agreement with the capacity retention data presented in Figure 1a. Interestingly, from the 5th to 10th cycle, the decrease in capacity of R1 coincides with the decrease in capacity of R total, suggesting that capacity loss for R1 is the main contributor to capacity loss of R total for cycles 5–10. After the capacity of R1 is reduced to zero, R2 begins to decrease significantly through the 30th cycle. Thus during cycles 10–30, the capacity decrease of R2 is the primary contributor to the total capacity (R total) decrease. The changes to R3 and the R4 are minor over all 30 cycles. This suggests that the decreases in capacity of R1 and R2 are the main contributors to the total capacity fade of the silicon electrode and that the fade occurs consecutively.
Silicon electrodes have also been prepared with 0.05 μm and 0.2 μm silicon particles. The cells have been cycled and the different regions of the lithiation cycles have been analyzed in the same manner as the cells containing the 0.7 μm Si electrodes, as depicted in Figure 4. Despite the large differences in particle size and surface morphology all of the cells have consistent capacity fading behavior. The decrease in R1 is observed first followed by the decrease in R2 and the majority of the capacity fade occurs from these two regions.
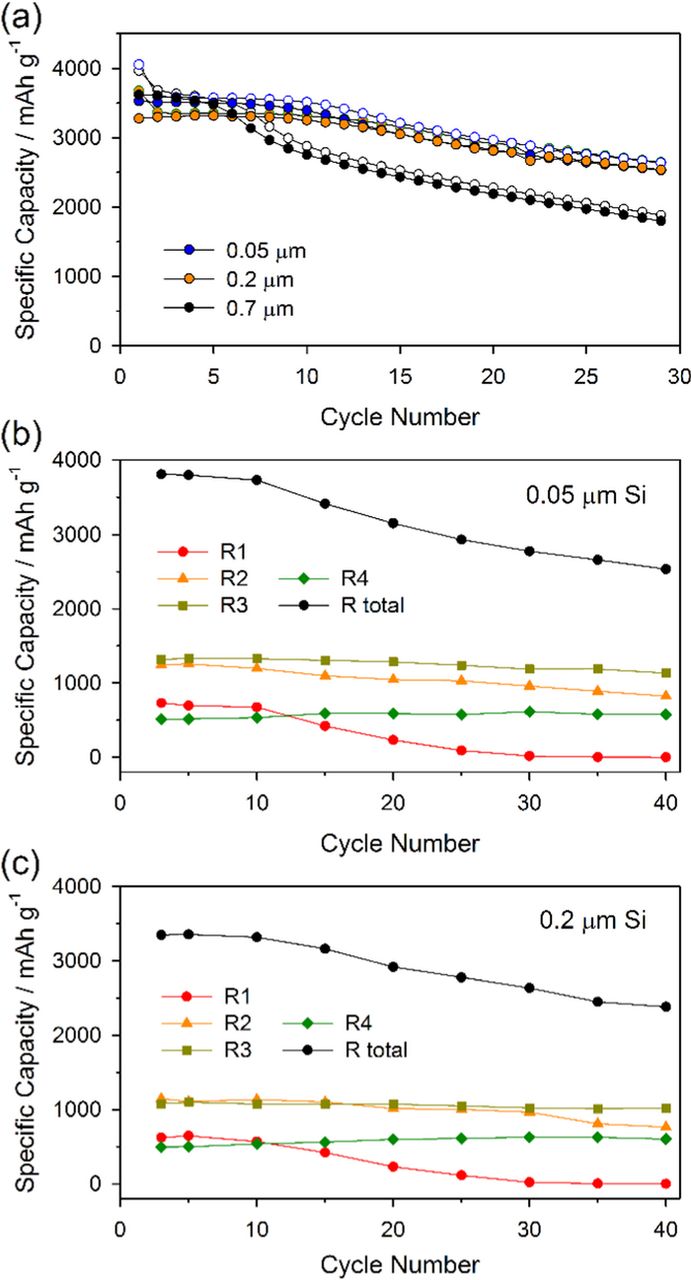
Figure 4. Cycle performances of different sized-silicon electrodes (a) and specific capacity variation of R1–R4 components with respect to the cycle number obtained from 0.05 μm (b) and 200 μm (c) sized silicon electrode were presented. Note that R1 and R2 fade successively and they dominate the total capacity in both electrodes.
In order to further the development of silicon anodes for lithium ion batteries a better understanding of the capacity fade in regions R1 and R2 must be developed and an effective method to inhibit the capacity fade must be devised. Regions R1 and R2 correspond to the early stages of lithiation of the silicon anode up to the stoichiometry of ∼Li2Si. The data suggests that these early stages of lithiation are skipped upon extended cycling leading to direct lithiation of regions R3 and R4. This suggests that the lithiation reaction on the 10th and subsequent cycles occur with partially lithiated silicon, ∼Li2Si, instead of pure silicon. The silicon electrode is not fully delithiated during the previous delithiation. The broad shoulder at 0.55 V in the delithiation curve, which corresponds to the delithiation reaction for R1 (Figure 3a), significantly decreases during cycling, supporting the lack of delithiation. Thus, decreases in R1 and R2 upon extended cycling are likely due to incomplete delithiation during the previous cycle.
The lack of delithiation form the intermediate lithiated phase of silicon, is likely due to a combination of two factors. First, increases in cell impedance upon delithiation can result from a contraction of the silicon particles. As the silicon particles decrease in size, the electrode has poor electrical contact resulting in higher contact resistance as the particles become electrically isolated. Secondly, as the cycling increases the cumulative cell inefficiency is increased. This cumulative cell inefficiency largely corresponds to increases in electrolyte decomposition and subsequent increases in the SEI thickness. The increases in the SEI thickness result in increases in SEI resistance since the SEI is a good ion conductor but poor electrical conductor. In addition, particle pulverization has also been frequently reported to contribute to capacity fade in silicon electrodes.4,35 However, in this study there are only small differences in the capacity fade as a function of particle size when comparing 0.7, 0.2, and 0.05 μm silicon, as depicted in Fig. 4. The slight increase in capacity fade of the 0.7 μm particles is consistent with increased pulverization of the larger particles, but suggests that pulverization is minimized.
Further support for capacity loss in R1 occurring as a result of SEI resistance is depicted in Figure 5. The capacity retention of the silicon electrode is improved upon incorporation of the anode SEI stabilizing additive FEC. The FEC has been reported to generate a more stable SEI on the surface of the silicon electrode which suppresses further electrolyte decomposition.24–26 Since expansion of the silicon electrode during lithiation results in a large change in surface area, electrolyte decomposition continues to occur on the newly exposed surface of silicon and the coulombic efficiency is poor. However, the FEC derived SEI layers have better passivation ability and lower resistance resulting in an improved coulombic efficiency (Figure 5, inset).13,26,29 The improved capacity retention results primarily from a delay in the decrease in R1 (Figure 5b), implying that the SEI has a role in the incomplete delithiation of the silicon anode. That is, the SEI layer formed in additive-free electrolyte hinders the delithiation reaction of the silicon electrode, especially at the latter region of delithiation, whereas the SEI modified by an electrolyte additive hinders the delithiation less, hence the retention of R1 is improved. Thus the resistance of the SEI layer is a critical factor impacting delithiation and cycleability. The SEI and contact resistances in delithiation period are described schematically in Figure 6.

Figure 5. Cycle performances of 0.7 μm silicon electrode in different electrolytes (a) and capacity variations of R1–R4 components of Li/Si cell cycled in FEC-added electrolyte.
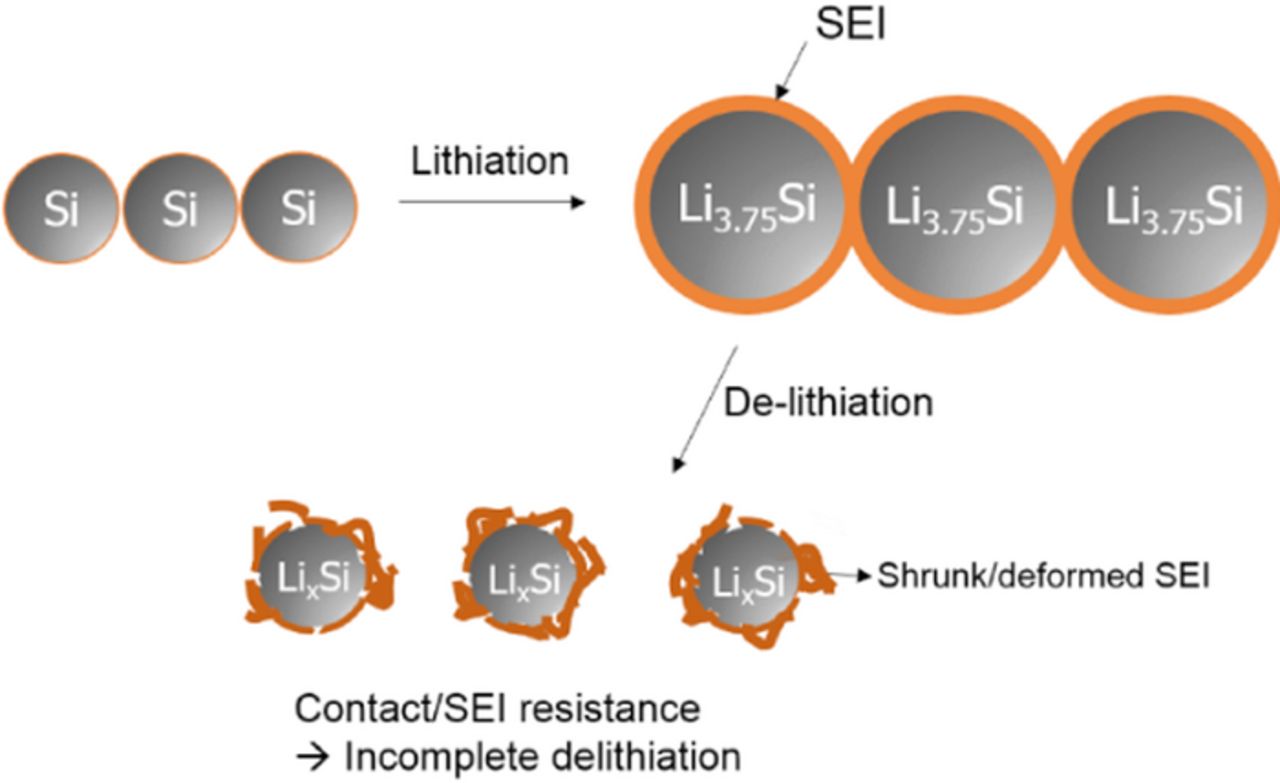
Figure 6. Schematic diagram illustrating the failure in delithiation period.
The failure of silicon electrodes resulting from contact loss during delithiation can be supported by comparing the cycling behavior of cells with modified cutoff potentials. The normalized capacity retention of the electrodes cycled with three different potential ranges are depicted in Figure 7. The baseline electrode cycled between 1.5–0.005 V retains only 49% of the capacity on the 30th cycle. However, when the delithiation cutoff potential was changed from 1.5 to 0.7 V after the 3rd cycle, the capacity retention of the electrode is significantly improved (69%, from 3rd to 30th cycle) due to mitigation of the volume expansion/contraction. The modified potential range results in a slight decrease in the quantity of cycled capacity (10%, 350 mAh g−1). The capacity retention can be further improved (86%, from 3rd to 30th cycle) upon incorporation of the SEI stabilizing additive FEC (Fig. 5b). In contrast cells cycled between 1.5–0.05 V, which delivered the same capacity to the electrodes cycled in 0.7–0.005 V (3250 mAh g−1) on the 3rd cycle, have a similar capacity fading behavior to the electrode cycled between 1.5–0.005 V. This is surprising since the phase transformation from amorphous to crystalline which occurs below 0.05 V has been reported to be one of the major failure mechanisms of silicon electrodes.16,43,44 On the contrary, the results presented in Figure 7 suggest that the degradation of electric contact during delithiation dominates the electrochemical performance of silicon electrodes.
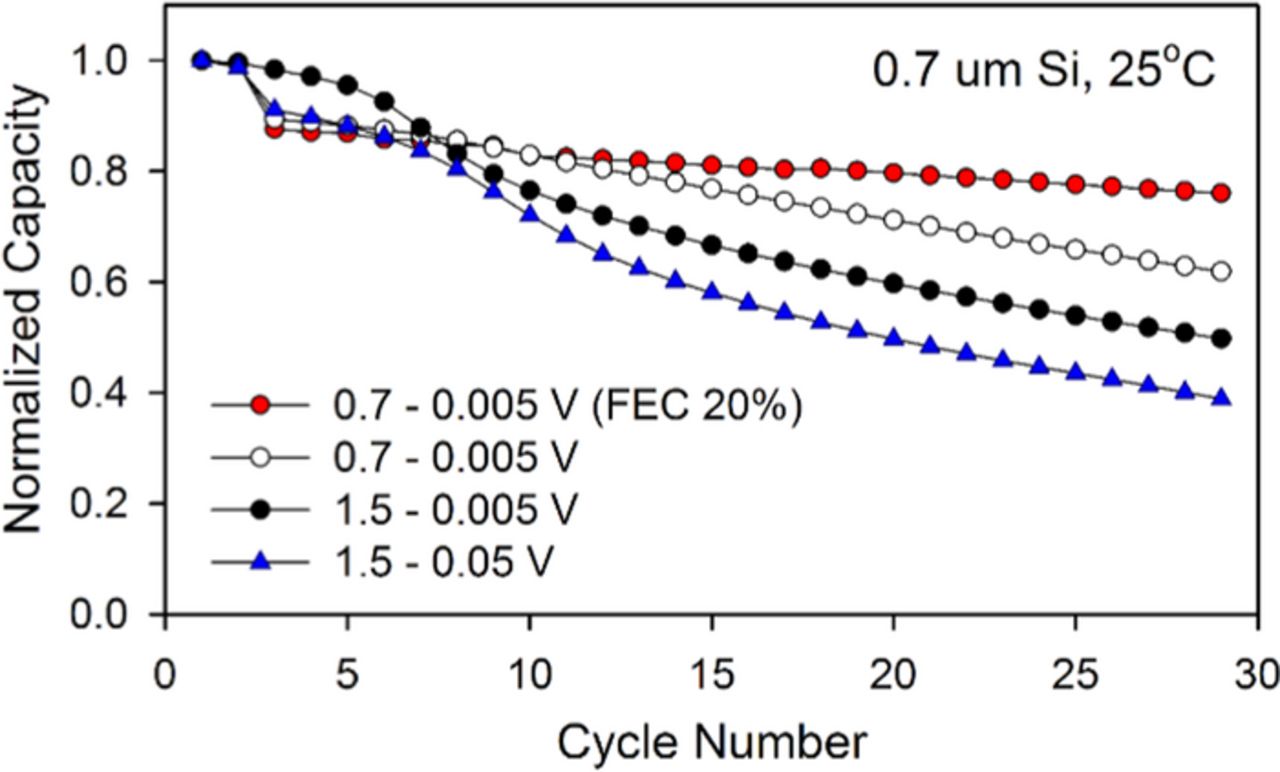
Figure 7. Capacity retentions obtained from Li/Si cells cycled in various cutoff potentials. The cutoff potentials were switched from 3rd cycle.
The evolution of electrode morphology upon cycling has been monitored by SEM and compared in Figure 8. An image of a fresh electrode composed of silicon particles (light gray) and carbon additive (dark gray) is provided in Figure 8a. The silicon powders have been prepared through a milling process resulting in particles with sharp edges and flat facets. The SEM image of the electrode extracted after 5 cycles in potential range of 1.5–0.005 V with the baseline electrolyte is provided in Figure 8b. While the electrode integrity is still maintained, the sharp edges disappear due to the formation of an SEI. Alternatively, SEM images after 15 cycles reveal prominent dark valleys between the silicon and carbon particles on the surface (Fig. 8d), implying that the damage of repeated volume change accumulates and leads to particle isolation and related contact resistance. The SEM images of the electrode extracted after 5 cycles in the potential range of 0.7–0.005 V with electrolyte containing FEC (Fig. 8c) are very similar to electrodes cycled with the baseline electrolyte between 1.5–0.005 V. However, in contrast the electrodes cycled between 0.7–0.005 V with the electrolyte containing FEC retain integrity after 15 cycles showing little evidence of particle isolation (Fig. 8e). The morphological changes of the silicon electrodes correlate with the electrochemical data shown in Figure 7 and the failure mechanisms depicted in Figure 6.
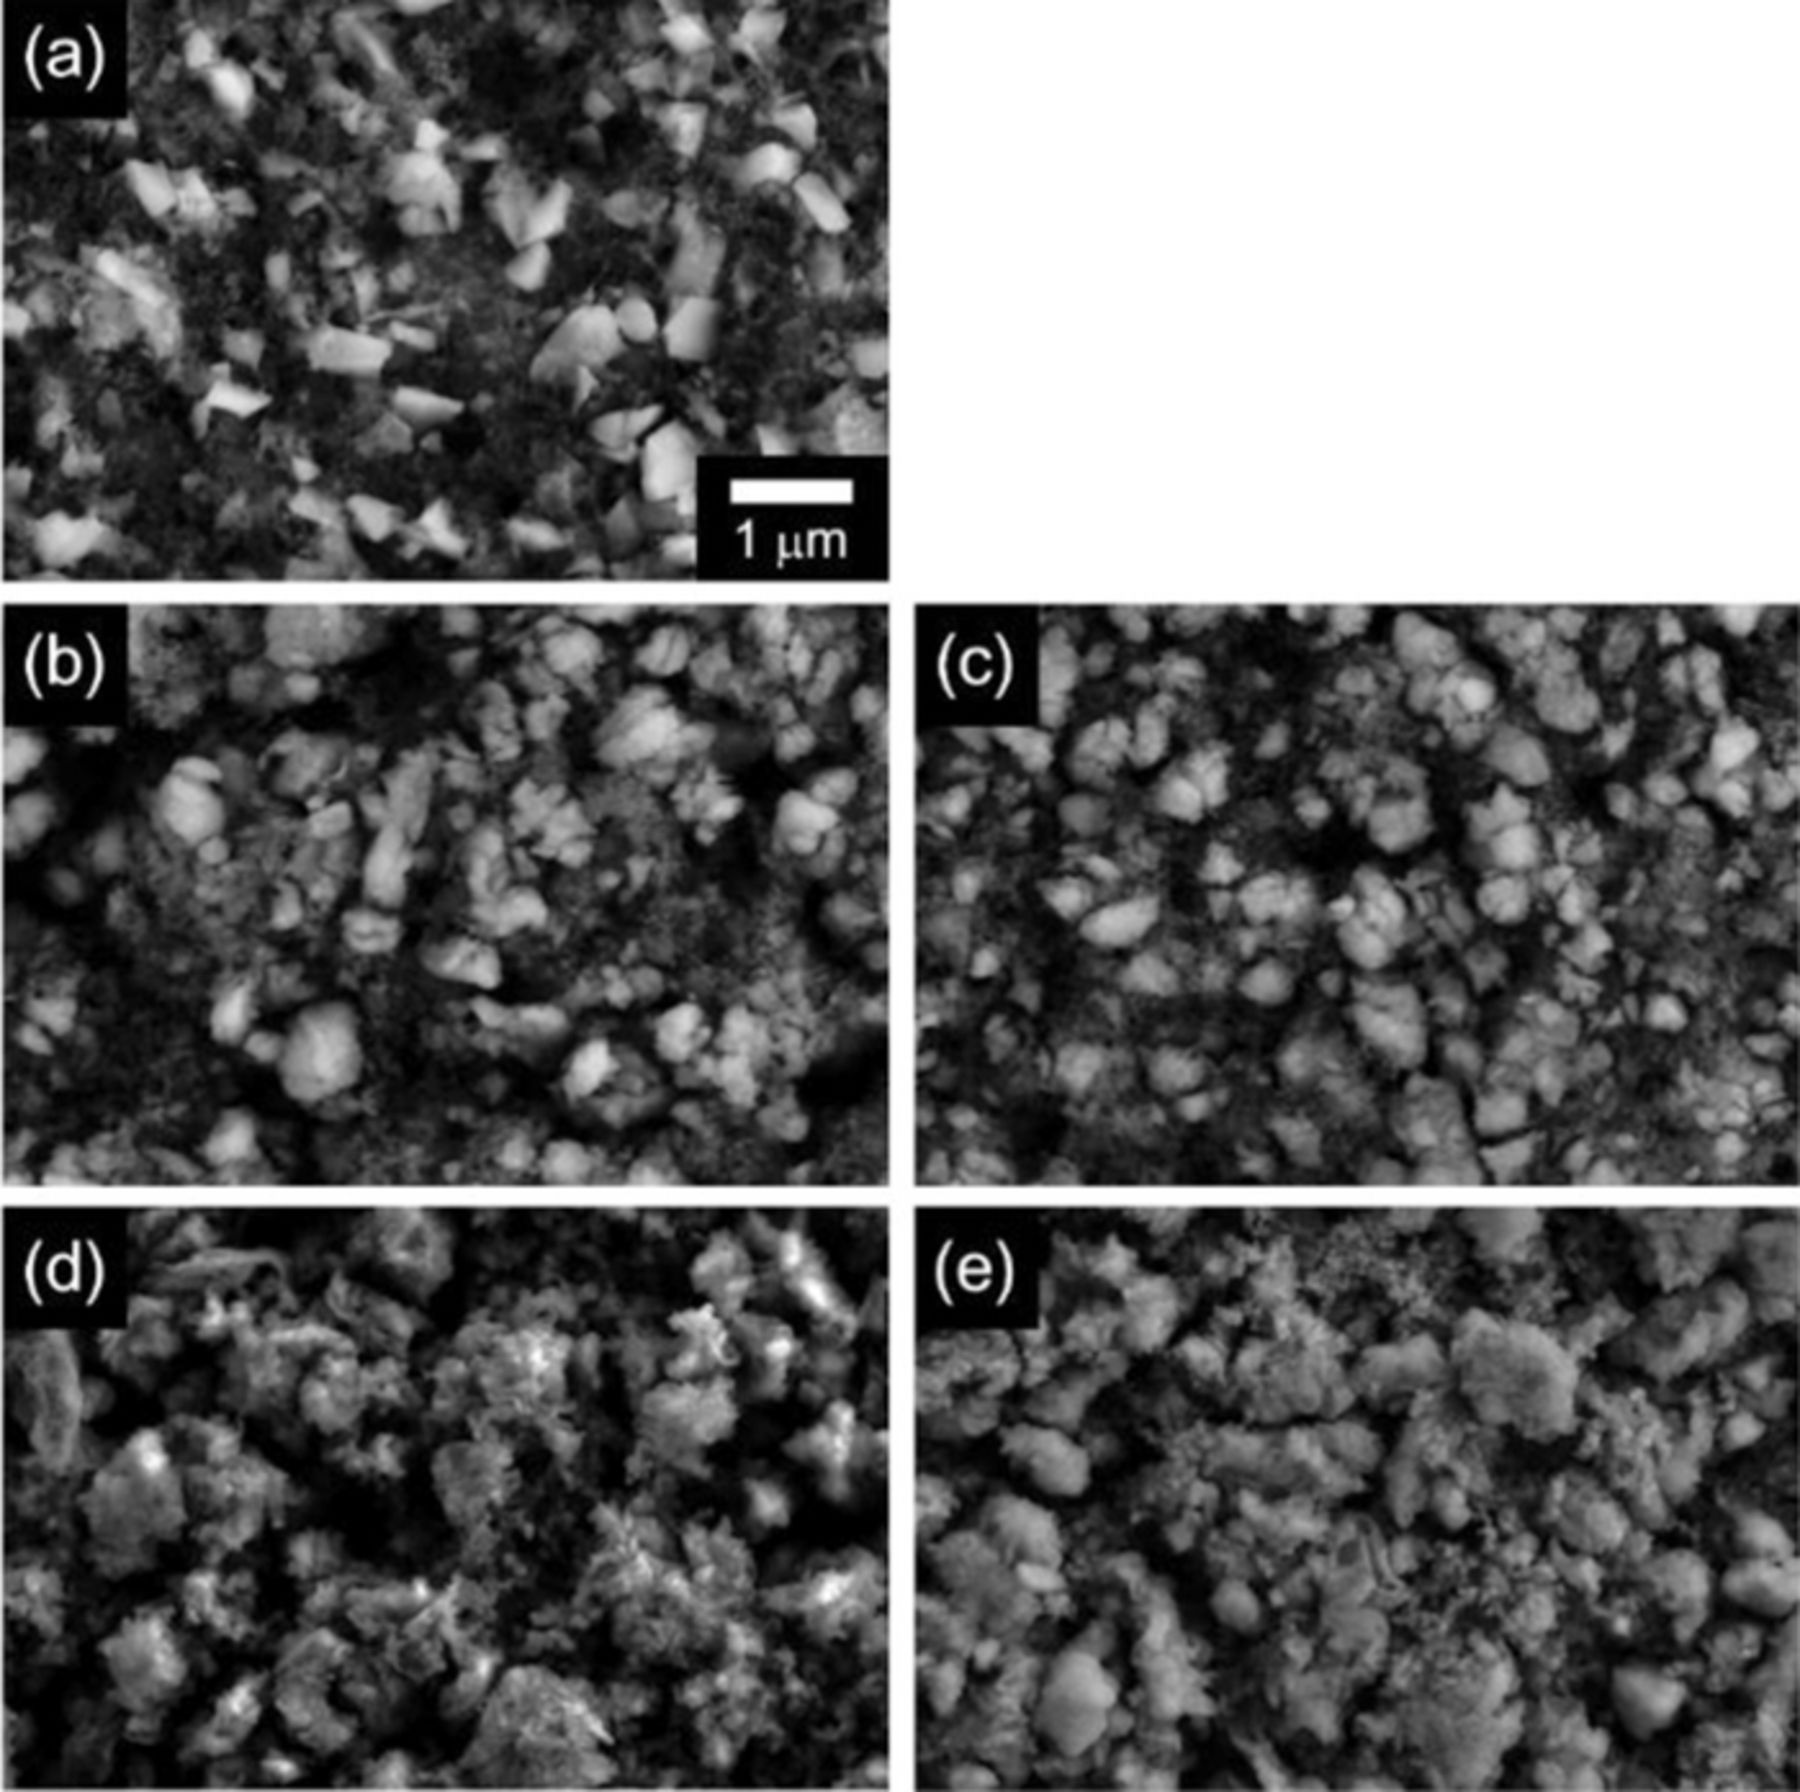
Figure 8. FE-SEM images obtained from fresh electrode (a), after 5 cycles (b) and (c), and after 15 cycles (d) and (e). The electrodes of (b) and (d) were lithiated/delithiated in potential range of 1.5–0.005 V with additive-free electrolyte while the (c) and (e) were cycled in 0.7–0.005 V with FEC-added electrolyte. All cycled electrode was collected after discharging up to 0.7 V in the last cycle.
Conclusions
The dominant failure mechanism of silicon nanoparticle negative electrodes has been investigated via interpretation of the electrochemical cycling data, voltage profiles and differential capacity plots. The majority of capacity loss occurs during the early stages of lithiation. By dividing the lithiation period into four regions (R1, R2, R3, and R4) and monitoring the capacity fade quantitatively during cycling, the capacity fade during the earlier stages of lithiation, R1 and R2, dominates the total capacity fade. The unusual capacity fading behavior results from incomplete delithiation during the previous delithiation cycle. As the silicon particles are delithiated the particle size is decreased and the electrode resistance, predominantly contact and SEI resistance, increases and inhibits lithium extraction. When the silicon electrode is cycled over a narrower potential range or cycled with electrolyte containing added FEC, the electrode has better capacity retention. Modification of either the potential range or the electrolyte formulation diminishes contact loss or SEI resistance during delithiation and improves the electrochemical reversibility of the silicon electrode.
Acknowledgment
The authors gratefully acknowledge funding from Department of Energy Office of Basic Energy Sciences EPSCoR Implementation award (DE-SC0007074).