Abstract
The potential dependent surface structure of Pt(111) electrodes in electrochemical environment was studied by in situ crystal truncation rod measurements and in operando grazing incidence small angle X-ray scattering. Determination of the interface structure in the oxidation region reveal a continuous increase of the coverage of place exchanged atoms toward more positive potentials. The resulting oxide consists of an oxygen rich outer and a Pt-rich inner atomic layer. With increasing potential the oxide approaches a more uniform stoichometry. While place exchange on atomically smooth terraces only occurs above 1.05 V, structural changes of 3D Pt islands, grown by repetitive oxidation/reduction cycles, already commence at 0.8 V, which is assigned to oxidation at Pt steps. Evolution of the 3D island distribution occurs in all stages of the cycles: Whereas Pt oxidation leads to narrowing of the lateral size distribution, vertical island growth occurs during the subsequent reduction.
Export citation and abstract BibTeX RIS

This is an open access article distributed under the terms of the Creative Commons Attribution Non-Commercial No Derivatives 4.0 License (CC BY-NC-ND, http://creativecommons.org/licenses/by-nc-nd/4.0/), which permits non-commercial reuse, distribution, and reproduction in any medium, provided the original work is not changed in any way and is properly cited. For permission for commercial reuse, please email: oa@electrochem.org.
The platinum electrode is one of the most studied electrochemical systems, because of its outstanding reactivity as an electrocatalyst for the hydrogen oxidation reaction (HOR) and the oxygen reduction reaction (ORR). Catalytic life-time and efficiency is limited by aging effects like corrosion and morphological changes, which are predominantly initiated at potentials in the oxidation region. Even though the electrochemical formation of surface oxides on Pt surfaces has been extensively studied in the past, there are still many questions unanswered, mainly about the detailed structure of the oxide and its growth mechanisms.1–9 Early studies on polycrystalline platinum suggested that incipient oxidation proceeds by a mechanism, in which an adsorbed oxygen atom exchanges its place with a surface platinum atom.10–12 The exchange was proposed to be driven by the double layer electric field, which can explain the observed growth kinetics. This place exchange process during electrochemical oxidation was also confirmed qualitatively for monocrystalline surfaces by ex situ studies in ultra-high vacuum using low-energy electron diffraction (LEED).13,14
The first structural in situ investigations on the incipient oxidation of the Pt(111) surface in 0.1 M HClO4 utilizing X-ray measurements by You et al. provided further evidence of the site exchange process for potentials in the oxidation regime.1 Their measurements of the (00L) and the (10L) crystal truncation rods (CTRs) were performed at four potentials between 1.025 and 1.175 V. Although a considerable amount of platinum atoms exchanged places with overlying oxygen atoms, they found that the initial surface state was recovered upon reduction as long as a critical charge transfer of 1.7 e−/Pt had not been exceeded, which happens at E ≈ 1.2 V.1 Similar results were obtained in a recent in situ X-ray study, where the structure of the oxidized surface was determined on the basis of a more extensive set of CTRs.15 This enabled more detailed modeling, allowing for the determination of the precise position of the expelled Pt atom and the subsurface oxygen. Oxidation/reduction at more positive potentials results in the irreversible formation of a Pt surface with an increased roughness in the form of nanoscale 3D islands.14,16–18 The quantitative evolution of the surface morphology during potential cycling into this regime was recently studied by in situ grazing incidence small angle X-ray scattering (GISAXS) measurements,19 performed in the double layer region after each cycle. These studies revealed a potential-dependent lateral island size and a development toward larger, more homogeneously distributed islands with increasing number of cycles. The morphological changes were explained by a model similar to that for Pt deposition and ion erosion under ultra-high vacuum (UHV) conditions.
In continuation of our previous work15,19 we here present in situ CTR measurements of Pt surface oxidation at more positive potentials, where the structural changes on the surface are irreversible. Furthermore, we report the first in operando GISAXS studies in the oxidation/reduction regime, which directly follow the structural changes induced in the nanoscale island morphology during the process.
Experimental
The experiments were performed at the ID03 beam line of the European Synchrotron Radiation Facility, using a photon energy of 22.5 keV, which corresponds to a X-ray wavelength of λ = 0.551 Å. The beam was focused by a toroidal mirror to 50 μm in vertical and 300 μm in horizontal direction at the sample position. The flux of the primary beam was 1011 photons per second. The geometry of the scattering studies is shown schematically in Fig. 1.
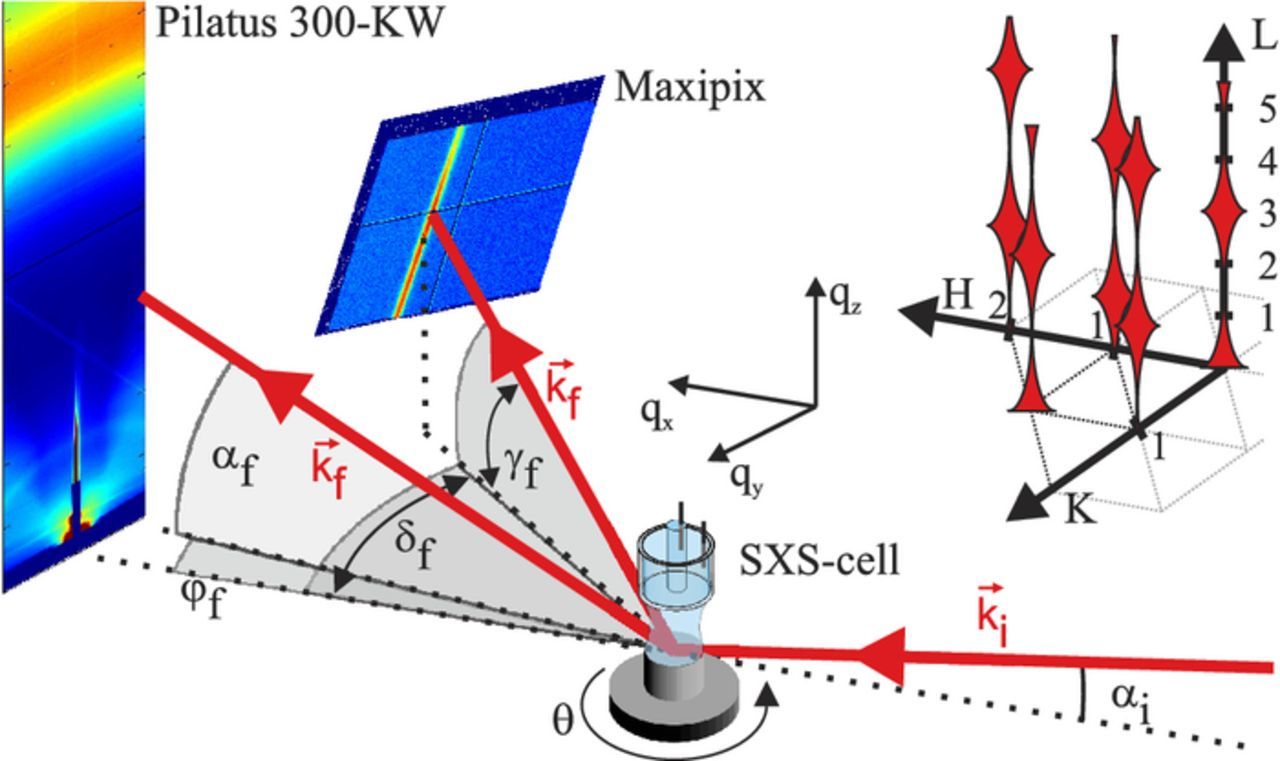
Figure 1. Schematic illustration of the experimental geometry of the in situ GISAXS and CTR measurements. The incident beam with the wave vector  impinges on the sample surface at an incident angle αi. In the GISAXS experiments the diffuse scattering in the near forward direction was recorded with the stationary Pilatus 2D detector. The intensity distributions along the CTRs were obtained with a Maxipix detector that could be rotated around the sample surface normal and in the vertical direction. The locations of the measured CTRs in reciprocal space are illustrated in the inset in the upper right part of the figure.
For all experiments, except the measurements of the specular truncation rods, a grazing incidence angle of αi = 0.30° was used, which is slightly above the critical angle for total external reflection for platinum at the employed photon energy (αc = 0.21°). To record the GISAXS data, a stationary Dectris Pilatus 300-KW detector with 195 × 1475 pixels in the horizontal and vertical directions and a pixel size of 172 × 172 μm2 was used. This detector was positioned at a sample-detector distance of 630 mm. The primary beam impinges horizontally centered at the bottom of the active detector area. Out-of-plane and in-plane scattering angles (αf and φf, respectively) were deduced for each pixel position and from this the corresponding components of the scattering vector in reciprocal space (qx, qy, qz) were determined. At the given position out-of-plane and in-plane scattering angles of (0° < αf < 21.5°) and ( − 1.5° < φf < 1.5°) are accessible, which corresponds to (-0.80 Å− 1 < qx < 0), (−0.30 Å− 1 < qy < 0.30 Å− 1) and (0 < qz < 4.25 Å− 1). Because the intensity of the reflected beam at αi = αf = 0.3° is several orders of magnitude higher than the intensity of the diffuse small angle scattering, the reflected beam was blocked by a tantalum strip (2 × 29 mm2) mounted vertically in front of the Pilatus detector. This is needed to perform measurements with the unattenuated beam and prevent detector damage.
The CTRs were recorded with a Maxipix area detector (516 × 516 pixels, pixel size 55 × 55 μm2) mounted at a distance of 930 mm on a detector arm, which could be rotated within and perpendicular to the plane of the sample surface by angles δf and γf, respectively. As common in studies of the (111) surfaces of fcc metals, a hexagonal unit cell was employed, where the surface normal is along the (0,0,L) direction and the (H,0,0) and (0,K,0) vectors lie in the surface plane, as indicated in the sketch of the top right corner of Fig. 1. The reciprocal space coordinates H, K, and L are given in units  and
and  , with the platinum lattice constant a = 3.92 Å. Because the unit cell contains three monolayers along the surface normal direction, the Bragg-reflections are separated by 3 · c* along L.
The measured intensity distributions along L were converted to the corresponding structure factors F employing the procedure described in Refs. 20, 21. In the quantitative modeling, the experimental data set consisting of five different CTRs was fitted simultaneously by a structural model using the ROD program and the corresponding Robach extension.22 The intensity at small L-values on the specular CTR follows not only from kinematic but also partially from dynamic scattering theory, which makes it more difficult to determine the structure factor. This effect is taken into account in the fitting process by assigning lower weights to the data at small L-values on the specular rod.
As in previous SXRD15,23 and GISAXS24 studies a "hanging meniscus" cell was employed, whose design is described elsewhere.25 In this cell the connection between the upward facing single crystal sample and the electrolyte is established by a freestanding meniscus, which contains approximately 0.2 mL of electrolyte. The electrolyte reservoirs as well as the meniscus-surrounding compartment were continuously purged with Ar to prevent oxygen contamination. All potentials were measured against Ag/AgCl (3.5 M KCl), but are stated against the reversible hydrogen electrode (RHE).
The working electrode was a hat-shaped polished Pt(111) single crystal (Surface Preparation Laboratory) with a circular surface area of 0.38 cm2 (diameter 7 mm). Before each experimental run the single crystal was inductively annealed in an argon (5.0) atmosphere at approximately 900°C for at least 10 minutes. After subsequent cooling in Ar the crystal was protected by a droplet of degassed electrolyte under the Ar atmosphere and then transferred to the electrochemical cell on the diffractometer. The electrolyte (0.1 M HClO4) was prepared from ultrapure HClO4 (Normatom, VWR) and Milli-Q water (18.2 MΩ cm). Prior to all experiments and after the alignment of the sample, the quality of the crystal surface and the cleanliness of the electrolyte was monitored by cyclic voltammograms (CVs) in the potential region between 0.10 and 1.17 V. As shown previously,15 cycling in this range does not result in significant changes of the electrode surface structure. During these CVs and the CVs shown in Fig. 2, the sample was not exposed to the X-ray beam. A detailed discussion of the effect of the beam on the electrochemical behavior is given in Ref. 15. The alignment of the crystal was done at 0.45 V in the double layer region, where surface reactivity is negligible. Furthermore, the X-ray beam was attenuated during alignment in order to minimize any influence on the sample surface or on the electrolyte.

Figure 2. Cyclic voltammograms of Pt(111) in HClO4 recorded in the SXRD cell at 50 mV/s. The black line shows the stable voltammogram of a smooth and clean Pt(111) surface before the applied potential exceeded 1.2 V. The green line shows the CV of the 10th and the red line the CV of the 20th cycle up to 1.37 V.
Results
Cyclic voltammograms (Fig. 2) recorded in the in situ electrochemical cell agree with previous electrochemical data on Pt(111) electrodes in 0.1 M HClO4 solution.2,3,26 Stable CVs with the characteristic features of smooth and clean Pt(111) electrodes were obtained as long as the upper potential limit is restricted to < 1.2 V (black line). In these CVs the pseudocapacitive currents at E < 0.35 V correspond to the underpotential deposition and desorption of a hydrogen monolayer (H-UPD). At 0.6 V ⩽ E ⩽ 0.8 V the reversible "butterfly" peaks occur, which have been attributed to reversible hydroxide adsorption/desorption. This process is followed by a plateau in which no faradaic charge is transferred for well ordered, high quality crystals. The irreversible anodic "oxide" peak at 1.06 V is traditionally assigned to the conversion from OHads to Oads. The corresponding reduction on the cathodic sweep involves at least three different regions and is spread out in the potential.
The presence of small amounts of defects are indicated by the slight slope in the the H-UPD region and the current at the plateau between the "butterfly" region and the oxide peak. These defects are presumably caused by parasitic currents from the edges of the crystal, because wetting of the crystal sides could not be completely avoided with the "hanging meniscus" cell. Although the electrochemical current is affected by this, the X-ray probes exclusively the upper surface of the crystal, which exhibits a very low defect density ( < 0.01 ML).15 Excursions to potentials above 1.2 V induce irreversible changes in the CVs (green and red lines). The emerging peaks in the H-UPD region are attributed to the presence of (110) and (100) defect sites.27–29 The potential range of the double layer region increases and the current of the butterfly peaks decreases. The changes during cycling to potentials above 1.2 V are complex and likely involve formation of (110) steps evolving from (110) defect sites.28 Complementary structural data on the formation of the initial Pt island distribution in the first potential cycle were obtained by in situ CTR measurements (Fig. 3). In these studies, data sets consisting of the specular and four non-specular CTRs (00L, 10L, 20L, 11L and 01L rod) were successively recorded at four potentials (0.45, 1.17, 1.37, and 1.57 V). The data obtained at 0.45 and 1.17 V were already presented in Ref. 15, but are reproduced here in order to facilitate discussion of the oxide's potential-dependence. Following the electrochemical studies by Björling and Feliu, who found that the growth of the oxide on Pt(111) in 0.5 M H2SO4 saturates after less than 180 seconds at potentials higher than 1.20 V,30 the CTR measurements were started only after a waiting time of 5 min after the potential step to the new value. Moreover, the specular truncation rod was recorded twice at each potential, once before (top left in Fig. 3) and once after (bottom right in Fig. 3) the measurements of the non-specular CTRs ( ≈ 30 min. later). At none of the potentials were any significant differences between the two specular rods observed, indicating that the surface structure was stable over this time.
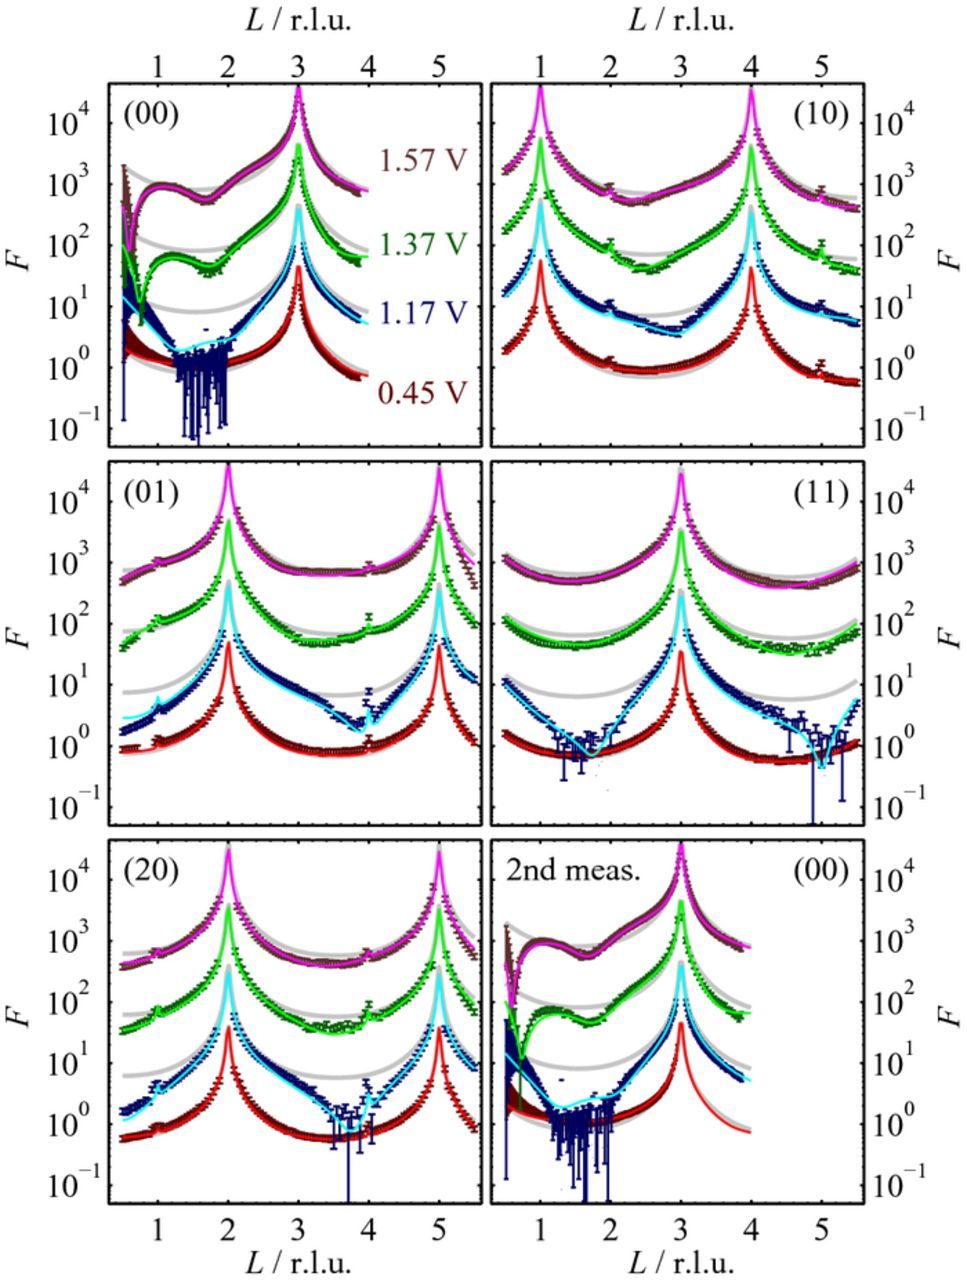
Figure 3. Structure factors of the specular and non-specular CTRs, measured at 0.45, 1.17, 1.37, and 1.57 V (symbols), and corresponding best fits by the structural model (lines). The (H,K) values of the CTRs are given in each figure. For clarity the curves are vertically shifted with respect to each other by a factor of 10. While at 0.45 V the CTRs are close to those of a perfect Pt(111) surface (shown for each curve as faint gray lines), considerable deviations are found for potentials in the oxidation region.
The structure factors F of the specular and the non-specular CTRs exhibit clear potential dependent changes. The CTRs obtained on the freshly-prepared crystal in the double layer region (0.45 V) are very close to those expected for a perfect Pt(111) surface without defects and surface relaxations (faint gray lines). This indicates a high surface quality of the initial sample prior to oxidation. The very weak, sharp peaks at L = 2 and L = 5 on the non-specular truncation rods are caused by the Bragg reflections of stacking faults in the single crystal (approximately 0.02%). At potentials in the Pt oxidation region the CTRs significantly deviate from those of a perfectly smooth crystal, indicating major changes in the atomic surface structure. At 1.17 V the intensity in the specular rod strongly decreases and for 1.25 < L < 2.05 reaches values close to the background scattering. At more positive potentials the intensity recovers, revealing two distinct minima (located for 1.37 V at L = 0.75 and L = 1.75 and for 1.57 V at L = 0.60 and 1.65) indicative of a distinct surface layer of different density. In the corresponding non-specular CTRs, e.g., in the (1,0) CTR, a similar decrease of the intensity in between the Bragg peaks is observed. At 1.17 V the minimum is shifted to higher L values than the anti-Bragg position (at the center in between the Bragg peaks) as expected for a compression of the top-most layers. For 1.37 V and 1.57 V this minimum is displaced to lower L values than the anti-Bragg position, indicating a progressive expansion of the topmost layers.
In order to quantify these structural changes we performed detailed fits of the data sets to the atomic structure models, which were also used in our previous study of the initial stage of Pt oxidation (schematically depicted in Figs. 4a, 4b).15 The model for the initial smooth surface consists of two Pt layers on top of a perfect Pt(111) bulk crystal. For the two topmost layers the occupancies θi (i=1, 2), the in- and out-of-plane root-mean-square displacements Δri and Δzi from the mean Pt lattice positions, and the interlayer spacing d12 are free fit parameters. Also included in the model is the innermost water layer of the double layer. The best fit with this model is in excellent agreement with the experimental data at 0.45 V. The corresponding fit parameters show only minor deviations from a perfectly truncated bulk crystal. In particular, the two Pt layers of the surface unit cell are completely occupied and exhibit no vacancies or surface roughness. In agreement with previous results,31–36 the topmost Pt layer is 0.8% expanded relative to the bulk Pt(111) lattice spacing (2.27 Å) and the mean squared displacements of the Pt atoms in the surface layers are negligible within the errors.
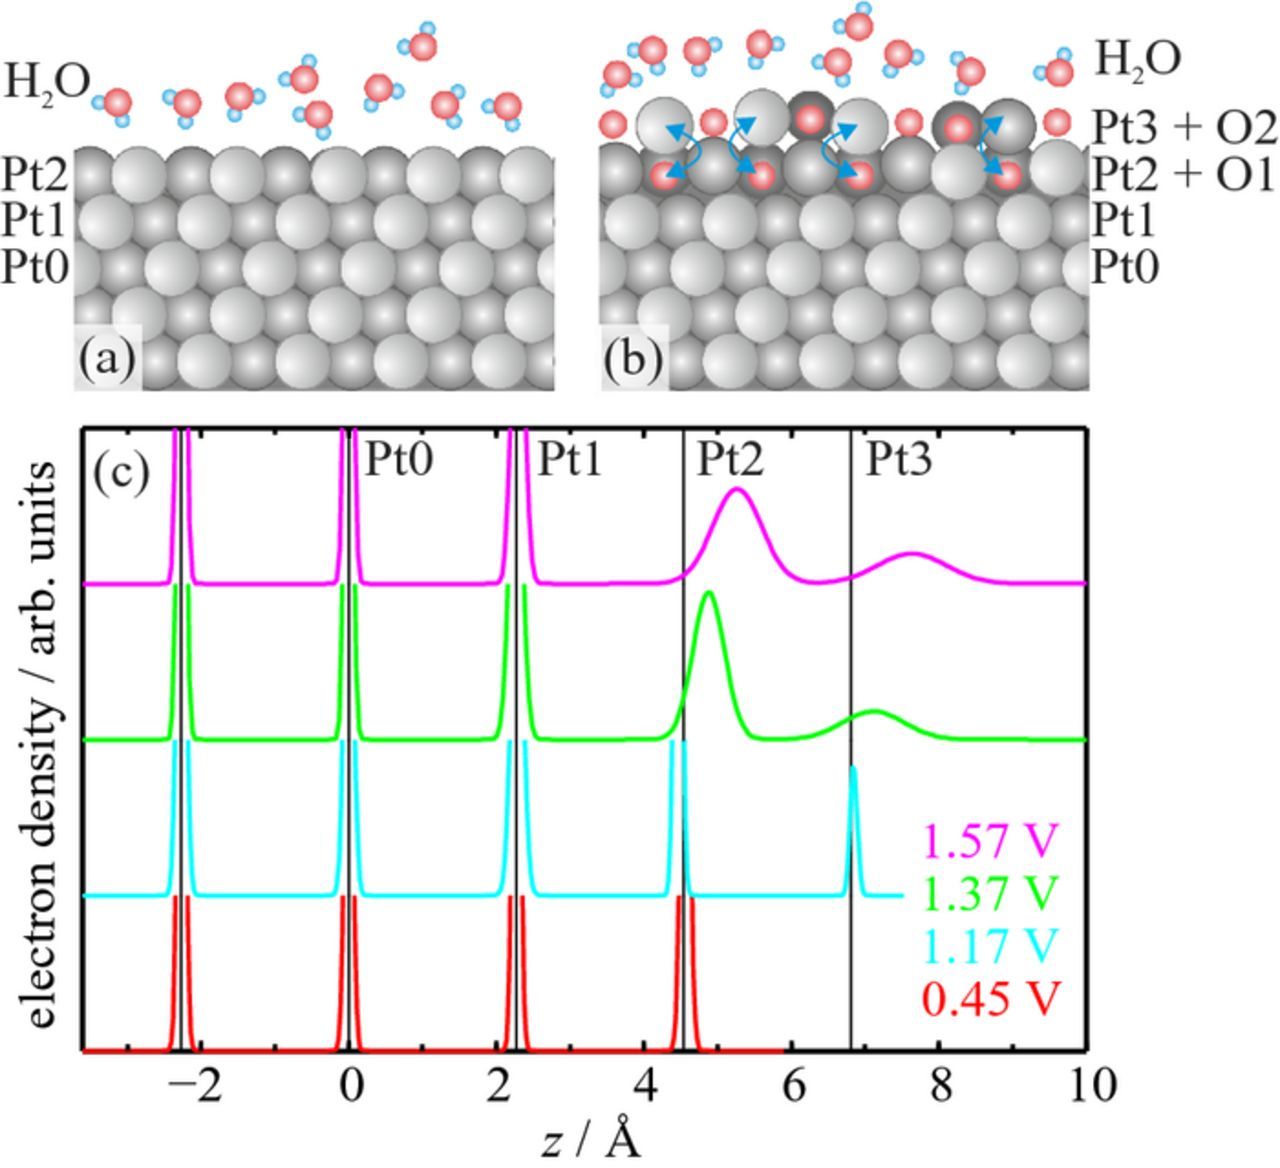
Figure 4. Structural models used to fit the CTRs of (a) the smooth Pt(111) surface at 0.45 V and (b) the surface at potentials ⩾ 1.17 V, where Pt place exchange occurs. (c) The corresponding electron density profiles along the surface normal (averaged within the surface plane). Note that the density profiles of the peaks describing undisturbed Pt layers are truncated.
While this simple model is well suited for smooth Pt(111), it is inapplicable for the oxidized surface. In our previous study different structural models were tested to describe the surface at potentials ⩾ 1.17 V. The place exchange model depicted in Fig. 4b provided the best fit.15 Here, Pt atoms in the original surface layer (Pt2) are allowed to exchange their positions with adsorbed oxygen atoms. This results in an additional Pt layer on top (Pt3) and a corresponding layer of subsurface oxygen (O1). The best fit result was obtained by placing the exchanged Pt atoms directly above their initial position.15 The precise locations of the oxygen atoms cannot be determined with any accuracy from these fits, because of their much lower X-ray scattering cross sections. In the final model they were placed in Pt lattice positions. Because of these effects as well as systematic errors due to cross correlation of parameters, the actual uncertainties in the structural parameters may be larger than the errors given in Table I, which only give the errors of the non-linear least-squares fit for the chosen model. However, all trends and conclusions discussed below are robust and also found in a number of alternative structural models that were considered but resulted in slightly worse fits.
Table I. Parameters for the best fits of the CTRs using the models shown in Fig. 4. Given are the exchange rates θex, the in-plane (Δri) and the out-of-plane (Δzi) root-mean-squared displacements of the Pt atoms in the three topmost layers and the distances between these layers d12 and d23. The given uncertainties correspond to the errors of the non-linear least-squares fit for the chosen model.
| E/V | 1.17 | 1.37 | 1.57 |
|---|---|---|---|
| θex | 0.22 ± 0.04 | 0.37 ± 0.01 | 0.45 ± 0.01 |
| d12/Å | 2.17 ± 0.01 | 2.61 ± 0.01 | 2.97 ± 0.01 |
| d23/Å | 2.41 ± 0.02 | 2.23 ± 0.01 | 2.37 ± 0.01 |
| Δr1/Å | 0.08 ± 0.01 | 0.14 ± 0.01 | 0.11 ± 0.01 |
| Δr2/Å | 0.23 ± 0.01 | 0.66 ± 0.03 | 0.68 ± 0.05 |
| Δr3/Å | 0.56 ± 0.04 | 0.49 ± 0.04 | 0.64 ± 0.06 |
| Δz1/Å | 0.10 ± 0.02 | 0.12 ± 0.01 | 0.11 ± 0.01 |
| Δz2/Å | 0.08 ± 0.01 | 0.30 ± 0.02 | 0.47 ± 0.04 |
| Δz3/Å | 0.08 ± 0.01 | 0.59 ± 0.06 | 0.66 ± 0.09 |
The best fits of the experimental data show a clear trend toward increased place exchange with more positive potential. In particular, the fraction of place-exchanged Pt atoms θex exhibits a continuous increase from 22% at 1.17 V to 45% at 1.57 V. In parallel, the structural order within the two topmost Pt layers deteriorates as clearly visible in the corresponding electron density profiles (Fig. 4c). At 1.17 V the distance between the Pt layers and the out-of-plane displacements Δzi are almost identical to those of the initial (oxide-free) Pt surface. Only within the Pt planes is the order slightly decreased, as indicated by the larger in-plane displacements Δri. At more positive potentials, both in- and out-of-plane displacements are significantly enhanced for the first two layers, reaching up to 0.68 Å. Furthermore, the layer spacings increase, leading to a vertical expansion of the top Pt bilayer by 0.3 Å and 0.8 Å at 1.37 V and 1.57 V, respectively. These pronounced deviations from the Pt bulk lattice suggest a highly disordered arrangement with a similar density of Pt and O atoms in the layers. We assign this to a largely disordered Pt oxide phase that exhibits residual Pt(111) order. All these observations indicate a gradual transition from a surface covered by an ensemble of predominantly isolated place-exchanged atoms to a Pt(111) electrode with an ultrathin continuous Pt oxide layer on top. The fractional occupancies of the first Pt layers lead to an enhanced root-mean-square roughness of the surface, which is responsible for the pronounced decrease in the intensities of the CTRs in between the Bragg peaks. At more positive potentials the oxide bilayer becomes more homogeneous, leading to the observed layering oscillations in the specular CTR. In accordance with electrochemical measurements on polycrystalline platinum, the oxide thickness is limited to ≈ 5 Å even at a potential of 1.57 V.37 The data at 1.17 V is in good qualitative agreement with the earlier study by You et al., although the latter reported a higher fraction of exchanged atoms.1 However, the Pt crystal in that study exhibited ≈ 15% of atoms in stacking faults, which were found to be lifted first.
Subsequent reduction of this oxide by reversing the potential into the double layer region leads to a Pt(111) surface with considerably larger roughness. Specifically, nanoscale Pt islands are formed on the surface, which grow in height with increasing number of oxidation/reduction cycles.19 In our previous study we quantitatively studied this restructuring process by recording between cycles in situ GISAXS images at potentials in the double layer region. To obtain insight into Pt oxidation/reduction on surface that already had been exposed to previous potential cycles and thus are covered by nanoscale islands, we here performed in operando GISAXS measurements during cycles into the oxidation region. In order to visualize the changes in the GISAXS images, which correspond to the formation of 3D surfaces structures, we adopt the procedure used in our previous in situ GISAXS studies.19,24 More precisely, all detector images show a contribution to the intensity, which originates from bulk scattering by the electrolyte, air, Kapton windows and scattering from the μm scale step arrangement caused by the sample miscut. Because the sample was not moved within each GISAXS experiment, these contributions are almost static. To remove this static background scattering, the intensity distribution recorded on the smooth surface prior to each experimental run was subtracted from the detector images recorded during the subsequent oxidation/reduction cycles.
As an example, the background subtracted intensities from a Pt(111) surface after 9 cycles to 1.37 V in the double layer region and at the most positive potential during the subsequent 10th cycle are shown in Figs. 5a and 5b, respectively. Obviously, the pronounced peaks at qy ≈ ±0.10 Å− 1, which originate from the small-angle scattering of the nanoscale islands,19 do not completely vanish or change in position during oxidation and oxide reduction. Quantitative fits of these potential-dependent cross sections reveal that the peak position is almost perfectly constant over the whole potential cycle. Thus, the nanoscale Pt island structure is preserved as its top layers undergo oxidation and reduction. However, the peaks obviously decrease in intensity in the oxidation region. The decrease originates predominantly from a steeper decay of the intensity along the qz direction. This can be rationalized by a more gradual electron density profile across the interface, which would be expected in the presence of an oxide layer. In that respect, the qz dependence of the diffuse scattering exhibits a similar trend as the specular CTRs measured in this potential regime, which also exhibit a steep decay at small qz values.
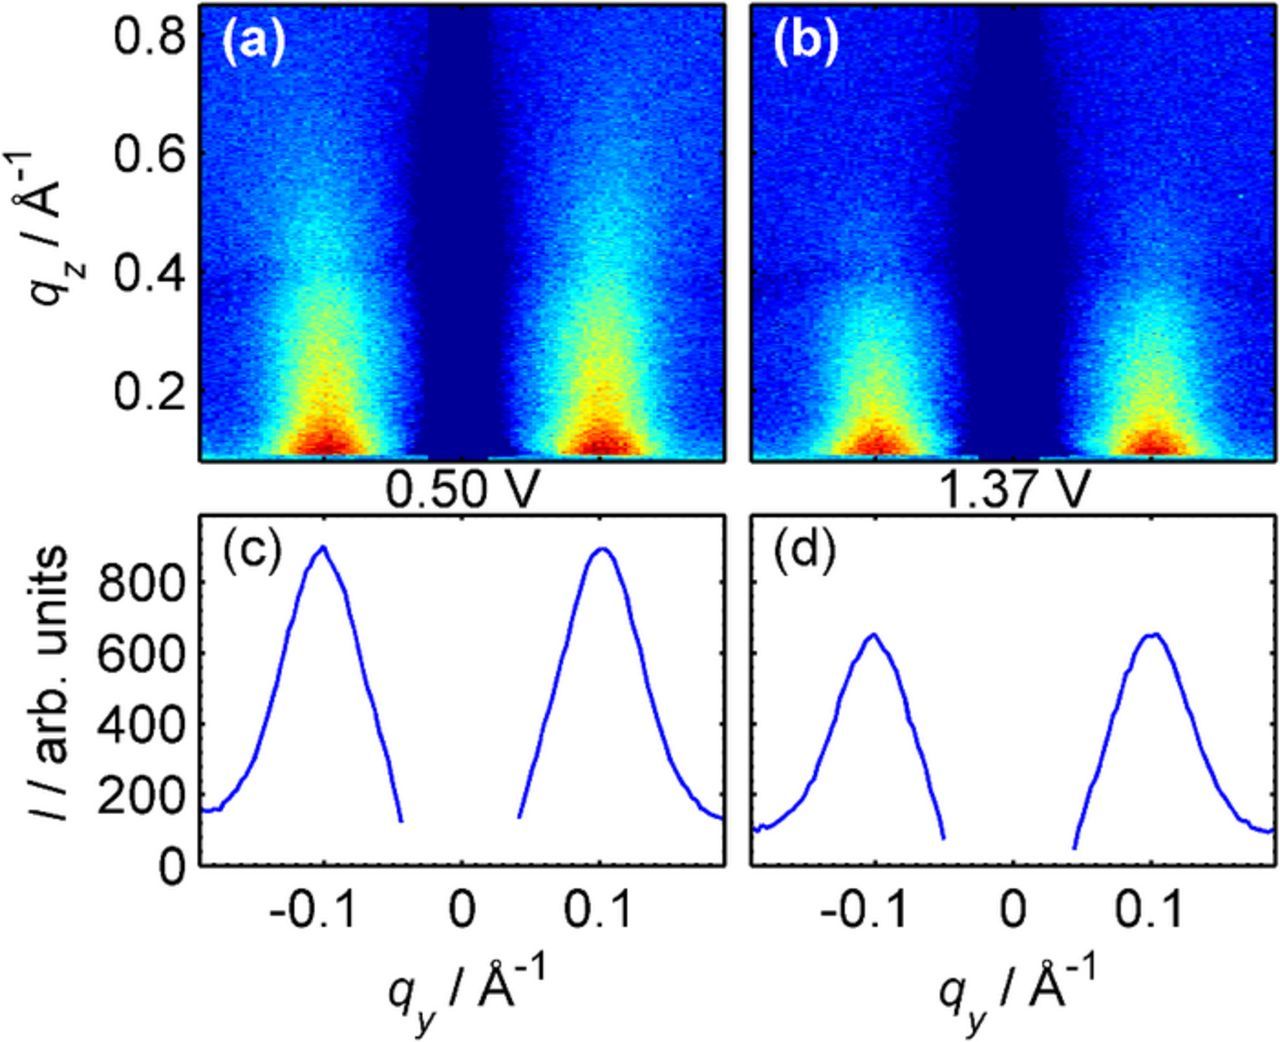
Figure 5. The diffusely scattered intensity recorded on the reduced surface (a) after nine oxidation/reduction cycles and (b) on the oxidized surface at 1.37 V, measured during the tenth cycle. (c,d) shows the corresponding intensity curves, obtained by integrating the detector data from qz = 0.1 Å− 1 to 0.6 Å− 1.
For detailed characterization of the potential-dependent changes in the island structure, such GISAXS images were measured at an image acquisition rate of 0.5 Hz during potential cycling. The data obtained during two such experiments, where the potential was cycled in the potential range 0.50 to 1.37 V at 10 mV/s, are displayed in Fig. 6. Here, the horizontal cross sections (integrated over the vertical range 0.1 Å− 1 ⩽ qz ⩽ 0.6 Å− 1) are shown as a function of the applied potential for the 10th and 20th oxidation/reduction cycle, respectively (Figs. 6a, 6b). In accordance with the measurements described in Ref. 19, the intensity maxima of the side peaks are located at qy = ±0.100 Å− 1 during the 10th and at qy = ±0.095 Å− 1 during the 20th cycle, which corresponds to average island spacings of 73 and 76 Å, respectively.
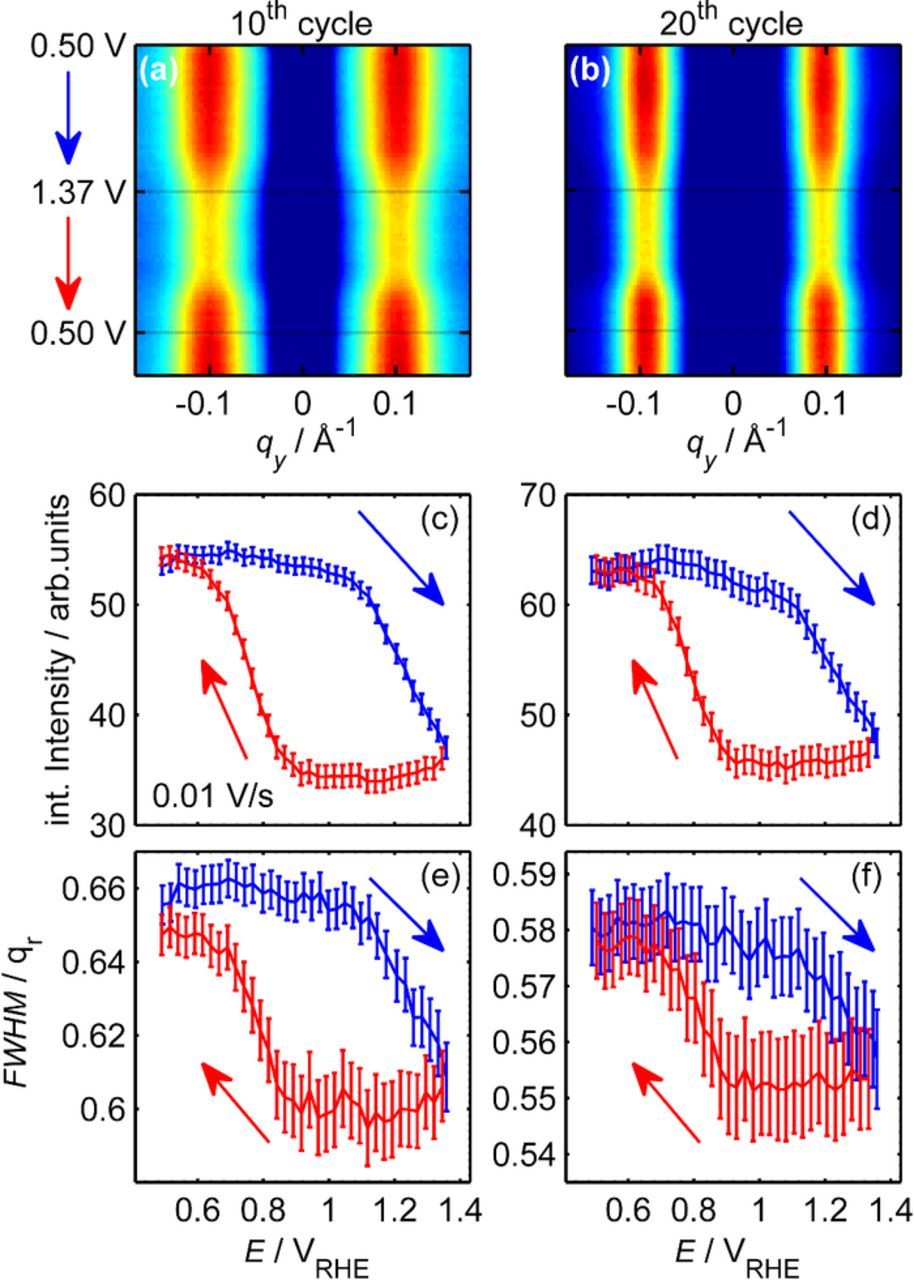
Figure 6. Evolution of the diffuse scattering peaks during potential cycling between 0.50 and 1.37 V at 10 mV/s during (a,c,e) the 10th and (b,d,f) the 20th oxidation/reduction cycle. (a,b) GISAXS intensity profiles at 0.1 Å− 1 ⩽ qz ⩽ 0.6 Å− 1 as a function of time. Variation of (c,d) the integrated intensity and (e,f) the FWHM of the diffuse scattering peak during the potential sweep in positive (blue) and negative (red) directions, illustrating the decrease and subsequent increase of the diffuse scattering and the concomitant changes in peak width during oxidation and reduction, respectively.
While the general Pt surface morphology persists over the entire potential region, the detailed nanoscale structure is affected by oxidation and oxide reduction. This becomes apparent in the clear variations of the integrated peak intensity with potential. Quantitative data on the potential-dependent diffuse scattering intensity during the two cycles are presented in Figs. 6c and 6d. In both cases, similar behavior is observed. For the oxide-free surface in the double layer range (E < 0.7 V) the intensity stays at a constant level. This may be expected since no surface reactions occur in this region. Upon sweeping the potential to more positive values the intensity decreases. Two distinct regions can be observed, which are clearly correlated with features in the corresponding voltammogram of the freshly prepared Pt(111) surface (see Fig. 2): First, a slow, approximately linear decrease commences at ⩾ 0.8 V, i.e., positive of the potential of the sharp butterfly peak. Then, at ≈ 1.1 V, the intensity starts to decrease more steeply. The change in slope is well correlated with the potential of the prominent oxidation peak in the CV. As discussed above, this current peak denotes the onset of place exchange on smooth Pt(111) surfaces, which can explain the more pronounced surface restructuring. Interestingly, the change in the potential dependence of the GISAXS signal is observed, although the corresponding CV does not exhibit any distinct features in this potential range (see Fig. 2, 10th and 20th cycle). This suggests that also on Pt electrodes with high surface roughness place exchange commences at the same potential. The initial decrease between 0.8 and 1.05 V is considerably larger during the 20th than during the 10th cycle, suggesting that the surface restructuring process in this region is assisted by surface roughness, i.e., higher islands on the surface. Furthermore, in the CVs obtained after cycles to 1.37 V, a distinct current increase is found at that potential, which similarly becomes larger with increasing number of cycles. Based on these observations we tentatively assign the first potential region to step-edge oxidation and other defects and the second one to place exchange on terraces.
During the subsequent sweep in the negative direction the intensity remains largely constant until ≈ 0.9 V, where it rapidly recovers. Again the potential range of this change in intensity is in excellent agreement with that of the oxide reduction peak in the CV. The potential-dependent changes in intensity during cycling are accompanied by changes in the width of the diffuse scattering peak (Figs. 6e, 6f), which shine additional light on the restructuring mechanism. Specifically, the FWHM slightly decreases during Pt oxidation and increases again in the region of the cathodic reduction peak. However, the peak width prior to the cycle is only partly recovered during oxide reduction. This is in accordance with the continuous decrease in FWHM during cycling19 and reveals that the short range ordering of the island distribution is directly linked to the oxide formation process. The described potential behavior is characteristic for the in operando GISAXS measurements and was also found in the other potential cycles of this experiment as well as in cycles to more positive potential limits Emax.
Discussion
Based on the results of these comprehensive studies we can develop a detailed picture of the microscopic processes leading to structural reorganization of the Pt surface morphology during oxidation/reduction cycles. This will be discussed in the following, starting with the oxidation and subsequent reduction of the initial smooth Pt(111) surface. In this case the initial stage of Pt restructuring is the place exchange of an atom in the metal surface layer with oxygen. As already shown in previous studies,15 the exchanged Pt atoms are located directly above the sub-surface oxygen - an arrangement that may be stabilized by oxygen adsorbates on the surrounding Pt surface. At sufficiently low coverages θex of these ensembles, the exchanged atoms are well separated from each other (assuming the absence of strong attractive interactions and thus a random distribution), i.e., only isolated exchanged Pt surrounded by undisturbed oxygen-covered Pt(111) or small clusters (dimers, trimers) of exchanged atoms exist. Under these conditions, the place exchange was found to be fully reversible and the initially smooth surface was fully restored after subsequent reduction.1,15 The latter suggests a high probability of the exchanged Pt atoms to recombine with a vacancy site after desorption of the sub-surface oxygen atoms. This may either occur via direct return of the vertically displaced Pt atoms into their original lattice sites or via intermediate creation of a Pt adatom and a vacancy, which subsequently recombine with each other or with neighboring vacancies and adatoms, respectively. The latter requires a low activation energy for adatom-vacancy recombination, in accordance with DFT calculations for pure Pt(111).38
The situation changes at higher θex, where exchange at neighboring sites in the Pt surface layer becomes increasingly likely. Previous electrochemical and in situ SXRD studies have shown that θex increases linearly with logarithm of time at a given potential15,39 leading to an effective saturation coverage after 180 s.30 Furthermore, this saturation coverage of exchanged Pt continuously increases toward more positive potentials, according to our CTR measurements and electrochemical measurements by Björling et al.30 Already at 1.17 V a coverage of θex = 0.22 is reached, at which irreversible surface restructuring occurs. We assign this to the formation of larger Pt-oxide clusters, in which the Pt atoms of the top two layers strongly deviate from the original lattice positions. At even more positive potentials the fraction of exchanged Pt atoms and the disorder in the topmost layers further increase, leading to an exchange of almost every second Pt surface atom at 1.57 V. Here, the Pt(111) surface is covered by a Pt oxide layer of ≈ 5 Å thickness, which has nearly the same Pt density in the upper and lower atomic layer of the oxide. This implies that the Pt surface at this potential is covered by an oxide film of rather uniform stoichometry. Assuming that the Pt atoms in the first two layers (Pt3 and Pt2 in Fig. 4) are oxidized, whereas those in the undisturbed lattice below correspond to metallic Pt, and considering that the total number of atoms in these two topmost layers is one per Pt lattice site, our results are in good agreement with previous studies that find a charge transfer of about 2 e− per Pt surface atom in this potential range.1,14,30
Because of the loss of the structural integrity of the Pt lattice, it is highly unlikely that subsequent reduction of this oxide results in restoration of the original smooth surface under these conditions. Instead, formation of a Pt surface with a high density of adatoms and vacancies as well as small adatom and vacancy clusters is expected. Because each exchange generates one adatom and one vacancy and only a small amount of Pt is dissolved into the electrolyte,40,41 the adatom and vacancy coverages after reduction will be approximately equal and most probably smaller than θex due to adatom-vacancy recombination. Similar to the case of low θex, some of this recombination will occur immediately after reduction, i.e., in parallel to sub-surface oxygen desorption. However, complete recombination of the remaining Pt adatoms and vacancies is unlikely (see below), leading to nucleation and growth of adatom and vacancy islands on the Pt surface. As discussed in Ref. 19, this process exhibits strong similarities to the homoepitaxial growth or ion erosion of Pt(111) under vacuum conditions. Also in this case small fractal islands with a negligible mobility of the Pt step edge atoms were found below 475 K,42 indicating that the stability of the adatom and vacancy islands is a kinetic effect. In addition, the stability of the Pt islands may be enhanced by specific adsorption of oxygenated species at low coordinated sites.
Finally, we address briefly the oxidation of the surface after several cycles, i.e., in the presence of 3D islands and pits. This surface exhibits a high density of steps, which may influence the microscopic scenario discussed above. In the gas phase, oxidation of stepped Pt(111) surfaces has been shown to commence with the formation of 1D oxides along the island steps.43,44 This was supported by DFT calculations, which found that step-edge oxidation requires a lower chemical potential than oxide formation on the terraces.44 Our in operando GISAXS studies during oxidation indicate that oxidation of the nanoscale islands commences already at potentials that are ≈ 250 mV negative of the region where place exchange occurs on smooth Pt(111) terraces. Specifically, these changes commence at the potential of 0.8 V, which is associated with the adsorption of an oxygen species on top of the metal substrate. We attribute the small changes in the 3D island morphology found in this initial stage to step-edge oxidation processes. The latter would result in a preferred oxidation of the edges of the nanoscale Pt islands and lead to an effective broadening of the island shape (or more precisely, the total electron distribution describing the islands), resulting in a change in the island form factors. This could account for the small changes in GISAXS intensity. The average island distances, which determines the position of the diffuse scattering peaks, would not be affected, in accordance with our observations.
At potentials ⩾ 1.05 V also place exchange oxidation of Pt atoms in the center of the terraces occurs. This leads to the formation of an ≈ 5 Å thick Pt oxide layer, which apparently covers the nanoscale Pt islands rather homogeneously and causes even more pronounced changes in the island shape. The existing oxide-covered island structure is stable until the potential drops below 0.9 V, where the oxide is completely reduced, resulting in a rapid growth in the GISAXS peak intensity. The latter indicates that the vertical growth of the nanoscale Pt islands occurs predominantly after oxide reduction, in accordance with the conclusions of Ref. 19.
Interestingly, the gradual coarsening toward a more homogeneous island distribution, which is indicated by a gradual decrease in the width of the GISAXS peak, occurs predominantly during Pt oxidation, whereas during reduction the peak broadens again. The origin of this behavior is not fully understood yet. Potentially, specific surface structures, e.g., very small Pt islands, are preferably attacked by oxidation and eventually degrade, resulting in a more homogeneous topography.
Conclusions
Based on in situ X-ray scattering results we were able to develop a detailed picture of the microscopic processes leading to structural reorganization of the Pt surface upon oxidation/reduction cycles. At sufficiently low coverages of place exchange ensembles, the initial smooth surface was fully restored after subsequent reduction. For higher coverages of exchanged Pt atoms (i.e., higher potentials) more extensive, irreversible surface restructuring occurs. This is attributed to the formation of larger oxide clusters from neighboring exchanged Pt and the associated structural collapse of the Pt lattice. In addition, the more negative potential range required for reduction of these oxide layers may play a role in the irreversible formation of nanoscale Pt islands under those conditions. The in operando GISAXS measurements show that oxidation at step edges is promoted and commences already at 0.8 V. However, the process of place exchange on the terraces of the nanoscale Pt islands occurs at the same potential as on smooth Pt(111). Overall, the GISAXS observations demonstrate that the Pt surface restructuring during potential cycling is a complex process, involving diverse structural changes in various potential regions. Furthermore, the rough, oxide-covered surface is structurally stable down to the potential of the butterfly peak in the initial voltammogram, where reduction and surface restructuring occur.
Acknowledgments
We thank the European Synchrotron Radiation Facility for providing beam time and the ID03 staff for technical assistance. MR, FR, BR, JS, and OMM gratefully acknowledge financial support by the Deutsche Forschungsgemeinschaft via MA 1618/13 and MA 1618/20. DAH thanks NSERC for financial support.