
Abstract
The development and subsequent incorporation of flame retardant additives (FRAs) has become a priority for Li-Ion battery research and development. Triphenyl phosphate (TPP) was studied to ascertain the safety benefits and electrochemical performance when incorporated into a LiPF6/ethylene carbonate (EC)/ethyl methyl carbonate (EMC) electrolyte system. The flammability of electrolytes containing TPP was investigated via self-extinguishing time and flash point analysis. The electrochemical stability was studied by cyclic voltammetry (CV), battery cycling in graphite/LiNi0.8Co0.2O2 cells, electrochemical impedance spectroscopy (EIS) and Tafel polarization. In order to better understand the role of TPP, ex-situ surface analysis of the cycled electrodes was conducted with X-ray photoelectron spectroscopy (XPS) and scanning electron microscopy (SEM). Incorporation of TPP results in a moderate decrease in the flammability of the electrolyte with relatively minor detrimental effects on the performance of the cells and thus is a promising additive for lithium ion batteries.
Export citation and abstract BibTeX RIS
Lithium-ion battery technology in recent years has proven itself as a dependable energy storage medium for commercial consumer electronics. Li-ion batteries offer higher operating cell voltage, higher energy density, longer cycle life and lower self-discharge. These advantages make Li-ion cells superior to other rechargeable systems such as Ni-MH and Ni-Cd. Safety issues however remain a concern with today's Li-ion batteries since the electrolyte is typically a blend of ethylene carbonate (EC) with ethyl methyl carbonate (EMC) with a lithium salt, such as lithium hexafluorophosphate (LiPF6). These electrolyte solutions are flammable and a risk of thermal runaway is a concern. The main causes of Li-ion cell thermal runaway are attributed to both internal short via metallic dendrite accumulation and/or cell overcharge leading to destabilizing over-deliathiation of the cathode.1–5
The potential for thermal runaway has led to efforts to reduce the fire risk and the propagation within Li-ion cells. Many of these efforts focus on the development, and subsequent incorporation, of flame retardant additives (FRA) into the electrolyte solution. A number of organophosphorus compounds have been investigated for lithium ion batteries. For example, various research groups have reported the use of trimethyl phosphate (TMP),6 triphenyl phosphate (TPP),3,7–11 tris(2,2,2-trifluoroethyl) phosphate,12–14 and dimethyl methylphosphonate (DMMP)1,4,15 in lithium ion battery electrolytes. These additives are believed to result in lower electrolyte flammability due to the formation of a layer of char which protects the uncombusted condensed phase and/or the decomposition products serving as radical scavengers in the gas phase inhibiting combustion chain reactions.16,17 Of the phosphate-based FRAs, triphenyl phosphate (TPP) is especially attractive since it has been reported to improve the safety of Li-ion cells under abuse conditions by lowering the flammability of electrolytes when incorporated in sufficient proportion,18 and it has been observed to provide good life characteristics.7,9
Some FRAs have been observed to disrupt the formation and stability of the anode solid electrolyte interphase (SEI) layer, and are thus detrimental to the cycling performance of the cells. FRAs have also been investigated in combination with SEI forming additives such as lithium bis(oxalato)borate (LiBOB) or vinylene carbonate (VC) which generate a more stable anode SEI and limit the detrimental effects of the FRA.7,9,19 A stable SEI layer is critical to the proper functioning of Li-Ion cells, allowing the intercalation and de-intercalation of Li+ at the graphite anode and preventing further reduction of the electrolyte.2 The formation mechanisms of the SEI and the role of the constituent solvents and salts in the solid electrolyte interphase (SEI) are currently under investigation.20
This current research is focused upon the effort to inhibit flammability of electrolytes via incorporation of FR additives while mitigating their negative attributes and maximizing electrochemical performance. The drawbacks of FRA incorporation into lithium-ion batteries include increased discharge capacity fade and poor cycling performance at low temperatures. Loss of electrochemical performance in the presence of FR additives is commonly attributed to inadequate formation of a stable SEI on the surface of the anode, and in some cases undesirable properties of the cathode electrolyte interphase (CEI).21,22 This investigation focuses on the effects of the incorporation of TPP on the flammability of the electrolyte, the conductivity of the electrolyte, the cycling performance of graphite/LiNi0.8Co0.2O2 cells, electrode transfer kinetics, and electrode interphase structure in lithium ion batteries.
Experimental
Battery-grade carbonate solvents ethylene carbonate (EC), ethyl methyl carbonate (EMC), and dimethyl carbonate (DMC), as well as lithium hexafluorophosphate (LiPF6) salt, were obtained from Novolyte Technologies, Inc. Two different electrolytes 1.2 M LiPF6 in EC/EMC (3:7 vol.%, BL1) and 1.0 M LiPF6 in EC/EMC (2:8 vol.%, BL2) were obtained from Novolyte Technologies and utilized without further purification (water content was less than 50 ppm in all cases). Triphenyl phosphate (TPP) was obtained from Thermo Fisher Scientific at 99% purity and used as received. TPP containing electrolytes were prepared with a constant concentration of LiPF6 and EC while EMC was replaced with TPP.
Self-extinguishing time, or SET, of the electrolyte combinations was measured via a modified version of the procedure detailed by Xu and coworkers using commercial cotton swabs as the test wick.1,12 The commercial cotton swab wicks were manufactured to a uniform diameter of 1 cm and were injected with 100 μL of electrolyte. The wick was placed in a fume hood with an air flow velocity of 90 ft/s and suspended at uniform height above a watch glass. Burning time was recorded with the use of a digital stopwatch. This procedure was performed on ten samples of each electrolyte and an average SET was calculated for each.
The flash points of solvent blends incorporating TPP were measured using a Pensky-Martens Closed Cup Flash Tester from Koehler Instrument Company. Solvent blends were mixed excluding Li salt to a total mass of 70 g and placed in a closed test cup. A motorized stirrer was used to enhance solvent evaporation within the closed cup and a propane supplied flame was dipped into the sample cup every 1°C to test for vapor ignition signaling the flash point of the sample.
Conductivity measurements were performed with a Thermo Scientific Orion 3 Star conductivity benchtop meter using an Orion 011050MD 2-electrode conductivity probe (the cell constant value was 0.976 cm−1). The probe was sealed under Ar in a threaded Ace glass cell and threaded Teflon adapter and O ring to avoid moisture contamination of the electrolyte. The cell was filled with approximately 9 mL of electrolyte solution and the cell was placed in a Tenney environmental chamber. Conductivity readings were recorded after 4 hour equilibration time between −60°C to 30°C.
Cyclic voltammetry (CV) was utilized to establish the electrochemical window of the electrolyte on the anode. Lithium metal was utilized as a reference and counter electrode, while a glassy carbon electrode was used as the working electrode. Three reduction potential sweeps were performed between 0 V and 3.0 V versus Li/Li+ at a scan rate of 0.01 V/s. All experiments were carried out using a VersaSTAT 3-200 with FAR option Electrochemical WorkStation (Princeton Applied Research).1
Coin cells were assembled utilizing electrodes obtained from Yardney Technical Products. The anodes were composed of 89% mesocarbon microbead (MCMB), 8% poly(vinylidene difluoride) (PVDF) binder, and 3% conductive carbonaceous dilutant on a copper foil current collector. Cathodes contained 89% LiNi0.8Co0.2O2, 5% PVDF and 6% conductive carbonaceous dilutant on an aluminum foil current collector. Preparation of the electrolyte and coin cell assembly was performed in a pure Argon atmosphere glove box with a water content <5 ppm. Cells were constructed and cycled between 4.1 V and 3.0 V using an Arbin BT4010 battery cycler at 60°F (15.5°C).
The cycling protocol followed an initial formation cycling schedule with the first cycle at a C/20 current rate, followed by C/10 during cycles two and three, and C/5 for cycles four and five. Nominal cycling was conducted at C/5 current rate for an additional 30 cycles. The cells were then opened in an Ar filled glove box after a total of 35 cycles. Electrodes were extracted and rinsed three times with dimethyl carbonate (DMC) to remove residual salts. The rinsed electrodes were then vacuum dried overnight prior to surface film and morphological examination.
Larger experimental three-electrode cylindrical cells (approximately 400 mAh in capacity) were also assembled, which consisted of O-ring sealed, glass cells containing anodes (89% mesocarbon microbead (MCMB), 8% poly(vinylidene difluoride) (PVDF) binder, and 3% conductive carbonaceous dilutant on a copper foil current collector), cathodes (89% LiNi0.8Co0.2O2, 5% PVDF and 6% conductive carbonaceous dilutant on an aluminum foil current collector), and lithium reference electrodes separated by two layers of polyethylene (Tonen-Setella) separator material. The anodes were coated with active material on both sides of the substrate and had an active material area of approximately 158 cm2, corresponding to an electrode loading of 16 mg/cm2. The NCO electrodes were also coated on each side with an active material area of approximately 141 cm2, corresponding to a loading of 19 mg/cm2.
Electrochemical characterization, including linear micro-polarization and Tafel polarization measurements, were performed using an EG&G potentiostat/galvanostat (273A) interfaced with a computer using Softcorr 352 software. To perform electrochemical impedance spectroscopy (EIS) measurements, a Solartron 1255 frequency response analyzer was used in conjunction with this potentiostat. All cells were fully charged prior to impedance measurements, with the open circuit voltage >4.07 V. Charge-discharge measurement and cycling tests were performed utilizing an Arbin battery cycler. The formation cycling was performed at current densities of 0.25 mA/cm2 (∼C/16 rate) and the cells were charged to 4.10 V, followed by a tapered charge period at constant potential until the current decayed to a C/100 rate, and discharged to 2.75 V. For low temperature discharge rate characterization, the cells were charged at room temperature and allowed to soak at the desired temperature (in a Tenney environmental chamber with temperature control of +/−1°C) for at least five hours prior to discharging to 2.00 V.
Surface species characterization was accomplished via the collection of X-ray photoelectron spectroscopy (XPS) spectra using a PHI 5500 system and Al Kα radiation. A graphite reference peak of 284.3 eV was used for proper final shifting of the spectra collected. Multipak versions 6.1 as well as XPS Peak 4.1 software were utilized for analysis and curve fitting of collected spectra respectively. A combination of Gaussian and Lorentzian functions was used for the least squares curve fitting. The surface morphology of cycled electrodes was examined using a JEOL 5900 Scanning Electron Microscope (SEM).
Results and Discussion
Self-Extinguishing time (SET)
The self extinguishing time (SET) of electrolyte with increasing TPP concentration is summarized in Table I. The baseline electrolyte 1 (BL1, 1.2 M LiPF6 in EC/EMC 3:7 vol.%) shows high flammability with an SET of 23 seconds. Electrolyte with 5% TPP does not show appreciable decrease in flammability. However, incorporation of 10%–15% TPP results in a significant reduction in SET (9 s). SET experiments were also conducted on solvent blends without LiPF6 and the trends in flammability reduction were very similar.
Table I. Self-extinguishing times for electrolytes with TPP.
| Electrolyte Solutions | S.E.T (s) | σ (s) |
|---|---|---|
| Std. - {1.2 M LiPF6 (EC/EMC) (3:7) vol.%} | 23 | 2.6 |
| 5% TPP - {1.0 M LiPF6 (EC/EMC/TPP) (3:6.5:0.5)(wt%)} | 23 | 2.3 |
| 10% TPP - {1.0 M LiPF6 (EC/EMC/TPP) (3:6:1) wt%} | 9 | 2.2 |
| 15% TPP - {1.0 M LiPF6 (EC/EMC/TPP) (3:5.5:1.5) wt%} | 9 | 1.2 |
Flash point (FP)
The flash points (FP) of solvent blends incorporating TPP are provided in Table II. The FP values of all solvents blends are very similar. The FP values correlate with the expected FP of EMC and suggest that TPP does not significantly alter the composition of the vapor phase above the cup. The significant differences in the quantity of reduced flammability when comparing SET and FP data with added TPP suggest that the development of additional straightforward flammability measurements would be beneficial. This also supports that the primary flame retarding action of the triphenyl phosphate is dependent upon its decomposition, either due to the formation of radical scavenging species or the formation of a thermal barrier of char, which would not be as significant in the flash point test.
Table II. Flash Points of solvent blends.
| Solvent Mixture | Flash Point (°C) |
|---|---|
| Std. – {EC/EMC 3:7 wt%} | 29.7 |
| 5% TPP– {EC/EMC + 5 wt%TPP} | 29.7 |
| 10% TPP –{EC/EMC + 10 wt% TPP} | 30.7 |
| 15% TPP – {EC/EMC + 15 wt% TPP} | 31.0 |
Ionic conductivity
The ionic conductivity of 1.2 M LiPF6 in 3:7 EC/EMC (vol.%) compared to 1.0 M LiPF6 in 3:6:1 EC/EMC/TPP (wt%) between −60°C and 30°C is depicted in Figure 1. Addition of 10% TPP results in a slight decrease in the conductivity of the electrolyte. The decrease is attributed to a reduction in Li ion transport as a result of TPP incorporation. The difference in conductivity between BL1 and electrolyte with 10% TPP becomes smaller with decreased temperature.

Figure 1. Ionic conductivity of electrolyte (1.2 M LiPF6 in EC/EMC (3:7 vol)) with and without triphenyl phosphate (1.2 M LiPF6 in EC/EMC/TPP (3:6:1 vol)) between +30 and −60°C.
Cyclic voltammetry
The cyclic voltammogram (CV) of the BL1 electrolyte and the electrolyte with 10% TPP and 15% TPP are shown in Figure 2. During the first potential sweep of the BL1 electrolyte, no reduction peaks are observed above 0.5 V vs. Li. The first potential sweep of electrolytes containing 10% TPP and 15% TPP contains a reduction peak at 1.8 V which is not present during the subsequent second and third potential sweeps. In addition, the current intensity of the peak increases with increasing concentration of TPP. This indicates that TPP is reduced on the anode surface but does not adversely affect the formation of a stable anode SEI.
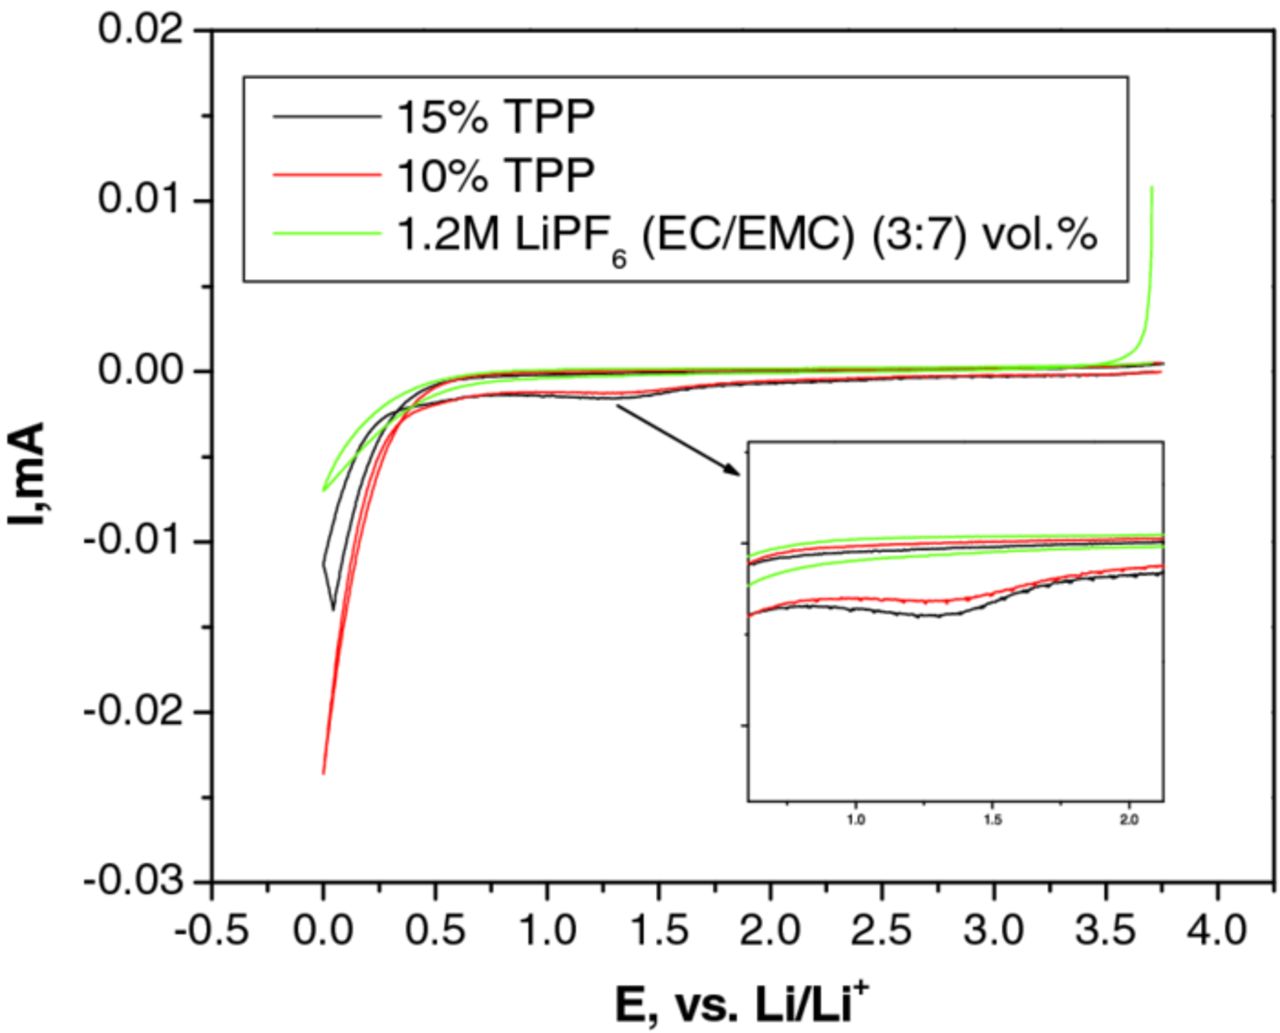
Figure 2. Combined 1st Potential Sweep-Cyclic Voltammogram of 1.2 M LiPF6 in EC/EMC (3:7 vol, BL1) vs. EC/EMC/TPP (3:6:1 vol) vs. EC/EMC/TPP (3:5.5:1.5).
Electrochemical performance of cells with triphenyl phosphate
Lithium ion coin cells containing an MCMB anode and LiNi0.8Co0.2O2 cathode were prepared with BL1 electrolyte and electrolyte with 5, 10, and 15% TPP (Figure 3) to evaluate the effect of TPP on the electrochemical performance. Cells containing electrolyte with 5 and 10% TPP have comparable discharge capacity (∼155 mAh/g) to cells with BL1 electrolyte (∼165 mAh/g). Continued cycling (35 cycles) results in a small increase in the discharge capacity fade for cells containing 5 and 10% TPP. The initial capacity is lower and the capacity fade upon cycling is more pronounced in cells with 15% TPP (∼145 mAh/g) as compared to the BL1 electrolyte. It should be noted that although more pronounced capacity decline is observed in these experimental cells, good cycle life performance has been observed in larger prototype cells (7Ah), being comparable with cells containing electrolytes with lower concentrations of TPP.23
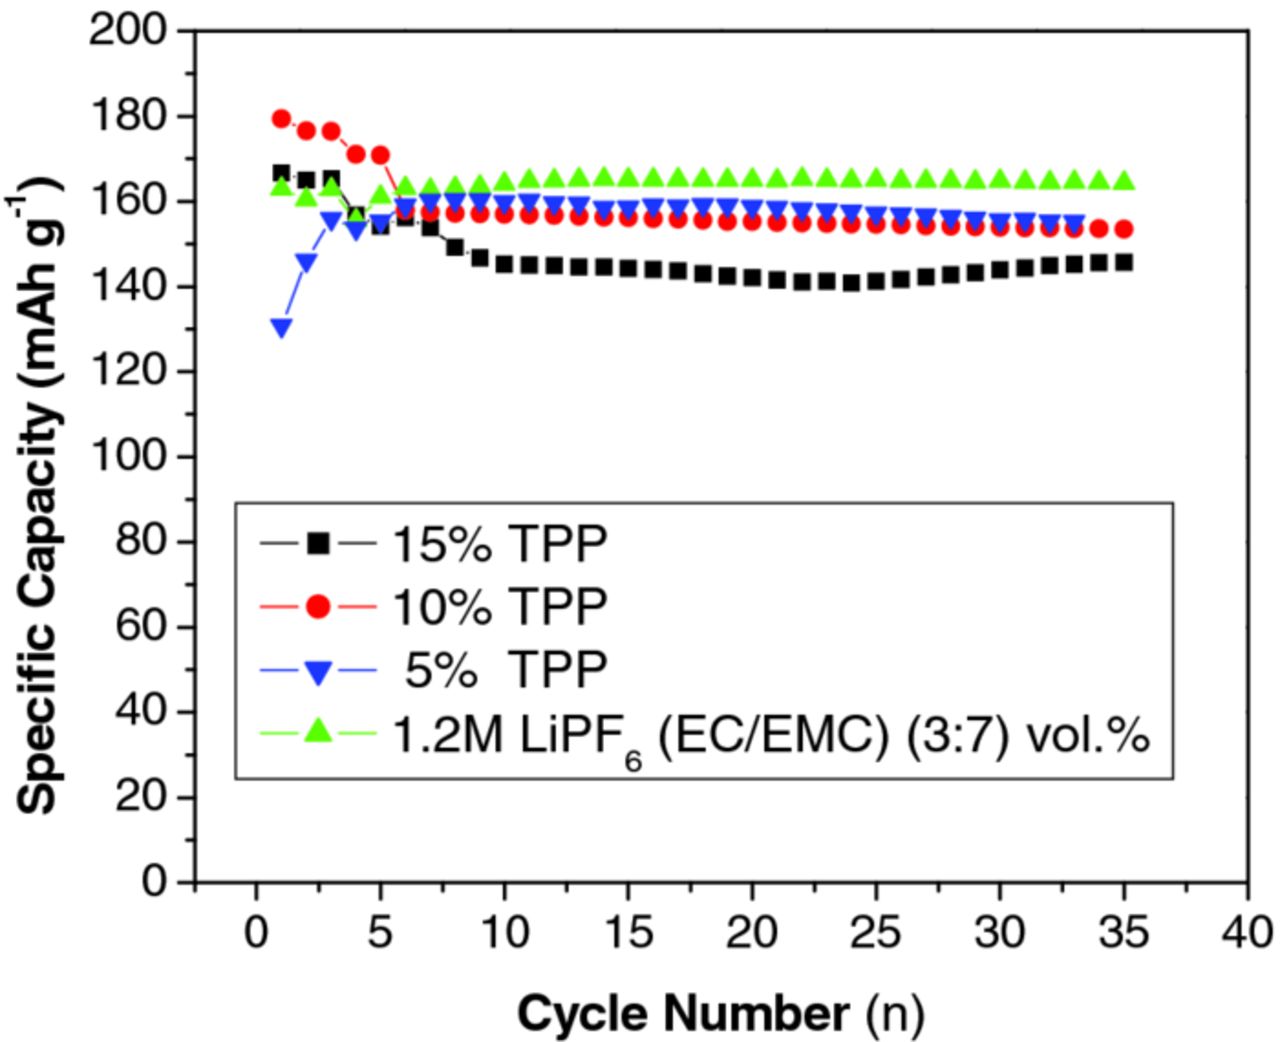
Figure 3. Cycling Performance of MCMB/ LiNi0.8Co0.2O2 full cells utilizing 1.2 M LiPF6 in EC/EMC (3:7 vol), EC/EMC/TPP (3:6.5:0.5 vol), EC/EMC/TPP (3:6:1 vol), and EC/EMC/TPP (3:5.5:1.5).
Performance characterization of three-electrode experimental cells with electrolytes containing triphenyl phosphate
Three electrode cells consisting of MCMB anodes and LiNi0.8Co0.2O2 cathodes were fabricated containing a baseline electrolyte (BL2, 1.0 M LiPF6 in EC+EMC (20:80 vol%) and electrolytes with increasing concentration of triphenyl phosphate (i.e., 5, 10, and 15% by volume). In the preparation of these electrolytes the ethylene carbonate content was held constant (at 20% by volume) and the ethyl methyl carbonate content was adjusted accordingly. As illustrated in Table III, very comparable reversible capacities and irreversible capacities were obtained for all cells, indicating that the incorporation of TPP into the electrolyte does not adversely impact the initial specific capacity. It should be noted that the small observed differences in reversible capacity are not entirely attributable to electrolyte effects, but rather owing to cell to cell variability (i.e., <5% variation in electrode weights). As shown in Figure 4, when the potentials of the MCMB anodes are observed during the first charge of the formation process, there is no significant reactivity with increasing TPP content and they behave in a similar fashion to the baseline solution soon adopting voltages indicative of lithium intercalation rather than excessive reductive decomposition of the additive. This suggests that if TPP is participating in the film formation process it is resulting in the formation of a protective film, rather than reacting continually.
Table III. Charge-discharge (formation) characteristics of experimental MCMB/ LixNiyCo1-yO2 lithium-ion cells containing electrolytes with and without triphenyl phosphate.
| Electrolyte Type | Charge Capacity (Ah) 1st Cycle | Discharge Capacity (Ah) 1st Cycle | Irrev. Capacity (Ah) 1st Cycle | Coulombic Efficiency 1st Cycle | Charge Capacity (Ah) 5th Cycle | Discharge Capacity (Ah) 5th Cycle | Cumulative Irrev. Capacity (1st -5th Cycle) | Coulombic Efficiency 5th Cycle |
|---|---|---|---|---|---|---|---|---|
| 1.0 M LiPF6 in EC+EMC (20:80 v/v%) | 0.4682 | 0.4044 | 0.064 | 86.39 | 0.4013 | 0.3914 | 0.1136 | 97.53 |
| 1.0 M LiPF6 in EC+EMC+TPP (20:65:5 v/v%) | 0.4561 | 0.3977 | 0.058 | 87.19 | 0.3898 | 0.3894 | 0.0734 | 99.88 |
| 1.0 M LiPF6 in EC+EMC+TPP (20:70:10 v/v%) | 0.4705 | 0.3978 | 0.073 | 84.55 | 0.3969 | 0.3819 | 0.1449 | 96.20 |
| 1.0 M LiPF6 in EC+EMC+TPP (20:75:15 v/v%) | 0.4645 | 0.4037 | 0.061 | 86.91 | 0.4027 | 0.3980 | 0.0881 | 98.84 |

Figure 4. The anode potential (V vs. Li+/Li) of MCMB/ LiNi0.8Co0.2O2 lithium-ion cells containing electrolytes containing varying amounts of triphenyl phosphate during the first charge of the formation process, 1.0 M LiPF6 in EC/EMC (2:8 vol), EC/EMC/TPP (2:7.5:0.5 vol), EC/EMC/TPP (2:7:1 vol), and EC/EMC/TPP (2:6.5:1.5).
After completing the formation cycling and electrochemical characterization of the cells (discussed in the sections below), the cells were subjected to low temperature discharge rate characterization. This testing consisted of charging the cells at room temperature and discharging the cells at −20°C at various rates. As illustrated in Table IV, a noticeable decrease in the discharge rate capability was observed at low temperature with increasing TPP content. This is partly attributed to a decrease in the conductivity of the electrolyte solutions with increasing TPP content. As discussed below, the decreased rate capability is also attributed to decreased lithium intercalation/de-intercalation kinetics at the interfaces, since increased film and charge transfer resistances are observed during the measurement of electrochemical kinetics parameters.
Table IV. Summary of the discharge characteristics experimental MCMB/ LixNiyCo1-yO2 lithium-ion cells containing various electrolytes at −20°C. Cells were charged at 20°C.
| 1.0 M LiPF6 in EC | 1.0 M LiPF6 in EC | 1.0 M LiPF6 in EC | |||||
|---|---|---|---|---|---|---|---|
| +EMC (20:80 v/v%) | +EMC+TPP (20:70:10 v/v%) | +EMC+TPP (20:65:15 v/v%) | |||||
| Temp. | Current (mA) | Capacity (Ah) | Percent (%) | Capacity (Ah) | Percent (%) | Capacity (Ah) | Percent (%) |
| 23°C | 25 | 0.3914 | 100.00 | 0.3819 | 100.00 | 0.3980 | 100.00 |
| −20°C | 25 | 0.3370 | 86.12 | 0.3208 | 84.00 | 0.2436 | 61.19 |
| 50 | 0.3206 | 81.92 | 0.2579 | 67.54 | 0.1889 | 47.45 | |
| 100 | 0.3044 | 77.79 | 0.1354 | 35.45 | 0.0944 | 23.72 | |
| 150 | 0.2913 | 74.44 | 0.0429 | 11.23 | 0.0419 | 10.53 | |
Tafel polarization measurements of three-electrode experimental cells with electrolytes containing triphenyl phosphate
To determine the lithiation/de-lithiation kinetics of both the anode and the cathodes in the three-electrode cells, Tafel polarization measurements were performed on the MCMB/ LiNi0.8Co0.2O2 cells at 20°, 0°, and −20°C. These measurements were performed after the cells completed the formation cycling and were fully charged (i.e., the open circuit potential was above 4.08 V). To approximate steady-state conditions, the measurements were performed under potentiodynamic conditions with slow scan rates (0.2 mV/sec). During the polarization of 150 mV vs. the open-circuit potetnials, there is noticeable mass-transfer interference on the charge-transfer process. Corrections were therefore applied for this mass transfer interface, by electrode potential against Log [I/{(1−(I/Il)}], where Il is the limiting current estimated from extrapolation. The rate parameters for the intercalation/de-intercalation of lithium (i.e., the exchange current and transfer coefficients), were calculated from the intercept and the slope of the mass-transfer corrected plots.24
From the exchange current densities listed in Table V, it is clear that the anode kinetics are nearly comparable for the baseline electrolyte (0.51 mA/cm2) and the electrolyte with 10% TPP content (0.57 mA/cm2). However, decreased kinetics were observed at the MCMB anode when utilizing an electrolyte with 15% TPP (0.46 mA/cm2). These results suggest that increasing TPP content results in interfacial surface films that impede the lithium kinetics and is also accompanied by decreased ionic conductivity of the electrolyte, which will be reflected by decreased limiting currents. In contrast to the anode kinetics which are not significantly altered even though TPP contributed to the SEI, the cathode kinetics are noticeably reduced upon incorporation of TPP into the electrolyte, for example from 1.15 mA/cm2 for the baseline up to 0.59 mA/cm2 for 10% TPP and 0.22 mA/cm2 for 15% TPP. Similar trends are observed upon evaluating the cells at lower temperature, with the electrolyte with 10% TPP content also displaying decreased lithium intercalation and de-intercalation kinetics compared with the baseline. As shown in Figure 5, when Tafel measurements were performed at −20°C on the MCMB anodes, the following trend in the anode kinetics was observed (in decreasing amount): LiPF6 in EC+EMC (20:80) > LiPF6 in EC+EMC+TPP (20:70:10) > LiPF6 in EC+EMC (20:65:15). A similar trend in the electrode kinetics was observed when Tafel measurements were performed on the LiNi0.8Co0.2O2 cathodes, as shown in Figure 6. In addition to resulting in reduced ionic conductivity, these results support the contention that the TPP is being incorporated into the cathode surface films as well, which is supported by the ex-situ analysis of the electrode harvested from the coin cells discussed in the section below.
Table V. Summary of the electrode kinetic data obtained from Tafel polarization measurements.
| Anode io, mA/cm2 | Cathode io, mA/cm2 | |||||
|---|---|---|---|---|---|---|
| FRA Content | 25°C | 0°C | −20°C | 25°C | 0°C | −20°C |
| 0% | 0.51 | 0.26 | 0.08 | 1.15 | 0.31 | 0.06 |
| 10% | 0.57 | 0.28 | 0.06 | 0.59 | 0.27 | 0.06 |
| 15% | 0.46 | 0.23 | 0.04 | 0.22 | 0.14 | 0.02 |
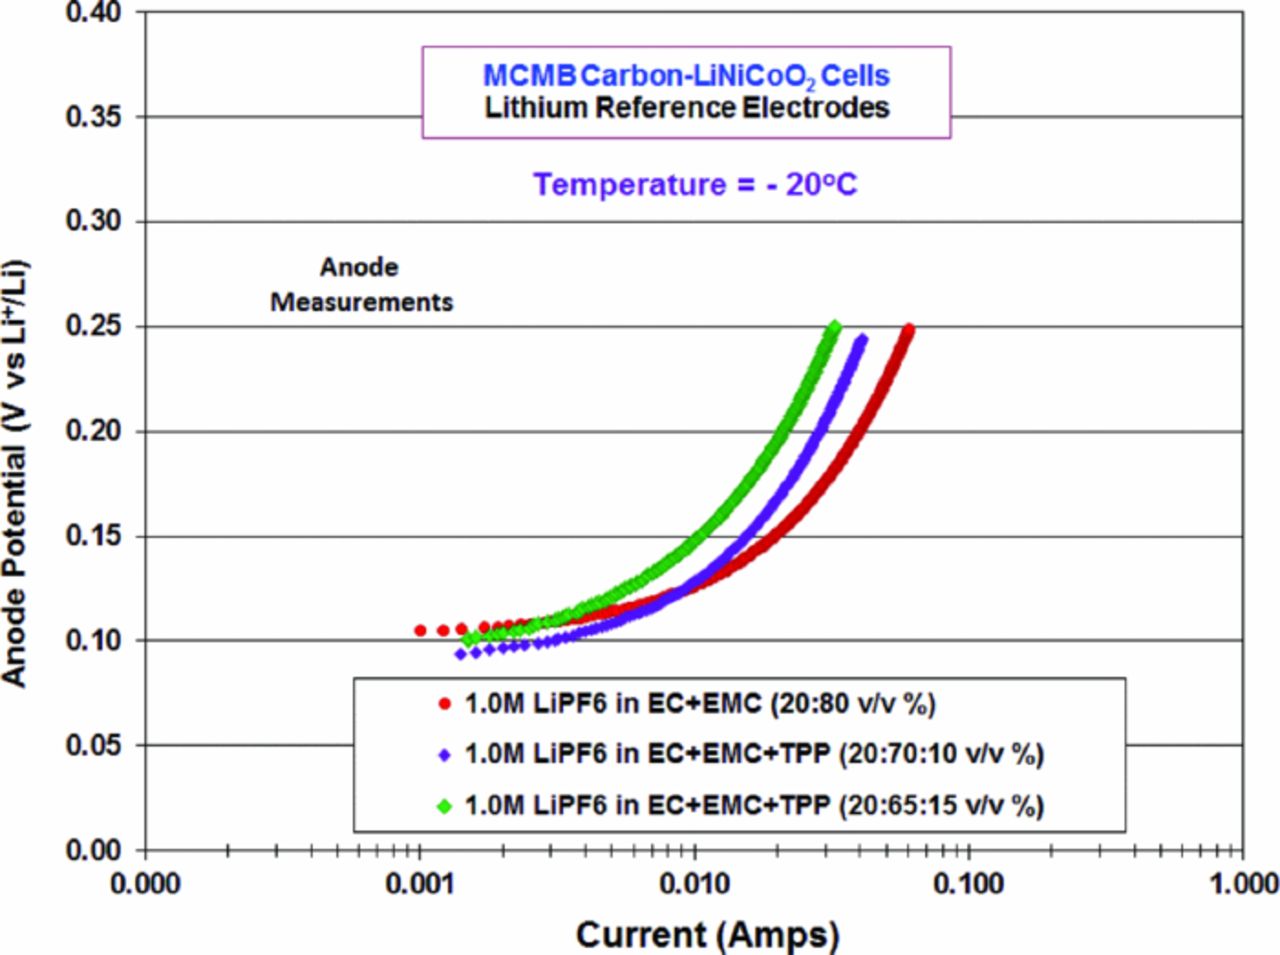
Figure 5. Tafel polarization measurements at −20°C of MCMB electrodes from MCMB/ LiNi0.8Co0.2O2 lithium-ion cells containing electrolytes containing varying amounts of triphenyl phosphate, 1.0 M LiPF6 in EC/EMC (2:8 vol), EC/EMC/TPP (2:7:1 vol), and EC/EMC/TPP (2:6.5:1.5).

Figure 6. Tafel polarization measurements at −20°C of LiNi0.8Co0.2O2 electrodes from MCMB/ LiNi0.8Co0.2O2 lithium-ion cells containing electrolytes containing varying amounts of triphenyl phosphate, 1.0 M LiPF6 in EC/EMC (2:8 vol), EC/EMC/TPP (2:7:1 vol), and EC/EMC/TPP (2:6.5:1.5).
Electrochemical impedance spectroscopy (EIS) measurements of three-electrode experimental cells with electrolytes containing triphenyl phosphate
In an attempt to further understand the effect that triphenyl phosphate has upon the electrode/electrolyte interface, EIS measurements were performed on each individual electrode, as well as the full cell, by utilizing the reference electrode. In the interpretation of the data, an equivalent circuit consisting of a series resistance, Rs, a parallel resistor-capacitor network (for film capacitance Cf and film resistance Rf) in series for the high frequency relaxation loop, a resistor-capacitor parallel network in series for the low frequency relaxation loop, which is represented by a double-layer capacitance Cdl in parallel with as series combination of charge transfer resistance Rct, and a Warburg impedance (w) representing the slow solid state diffusion of lithium ions in the bulk.25–28 It is generally held that the high frequency relaxation loop is associated with the surface film between the electrolyte and the electrode, whereas the low frequency relaxation loop is correlated to the charge transfer resistance. These data were analyzed using the equivalent circuit described above and Z Simpwin software.
When EIS measurements were performed on the MCMB anodes after formation, as shown in Figure 7, a noticeable increase in the series resistance is observed with increasing TPP content, especially when 15% is added. This increase is primarily attributable to the decrease in ionic conductivity of the electrolyte solution, due to the addition of TPP, which increases the viscosity and lowers the ionic mobility. The trends in the film resistance and the charge transfer resistances are not as clear as expected. Part of this may be attributed to the interference of the mass transfer on the charge transfer kinetics (as was also seen in the Tafel plots), and the non-ideal Warburg impedance overlapping with the charge transfer relaxation loop. In general, there is an increase in the film and charge transfer resistances with addition of TPP, being again most dramatic for the electrolyte with 15% content (Table VI). This suggests that TPP is altering the SEI film hindering facile lithium kinetics due to a more resistive nature compared to the baseline solution. The addition of TPP may also influence the solvation and coordination of Li ions in solution, in turn influencing the de-solvation characteristics. However, the extent of this potential interaction and how the subsequent de-solvation characteristics may influence the charge transfer characteristics29 requires further study. When EIS measurements were performed on the LiNi0.8Co0.2O2 cathodes, only modest increases in the film and charge transfer resistance were observed with the cell containing the electrolyte with 10% TPP. However, the cell with the electrolyte possessing 15% TPP resulted in much higher series, film, and especially charge transfer resistance, as illustrated in Figure 8.
Table VI. Summary of the electrochemical parameters obtained from EIS measurements.
| 25°C | 0°C | −20°C | ||||||||
|---|---|---|---|---|---|---|---|---|---|---|
| FRA (%) | Rf (Ω) | Rct (Ω) | Io, mA/cm2 | Rf (Ω) | Rct (Ω) | Io, mA/cm2 | Rf (Ω) | Rct (Ω) | Io, mA/cm2 | |
| MCMB | 0 | 0.03 | 0.02 | 10.93 | 0.21 | 0.28 | 0.59 | 1.08 | 0.44 | 0.37 |
| 10 | 0.12 | 0.17 | 0.99 | 0.31 | 0.20 | 0.82 | - | - | - | |
| 15 | 0.10 | - | 16.69 | 0.31 | - | 0.42 | 1.21 | 0.36 | 0.46 | |
| LiNiCoO2 | 0 | 0.08 | 0.05 | 3.28 | 0.15 | 0.25 | 0.73 | 1.10 | 0.14 | 1.31 |
| 10 | - | 0.03 | 5.12 | 0.26 | 1.03 | 0.18 | - | - | - | |
| 15 | 0.10 | 0.15 | 1.09 | 0.09 | 0.90 | 0.20 | 10.27 | - | - | |
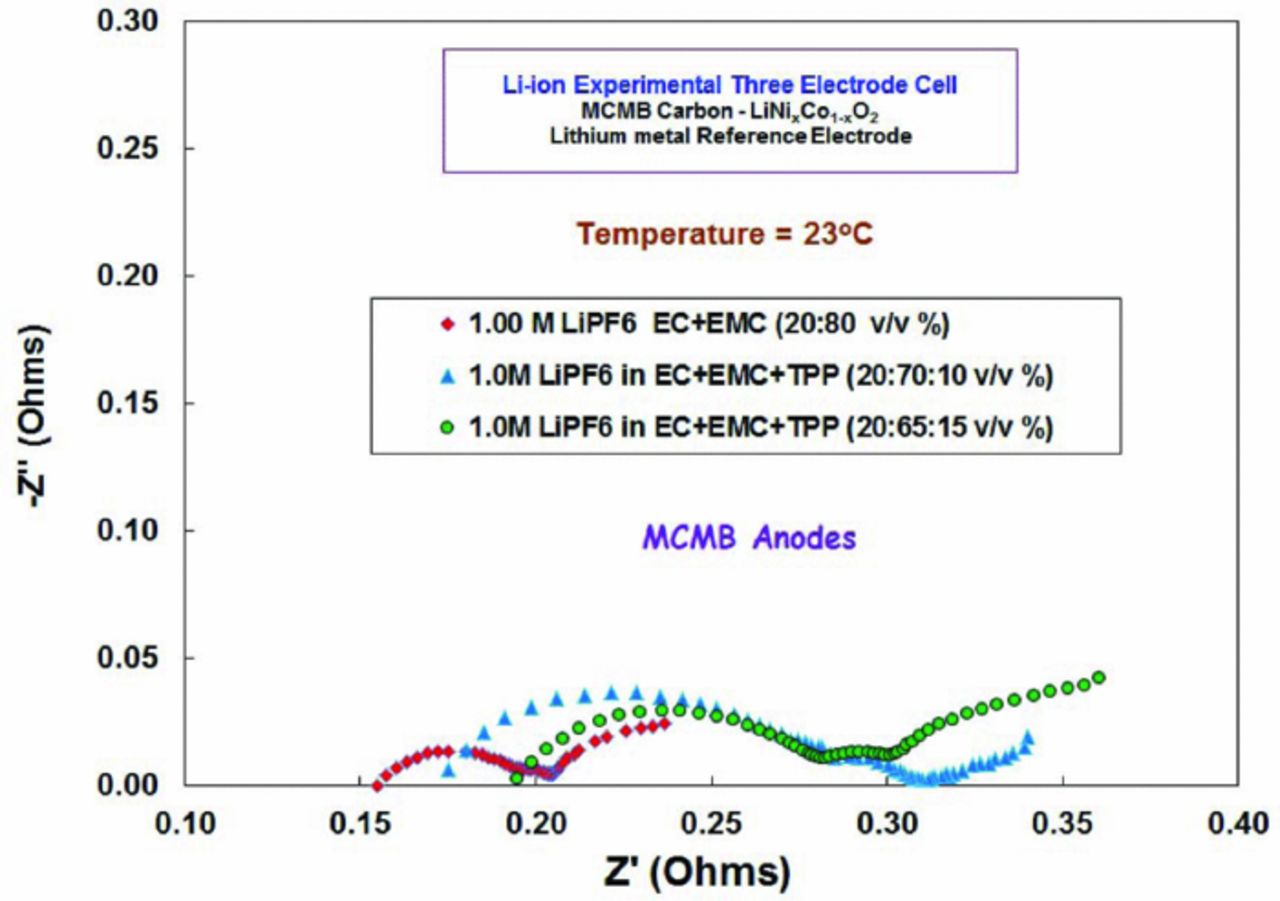
Figure 7. Electrochemical impedance spectroscopy (EIS) measurements at 23°C of MCMB electrodes from lithium-ion cells containing electrolytes with and without triphenyl phosphate, 1.0 M LiPF6 in EC/EMC (2:8 vol), EC/EMC/TPP (2:7:1 vol), and EC/EMC/TPP (2:6.5:1.5).

Figure 8. Electrochemical impedance spectroscopy (EIS) measurements at 23°C of LiNi0.8Co0.2O2 electrodes from lithium-ion cells containing electrolytes with and without triphenyl phosphate, 1.0 M LiPF6 in EC/EMC (2:8 vol), EC/EMC/TPP (2:7:1 vol), and EC/EMC/TPP (2:6.5:1.5).
Scanning electron microscopy (SEM)
Scanning electron microscope (SEM) images of MCMB anodes and LiNi0.8Co0.2O2 cathodes from cycled full cells with LB1 electrolyte and electrolyte with 10% TPP are provided in Figures 9-10. Anodes extracted from full cells cycled with BL1 electrolyte and electrolyte containing 10% TPP have very similar surface morphology. Cathodes extracted from full cells with BL1 and 10% TPP electrolytes also have very similar surface structure. The results suggest that the incorporation of TPP does not significantly affect the bulk structure of the materials.

Figure 9. SEM of MCMB anodes. (a) Fresh; (b) 1.2 M LiPF6 in EC/EMC (3:7 vol); (c) EC/EMC/TPP (3:6:1 vol).
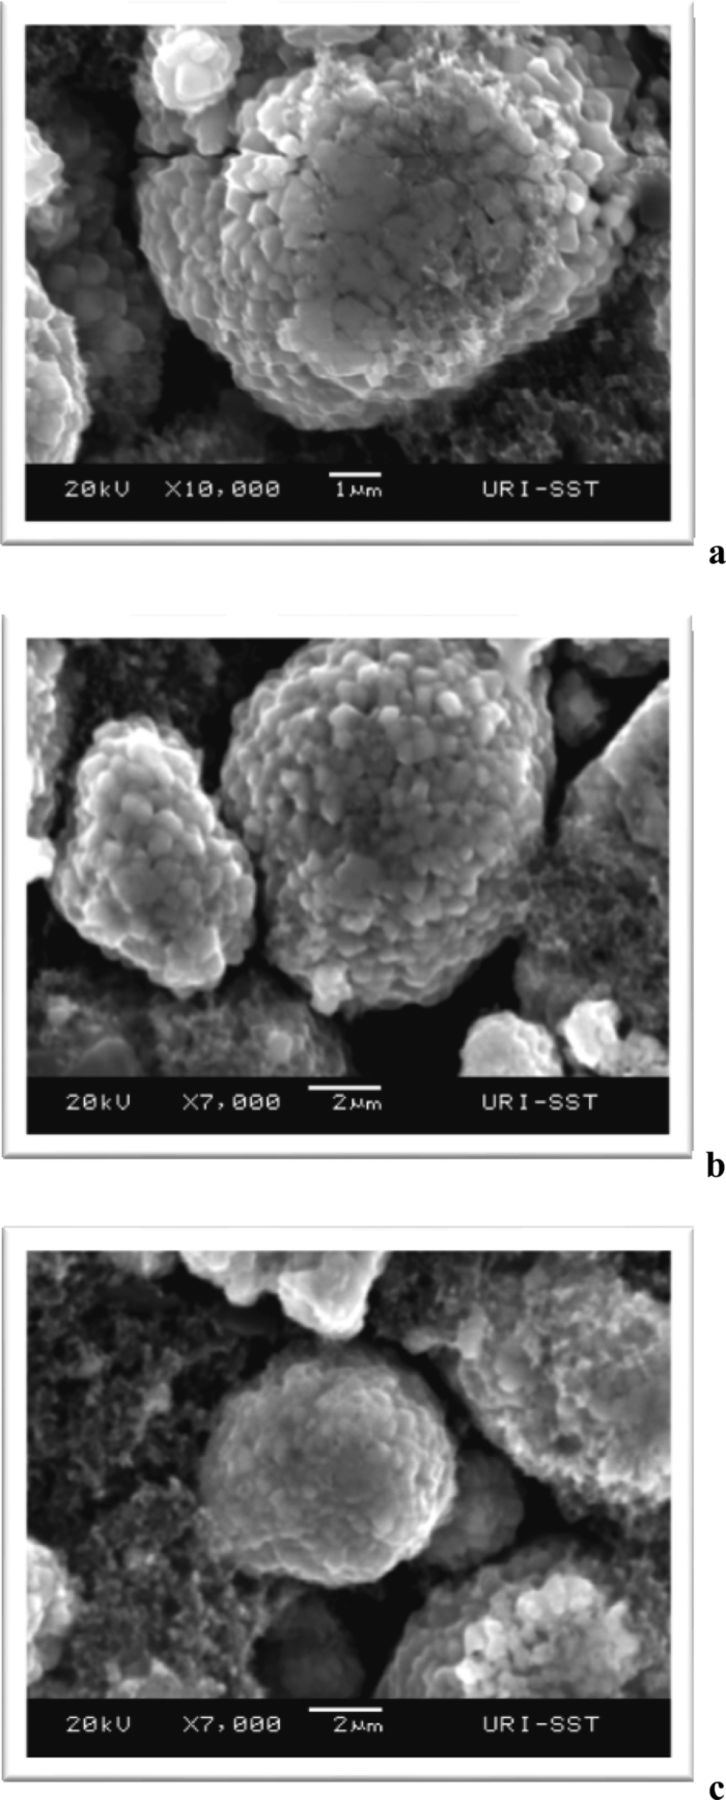
Figure 10. SEM of LiNi0.8Co0.2O2 cathodes. (a) Fresh; (b) 1.2 M LiPF6 in EC/EMC (3:7 vol); (c) EC/EMC/TPP (3:6:1 vol).
X-ray photoelectron spectroscopy (XPS)
XPS analysis of the surface of electrodes extracted from cells containing BL1 and TPP-containing electrolytes was conducted to understand the role of TPP on the structure of surface films on the electrode materials. Elemental surface concentrations of the anodes are provided in Table VII. After 35 cycles, the concentration of C decreases while the concentration of O and F increase relative to the fresh anode, consistent with the formation of an SEI on the anode. Incorporation of 5% TPP results in an increase in the concentration of O and a decrease in the concentration of F, but further increases in the concentration of TPP result in a decrease in the concentration of O and increase in the concentration of C suggesting that the composition of the anode SEI is being altered by the addition of TPP. The P elemental concentrations remain small for all samples suggesting that TPP is not being incorporated into the anode SEI.
Table VII. Elemental concentration of C, O, F, P, on the anode surface using TPP FR electrolyte.
| C 1s (%) | O 1s(%) | F 1s(%) | P 2p (%) | |
|---|---|---|---|---|
| Fresh Anode | 70 | 4 | 26 | N/A |
| Std. - 1.2M LiPF6 EC/EMC (3:7) vol.% | 40 | 24 | 34 | 2 |
| 5% TPP - 1.0 M LiPF6 EC/EMC/TPP (3:6.5:.5) wt% | 41 | 33 | 25 | 1 |
| 10% TPP - 1.0 M LiPF6 EC/EMC/TPP (3:6:1) wt% | 52 | 22 | 25 | 1 |
| 15% TPP - 1.0 M LiPF6 EC/EMC/TPP (3:5.5:1.5) wt% | 52 | 18 | 30 | 1 |
The XPS spectra of anodes extracted from full cells cycled with TPP electrolyte are depicted in Figure 11. The fresh anode contains peaks for graphite at 284.3 eV and two peaks for PVDF at 286.4 and 290.5 eV in the C1s spectrum. The corresponding F1s peak for PVDF is observed at 688 eV and a small peak is observed in the O1s spectrum at 533 eV characteristic of residual oxygenated impurities on the graphite surface. The C1s spectrum of cycled anodes contains a new peak at 289.5 eV, consistent with the presence of C=O containing species such as lithium alkyl carbonates, in addition to the peaks characteristic of graphite and PVDF, suggesting that the anode SEI is relatively thin. The C1s spectrum does not change significantly upon incorporation of TPP indicating that TPP does not significantly alter the carbon containing components. The F1s spectrum contains peaks for PVDF (688 eV) and LiF (684.5 eV). LiF is a common component of anode SEIs resulting from the decomposition of LiPF6. The relative concentration of LiF, compared to PVDF, decreases with increasing TPP concentration suggesting that the TPP may inhibit the decomposition of LiPF6.1,30 The O1s spectrum shows a mix of C=O and C-O bonds at 531.5 eV confirming the production of a mix of lithium carbonate (Li2CO3) and lithium alkyl carbonates. The P2p spectrum contains evidence of lithium fluorophosphates (LixPOyFz) at 133.5 eV while the corresponding F1s peaks for LixPOyFz coincides with the peak for PVDF at 688 eV.
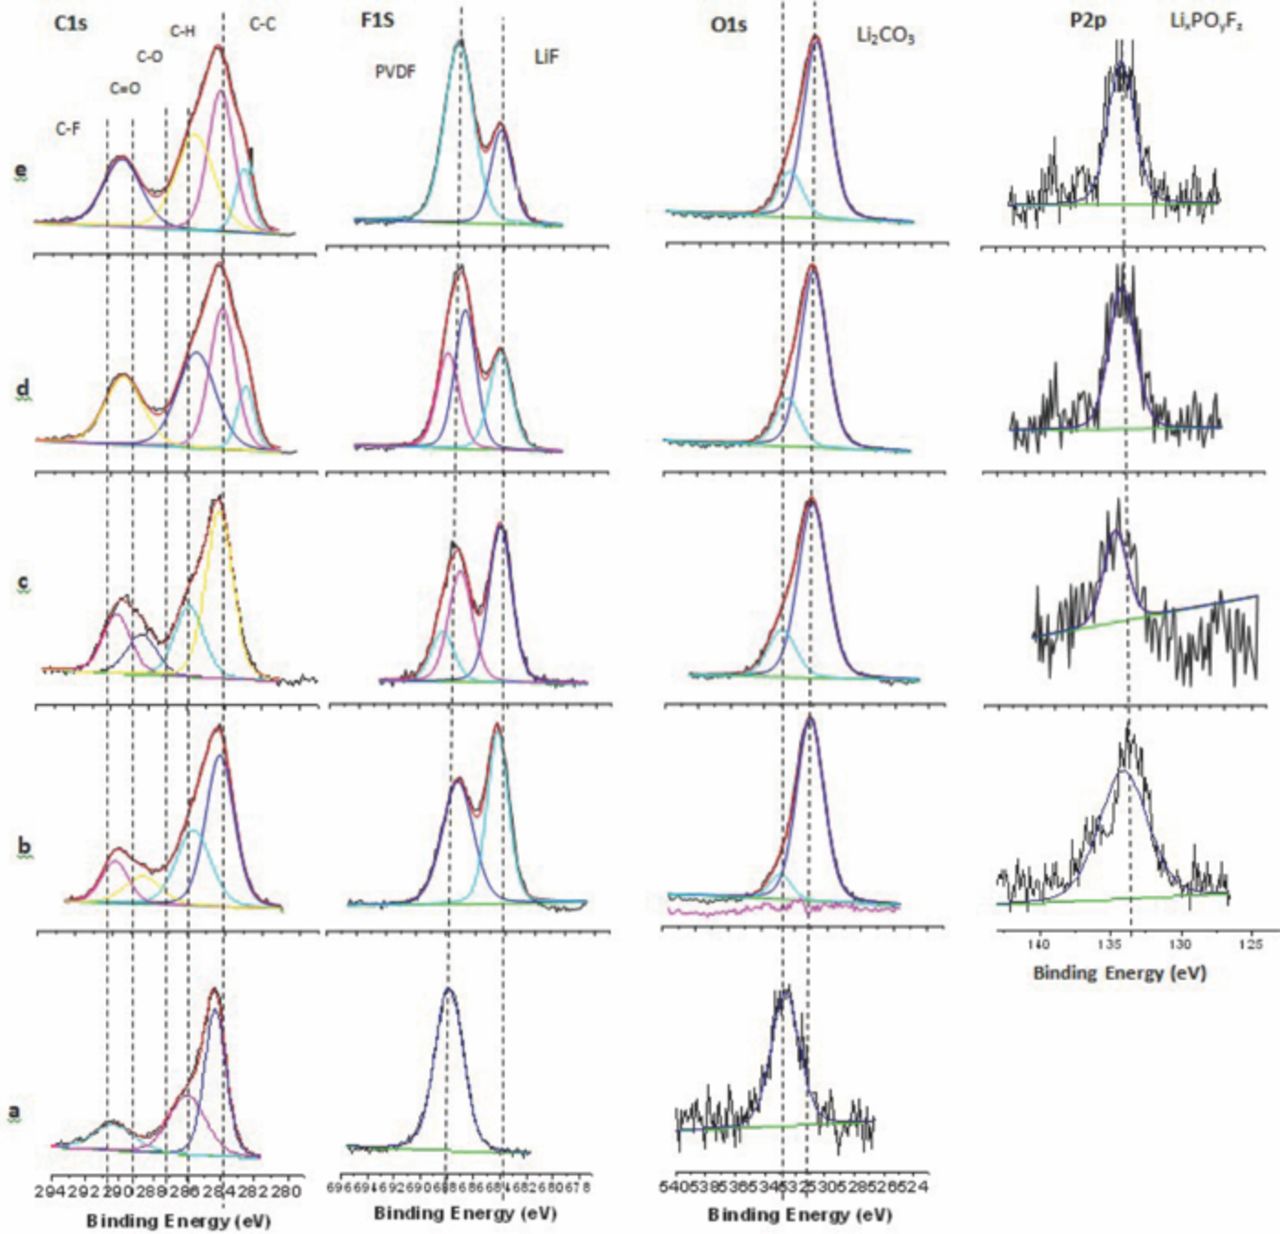
Figure 11. XPS Spectra of MCMB anodes. (a) Fresh; (b) 1.2 M LiPF6 in EC/EMC (3:7 vol); (c) EC/EMC/TPP (3:6.5:0.5 vol); (d) EC/EMC/TPP (3:6:1 vol); (e) EC/EMC/TPP (3:5.5:1.5).
Elemental surface concentrations of cathodes with TPP based electrolyte are shown in Table VIII. After 35 cycles, the concentration of C decreases while the concentration of O and F increase for cells cycled with the BL1 electrolyte. The incorporation of TPP alters the elemental concentration on the surface of the cathode. The concentration of C and O are increased while the concentration of F is decreased with increasing TPP concentration. In addition, P and Ni concentrations remain low for all electrodes.
Table VIII. Elemental concentration of C, O, F, P, and Ni on the cathode surface using TPP FR electrolyte.
| C 1s(%) | O 1s(%) | F 1s(%) | P 2p(%) | Ni 1s(%) | |
| Fresh Cathode | 58 | 10 | 32 | ||
| Std. -1.2M LiPF6 EC/EMC (3:7) vol.% | 47 | 12 | 36 | 1 | 4 |
| 5% TPP -1.0 M LiPF6 EC/EMC/TPP (3:6.5:.5) wt% | 52 | 18 | 26 | 1 | 3 |
| 10% TPP -1.0 M LiPF6 EC/EMC/TPP (3:6:1) wt% | 61 | 17 | 19 | 1 | 2 |
| 15% TPP -1.0 M LiPF6 EC/EMC/TPP (3:5.5:1.5) wt% | 66 | 16 | 12 | 1 | 4 |
XPS spectra of cathodes extracted from full cells cycled with TPP electrolyte are presented in Figure 12. The C1s spectrum of the fresh cathode contains peaks characteristic of graphite (284.3 eV) from the conductive carbon dilutant and PVDF binder (286.4 and 290.5 eV). The F1s spectrum contains a single peak characteristic of PVDF at 688 eV while the O1s spectrum has peaks for lithium carbonate (531.5 eV) and metal oxide (529 eV). Analysis of the cathode extracted from a cell cycled with baseline 1 electrolyte reveal small changes to the cathode surface. The C1s spectrum is similar but the F1s spectrum contains a new peak at 684.5 eV consistent with the presence of LiF and the O1s peak for the metal oxide is decreased consistent with the formation of a cathode surface film. The addition of TPP to the electrolyte further alters the C1s spectra of the extracted electrodes. With increasing concentrations of TPP a gradual decrease in the intensity of the C-F peak at 290.5 eV and C-H peak at 286.4 eV are observed indicating the formation of a cathode surface film covering the PVDF binder. Increasing the concentration of TPP also decreased the intensity of the peak for LiF suggesting less LiF on the cathode surface with added TPP. The decrease in LiF concentration on the cathode is similar to the decreased LiF concentrations on the anode discussed above further supporting the stabilization of LiPF6 in the presence of the Lewis basic TPP.1,30 The O1s spectra of samples cycled with TPP contain peaks characteristic of Li2CO3 and lithium alkyl carbonates at 531.5 eV as well as Li metal oxide at 529 eV.
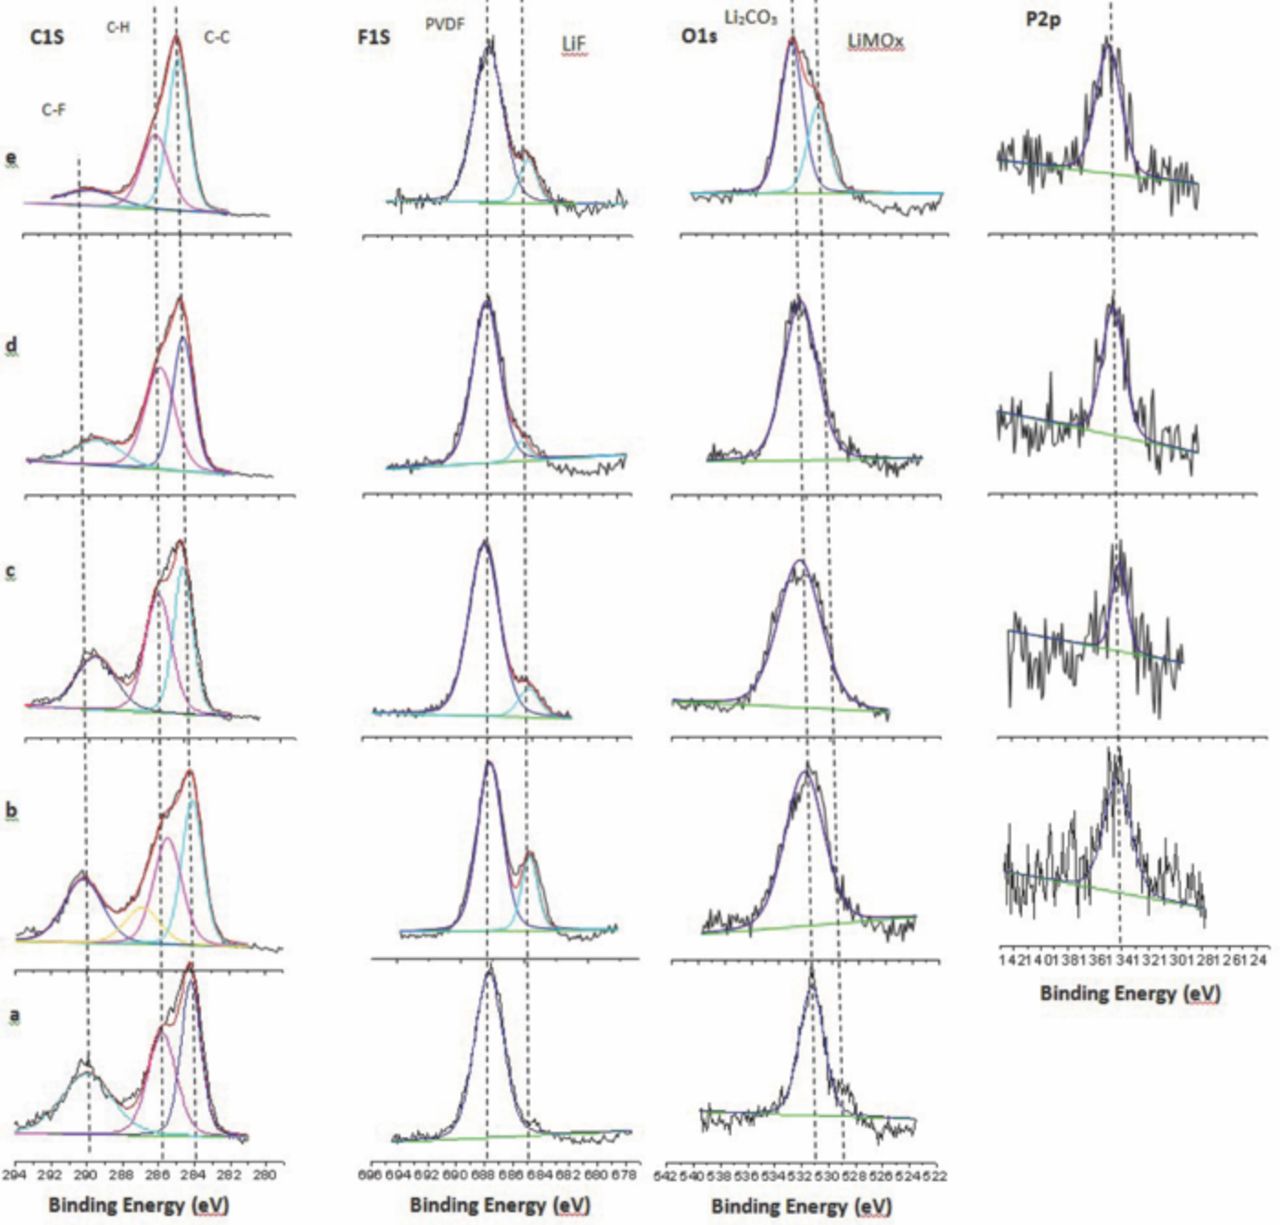
Figure 12. XPS Spectra of LiNi0.8Co0.2O2 cathodes (a) Fresh; (b) 1.2 M LiPF6 in EC/EMC (3:7 vol); (c) EC/EMC/TPP (3:6.5:0.5 vol); (d) EC/EMC/TPP (3:6:1 vol); (e) EC/EMC/TPP (3:5.5:1.5).
Conclusions
The effect of the addition of triphenyl phosphate (TPP) as a flame retarding additive for lithium ion battery electrolytes was investigated. The incorporation of TPP into standard carbonate based electrolytes resulted in a significant reduction in the flammability of the electrolyte as determined by self-extinguishing tests (SET). However, the incorporation of TPP did not significantly alter the flash point of the solvent blends, suggesting that the decomposition of TPP (either leading to the char formation or radical scavenging species) is essential to the flame retarding action. TPP incorporation resulted in a slight decrease in the electrolyte conductivity which corresponds to slight increase in the cell impedance especially at low temperature (−20°C). However, addition of up to 10% TPP did not significantly reduce the cycling performance and capacity retention of lithium ion cells. When EIS measurements were performed, a noticeable increase in the series, film, and charge transfer resistances was observed, especially on the MCMB anodes, suggesting that TPP is altering the structure of the SEI film hindering facile lithium kinetics due to a more resistive nature. Decreased kinetics were also observed at both electrodes with an electrolyte with 15% TPP especially at lower temperatures, as determined by Tafel polarization measurements, being attributed to lower ionic conductivity as well as the presence of TPP altering the surface layers of both electrodes. Post-mortem XPS and SEM analysis of the electrode surfaces suggest that the addition of up to 10% TPP results in small changes to the composition of the surface films but does not significantly interfere with the anode SEI film formation process. In summary, TPP is a promising flame retarding additive for lithium ion batteries with minimal deleterious effect on the electrode kinetics performance, but may result in improved safety for the large format cells.
Acknowledgment
This research project was funded by the NASA Rhode Island Space grant Consortium and NASA EPSCoR. Some of the work described here was carried out at the Jet Propulsion Laboratory, California Institute of Technology, under contract with the National Aeronautics and Space Administration (NASA) and under sponsorship of the NASA-Space Exploration Systems (SPS) program. Technical support was provided by Yardney Technical Products, Inc.