Abstract
Electrochemical Impedance Spectroscopy (EIS) is a well-established technique for studying Polymer Exchange Membrane Fuel Cells (PEMFC) but data interpretation remains delicate, mostly because impedance models are either based on oversimplified equations or conversely, include too many correlated parameters. It is thus crucial to carefully choose the models to interpret impedance data, according to FC materials and operation conditions. Most of PEMFC impedance spectra are composed of two loops in Nyquist plot that can be perfectly represented by classical Randles Electrical Equivalent Circuit (EEC). However, several spectra show a straight line at high frequencies associated with proton conduction in the cathode catalyst layer. Assuming an interface electrode, the Randles EEC is poorly adapted to such spectra and one will rather use Transmission Line Models (TLM). However, since TLM do not usually consider mass transport, it is necessary to adapt the EEC, especially at the cathode. Such EEC can then be used as general FC models independently of the occurrence of the straight line at high frequencies, i.e. independently of the ratio between proton conduction and reaction kinetics limitations. These TLM EECs are then used to analyze the layer(s) at the origin of oxygen transport limitations: catalyst and/or the gas diffusion layer.
Export citation and abstract BibTeX RIS

This is an open access article distributed under the terms of the Creative Commons Attribution 4.0 License (CC BY, http://creativecommons.org/licenses/by/4.0/), which permits unrestricted reuse of the work in any medium, provided the original work is properly cited.
In recent years, Polymer Electrolyte Membrane Fuel Cells (PEMFC) have been identified as a promising alternative to energy conversion systems based on fossil fuels. However, their limited lifetime and relatively high cost, compared for instance to internal combustion engines for transport applications, remain the two main factors preventing their large-scale commercialization. Significant improvements in Membrane Electrode Assemblies (MEA, Figure 1a) are needed to address these issues, like the optimization of the structure and performance of the porous electrodes.
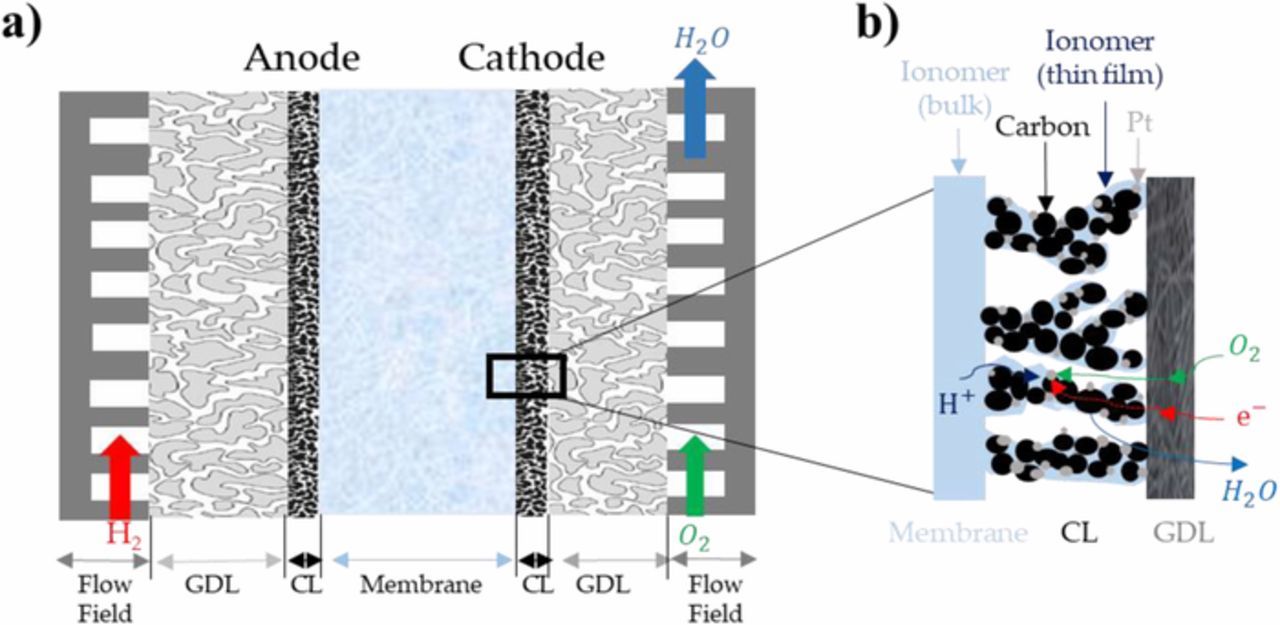
Figure 1. (a) Schematic of a PEMFC MEA inserted between two flow-field plates. (b) Illustration of the porous catalyst layer structure.
The Cathode Catalyst Layer (CCL) is the main contributor to the loss of PEMFC efficiency, due to the low kinetics of the Oxygen Reduction Reaction (ORR) and proton conduction losses through the ionomer. The CCL currently used in PEMFC are generally composed of a catalyst (generally platinum particles), a carbon substrate, a hydrophobic substance such as PolyTetraFluoroEthylene (PTFE) and an ionomer, usually the same as in the membrane, as shown in Figure 1b. Platinum or platinum-based catalysts play a crucial role in the electrochemical reaction, while carbon is used as the catalyst substrate because of its high electronic conductivity. PTFE serves as catalytic binder and to maintain the hydrophobicity of the CL, while the ionomer thin film covering the Pt and carbon particles acts as ionic pathway for protons. This complex structure has turned the surface reaction that occurred in the first CCL -made of Pt and ionomer only- into a volumetric phenomenon.
Electrochemical Impedance Spectroscopy (EIS) is considered as a powerful and well-established technique to study and diagnose PEMFC, and in particular their catalyst layers, in operando and in various conditions. The main advantage of this technique is that phenomena with different time constants can be considered separately in the frequency domain. EIS is generally used to understand the effect of operating conditions (temperature, pressure, relative humidity, etc.) on the MEA performance,1 to optimize the electrode structure (ionomer/carbon weight ratio and Pt loading),2–4 and to analyze the degradation of the different cell components such as the membrane, CL, and Gas Diffusion Layers (GDL).5–9
However, the key issue with EIS remains the interpretation of experimental data,10 firstly because impedance measurements require stable operating conditions, and secondly because impedance models are either based on oversimplified equations or conversely, can sometimes include too many parameters that will reveal correlated. In other words, finding the appropriate level of complexity of the impedance models is not trivial. These models are generally Electrical Equivalent Circuits (EEC) with components such as resistors, capacitors and Warburg-like elements representing the electrochemical half-reactions, as well as charge and mass transport.
In this work, we discuss the validity of different EEC for the interpretation of impedance data measured on two different MEA and in two experimental configurations. In the first case (blocked electrode), the cell is fed with H2 at the anode and N2 at the cathode so that no electrochemical reaction can take place provided that there is no hydrogen crossover through the membrane. This allows discriminating between ionic transport limitations in the membrane and the CCL. The ionic resistance through the CCL manifests itself through a straight (ideally 45°) line at high frequencies in the Nyquist plot. In the second case (in operando), the cell is fed with H2 at the anode and air at the cathode. This configuration allows analyzing reaction kinetics and mass transport losses which is usually done using a Randles EEC.11 The straight line at high frequencies can also sometimes be observed in operando for certain MEA,12,13 and it is typically associated with the volumetric character of the catalyst layer tied up to ion transport through the porous electrode as a whole14–17 or within the thin electrolyte film covering the reaction sites.18 The 45° slope is typical of homogenous ion transport through the CL, whereas other values may result from non-homogeneous transport properties, which is more likely to occur with thick electrodes and/or at high current density.13
Strictly speaking, the classical Randles EEC corresponds to a thin-film electrode representation,19,20 which does not account for its actual volumetric character (Figure 1b). In this regard, agglomerate models provide a more appropriate description by considering charge and mass transport through the electrode volume.21–23 The volumetric character of the electrode is also taken into account in impedance Transmission Line Models (TLM).11,24 However, apart from the recent work of Cruz-Manzo and Chen25 mass transport limitations are usually not considered in TLM. These authors derived a transmission line model including a Warburg element to account for oxygen diffusion as well as a resistance and a constant phase element to describe ORR kinetics.
In this work, we introduce a cathode TLM EEC that accounts for oxygen transport limitations through a Warburg element. The ORR reaction is modeled as simply as possible with a resistance and a capacitance in order to facilitate the physical interpretation of impedance data. In the following, we show -mathematically and through a parametric study- that such TLM EEC can be regarded as a generalization of Randles-like EEC when the order of magnitude of the ion transport resistance though the CCL becomes comparable to that of the impedance parameters characterizing the ORR kinetics. Regarding the impedance spectra, this condition corresponds also to the occurrence of a straight line at high frequencies. Finally, a focus is put on the layer(s) at the origin of oxygen transport limitations, i.e. the catalyst and/or the gas diffusion layer and their impact on the FC impedance.
Experimental
The experimental data used for this work were obtained using two distinct cells showing significantly different behavior in terms of high frequency impedance.
Cell A
In the first configuration, we used MEA purchased from SolviCore GmbH & Co. KG (H400E) with a cathode Pt loading estimated to be close to 0.4 mgPt.cm−2, the exact value being not disclosed by the manufacturer. 235 μm thick GDL coated with a MicroPorous Layer (MPL) (SGL 24BC by SGL Carbon) were used on the anode and cathode sides. The 19.6 cm² MEA (98 mm × 20 mm) were inserted between gold coated (1.5 μm) 316L stainless steel plates that ensure the current collection and reactant supply through 10 parallel flow channels (1 mm in width and 0.4 mm in depth) on each side. Both gases flew in the same -vertical- direction (co-flow). The GDL were compressed to 200 μm using Teflon gaskets to control their thickness.
Cell B
In the second configuration, the MEA were manufactured in the laboratory using 25.6 cm2 (64 × 40 mm²) Nafion XL100 membranes and 7.22 cm² (19 × 38 mm²) commercial Gas Diffusion Electrodes (GDE) with 0.5 mgPt.cm−2 catalyst layers and 235 μm thick gas diffusion layers (5% PTFE and 80% porosity) coated with Sigracet 29BC MPL. The anode and cathode sides of the MEA were thus strictly identical. The electrodes and the membrane were hot-pressed (T = 135°C, P = 6.2 MPa) for 3 minutes and 30 seconds so that the MEA thickness was 410 ± 25 μm. These home-made MEA were used in a cell made of nickel (30 μm) and gold-coated (3 μm) brass plates with a single serpentine (1 mm in width and 1 mm in depth) flow channel on each side. Both gases flew in counter-flow. The GDL were compressed to 150 μm using Teflon gaskets to control their thickness.
The FC temperature was kept to 60°C with cell A and 70°C with cell B during all experiments. The temperature was controlled thanks to a water circuit. The cathode compartment was supplied with humidified air (70% RH in cell A and 80% RH in cell B) with a stoichiometry of 3. The anode compartment was fed with pure hydrogen (at the same RH as the cathode gas) with stoichiometries of 1.2 and 1.5 in the first and second cell, respectively. Each new MEA was subjected to a 2 hours conditioning stage consisting of current steps under potentiostatic conditions with voltages set to OCV, 0.6 V and 0.3 V.
Impedance data were measured in galvanostatic mode for the H2/air configuration at 0.5 A.cm−2 with a perturbation amplitude limited to 50 mA (peak to peak), with frequencies ranging from 20 mHz to 10 kHz. The potentiostatic spectra were acquired under H2/N2 with 0.5 V DC potential and a dynamic perturbation set to 50 mV (peak to peak), for a range of frequencies comprised between 1 Hz and 10 kHz. We paid attention to reduce the impact of the inductance of connecting wires on the system impedance as much as possible.
The impedance spectra measured with cell B consistently showed a straight line at high frequencies, while that line never appeared with cell A.
Randles EEC and Transmission Line Models
EIS with a blocked electrode is used as a complement to in operando characterization to investigate PEMFC cathode structure and transport properties. For instance, Makharia et al. studied the effect of the ionomer concentration in the catalyst layer on electrolyte resistance3 and Gaumont et al. measured the proton resistance of catalyst layers as a possible marker of their degradation.24 Figure 2 shows a Nyquist plot of a PEMFC impedance spectrum obtained with a blocked electrode characterized by a straight line at high frequencies, generally associated to proton conduction losses within the CCL.14–18 The slope higher than 45° is in agreement with inhomogeneous ion transport properties through the CCL expected for thick electrodes which is the case for cell B (MEA self-assembled by hot pressing). At low frequencies, the imaginary part of the impedance increases steeply so that it approaches a vertical line associated with a purely capacitive behavior. However, significant deviation from the vertical line can still be observed, which is generally explained by the inhomogeneous distribution of pore radii within the electrode.26 Each pore has a different penetration depth and therefore a different transport impedance response depending on the applied signal.
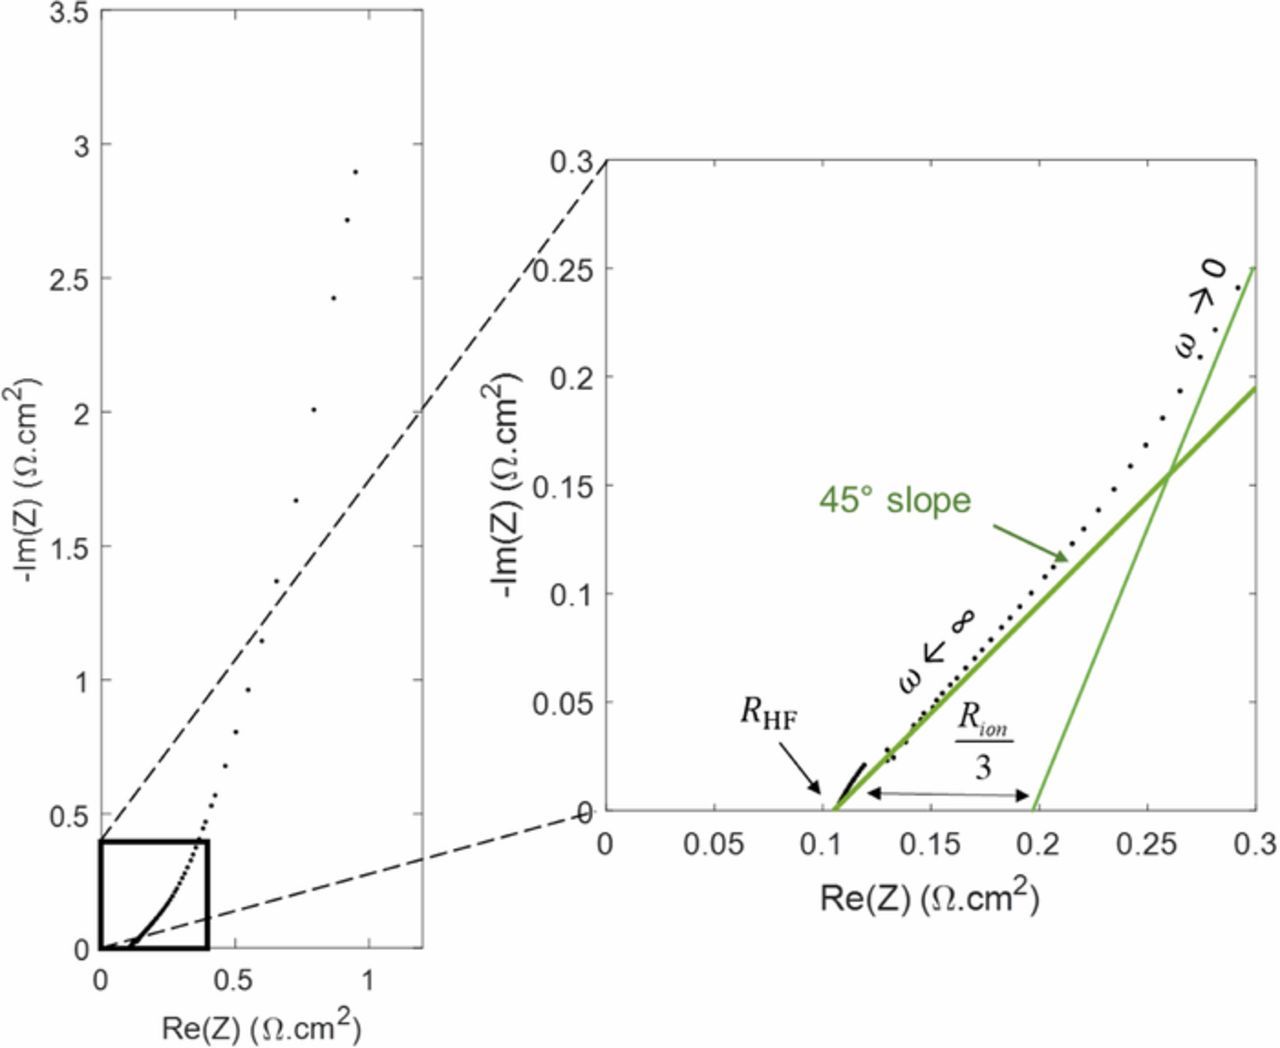
Figure 2. Experimental impedance spectra in a Nyquist diagram for cell B with a blocked electrode (under H2/N2).
Impedance spectra of blocked electrodes are very well represented using transmission line models. TLM were first introduced by de Levie in 1963 to analyze the electrochemical behavior of porous electrodes.14,27 Figure 3 shows a discretized transmission line EEC, which is based on the assumption that the electrode consists of an assembly of horizontal cylindrical pores of identical diameter and homogeneous electrical properties (i.e. Cδdl and σion). Each pore has a length equal to the thickness of the electrode and contains an ion conducting phase (electrolyte) in the upper rail of the circuit and an electron conducting phase (carbon and Pt agglomerates) in the lower rail.
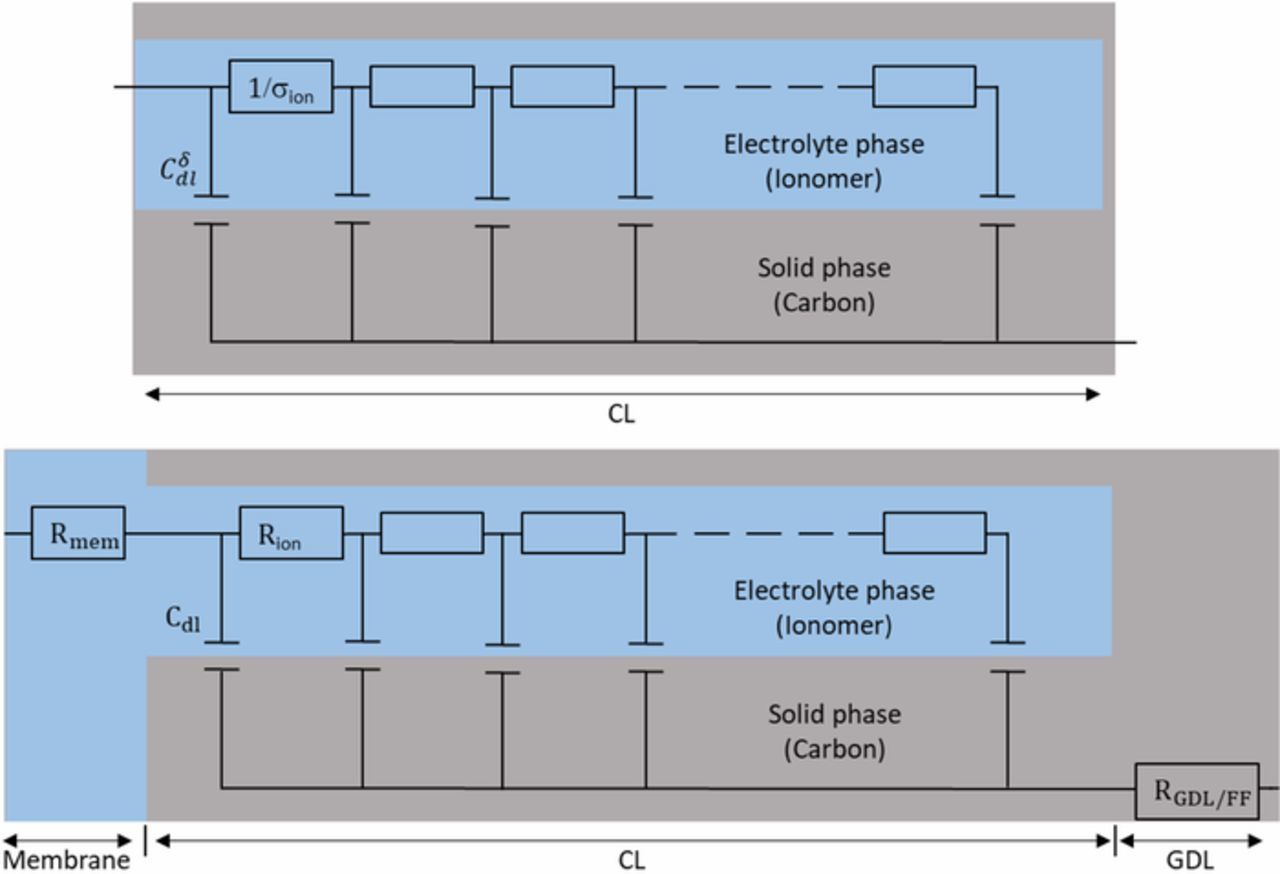
Figure 3. TLM EEC, without oxygen transport limitation, for PEMFC under H2/N2. Top: CCL EEC; bottom: MEA EEC. Cδdl is a capacity per unit length, with δ the electrode thickness, and σion stands for the ionomer conductivity. Cdl and Rion are their macroscopic counterparts per MEA surface area.
In the case of carbon supported catalyst layers, the resistance of the carbon/Pt agglomerates is assumed negligible so that the EEC consists only of a parallel network of double layer capacitances Cδdl connected via ionomer linear resistances 1/σion. In the MEA equivalent circuit, the parameters of the transmission line are usually replaced by the average macroscopic parameters of the catalyst layer: Cdl = Cδdlδ, with δ the electrode thickness, and  (Figure 3, bottom).13 In addition, the MEA equivalent circuit includes an ionic resistance Rmem representing the membrane and an electronic resistance RGDL + FF accounting for the Flow Field (FF) plates, GDL and possibly other contact resistances. Note that the impedance of the anode is generally neglected due to the fast kinetics of the H2 oxidation reaction compared to the O2 reduction reaction.
Ultimately, the global impedance of the cell can be written as:3
![Equation ([1])](https://content.cld.iop.org/journals/1945-7111/166/15/F1209/revision1/d0001.gif)
Where the high frequency resistance is defined as RHF = Rmem + RGDL + FF. ω is the angular frequency and i the imaginary unit. Equation 1 was obtained under the assumption of homogeneous electrical properties, as mentioned above.
Equation 1 can be simplified in the high frequency domain, considering that:
![Equation ([2])](https://content.cld.iop.org/journals/1945-7111/166/15/F1209/revision1/d0002.gif)
And in the low frequency domain, knowing that  :
:
![Equation ([3])](https://content.cld.iop.org/journals/1945-7111/166/15/F1209/revision1/d0003.gif)
Therefore, RHF and Rion can be easily estimated from the profile of the Nyquist plots. The high-frequency resistance RHF is given by the intersection of the impedance spectrum with the x-axis and the intersection between the low-frequency line and the x-axis is Rion/3 + RHF, as shown in Figure 2.
The ionic resistance Rion plays an important role in the electrochemical behavior of PEMFC cathodes, although the main contribution to performance losses remains the slow ORR kinetics. Rct and the double layer capacitance Cdl, are the two main parameters characterizing the ORR kinetics. To study their impact on the FC impedance, we performed in operando EIS (under H2/air) with both cells. An example of corresponding experimental spectra is shown in Figure 4.
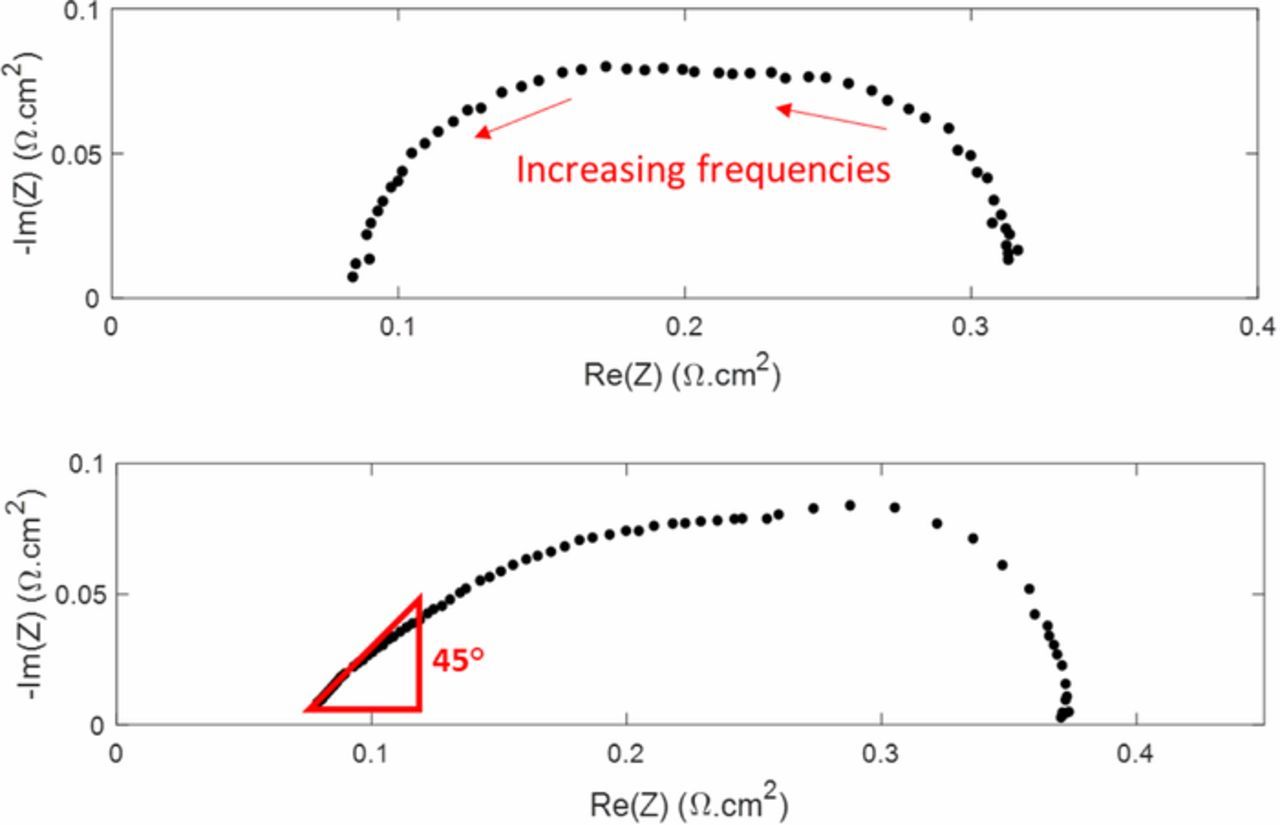
Figure 4. Nyquist diagram of impedance data measured in operando (under H2/air) with cells A (top) and B (bottom). The 45° straight line appears only with cell B.
Figure 4 (top) shows the Nyquist plot of impedance data measured with cell A. This impedance spectrum is composed of two intricated loops: the high frequency loop is governed mostly by electrochemical reaction kinetics and the low frequency loop by oxygen transfer limitations. The EEC typically associated with such FC spectra is the Randles circuit,28,29 shown in Figure 5. In a more general way, this EEC is commonly used to interpret the impedance of thin electrodes. It is composed of a charge transfer resistance Rct in parallel with a double layer capacitance Cdl characterizing the electrochemical reaction, in series with a high-frequency resistance RHF. Finally, a Warburg impedance ZW connected in series to Rct accounts for oxygen transport limitations within the cathode catalyst layer. This is compatible with an electrode description based on agglomerate models but this is intrinsically in contradiction with the thin film assumption of the Randles EEC.
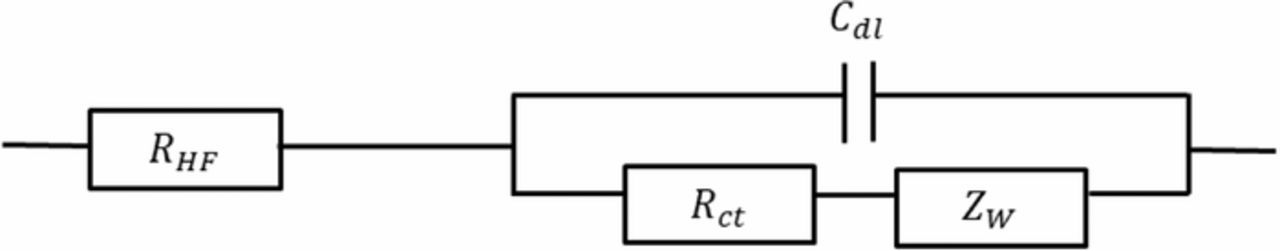
The impedance of this EEC is given by:
![Equation ([4])](https://content.cld.iop.org/journals/1945-7111/166/15/F1209/revision1/d0004.gif)
With,
![Equation ([5])](https://content.cld.iop.org/journals/1945-7111/166/15/F1209/revision1/d0005.gif)
In Equation 5, Rd is the diffusion resistance and τ the time constant characterizing the processes of oxygen diffusion through the catalyst layer.
The Randles circuit cannot be used to fit and analyze spectra such as that of Figure 4 (bottom), obtained with cell B, because it does not consider the high frequency straight line associated with the ionic resistance through the porous structure of the electrode. This must be done using a TLM-like model. Eikerling and Kornyshev18 applied a TLM model (similar to that developed by De Levie for blocked electrodes) to operating FC and calculated the impedance analytically for low currents in the absence of oxygen supply limitations. Later, Makharia et al.3 proposed a TLM model neglecting oxygen transport limitations and showed that this model and the physical model of Eikerling and Kornyshev were equivalent for low currents. More recently, Cruz-Manzo and Chen25 derived a TLM like model for intermediate and high currents including a Warburg element to account for oxygen diffusion and a charge transfer resistance in parallel with a constant phase element to account for the ORR kinetics.
In order to analyze our impedance spectra, we modified the TLM model of Figure 3 regarding charge transfer during the ORR -introducing Rct - and mass transfer through the CCL -introducing Warburg elements in series with Rct- as shown in Figure 6. Note that although TLM are more detailed than Randles EEC and can take some aspect of the electrode 3D structure into account, such impedance models must not be mistaken for agglomerate models, which are among the most detailed physical description of charge and mass transport through Gas Diffusion Electrode (GDE).
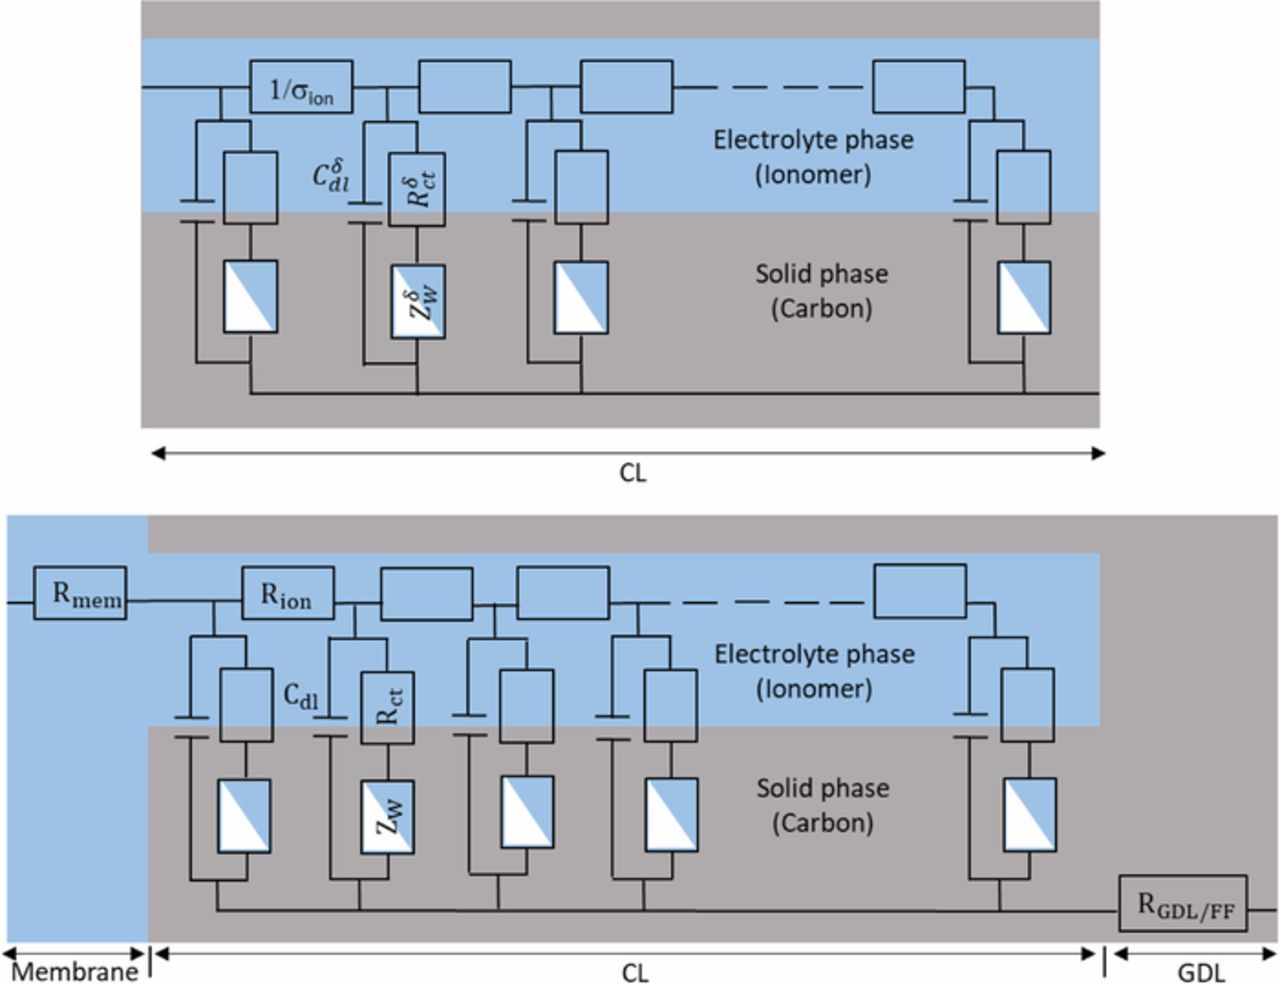
Figure 6. TLM-like EEC accounting for oxygen transport limitations in the CCL for in operando PEMFC. Top: CCL EEC; bottom: MEA EEC. Cδdl is a capacity per unit length, with δ the electrode thickness, and σion stands for the ionomer conductivity, as in Figure 3. Similarly, ZδW and Rδct are impedances per unit thickness. Cdl, Rct, Rion and Zw are their macroscopic counterparts per MEA surface area. Note that at this point no hypothesis has to be made about the medium associated with the main oxygen diffusion in the CL: gas pores or thin ionomer layer covering the catalyst.
Ultimately, the global impedance of the cell can be described as:
![Equation ([6])](https://content.cld.iop.org/journals/1945-7111/166/15/F1209/revision1/d0006.gif)
Where ZCCL(ω) stands for the modified expression of the TLM impedance accounting for charge transfer and mass transport through the cathode catalyst layer. Similar expressions were already used in the literature21 but to the best of our knowledge, none of them took mass transfer into account using a Warburg element or proposed simple analytical expressions. However, Eikerling and Kornyshev considered Knudsen oxygen diffusion through the electrode.18 Note that Equation 6 was obtained under the hypothesis of a homogeneous current density j through the thickness of the catalyst layer, so that the charge transfer resistance can also be assumed homogeneous (Rct = b/j, with b the Tafel slope30,31). In a more general manner, all parameters appearing in a TLM-like model are considered homogeneous when analytic solutions are proposed. This is clearly a strong limitation of these approaches but on the other hand, their ability to predict the appearance of the 45° high frequency line shows that the homogeneous parameter hypothesis may not be far from reality, at least in some operating conditions. Finally, one can assume that deviation from ideal behavior, i.e. high frequency lines with slopes different than 45° are due to non-homogenous conditions through the catalyst layer.13 In our case (Figure 4 and in the following), the slope was close to 48°.
Discussion
Occurrence of the 45° high frequency line
In this section we consider the conditions for which the 45° straight line appears in EIS Nyquist plots. These conditions depend on the reaction kinetics parameters, Rct and Cdl, as well as on the ionic resistance Rion and the angular frequency ω. To simplify the equations, the oxygen transport limitations (i.e. the Warburg impedances) are not taken into account in the following, which can be easily justified by their negligible impact at high frequencies. Figure 7 shows impedance spectra computed for different values of Rion, the other parameters remaining unchanged and close to values typically measured with our cells (Rct = 0.13 Ω.cm² and Cdl = 0.0562 Ω/cm2). We can see from this figure that there is a threshold value of the angular frequency above which the 45° straight line is always present. Furthermore, the value of this angular frequency threshold increases as Rion decreases. That is the reason why the 45° straight line may not be observed for FC with a high ionomer content in the cathode catalyst layer and/or thin electrodes. On top of that, a review of existing literature shows that this straight line is observed in most of, if not all cases, with home-made MEA assembled by hot pressing12,13 which is consistent with this numerical analysis.
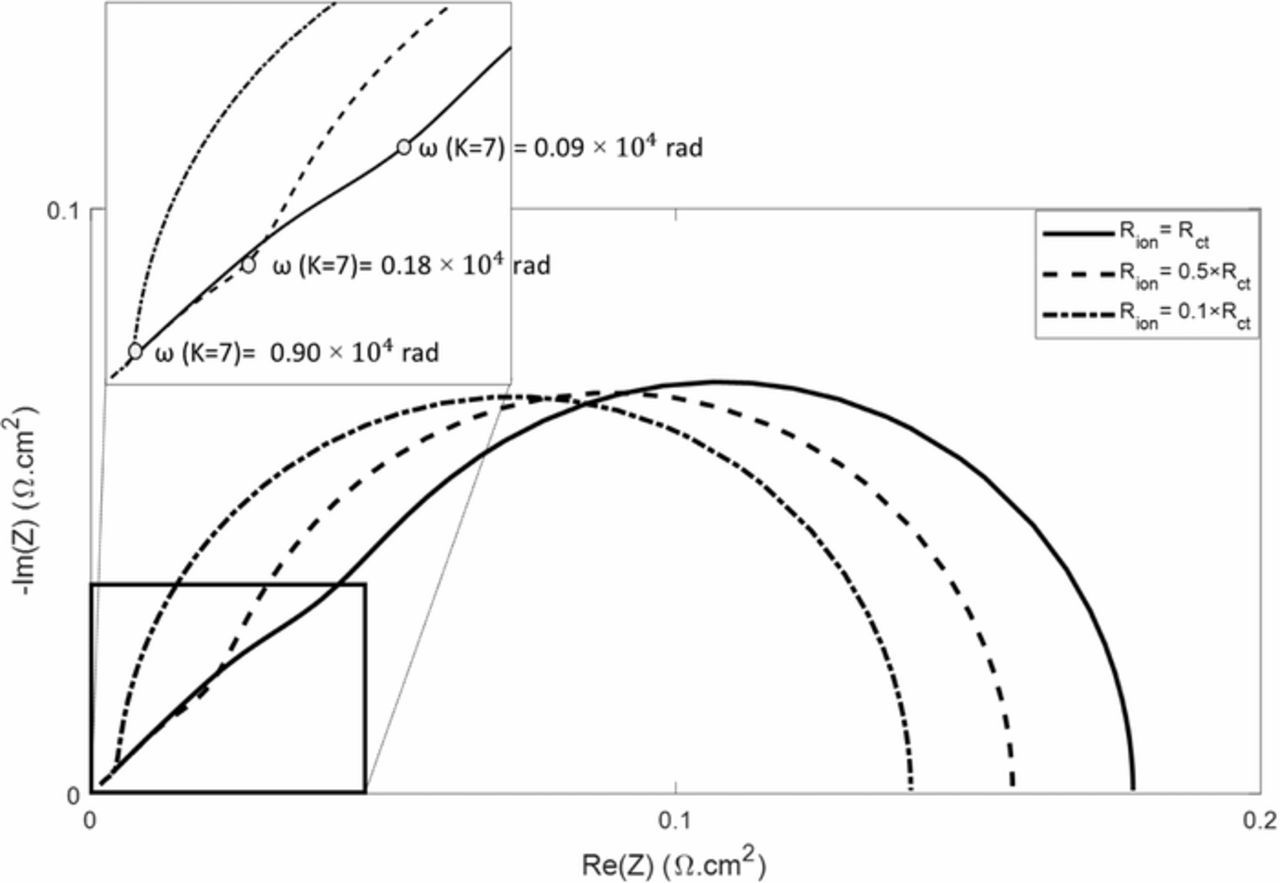
Figure 7. Nyquist plot of impedance spectra simulated using a TLM-like model with different values of the ionic resistance in the CCL. For clarity, the oxygen transport limitations (i.e. the Warburg impedances in Figure 6) are not considered and RHF = 0 Ω.cm². The values of the kinetic parameters, Rct = 0.13 Ω.cm² and Cdl = 0.0562 Ω/cm2, are close to those measured with our cells (Tables I and II).
To understand the relationship between the ion transport resistance through the CCL and the extent of the 45° line in the Nyquist plot, we consider the dimensionless ratio K between the ionic resistance Rion and the impedance of the other elements of the branch Z(Rct||Cdl) characterizing the reaction kinetics. In Equation 7, Z(Rct||Cdl) is function of the angular frequency ω:
![Equation ([7])](https://content.cld.iop.org/journals/1945-7111/166/15/F1209/revision1/d0007.gif)
And,
![Equation ([8])](https://content.cld.iop.org/journals/1945-7111/166/15/F1209/revision1/d0008.gif)
If ||K|| < 1 at the highest scanning frequency, ion transport has a low impact on the cell impedance compared to reaction kinetics and the 45° straight line will not appear in the Nyquist plot and the shape of the impedance spectra approaches that of usual Randles circuits. If ||K|| is close to one or higher, the influence of ion transport on the impedance spectra will be visible above a threshold value of the angular frequency ωc. In the example shown in Figure 7, ωc is reached for ||K|| ≈ 7 independently of the values of the impedance parameters, such as:
![Equation ([9])](https://content.cld.iop.org/journals/1945-7111/166/15/F1209/revision1/d0009.gif)
Therefore, if ion transport is negligible compared to the reaction kinetics limitations, the threshold frequency ωc could be sufficiently high so that the 45° line is not visible in the Nyquist plot. An important consequence of this result is that the modified TLM model presented in Figure 6 corresponds to a general EEC of FC impedance that can be used as well with volumetric, as with thin CCL, since it tends toward the Randles circuit when Rion is sufficiently low.
This can be demonstrated starting from Equation 6 and considering the first order Taylor expansion of  . Thus
  when, Rion → 0, and the modified TLM impedance becomes:
![Equation ([10])](https://content.cld.iop.org/journals/1945-7111/166/15/F1209/revision1/d0010.gif)
Which corresponds to the cathode catalyst layer resistance ZRandles of the Randles EEC given in Equation 4. To illustrate this convergence between TLM-like and Randles EEC, Figure 8 shows experimental data that were obtained with Cell A. We can see that both models allow to fit the spectrum similarly with identical residuals (2.13 10−4 for the both models), although there is no 45° straight line at high frequencies. As a consequence, the value of the ionic resistance is close to zero, but the other parameters are identical with both models (Table I).

Figure 8. Nyquist diagram of impedance spectra measured in operando (under H2/air) with Cell A, and interpolated spectra using a Randles EEC and the TLM-like model of Figure 6.
Table I. Estimated parameters obtained with the experimental data and models in Figure 8.
| RHF | Rct | Cdl | Rion | Rd | τ | |
|---|---|---|---|---|---|---|
| (Ω.cm2) | (Ω.cm2) | (F/cm2) | (Ω.cm2) | (Ω.cm2) | (s) | |
| Randles EEC with ZW in CCL σ = 2.13 × 10⁻⁴ | 0.0893 | 0.1240 | 0.0302 | - | 0.0754 | 0.0671 |
| TLM with ZW in CCL σ = 2.13 × 10⁻⁴ | 0.0893 | 0.1240 | 0.0302 | 1.09 × 10⁻⁸ | 0.0754 | 0.0671 |
Location of the main mass transfer resistance
We have just shown that the modified TLM in Figure 6 is equivalent to the usual Randles EEC when the ionic resistance through the catalyst layer is negligible, which is the case for instance with a surface electrode. This leads us to the conclusion that the Warburg impedance in the Randles circuit corresponds to an oxygen transport resistance that is physically located in the catalyst layer, which is inherently in contradiction with the hypothesis of a surface electrode, often put forward with Randles EEC. Significant mass transfer resistance may appear through the gas diffusion layer and the most appropriate way to take them into account consists in using a modified Randles EEC with the Warburg impedance connected in series to the reaction kinetics parameters Rct and Cdl, such as presented in Figure 9 (top). Of course, the same approach can be followed with TLM-like EEC such as shown in Figure 9 (bottom). It must be noted that both EEC in Figure 9 consider oxygen transport resistance in the GDL or CCL only, although it would still be possible, at least from a mathematical point of view, to keep Warburg elements in series with the charge transfer resistance Rct (and in parallel with Cdl) to account also for oxygen transport resistances through the CCL. Nevertheless, these two mass transfer resistances -through the CCL and in the GDL- would reveal highly correlated. This is the reason why, in this work, we limited ourselves to four options:
- Usual Randles EEC (Figure 5) with Warburg impedance in the CCL vs. modified Randles EEC with Warburg impedance in series -Figure 9 (top)-, applied to impedance spectra measured with cell A (see the experimental section), i.e. without a straight line at high frequencies.
- TLM-like EEC (Figure 6) with Warburg impedance in the CCL vs. TLM-like EEC with Warburg impedance in series -Figure 9 (bottom)-, applied to impedance spectra measured with cell B (see the experimental section), i.e. with a straight line at high frequencies.
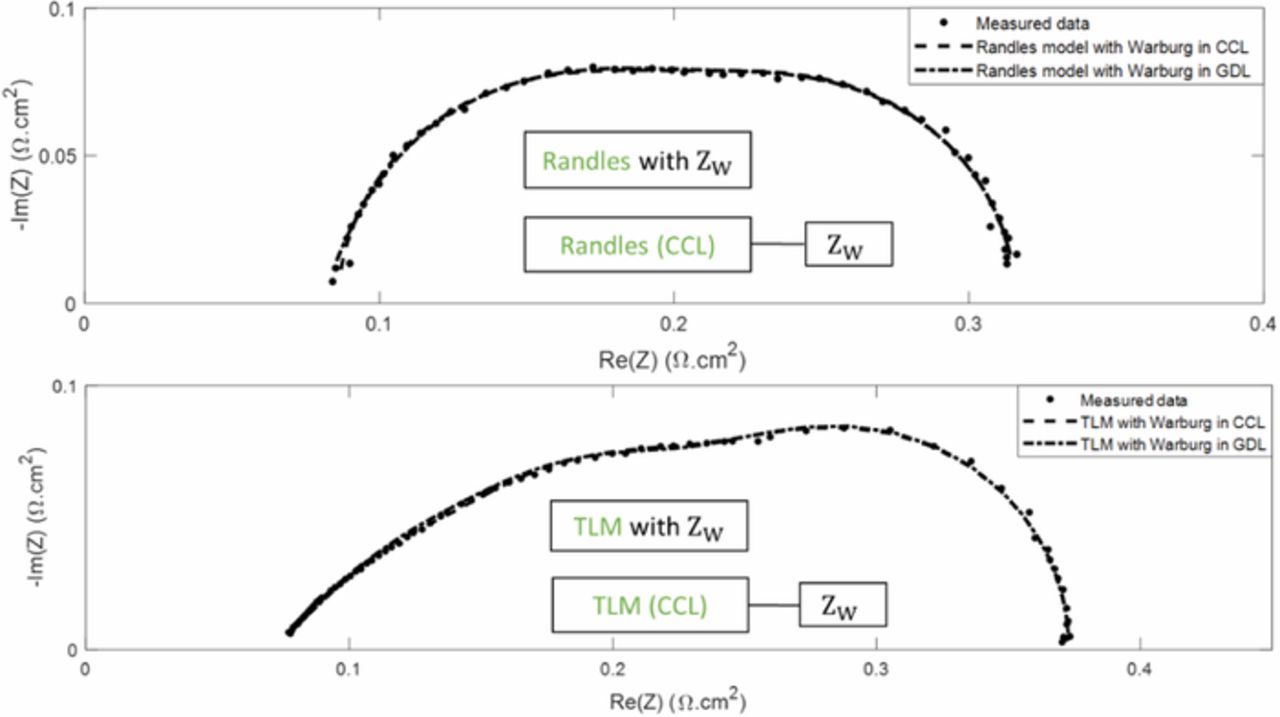
Figure 9. Nyquist diagram of impedance spectra measured in operando (under H2/air), and interpolated spectra using a Randles EEC with cell A (top) and a TLM-like model with cell B (bottom).
The data and graphs in Figure 9 show that both approaches -Warburg elements in the CCL or in series (in the GDL)- allow to fit rather well the experimental spectra. This is the case with cell A (Randles EEC) as well as with cell B (TLM-like EEC). The standard deviations are similar, although consistently lower when the Warburg impedance is in the CCL. The corresponding values of the impedance parameters are given in Table II. In both cases, their order of magnitude is consistent with those usually encountered in PEMFC.3,28,31,32 However, despite of their ability to fit equally well the experimental data, both approaches cannot be considered as equivalent since the corresponding values of the kinetic parameters differ significantly (i.e. up to 40%). The fit quality alone does not allow a clear conclusion about the most appropriate EEC and thus about the location of the main mass transfer impedance: a more detailed analysis of the diffusion impedance parameters (Rd and τ) is necessary. Since they are related to the physical parameters governing charge and mass transfer through the MEA31 it is possible to estimate the thickness of an equivalent diffusion layer starting from Rct, Rd and τ:
![Equation ([11])](https://content.cld.iop.org/journals/1945-7111/166/15/F1209/revision1/d0011.gif)
Equation 11 can be derived considering that Rct = b/jf, Rd = bδ/4FDeffc*O2 and τ = δ2/Deff,25,31 with jf the current density (0.5 A/cm2 in our case), F the Faraday constant, Deff the effective oxygen diffusion coefficient and cO2 the oxygen concentration at the GDL/channel interface (air at 1 atm and 333 K in cell A or 343 K in cell B). c*O2 in the expression of Rd is the oxygen concentration at the reaction sites. Solving Fick equation in steady-state, gives c*O2 = cO2 − jfδ/4FDeff.29
Table II. Estimated parameters starting from the experimental data and models in Figure 9.
| RHF | Rct | Cdl | Rion | Rd | τ | δ | |
|---|---|---|---|---|---|---|---|
| (Ω.cm2) | (Ω.cm2) | (F/cm2) | (Ω.cm2) | (Ω.cm2) | (s) | (μm) | |
| Cell A: Randles EEC | |||||||
| ZW in CCL σ = 3.55 × 10⁻⁴ | 0.086 | 0.132 | 0.034 | - | 0.097 | 0.066 | 265 |
| ZW in GDL σ = 4.65 × 10⁻⁴ | 0.078 | 0.102 | 0.053 | - | 0.135 | 0.077 | 230 |
| Cell B: TLM EEC | |||||||
| ZW in CCL σ = 2.35 × 10⁻⁴ | 0.069 | 0.108 | 0.034 | 0.234 | 0.122 | 0.066 | 218 |
| ZW in GDL σ = 2.79 × 10⁻⁴ | 0.071 | 0.074 | 0.057 | 0.191 | 0.172 | 0.073 | 183 |
Note that this expression of the thickness δ 11 of the equivalent diffusion layer is independent of the effective diffusion coefficient so that no hypothesis has to be made about the nature of oxygen diffusion: wet air through the pores of the GDL and/or CCL or ionomer layer covering the reaction sites. The values of δ estimated with Equation 11 for both approaches (i.e. Warburg elements in the CCL or in the GDL) and both cells (A with Randles EEC and B with TLM) are given in Table II. It can be clearly seen that in all cases, the estimated values are of the order of magnitude of the GDL thickness (200 μm and 150 μm for cells A and B, respectively) rather than the CCL thickness (about 10 μm) or the very thin ionomer film covering the catalyst sites (about 5–10 nm). These results thus are in favor of a Warburg element in series with the reaction kinetic parameters, i.e. accounting for oxygen diffusion through the GDL.
At that point, it is worth mentioning that locating the main mass transfer resistance(s) is one of the many complications linked with the low frequency part of fuel cell impedance spectra. Firstly, because the low frequency -apparent- impedance is also strongly impacted by oxygen concentration oscillations induced by the measuring signal.30,33,34 Then, because the derivation of the Warburg impedance supposes Fickian oxygen diffusion only, while, at least in a fuel cell fed with air, Stefan-Maxwell equations should be used as in most stationary models.35,36 In this regard, oxygen diffusion is strongly dependent on the overall convective flux, and thus on water management.37 Such issues are however out of the scope of this work. That is the reason why only the order of magnitude of the diffusion thickness δ was considered in this discussion.
Conclusions
The main conclusion of this work is that TLM-like EEC modified to consider charge transfer resistance as well as oxygen transport resistance can be used instead of Randles EEC to model PEMFC CCL impedance since they correspond to a general representation: the impedance of such TLM-like EEC tends toward that of a Randles EEC when the ion transport resistance through the catalyst layer becomes negligible compared to the ORR kinetics parameters, i.e. the charge transfer resistance and the double layer capacitance. Similarly, the occurrence of the straight line at high frequencies, depends on the ratio between the ionic resistance and the elements characterizing the reaction kinetics. This is the reason why the straight line is always observed with blocked electrodes, but appears only sometimes during fuel cell operation, i.e. with thick electrodes or electrodes with low ionomer content.
Finally, these considerations lead us to the conclusion that the Warburg impedance in the Randles circuit corresponds to an oxygen transport resistance that is physically located in the cathode catalyst layer, which is in contradiction with the hypothesis of a surface electrode that governs the derivation of this EEC. Assuming that the main oxygen transport limitation is in the GDL would be more consistent with the Randles EEC, but this hypothesis means that the Warburg impedance should be connected in series with the charge transfer resistance and double layer capacitance. We have seen that such a modification has a significant impact on the values of the kinetics parameters that can be identified from experimental impedance spectra, with Randles EEC, as well as with TLM-like EEC.
ORCID
J. Mainka 0000-0003-1270-0023
O. Lottin 0000-0002-4607-203X