Abstract
We report a multi-paradigm model of the membrane chemical degradation in Polymer Electrolyte Membrane Fuel Cells (PEMFCs), by combining Coarse-Grained Molecular Dynamics (CGMD) and a multiscale cell performance model. CGMD is used to generate structural databases that relate the amount of detached (degraded) ionomer sidechains with the water content and the resulting PEM meso-microporous structure. The multiscale cell performance model describes the electrochemical reactions and transport mechanisms occuring in the electrodes from an on-the-fly coupling between Kinetic Monte Carlo (KMC) sub-models parametrized with Density Functional Theory (DFT) data and (partial differential equations-based) continuum sub-models. Furthermore, the performance model includes a kinetic PEM degradation sub-model which integrates the CGMD database. The cell model also predicts the instantaneous PEM sidechain content and conductivity evolution at each time step. The coupling of these diverse modeling paradigms allows one to describe the feedback between the instantaneous cell performance and the intrinsic membrane degradation processes. This provides detailed insights on the membrane degradation (sidechain detachment as well as water reorganization within the PEM) during cell operation. This novel modeling approach opens interesting perspectives in engineering practice to predict materials degradation and durability as a function of the initial chemical composition and structural properties in electrochemical energy conversion and storage devices.
Export citation and abstract BibTeX RIS

This is an open access article distributed under the terms of the Creative Commons Attribution 4.0 License (CC BY, http://creativecommons.org/licenses/by/4.0/), which permits unrestricted reuse of the work in any medium, provided the original work is properly cited.
From the second half of the twentieth century, Polymer Electrolyte Membrane Fuel Cells (PEMFCs) have attracted much attention due to their potential as a clean power source for vehicles traction. Market introduction of FC vehicles is being recognized of highest priority in many developed countries due to their impact on the reduction of energy consumption and greenhouse gas emissions. However, PEMFC technologies have not yet reached all the requirements to be competitive, in particular regarding their high production cost of Membrane Electrode Assemblies and their low durability.
Indeed, meso/micro-structural degradation leading to the PEMFC components aging is attributed to several complex physicochemical mechanisms not yet completely understood. The associated components meso/micro-structural changes translate into irreversible long-term cell power degradation.1–3 For instance, dissolution and redistribution of the catalyst reduces the specific catalyst surface area and the electrochemical activity. The corrosion of the catalyst carbon-support and loss or decrease of the hydrophobicity caused by an alteration of the Polytetrafluoroethylene in Catalyst Layers (CLs), Microporous Layers and Gas Diffusion Layers also affect the water management in the cell and thus the electrochemical performance.
Regarding the polymer electrolyte in PEMFCs, a large number of materials has been tested, including sulfonated hydrocarbon polymers, phosphoric acid doped polybenzimidazole, polymer-inorganic composite membranes or solid acid membranes. However, the most widely used are still the PerFluoroSulfonated Acid (PFSA) polymers (the so-called Nafion from DuPont, Figure 1). Apart from mechanical degradations such as thinning and pinhole formations,4 chemical and electrochemical degradations can take place in the PFSA-based membranes and in the ionomer inside the CLs.5
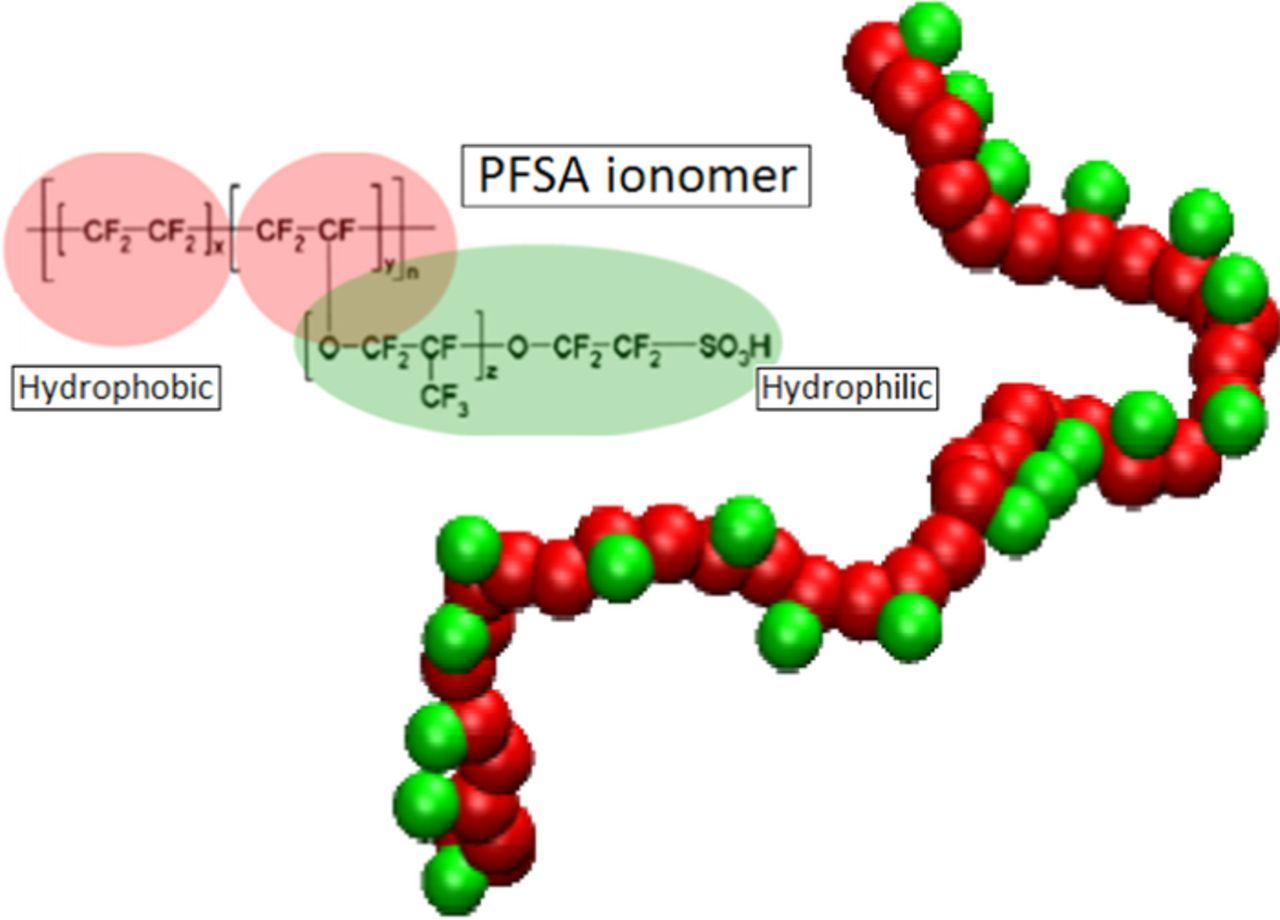
Figure 1. Representation of our Coarse Grain Nafion model in which the hydrophobic backbone is replaced by a coarse-grained chain of 20 apolar beads (red color) and the entire side chain is replaced by a negatively charged bead (green color).
Significant permeation of the reactants across PEM, in particular oxygen from the cathode to the anode, has been often experimentally reported as being the major cause of PEM chemical degradation.6–8 The formation of hydrogen peroxide (H2O2) at the anode CL9,10 is attributed to the following reaction
![Equation ([1])](https://content.cld.iop.org/journals/1945-7111/163/2/F59/revision1/d0001.gif)
Formation of H2O2 may also occur at the cathode CL as part of the Oxygen Reduction Reaction (ORR),
![Equation ([2])](https://content.cld.iop.org/journals/1945-7111/163/2/F59/revision1/d0002.gif)
in particular if Pt-M catalysts are used, with M being a transition metal element.11
H2O2 is a highly oxidizer reagent which may deteriorate the PEM. Furthermore, PEM degradation leads to an increasing reactants cross-over between the CLs. Young et al. reported that at non-zero current densities a performance decay is observed due to an increase of the PEM resistance, that is, a decrease of the PEM conductivity.12 As this conductivity is directly related to the side chains presence, it was concluded that the radical reaction responsible of the chemical degradation involves not only an attack on the backbone but on the side chain as well (mechanism known as side chain unzipping). Other experiments demonstrated that in particular Open Circuit Voltage (OCV) conditions are strongly damageable for the PEM.13–15
One of the key factors enhancing the PEM chemical degradation is the presence of Fenton's ions (for example Fe2+ or Cu2+) in the cell which will initiate the decomposition of H2O2 into radicals OH° and OOH°.16–19 The most plausible origins of these ions are the degradation of iron containing end-plates which are used in the PEMFCs, and the oxidation of the pipes in the reactants management system.20,21 Additionally, some debate still remains about the role of the precipitated Pt (arising from electrochemical dissolution mainly in the cathode CL) on catalyzing the H2O2 decomposition.22,23 Interestingly, some of the PEM degradation products were reported to contaminate the catalyst and decrease its ORR activity within the CLs.24
Numerous mathematical models have been developed with the aim to understand the large diversity of experimental observations.25 For instance, Xie and Hayden originally proposed a continuum kinetic model describing the chemical degradation of the PEM as function of the concentrations of radicals OH° and OOH°.26 Their model is based on the unzipping mechanism where backbone and side chains are cutted starting from sites containing impurity carboxylic groups. Significant concentrations for these groups have been reported in earlier versions of Nafion.27 The carboxylic acid groups are either direct by-product of the PEM synthesis or the result of reactions of other contaminants with radical species. This carboxylic acid reacts with the two radicals OH° and OOH°. Carbon dioxide and HF are then released and the carboxylic acid group is transformed into a fluoride acid group which is then hydrolyzed, releasing another HF molecule and regenerating the carboxylic acid group.28 After each degradation step, the PEM backbone loses one carbon atom. Besides, Ishimoto et al. performed density functional theory (DFT) calculations to understand the chemical degradation mechanism of side chains by hydroxyl radical attacks.29 The energy profiles from these DFT calculations have supported the reaction mechanism proposed by Xie and Hayden.26
Chen and Fuller proposed a continuum H2O2 formation model based on a CL agglomerate approach.30 They simulated the production of H2O2 at the anode and at the cathode through chemical and electrochemical pathways. The H2O2 formation model is coupled to an oxygen permeation model, and validated with experimental data. However the impact of the H2O2 formation on the PEM degradation is not described and thus the cell potential decay over time is not calculated. Others reported continuum models describing the H2O2 decomposition, the radicals formation and the ionomer degradation,31 but still without predicting the induced cell performance decay over time. Shah et al. proposed a Continuum Fluid Dynamics (CFD) model accounting for the PEM degradation, water transport and thermal management within a pre-existing cell model.32 In their model, they ignore the side chain unzipping mechanism, which means that a constant conductivity of the PEM is assumed, and thus the effect of the degradation on the transport phenomena and the cell performance cannot be captured.
Additionally, some recent molecular dynamics (MD) works have been reported predicting that the presence of ferric ions may affect the intrinsic PEM proton transport properties.33
We reported the first models aiming at account for the instantaneous feedback between the PEM chemical degradation and the electrochemical and transport processes in a PEMFC.2,34–37 The approach behind these models treats PFSA PEMs with a structure influenced by humidification, which also impacts the local transport properties of mass and charge within the PEM. In order to study the PEM degradation, a multi-species transport model is used for protons, water, dissolved gases, radicals, and ions. This model includes detailed chemical reaction mechanisms of hydrogen peroxide formation, hydrogen peroxide decomposition, and radical attack of the PEM. A numerical feedback between degradation, mesostructure, and performance is established, allowing predicting the potential decay associated to the membrane degradation process. The mesostructural parameters considered are the PEM average porosity and tortuosity, evolving with the (degrading) side chains concentration. In our approach the effective porosity is defined macroscopically as the water volume fraction which is assumed to be
![Equation ([3])](https://content.cld.iop.org/journals/1945-7111/163/2/F59/revision1/d0003.gif)
where ε refers to the effective porosity (defined as the water volume fraction), λ to the water content (number of water molecules per sulfonic acid group),  to the partial molar volume fraction of PEM and
  to the partial molar volume fraction of water.
  is assumed to be related to the PEM equivalent weight through the expression
![Equation ([4])](https://content.cld.iop.org/journals/1945-7111/163/2/F59/revision1/d0004.gif)
where s is the swelling factor of the membrane and cside chains the concentration of side chains calculated through a kinetic degradation model. Then, the variation of the membrane conductivity with the effective porosity is calculated through the mean field expression proposed by Choi et al.38,39
![Equation ([5])](https://content.cld.iop.org/journals/1945-7111/163/2/F59/revision1/d0005.gif)
where the tortuosity toward the proton transport τ is function of the effective porosity through the Prager's model.34 Based on our previous approach, Wong and Kjeang recently reported continuum models predicting how the cell operation conditions impact the PEM degradation kinetics, albeit by disregarding the PEM degradation effects on potential decay.40,41 Similar remark can be done for a recent work on PEM Water Electrolyzers, also based on our approach.42
Despite the insights provided by these modeling efforts there is still a lack of modeling approach being able to investigate the influence of the chemical degradation kinetics on the meso/micro-structural properties of the PEM at the molecular level. As well, the retroactive impact of the PEM meso/microstructure evolution on the instantaneous performance and durability of a PEMFC as function of the applied operation conditions on the cell deserves further investigations.
At the meso/microsopic scale, interactions between molecular components control the processes of structural formation which lead to random phase-segregated morphologies in PEMs and CLs. Such complex processes can be studied by coarse-grained molecular dynamics (CGMD) simulations.43–45 Complex morphologies of the emerging media can be related to relevant effective properties that characterize transport and reaction, using concepts from the theory of random heterogeneous media. Finally, conditions for durable operation at the macroscopic device level can be defined and balance equations for involved species, i.e. electrons, protons, reactant gases and water, can be established on the basis of fundamental conservation relationships. Thereby full relations between structure, properties and performance could be established, which in turn would allow to predict architectures of materials and operating conditions that optimize fuel cell operation.
A significant number of mesoscale computational approaches have been employed to understand the phase-segregated morphology and transport properties of water-swollen Nafion membranes.46–49 Because of computational limitations, full atomistic models are not able to probe the random morphology of these systems. However, as demonstrated by these simulations and applications to other random composite media, mesoscale models are computationally feasible to capture the morphology. For Nafion, most of these simulations support the idea that narrow water-filled channels and irregularly shaped, nanometer-size clusters of ionic head groups and water forms the proton-conducting network that is embedded into the hydrophobic matrix.
In this paper we report a novel model to analyze PEM degradation and cell performance decay which combines a multi-paradigm, multi-scale cell model with a meso/microstructure resolved PEM degradation model based on CGMD databases. The technical feasibility of the combination between performance cell models and CGMD databases have been already demonstrated by us for describing carbon corrosion in PEMFC CLs.50 To the best of our knowledge, we report here the first modeling-based analysis of the PEM meso/microstructure upon its degradation and continuous feedback with the cell performance.
This paper is organized as following. First we present the adopted methodology from CGMD simulations and describe the performance modeling approaches. Then we present structural results and simulation results of performance decay for different simulated operation conditions. Thereafter we conclude and indicate further directions to continue this work.
Overall Methodology
The implemented overall methodology consists on achieving continuous numerical iterations between a performance model (Performance model section) and a PEM meso-structural database extracted from CGMD simulations (CGMD simulations section), as presented in Figure 2. At each numerical iteration, the performance model calculates the instantaneous cell performance and state variables such as the ionomer mass loss due to chemical degradation across the PEM. The performance model retrieves changes on the proton conductivity and the ratio of porosity (ε) over the tortuosity (τ) of the PEM hydrophilic channels from the CGMD-generated database. These structural changes are assumed to be mainly due to chemical degradation, thus, the performance model uses them to correct the mathematical expressions of the proton conductivity as well as diffusion of chemical species across the hydrophilic channels of the PEM following the look-up tables in Equations 6 and 7 here below:
![Equation ([6])](https://content.cld.iop.org/journals/1945-7111/163/2/F59/revision1/d0006.gif)
![Equation ([7])](https://content.cld.iop.org/journals/1945-7111/163/2/F59/revision1/d0007.gif)
with
![Equation ([8])](https://content.cld.iop.org/journals/1945-7111/163/2/F59/revision1/d0008.gif)
In return, the performance evolution of the cell and the structural evolution of the PEM are simultaneously simulated.
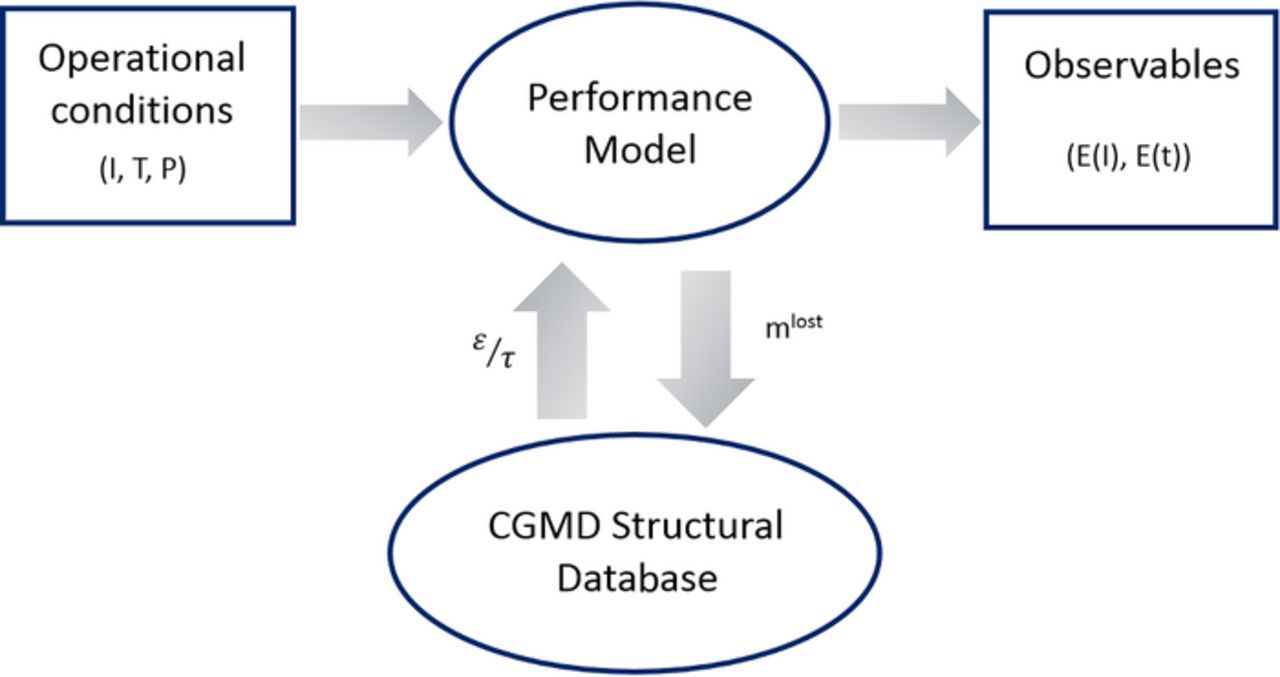
Figure 2. The numerical methodology implemented for the multi-paradigm combination of the multi-scale performance model with the CGMD generated data.
As discussed in Introduction section, the mechanism of the chemical attack of the polymer is very complex. It may involve both backbone and side-chain degradation and it is the subject of many debates. Here, we assume that only OH° radicals are the responsible agent of the chemical degradation, and that only the side chains are being attacked. This assumption is consistent with conclusions on modern Nafion obtained by Ghassemzadeh and Holdcroft on the basis of nuclear magnetic resonance (NMR) spectroscopy experiments.51 Indeed, according to the authors, modern Nafion (e.g. Nafion 211) is chemically stabilized for which the concentration of terminal carboxylic acid groups was decreased to negligible levels52,53 and thus the backbone remains unaffected by the OH° radicals.
CGMD simulations
The details of the computational approach based on CGMD simulations are explained elsewhere43–45,50 and is developed in two major steps. In the first step, Nafion chains, water and hydronium molecules are replaced by corresponding spherical beads with predefined sub-nanoscopic length scale. In the second step, parameters of renormalized interaction energies between the distinct beads are specified.
We consider four main types of spherical beads: polar, nonpolar, apolar, and charged beads.54 Clusters including a total of four water molecules or three water molecules plus a hydronium ion are represented by polar beads of radius 0.43 nm. The simulation box contained 72 coarse-grained Nafion chains each consisting of 20 monomers and 20 side chains. Each monomeric unit is represented by two apolar beads for backbone (red) and one single polar bead (green) for the entire sidechain (including etheric group) as depicted in Figure 1. We adopted the same coarse graining strategy as in our previous work44 which was also suggested earlier in Ref. 55. A side chain unit has a molecular volume of 0.306 nm, equivalent to the molecular volume of a four-monomeric unit of polytetrafluoroethylene (PTFE), of size 0.325 nm. Thus in our coarse-graining, a monomeric backbone unit, i.e.,–CF2–CF2–CF2–CF2–CF2–CF2–CF2–CF2–, is represented by two beads and a perfluorinated ether sulfonic sidechain is represented by one single bead. Our coarse-graining strategy requires all beads have identical volume set at 0.315 nm3. The selected box size does not impact the cell performance since the pore structure remains unchanged for box volumes larger than 50 × 50 × 50 nm3 and we do not expect significant changes in the O2 crossover or in the proton conductivity.
The interactions between non-bonded beads are modeled by the Lennard-Jones (LJ) potential
![Equation ([9])](https://content.cld.iop.org/journals/1945-7111/163/2/F59/revision1/d0009.gif)
where the effective bead diameter (rij) is 0.43 nm for side-chain, backbone and water beads. The strength of interaction (D0) is limited to five possible values ranging from weak (1.8 kJ/mol) to strong (5 kJ/mol) beads.54 The electrostatic interactions between charged beads are described by the Coulombic interaction
![Equation ([10])](https://content.cld.iop.org/journals/1945-7111/163/2/F59/revision1/d0010.gif)
with relative dielectric constant ɛr = 20 in order to include screening. The effect of solvent is incorporated by changing ɛr as well as by varying the degree of dissociation of Nafion side chains. Interactions between chemically bonded beads (in Nafion chains, for example) are modeled by harmonic potentials for the bond length and bond angle
![Equation ([11])](https://content.cld.iop.org/journals/1945-7111/163/2/F59/revision1/d0011.gif)
where the force constants are Kbond = 1250 kJ/mol.nm and Kangle = 25 kJ/mol.radian2 respectively. r0 and θ0 are the equilibrium bond length and angle. The size of the simulation box can vary from 50 × 50 × 50 nm3 to 500 × 500 × 500 nm3, depending on the system and the composition. We conducted an annealing procedure over a period of 50 ps by increasing the temperature from 298 to 398 K, followed by a short MD simulation for 50 ps in a NVT ensemble, followed by a cooling procedure down to 298 K.44 We did not observe any drift to a more ordered state after the equilibration procedure. For analysis purposes, however, final trajectories after full equilibration were used.
The degradation process is simulated as the following: first, the initial morphologies are generated using similar set of parameters and process that are explained elsewhere.44 In order to mimic the degradation process, Nafion sidechains are randomly detached at different percentage from the backbone under various water contents. In our simulations, the detached sidechains are assumed to remain in the water phase inside the Nafion pore as "dissolved" sulfonic anions, thus the system remains electro-neutral.
We have used several tools to calculate structural properties of the degraded membrane to investigate the impact of side chain losses on the microstructural properties of the membrane. These techniques include Radial Distribution Function (RDF), Pore Side Distribution, Cluster Size analysis, and Pore Network Analysis.43,44,50
Performance model
General framework
The performance model is a multi-paradigm multiscale single-cell model implemented within our in house simulation package MS LIBER-T (see Figure 3).56–58 This is a software coded in a modular framework on an independent C/Python language basis, highly flexible and portable with multiple application domains already demonstrated.59,60 Similar to the previous models developed by Franco et al., the single-cell PEMFC model in MS LIBER-T represents explicitly the physical mechanisms at different scales as nonlinear sub-models in interaction (modularity)61 and it is designed to calculate electrochemical signals (e.g. polarization curves, cell potential vs. time, etc.) from the chemical and structural properties of the materials.62–65
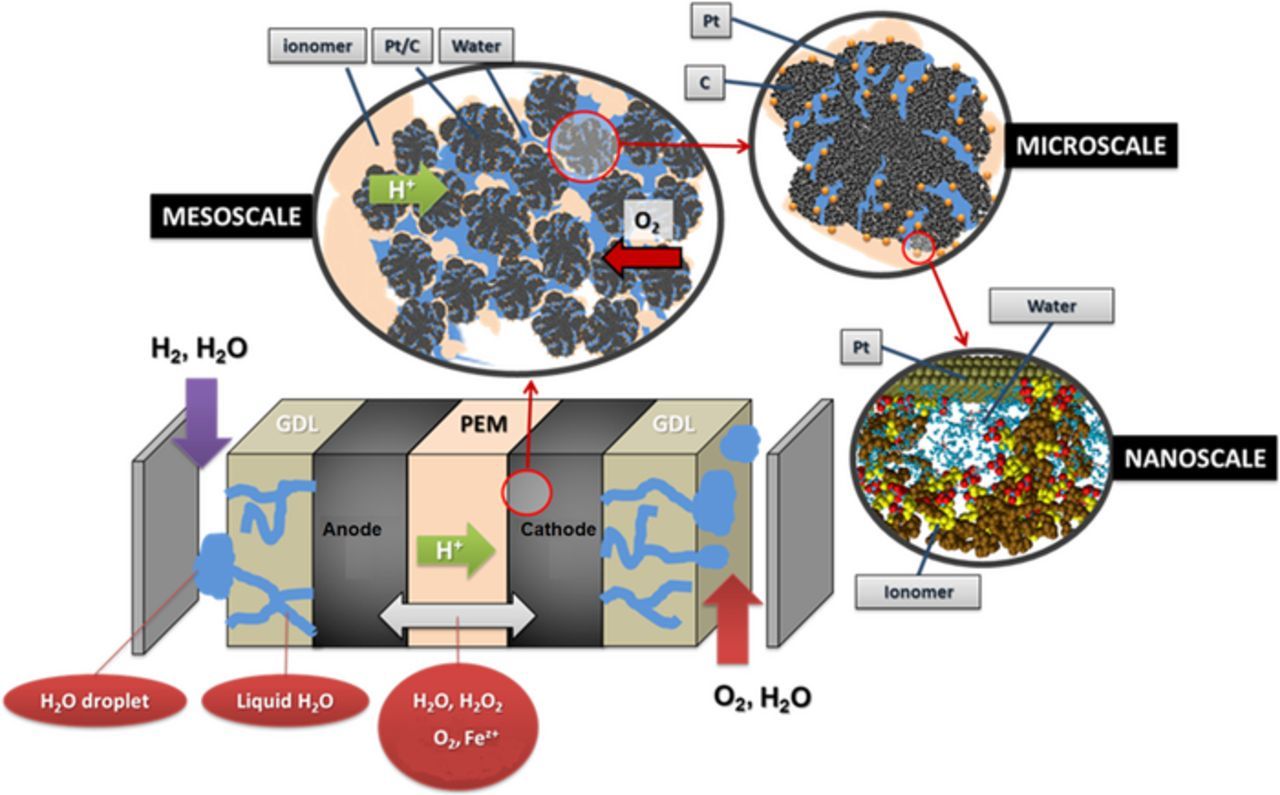
Figure 3. The schematics of the multiscale continuum performance model used in this paper.
For simplicity reasons, in this paper we restrict ourselves on the cell model based on the following overall assumptions:
- isothermal conditions;
- anode operating with water saturated H2 and cathode operating with water saturated O2. Under this assumption, the PEM hydration maintains at λ = 19. From this, only the CGMD database corresponding to this water content is used for the performance decay calculations shown in this paper. We underline that the model is general and other water contents and/or water content transients may be also studied, provided that H2O transport is resolved across the PEM.Indeed, the mechanisms described are
- H+ transport across the membrane electrodes assembly within a 1-D approach;
- e− transport across the CLs and gas diffusion layers within a 1-D approach;
- the presence of H2 and O2 in the on-catalyst ionomer film inside the CLs within the approach reported in Ref. 67. In the case of the anode, a 0D mass balance equation between the O2 crossover rate from the PEM to the anode and the O2 consumption rate on the catalyst, is solved to calculate the evolution of the resulting O2 concentration in the on-catalyst ionomer film (Figure 4b);
- the interfacial nanoscale electrochemical mechanisms at the vicinity of the catalyst including both elementary kinetics and electrochemical double layer effects within an on-the-fly coupled KMC/continuum approach.66,67 The impact of the surface roughness on the electrochemical double layer structure, as addressed in some publications,68,69 is not taken into account in the present model.
We use the version of our model which treats the elementary kinetic reactions in the CLs through the Kinetic Monte Carlo Electrochemical Variable Size Method (KMC E-VSSM) that we have introduced and discussed in Ref. 67 for the cathode CL. This approach resolves the adsorption/desorption, adspecies surface diffusion and reactions on the catalyst surface during the PEMFC operation, and allows calculating the electrodes and cell potential.
In general, the performance model can account for the complete cycle of the PEM chemical aging, i.e.: H2O2 formation in the anode from the O2 crossover from the cathode, H2O2 formation in the cathode through the ORR, the diffusion of H2O2 in the PEM and H2O2 decomposition into OH° and OOH° radicals in presence of Fe2+/Fe3+ Fenton's cations, the degradation removal of the side chains and the impact on the PEM proton conductivity and cell performance decay (Figure 4).
For demonstration purposes in this paper, the degradation kinetics is assumed to be of first order toward the OH° concentration, i.e.:
![Equation ([12])](https://content.cld.iop.org/journals/1945-7111/163/2/F59/revision1/d0012.gif)
where R and R' refers to the fresh and aged polymer respectively, SC refers to a single side chain and D to the detached side chain. The effect of hydroxide radical in the CGMD simulations is captured by presence of water and hydronium ion and therefore is not explicitly added to the CGMD simulations.
The model implements the CGMD database with spatially resolved 1D resolution across the PEM thickness. The PEM model, comprising the mathematical descriptions of the relevant transport and chemical reaction mechanisms described in the following sections, is coded in Python and coupled as an additional module in MS LIBER-T.
O2 transport model in the PEM
The transport of O2 is assumed to be simply governed by Fickean diffusion and it is spatially resolved in 1D through the PEM thickness (the H2 transport was neglected due to its high reactivity at the high potentials typically found in the cathode):
![Equation ([13])](https://content.cld.iop.org/journals/1945-7111/163/2/F59/revision1/d0013.gif)
H2O2 production models
The HOR in the anode is modeled in competition with a H2O2 production reaction through our KMC E-VSSM approach with DFT-calculated kinetic activation energies. The elementary reaction steps considered are detailed in Table I.62 Parameter values of the associated electrochemical double layer sub-model and of the surface diffusion processes are identical to the ones used in our previous work.67
Table I. Elementary kinetic model for the H2O2 production in the anode CL.
| Activation energies (kJ.mol−1) | ||
|---|---|---|
| Reaction | Eactf | Eactb |
 |
68 | ∞ |
 |
34 | 34 |
 |
53 | 53 |
 |
— | ∞ |
 |
41 | 39 |
 |
35 | 68 |
 |
19 | ∞ |
For the H2O2 production within the ORR pathway in the cathode CL, we have considered the elementary kinetic reaction in Table II, still within our KMC E-VSSM approach, with the same parameters values for the activation barriers, diffusion barriers and electrochemical double layer sub-model that in Ref. 67. The reaction steps and the activation barriers values were determined by DFT calculations carried out on Pt(111) surfaces.62,70 The modular character of the model allows considering here other DFT databases, with different H2O2 production rates, corresponding to Pt bimetallic catalysts. This will be the subject of a future publication.
Table II. Elementary kinetic model for the H2O2 production in the cathode CL.
| Activation energies (kJ.mol−1) | ||
|---|---|---|
| Reaction | Eactf | Eactb |
 |
— | ∞ |
 |
30 | 149 |
 |
38 | 43 |
 |
1 | 158 |
 |
88 | 94 |
 |
19 | 80 |
 |
24 | 47 |
 |
— | ∞ |
For the adsorption steps we follow the same approach as in our previous publication:67 according to the collision theory, the kinetic parameters are given by
![Equation ([14])](https://content.cld.iop.org/journals/1945-7111/163/2/F59/revision1/d0014.gif)
where P and m are the partial pressure at x = L (that can be related to the concentration of the dissolved reactant in the electrolyte) and the atomic mass of a reactant respectively. sc is the sticking coefficient estimated from published values.71,72 For the reaction steps, according to the extended transition state theory, the kinetic parameters are given by
![Equation ([15])](https://content.cld.iop.org/journals/1945-7111/163/2/F59/revision1/d0015.gif)
where kij and Eij,act are the kinetic rate constant and activation energy along the minimal energy path for going from state i to state j. The activation energies Eij,act are written as
![Equation ([16])](https://content.cld.iop.org/journals/1945-7111/163/2/F59/revision1/d0016.gif)
In Equation 16, f(σ) is the effect of the interfacial electric field, function of the catalyst charge density σ, onto the effective kinetics.62 This quantity together with the concentration of protons in the electrolyte at the vicinity of the reaction sites, is calculated by means of our non-equilibrium electrochemical double layer model in our work.66
The KMC E-VSSM allows then the calculation of the evolution of the adspecies coverage on the anode and cathode catalyst surfaces.
H2O2 and iron ions reaction-transport models
The transport of H2O2 and iron ions is assumed to be diffusive and they are spatially resolved in 1D through the PEM thickness from the solution of
![Equation ([17])](https://content.cld.iop.org/journals/1945-7111/163/2/F59/revision1/d0017.gif)
where the source/sink term is related to the Fenton reactions describing the H2O2 decomposition in OH°/OOH° in presence of the Fenton's cations. In this paper, for demonstration purposes, only the presence of Fe2+ and the Fenton reactions reported in Table III were considered.
Table III. Elementary kinetic model for the Fenton's reactions. The kinetic parameter values are from Ref. 34.
| Kinetic parameter (s−1) | ||
|---|---|---|
| Reaction | Kinetic rate | ki |
 |
 |
63.10−3 |
 |
 |
3.3.105 |
The concentration of the reaction intermediates, reactants and products are calculated from the mass balances:
![Equation ([18])](https://content.cld.iop.org/journals/1945-7111/163/2/F59/revision1/d0018.gif)
Membrane chemical aging model
The side chain concentration is resolved from the following balance equation:
![Equation ([19])](https://content.cld.iop.org/journals/1945-7111/163/2/F59/revision1/d0019.gif)
The bulk electrolyte potential at the cathode is given by
![Equation ([20])](https://content.cld.iop.org/journals/1945-7111/163/2/F59/revision1/d0020.gif)
where  is the effective proton conductivity calculated from the CGMD database following Equation 6.
Some of the parameters values used are reported in Table IV. The values of the parameters not reported here are the same as in our previous publications.62
Table IV. Parameters and numerical values.
| Parameter | Numerical value (units) | Source |
|---|---|---|
| Temperature (T) | 353 K | assumed |
| kDEG | 100 | Ref. 35 |
| Selectrode | 2.5 × 10⁻⁵ m2 | Ref. 8 |
| Fe2 +flux | 2.7 × 10⁻¹⁰ kmol/sec.m3 | assumed |
| γ (Figure 4b) | 10−5 | assumed |
 |
1 × 10⁻⁹ m/sec | assumed |
 |
4 × 10⁻⁸ m/sec | assumed |
| Membrane thickness | 2.5 × 10⁻⁵ m | assumed |
 (BOL) (BOL) |
2 × 10⁻⁴ S/m | assumed |
| λ | 15 | assumed |
Results
Membrane meso/microstructure
PEM simulations were performed with λ = 2, 4, 9, 15. The mesoscopic structure of the hydrated membrane at λ = 9 is visualized in Figure 5, revealing a sponge-like structure, similar to structures obtained by other meso-scale simulations.75,73 Water beads together with hydrophilic beads of sidechains form clusters, which are embedded in the hydrophobic phase of the backbones. The detailed structural analysis indicates that the hydrophilic subphase is composed of a three dimensional network of irregular channels. The typical channel sizes are from 1 nm, 2 nm, and 4 nm at λ = 2, 4, 9, 15. This corresponds roughly to linear microscopic swelling. The site-site radial distribution function (RDF), obtained from CGMD simulations, matches very well to those from the atomistic MD simulations.43 The RDF between the sidechain beads and the other components of the mixture show that side chains are surrounded with water and hydrated protons. The autocorrelation functions exhibit similar dependences on bead separation at all λ, indicating a strong clustering of sidechains due to the aggregation and folding of polymer backbones.74 The degree of ordering of water near polymer|water interfaces decreases with increasingλ.
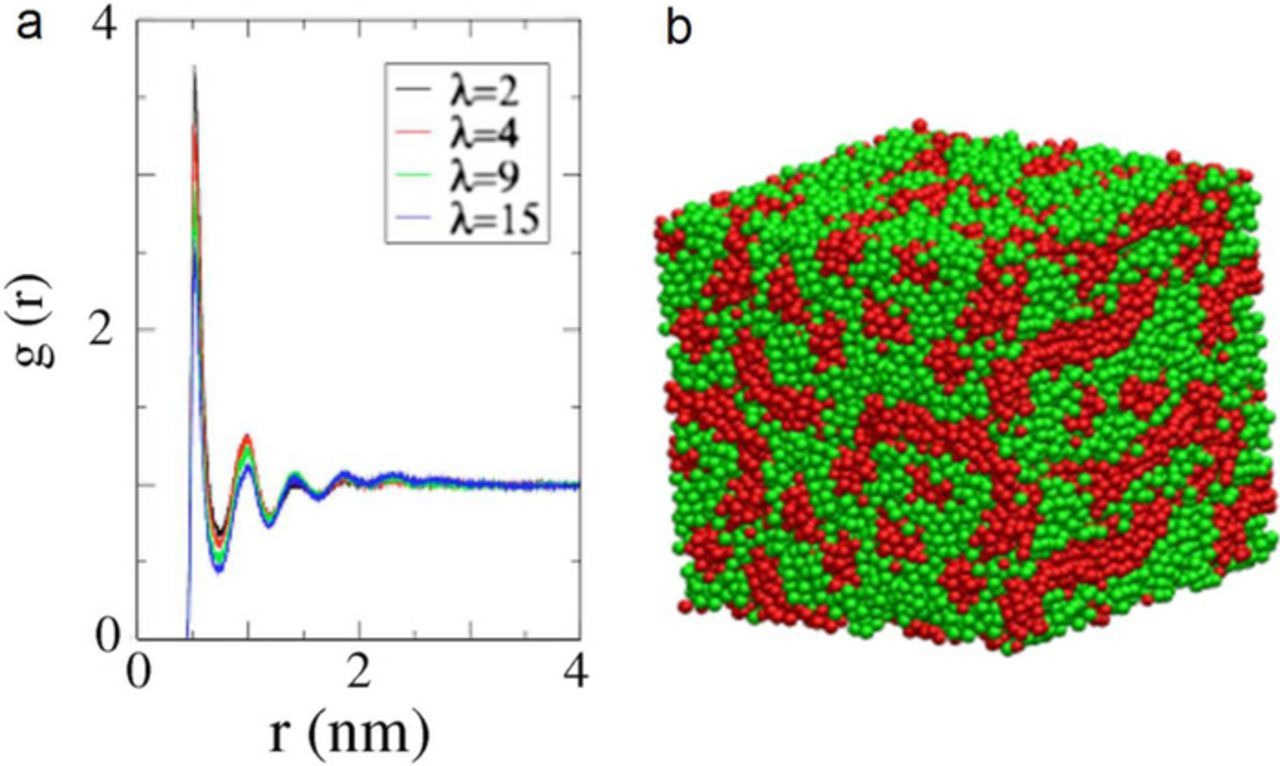
Figure 5. a) RDF elucidating the microphase separation of hydrophilic and hydrophobic domains in Nafion ionomer for side-chain and water;44 b) a snapshot of the final microstructure in hydrated Nafion ionomer at λ = 9, obtained from CGMD simulations and before detachment of sidechains. The hydrophilic domain (water, hydronium, Nafion sidechain) is shown in green and hydrophobic domain (Nafion backbone) is shown in red.
So far, coarse-grained approaches offer the most viable route to the molecular modeling of self-organization phenomena in hydrated ionomer membranes.
Admittedly, the coarse-grained treatment implies simplifications in structural representation and in interactions, which can be systematically improved with advanced force-matching procedures. Moreover, it allows simulating systems with sufficient size and sufficient statistical sampling. Structural correlations, thermodynamic properties, and transport parameters, can be studied.
Figure 6 illustrates tortuosity factor as a function of the sidechain loss (%). Tortuosity factor is defined as a ratio of the geometrical pore length and pore axis. The insert depicts average pore size in nm as function of the degradation at different water contentment (λ = 2, 4, 9, 15). The diameters of water channels vary in the range of 1–7 nm, exhibiting a roughly linear increase from low to high water content. The average separation of side chains increases as well with water content, which indicates a continuous structural reorganization of polymer aggregates upon water uptake.44 This could involve backbones sliding along each other in order to adopt more stretched conformations. The sidechain separation varies in a range of 1nm or slightly above. The network of aqueous domains exhibits a percolation threshold at a volume fraction of ∼10%, which is in line with the value determined from conductivity studies. This value is similar to the theoretical percolation threshold for bond percolation on an fcc lattice. It indicates a highly interconnected network of water nanochannels.
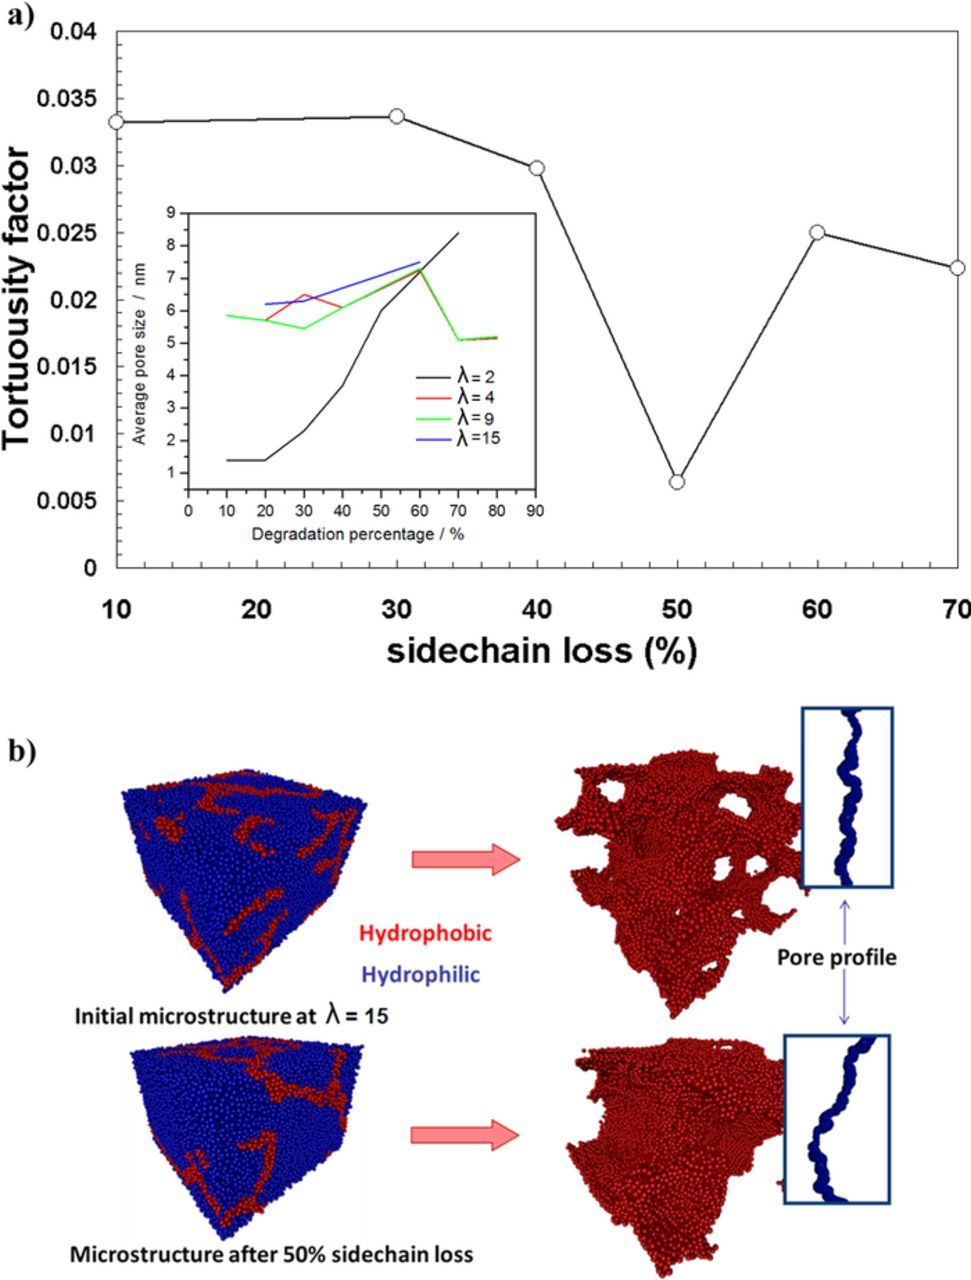
Figure 6. a) CGMD data analysis: tortuosity factor as a function of the sidechain loss (%). Small frame: average pore size in nm as function of the degradation percentage for different water contents (λ = 2, 4, 9 and 15); b) snapshots of calculated PEM mesostructures for two water contents.
In Figure 7a we can see the side chain separation (nm) as a function of the degree of side chain degradation (%) and water content (λ). Overall, by increasing the hydration level, side chains move apart, with their mean separation at Beginning Of Life (BOL) increasing from 0.92 nm at λ = 2 to 1.48 nm for λ = 15. Figure 7a also shows that by increasing degradation (percentage of side chains detached from backbone), side chain separation decreases. Side chain separations on a single ionomer chain are between 1.5–1.7 nm.75 Charge distribution and the magnitude of electrostatic interactions between side chains determine how ionomer backbones are assembled into fibrils or lamellae, where, the net density of side chains increases. Loss of sidechains reduces electrostatic hindrances between side chains on the surface of fibrils. The latter facilitates easier backbone folding, leading to lower side chain separations. Thus, the effective packing density of side chains due to better polymer degradation indicates that side separations and aggregate sizes decreases with side chain loss. We speculate that decrease in sizes of backbone aggregates corresponds to a decrease in electrostatic interaction between remaining side chains attached to the backbone, which causes increases in packing density of backbones,
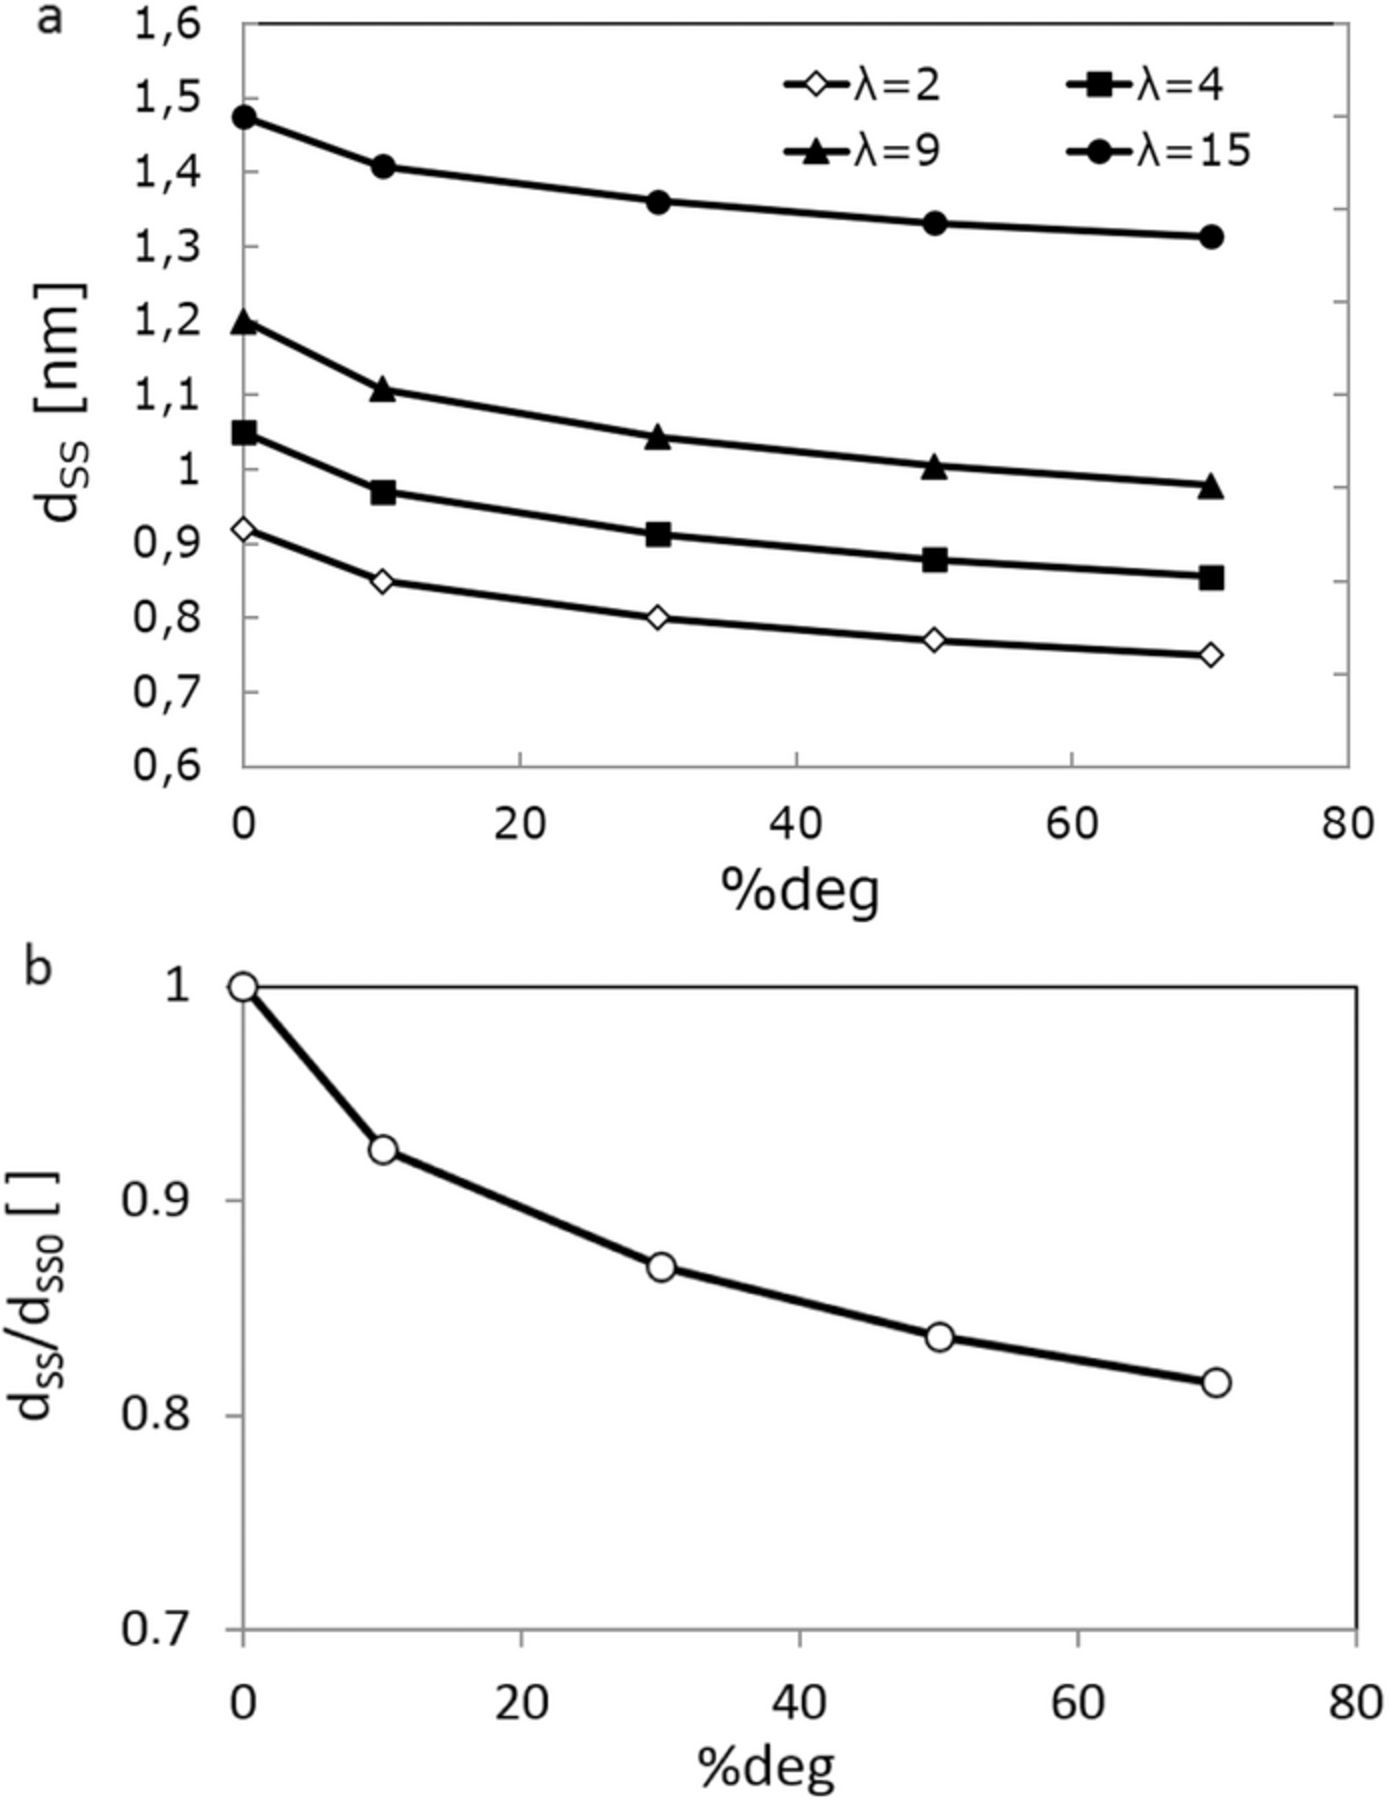
Figure 7. (a) side chain separation (nm) as a function of the degree of side chain degradation (%) and water content (λ). (b) normalized average of sidechain separation (dss) for λ = 9 with respect to that for the BOL membrane model where no sidechain losses are imposed (%deg = 0).
In Figure 7b we illustrate normalized average of sidechain separation (dss) for λ = 9 with respect to that for the Beginning of Life (BOL) membrane model where no sidechain losses are imposed (%deg = 0). Using a random-walk model for proton diffusion based on the Einstein-Smoluchowski equation39,76 one can estimate the relationship between proton conductivity, proton diffusivity and mean step distance,
![Equation ([21])](https://content.cld.iop.org/journals/1945-7111/163/2/F59/revision1/d0021.gif)
where z is a constant dependent upon the dimensionality of random walk (6 for three-dimensional walk), l is the mean step distance, i.e. side chain separations (dss) and τD is the mean time between successive steps. Notice that the above relationship does not necessarily mean protons transfer via a "hopping" Grotthuss mechanism39 and can similarly describe the vehicular mass diffusions. Overall, the normalized relationship between side chain separation and degradation of sidechains depicted in Figure 7b indicates that proton conductivity is declined by increasing sidechain losses in accordance to the above equation.
Performance decay
The CGMD-generated database has been used in the performance model following the algorithm presented in Overall methodology section.
We carried out four different simulation cases: OCV, 0.1, 0.3 and 0.5 A/cm2 applied current densities. For all the cases, the systems were initialized without considering the PEM degradation along the first 0.1 seconds of simulated time, until the steady state is reached: then the degradation process is "activated" by switching on a constant input flux of Fe2 + (10−14 kmol/m3.sec). As it is explained in Figure 4, the model allows capturing the HOR and ORR intermediates coverage evolution in both anode and cathode as well as other outputs (such as faradaic current, H2O2 production rate, ...) not shown here. The PEM simulation sub-model calculates the evolution of the porosity/tortuosity, the SO−3 concentration, conductivity and the associated electrostatic potential evolution across the PEM along the simulation by help of Equation 20.
In Figure 8a, we report the calculated SO−3 concentration evolution in time for the four cases investigated. The initial SO−3 concentration was assumed to be 1.2 kmol/m3 for all the cases. In all the curves in Figure 8a the concentration decays in time with an overall rate which depends on the value of the applied current density. Indeed, the SO3− degradation rate increases as the applied current density decreases, which is in agreement with the experimental knowledge. This trend is because of the faradaic current present in the anode, and thus the HOR overall rate (in spite of the H2O2 formation), increases with the imposed total current density as the faradaic current evolves to balance it. Briefly, the less H2O2 is formed in the anode, the less SO−3 is degradated.
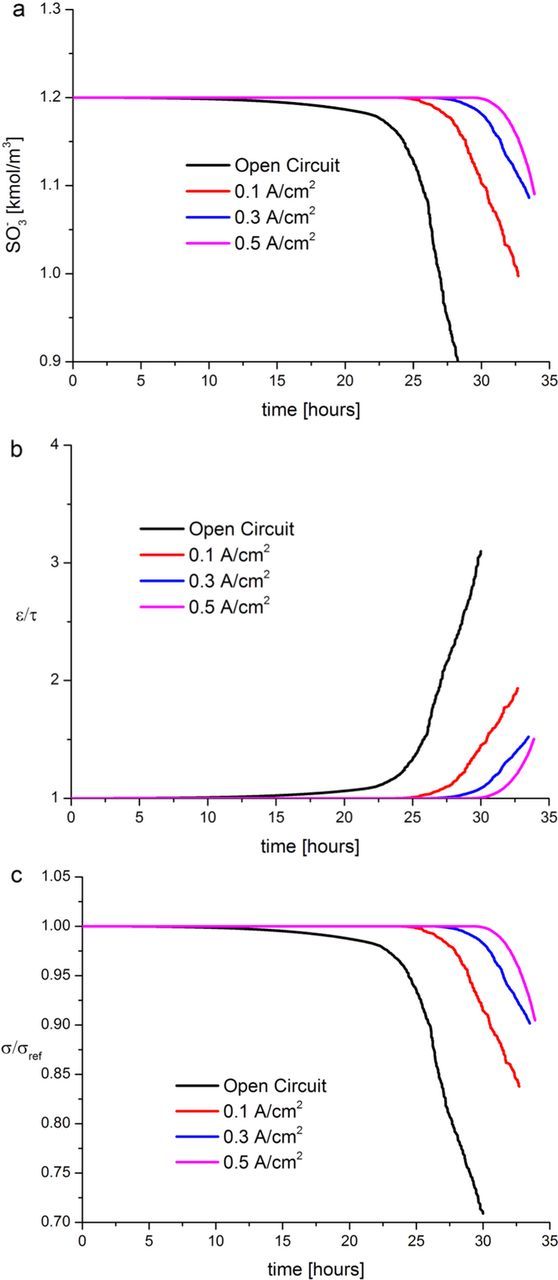
Figure 8. (a) Calculated evolution of the SO−3 concentration in the PEM at OCV, 0.1, 0.3 and 0.5 A/cm2 current densities; (b) associated calculated evolution of porosity/tortuosity (normalized in 1 at t = 0 sec.); (c) associated relative conductivity evolution (normalized in 1 at t = 0 sec.).
In Figure 8b we report the corresponding normalized  evolutions for all the cases under investigation. The SO−3 consumption generates a decrease on the tortuosity (τ) (see Figure 6) and an increase on the porosity (ε). As one can see, under OCV conditions, this factor varies from 1 to ∼3 after 24 hours of simulated time which is in agreement with the experimental known fact that OCV conditions are the most damageable for the PEM.
In Figure 8c, the PEM normalized conductivity evolution on time is shown, with a trend which correlates with the increase on the  factor and the loss of SO−3.
We underline that, according to our model, the increase over time of the  factor during the PEM degradation, leads to a monotonous increase of the effective O2 diffusion coefficient. The resulting increase of the O2 crossover leads to the increase of the O2 adsorption and consequent O formation in the anode catalyst which favors the ORR and the H2O production. In Figure 9 we present, as an example, the evolution of the adspecies coverage on the anode catalyst under OCV conditions. During the first ∼25 hours of simulated operation, the HOR governs the anode operation with a high coverage of H (∼0.5 ML) and other species such as H2 (∼0.2 ML) and H2O2 (∼0.05 ML). Later, once the O2 crossover becomes sufficiently high, the anode becomes "cathodized" depleting the overall cell potential. This process is self-maintained because of the retro-feedback with the O2 crossover: in other words, the more H2O2 is produced, the more sidechain loss is induced and finally the more O2 crossover results, leading again to more H2O2 production and so on. Not surprisingly, in Figure 10, we can observe that the PEM degradation does not affect the calculated ORR adspecies coverage for the cathode under OCV conditions.
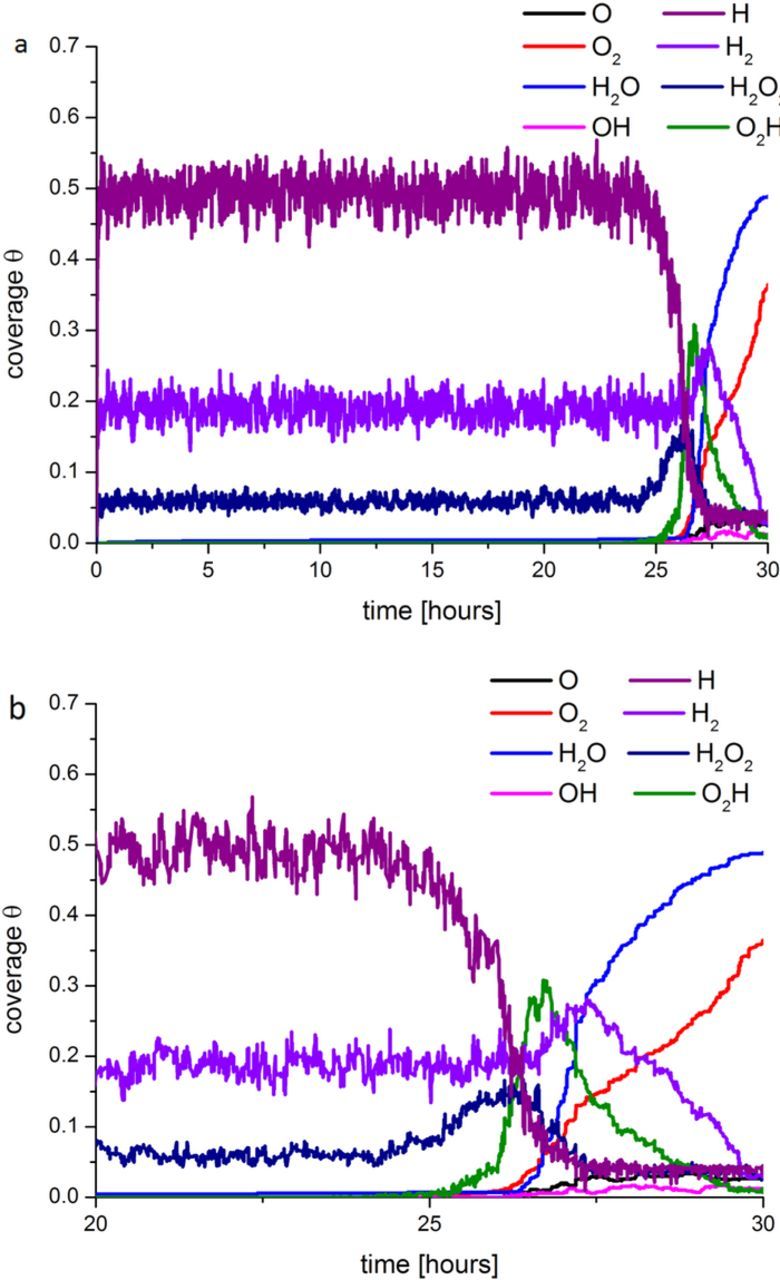
Figure 9. Anode surface coverage evolution under OCV conditions for time intervals between 0 and 30 hours (a) and from 20 to 30 hours (b).

Figure 10. Cathode surface coverage evolution under OCV conditions for a simulated operation time interval between 0 and 30 hours.
In Figure 11, we report the cathode ORR coverage evolution for the case of an applied current density of 0.5 A/cm2. As it was previously predicted67 the H2O is the dominant adspecie (with an initial coverage value of ∼0.6 ML for H2O, 0.3 ML for O2 and 0.03 ML for O). The PEM degradation process at non-zero current leads to the cathode coverage evolution. Indeed, the cathode responds by increasing the water production as a consequence of the electrostatic potential decrease over time through the PEM (conductivity depletion).

Figure 11. Cathode surface coverage evolution at 0.5 A/cm2 applied current density for a simulated operation time interval between 0 and 35 hours.
In Figure 12, two different simulated time ranges are presented for the HOR coverage evolution in the anode at 0.5 A/cm2. As one can see around ∼33 hours, the anode starts to generate more H2O, O2H and OH, which leads to the cathode potential (the cell potential) decrease over time (Figure 13). This occurs because at ∼33 hours the porosity/tortuosity factor suddenly starts to increase (see Figure 8b), affecting the effective O2 diffusion coefficient and favoring an undesired ORR in the anode side.
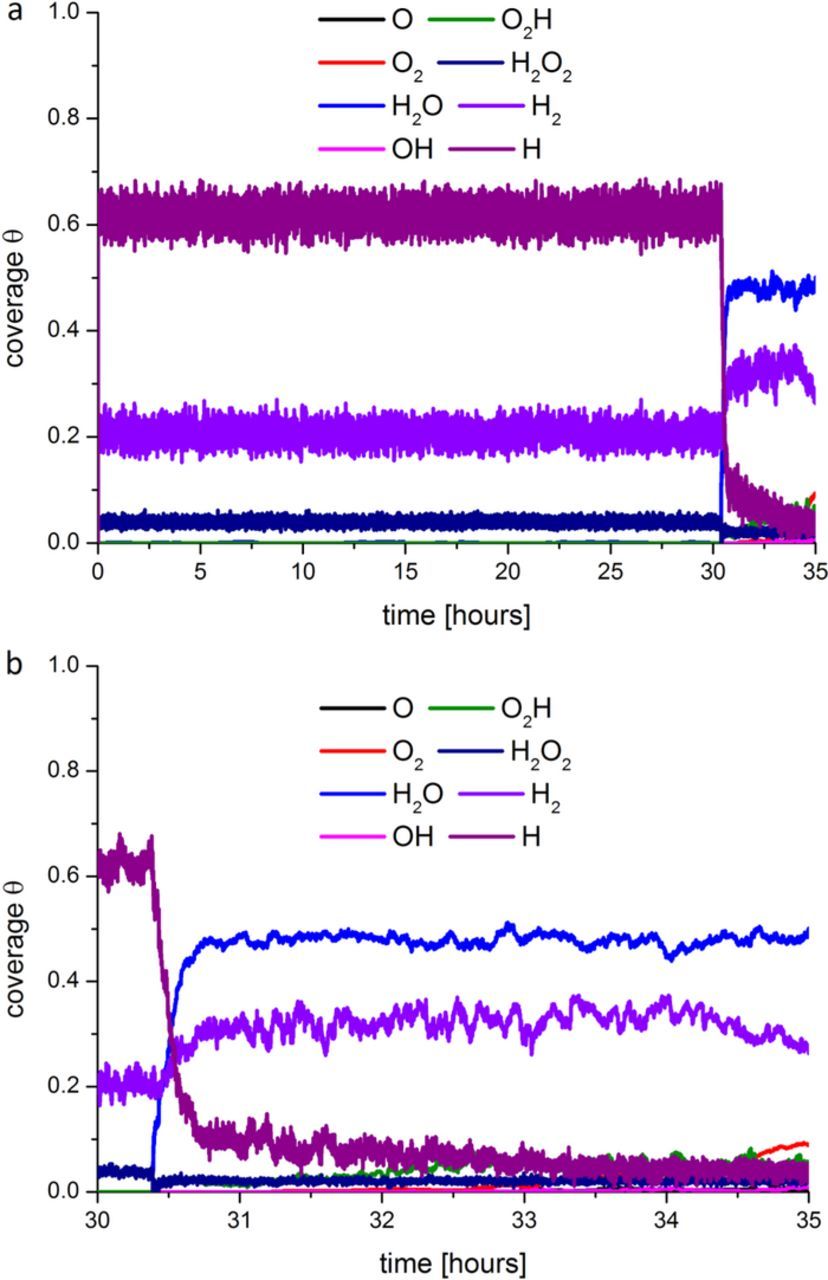
Figure 12. Anode surface coverage evolution at 0.5 A/cm2 applied current density for simulated operation time intervals between 0 and 35 hours (a) and from 30 to 35 hours (b).
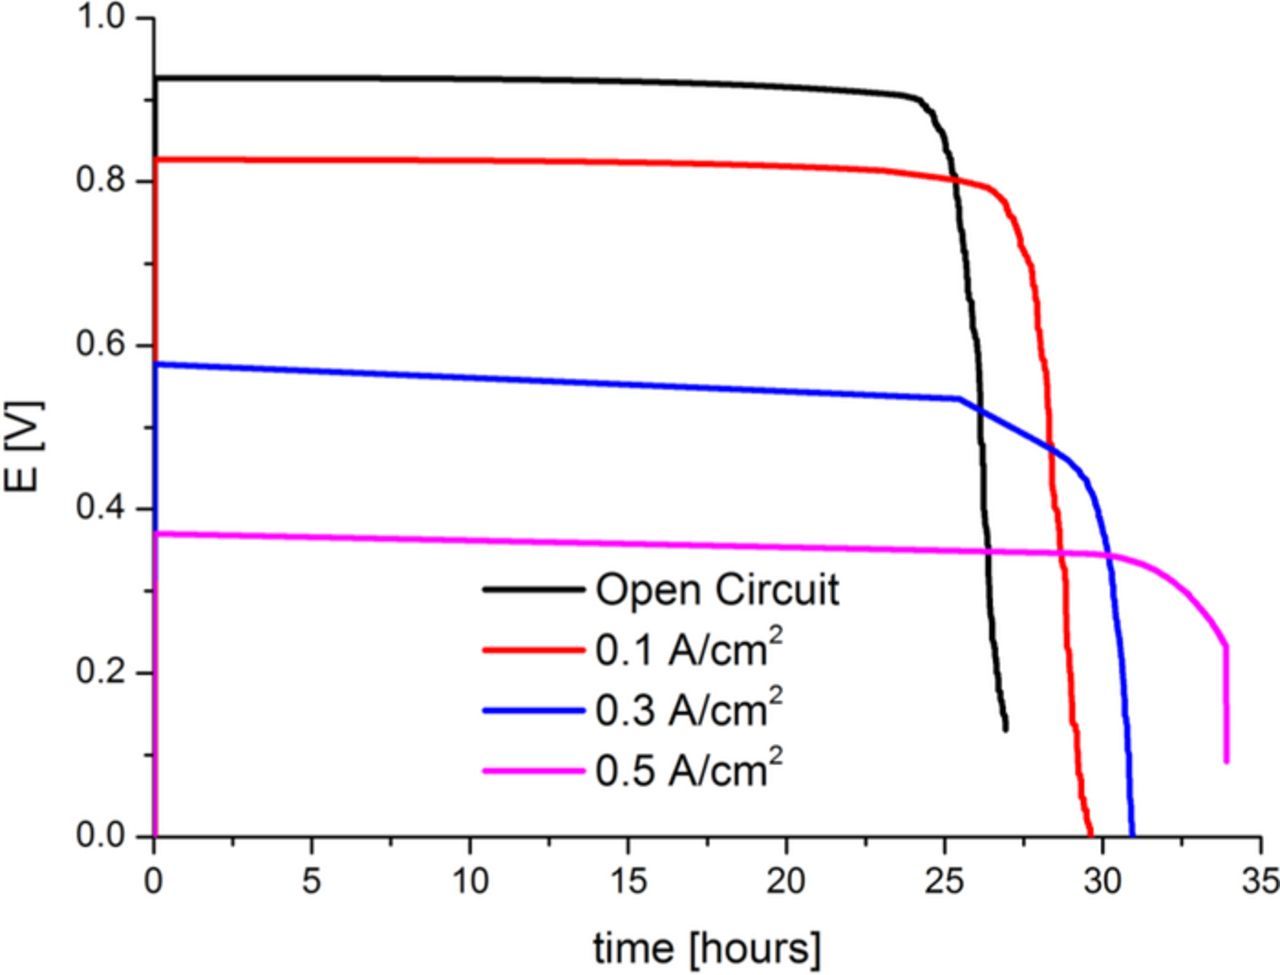
Figure 13. Calculated potential evolution at OCV, 0.1, 0.3 and 0.5 A/cm2 imposed current densities.
In Figure 13 we summarize the cell potential evolution for the four studied cases. As known from experimental knowledge, under the assumption that PEM aging is the only degradation mechanism involved, the cell performance degradation rate increases as the applied current density decreases. For the three cases where the applied current density is non-zero, the potential decay clearly splits into two regions: first a region until ∼25 hours where the cell potential decays roughly linearly; then a second region where the cell potential decays in a non-linear fashion. According to our model, at non-zero applied current densities, the first region is governed by the conductivity decrease due to the decrease in the side chain separation (see Figure 7 and Equations 20 and 21); and the cell potential decay in the second region is due to the drastic O2 crossover increase. At OCV conditions, the overall potential decay is related to the O2 crossover increase.
Conclusions
In this paper, we have presented a multiscale mesostructurally resolved model allowing predicting the PEM chemically induced aging upon the PEMFC operation conditions. The model is able to simulate both PEM structural changes and performance evolution simultaneously on the basis of a numerical feedback between a performance model and a structural database calculated by CGMD for different aging stages. Calculated trends of the degradation rates and associated performance decays are in good agreement with experimental knowledge.
We believe that this model provides an innovative framework on several aspects:
- the coupling between hybrid KMC/PDE models, describing electrochemistry and transport mechanisms in both anode and cathode, and the (CGMD-based) micro-structurally resolved continuum model describing PEM degradation, proton and oxygen transport. The implementation of the KMC approach allows us to introduce fully atomistically-resolved electrochemical models at the cell level. This provides new capabilities for the simulation of detailed electrochemistry and degradation kinetics in comparison with previous Mean Field/continuum coupled approaches where the lateral interaction and the surface diffusion of adspecies on the catalyst surface cannot be addressed. We underline that degradation processes due to hydrogen peroxide formation strongly depends on the surface diffusion of ORR species in the anode side;
- the CGMD microstructural and degradation database is by itself original, as well as its implementation into the transport/degradation;
- it permits the prediction of the cell durability (i.e. prediction of potential evolution at fixed current) in relation to membrane degradation which is clearly different from previous membrane degradation modeling efforts in literature. In those studies, potential is an input parameter and thus its evolution cannot be calculated independently.
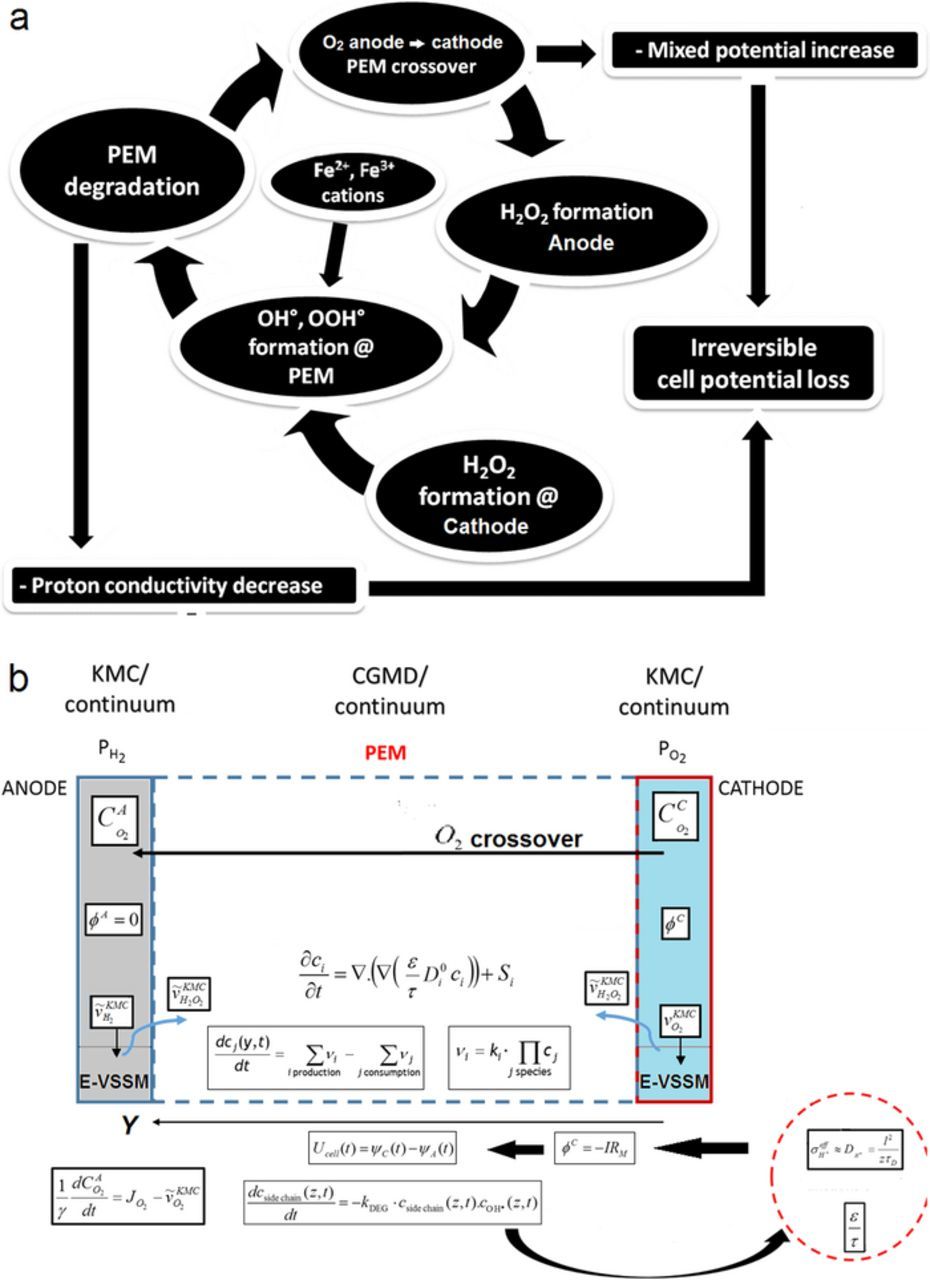
Figure 4. a) Scheme of the complete cycle of PEM chemical aging accounted in our model; b) scheme represented within the cell model.
The multiparadigm character of our approach, combining simultaneously CGMD, KMC and continuum modeling, provides insights simultaneously at the atomistic, mesoscopic and macroscopic levels: we are convinced that this provides a powerful tool to the design of more efficient and stable PEMFC materials and/or for the optimization of the operation conditions for enhanced performance and durability.
Incoming work includes the coupling of this multiscale modeling framework with structurally-resolved descriptions of other degradation phenomena (such as carbon corrosion and catalyst degradation) to analyze their competitions, their synergies and their impact on the overall PEMFC performance. Possible future work includes extending this approach to other types of polymers, as well as exploring mechanical degradation aspects.
Acknowledgments
The authors gratefully acknowledge the Erasmus Mundus Master of Materials for Energy Storage and Conversion (MESC) award for funding the scientific visit of K.M. at LRCS during the periods December 2013-January 2014 and July 2014. M.Q. and A.A.F. deeply acknowledge the funding by the European Project PUMA MIND, under the contract 303419. Prof. Christian Masquelier and Dr. Mathieu Morcrette (LRCS) are also deeply acknowledged for their support.