
Abstract
Na-ion batteries have regained attention because they offer sustainability advantages over the Li-ion technology, hence their interest for massive electrochemical storage. Although the Na-ion electrochemistry is analogous to that of the Li-ion concept, there are a few notable differences such as the stability of carbonated-based electrolytes toward the Li or Na metal anodes. Herein we report on the positive effect of FEC as electrolyte additive on the efficiency of Na-half cells which unfortunately comes with a side effect involving the sudden onset of polarization during discharge at unpredictable capacity values. We show that these anomalies, associated to an inefficient plating-stripping at the sodium metal anode, do not appear in full Na-ion cells. Therefore, FEC-based electrolytes are not the panacea and alternative additives must be sought to enable building of reliable half cells with metal anodes.
Export citation and abstract BibTeX RIS

This is an open access article distributed under the terms of the Creative Commons Attribution Non-Commercial No Derivatives 4.0 License (CC BY-NC-ND, http://creativecommons.org/licenses/by-nc-nd/4.0/), which permits non-commercial reuse, distribution, and reproduction in any medium, provided the original work is not changed in any way and is properly cited. For permission for commercial reuse, please email: oa@electrochem.org.
After years of shy consideration, Na-ion batteries are currently attracting increasing attention as alternative to Li-ion batteries. Their long-sight interest resides in the absence of lithium, for which the global amount and localization of the sources brings concern in a context where electric vehicles and grid storage have to be massively developed. On a shorter time scale, Na-ion batteries benefit from the lower cost of the Na-based precursors and the possible use of Al instead of Cu as anode current collector.
Today, steady progress in Na-ion batteries is being achieved.1 The technology being similar in its principle to Li-ion batteries, its development massively benefits from the knowledge accumulated with the latter. However, significant differences between Li- and Na-based systems2 prevent direct transposition of all the chemical tricks/techniques commonly used for lithium. Just like for their Li-based counterpart, the development of Na-ion battery systems requires a reliable setup to test each electrode material independently prior to the assembly of full cells. While metallic Li is a stable counter-electrode acting as reference to survey Li-ion active materials in a two-electrode cell, concerns have risen regarding the suitability of Na anodes.3,4 Indeed they show much higher impedance than Li in conventional carbonate-based electrolytes and a non stable SEI.
FluoroEthylene Carbonate, FEC, has been a popular electrolyte additive in Na-ion batteries after it was shown that it can improve the efficiency and stability of half cells5 while introducing anomalies in the voltage curve which have been so far unexplained. As a film-forming additive,6 it was proposed that its beneficial effect was due to the formation of a more stable SEI on hard carbon. However, in the case of some hard C electrodes, the performance and cyclability were actually lower in half-cells with FEC than without additive.7 FEC also induces electrochemical features in a 2-electrode measurement vs. Na, namely the presence of a voltage drop in the reduction sweep as can be seen in several plots in the literature.5,8–11 In this work, we show that this voltage drop is associated with the sudden appearance of a kinetic limitation of stripping at the counter electrode and propose a model to explain this finding.
Experimental
GC/FTIR
All analyses were performed using a trace GC ultra gas chromatograph (Thermo Scientific). The gases to be analyzed were transferred into the split/splitless injector maintained at 200°C. The chromatographic separation was performed on a "HP-PLOT/Q" polystyrene-divinylbenzene-based capillary column (30 m × 0.32 mm i.d., 20 μm) from Agilent J & W Technologies followed by a post capillary column "Rtx-1" (15 m × 0.25 mm i.d., 0.25 μm, 100% dimethyl polysiloxane) from Restek. Helium was used as the GC carrier gas and maintained at a constant flow rate of 1.3 mL/min. To achieve good chromatographic peak resolution, the programmable temperature gradient was optimized from 40° to 250°C as follows: the capillary column was ramped from an initial temperature of 40°C, held for 6 min, increased at 10°C/min up to 90°C, increased at 5°C/min up to 190°C, held for 5 min and finally increased at 10°C/min up to 250°C where it was held for 10 min. The total duration of GC analysis was 52 min. The GC was interfaced with a light-pipe GC/FTIR system (Thermo) and connected to a FTIR system Nicolet 6700 with a mid-infrared source and a medium band liquid nitrogen cooled mercury cadmium telluride (MCT) detector. Transfer line and light-pipe temperatures were kept constant 200°C during the analysis. Real time spectra were recorded by addition of 16 scans, with a spectral resolution of 4 cm−1 and 32 background scans. The scan range was from 4000 to 650 cm−1. Aldrich vapor phase FTIR library was used to identify the bands appearing in the infra-red spectra.
GC/MS
All analyses were performed using a trace 1300 serie GC ultra gas chromatograph (Thermo Scientific). The chromatographic separation was performed on a "BPX70" cyanopropyl polysilene-siloxane based capillary column (30 m × 0.25 mm i.d., 0.25 μm) from SGE. The same GC carrier gas as above was used (He, 1.3 mL/min). The programmable temperature gradient was optimized as follows: the capillary column was ramped from the initial temperature of 40°C, held for 5 min and finally increased at 10°C/min up to 250°C where it was held for 10 min. The total duration of GC analysis was 36 min. The GC was interfaced with an ISQ mass spectrometer (Thermo Scientific). The transfer line was maintained at 250°C. The ion source was set at 200°C. Tuning of the mass spectrometer was done automatically using the ions resulting from perfluorotributylamine ionization. The mass spectrometer was operated with a filament current of 250 μA and electron energy of 70 eV in the electron ionization (EI) mode. The mass range was 10–300 u and data acquisition and processing were performed with Xcalibur 2.0.7 software. Compound identification and assignment of corresponding structural formulae were carried out using the National Institutes of Standards (NIST) library.
Gas pressure monitoring
Rates of gas emission were measured by monitoring the pressure in Swagelok cells equipped with pressure sensors.12 For this experiment, metallic sodium was spread at the center of a 0.8 cm2 stainless steel disk via a glass tube separated from the Na shunk by a Mylar foil to create smooth, flat and shiny surfaces. A mask consisting of a second piece of Mylar with a circular 0.5 cm2 hole was used to obtain reproducible areas. The plunger bearing the Na metal was introduced into the cell together with 250 μL electrolyte and the pressure evolution was monitored in absence of applied current.
Electrochemical measurements
The experimental setup for symmetric Na/Na cell assembly and testing is described elsewhere.3 Briefly, sodium metal (Aldrich, 99.95%) electrodes were used as counter, reference and also as working electrode and the electrolyte used was 1 M NaPF6 salt (either Aldrich or Stella Chemifa) dissolved in a mixture of ethylene carbonate (EC), and dimethyl carbonate (DMC), Aldrich > 99%. Impedance measurements were carried out at room temperature between 200 kHz and 10 mHz with a 10 mV amplitude signal, using a Biologic MPG2. Data exploitation was done using Octave software and the results reproduced at least two times prior to be reported.
Two electrodes Na/Na3V2(PO4)2F3 (NVPF), Na/hard C cells together with 3-electrode Na/Na/NVPF cells were assembled using i) one cm diameter positive electrodes punched out of tapes laminated on Al current collectors with typical loadings of 10.2 and 4.8 mg/cm2 for NVPF and hard C, respectively and ii) negative electrodes consisting of 1 cm diameter Na disk laminated on a stainless steel current collector as described above (glass tube + Mylar foil). Within the 2-electrode and 3-electrode configuration, the positive and negative electrodes were separated by a single layer and three layers of glass fibre separator (Whatman GF/D, 675 μm), loaded with 150 and 450 μL of electrolyte, respectively. The electrolyte was dried with molecular sieves to obtain a water content, <10 ppm and electrolytes containing 3 or 1% of FEC by weight were used for 2 and 3 electrode cells, respectively so as to maintain the amount of FEC per active material constant in both cells. Lastly, the cells were tested galvanostatically at C/10 using either VMP3 or MPG2 multi-channel potentiostats (BioLogic). The corresponding current densities were all in the range of 130 ± 15 μA cm−2.
Results and Discussion
The unstability of the native SEI on sodium anodes, that can easily be detected by following its resistivity upon time, as reported in our previous study,3 casts some concerns on the reliability of half cell testing protocols to evaluate electrochemical performance of new electrode materials. Thus, and in view of reports discussing a possible beneficial effect of FEC in that respect,5 we decided to assess the effect, if any, of FEC addition on the stability of the SEI on sodium metal. Na/Na symmetric cells were left at open circuit voltage (OCV) for 290 h and their impedances were measured every two hours. Selected Nyquist plots are displayed in Figure 1. Depressed semicircles in the high frequency region can be seen in all cases with the interfacial resistance being strongly dependent on the presence of FEC (see Figure 1). Indeed, much lower values were recorded for 1 M NaPF6 in EC0.5:DMC0.5 (∼200 Ω cm2) than for the same electrolyte containing 3 wt% of FEC (∼4000 Ω cm2). This interfacial resistance was also found to significantly increase upon time when the electrolyte contained FEC, reaching approximately 10 kΩ cm2 after 290 h. Those results demonstrate that the presence of FEC in the electrolyte has a strong detrimental effect on the Na metal electrode impedance. A direct consequence of this finding is the appearance of larger and unstable overpotentials for Na plating or stripping upon galvanostatic cycling in electrolyte containing FEC, as will be discussed below (Figure 1c).
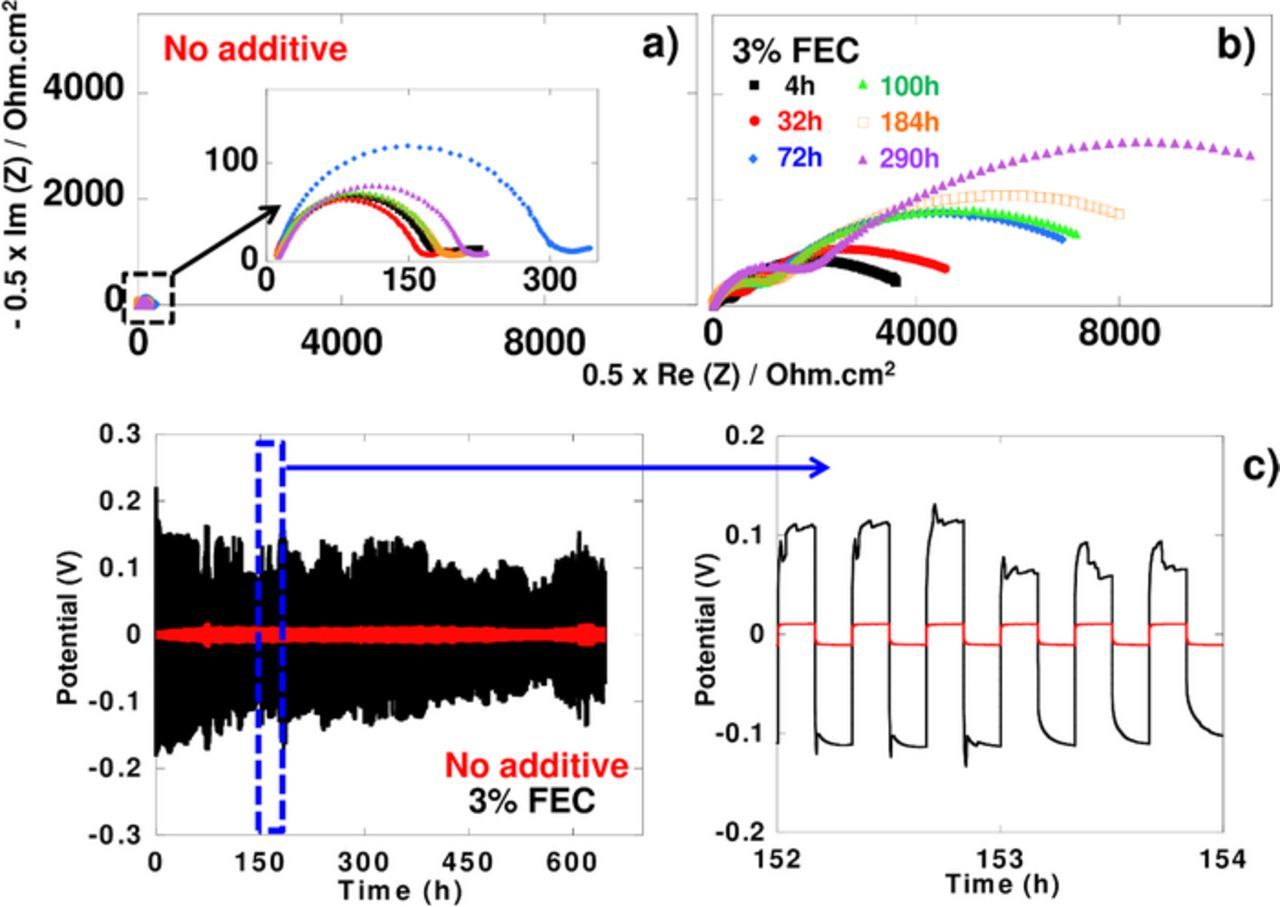
Figure 1. a) and b) Nyquist diagrams of impedance measurements of symmetric Na/Na cells upon various OCV periods of time at 25°C in 1 M NaPF6 in EC0.5DMC0.5 with (a) or without (b) 3wt.% FEC. c) Charge/discharge curves of symmetric Na/Na cells cycled at 25°C and 50 μA cm−2.
In order to comparatively assess the stability of the native SEI formed on sodium metal anodes in presence and absence of FEC a very simple experiment was carried out. It consists of immersing identical Na metal disks (Ø = 0.7 cm, thickness = 1 mm) in two separated sealed vessels containing 250 μl of EC-DMC (1-1 w/w)-NaPF6 1 M with either no or 3% of FEC. The gases formed were sampled after 5 days (enough time to form the SEI) and 48 days and analyzed by GC/FTIR while the liquid electrolyte was analyzed after 48 days by GC/MS.
After 5 days, (Fig. 2a) CO2 and CO are clearly detected in the gases evolved from the FEC-free electrolyte and a big peak corresponding to DMC was detected, in agreement with its lower boiling point (90°C). We believe that the reduction of carbonate functions pertaining to EC and DMC are responsible for the formation of such gases without being able to distinguish which of the carbonates is the most influencing. After 48 days (Fig. 2b) the amount of evolved CO2 and CO are clearly larger and additional peaks corresponding to methane (CH4) and ethylene (C2H4) appear, products that are well known to be formed from the reduction of DMC and EC respectively.13 These results indicate that electrolyte solvent reduction is continuous between 5 and 48 days implying the formation of an SEI which is not fully protecting the sodium surface. This is consistent with the results of the liquid phase analysis (Fig. 3a) after 48 days, as the presence of a strong peak corresponding to dimethyl 2,5-dioxahexane dicarboxylate (DMDOHC) is observed, due to the reduction of the solvent. Most likely, the reduction of DMC leads to the formation of sodium methoxide (MeONa), which further reacts with EC to form DMDOHC, in a similar way to the mechanism evidenced in lithium-based electrolyte.14 Accordingly, this mechanism leads to the formation and growth of different types of oligomer series having the general formulae CH3OCO2[(CH2)2OCOO]n(CH2)2OCO2CH3 and R2O(CH2CH2O)nR1, with R1 and R2 being either CO2CH3, CH3 or H.
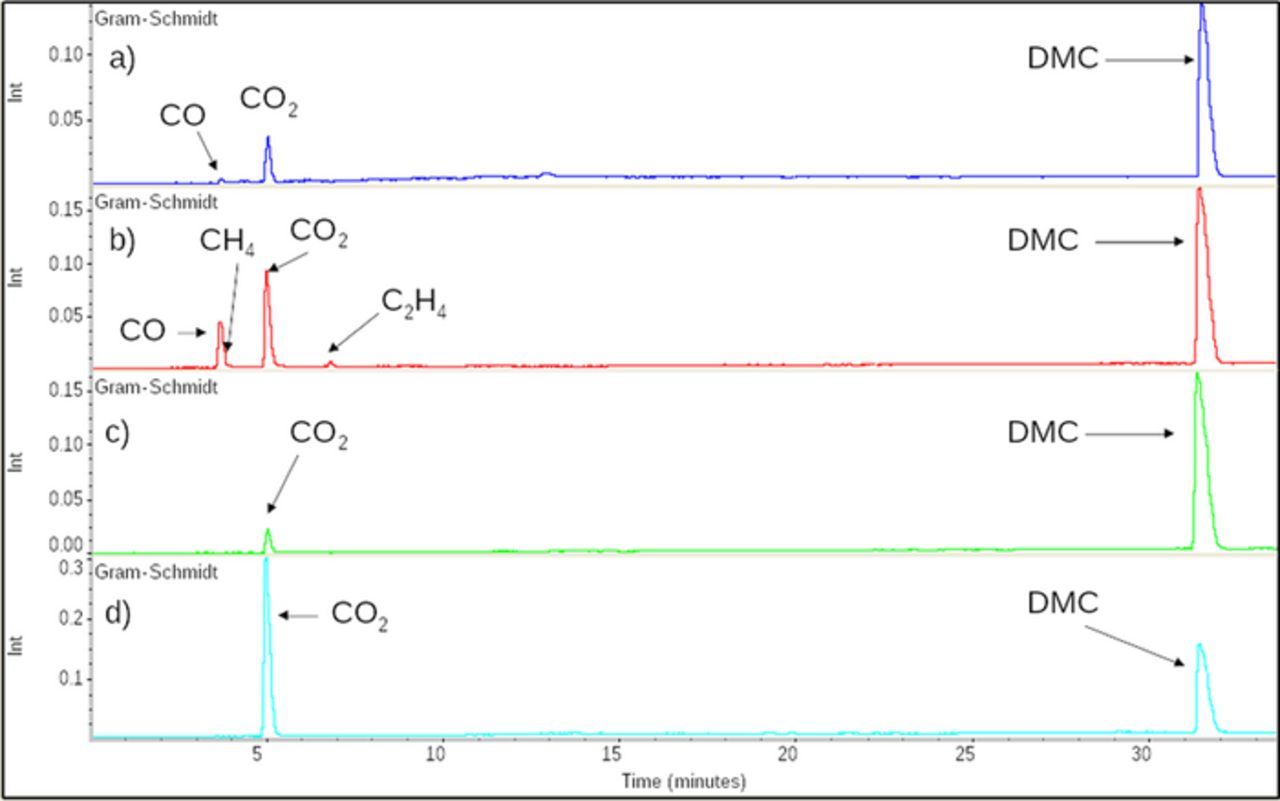
Figure 2. GC/FTIR Gram-Schmidt of gas from reaction between Na metal and EC-DMC (1-1 w/w)-NaPF6 1 M, without FEC a) after 5 days, b) after 48 days, with 3% of FEC c) after 5 days, d) after 48 days.
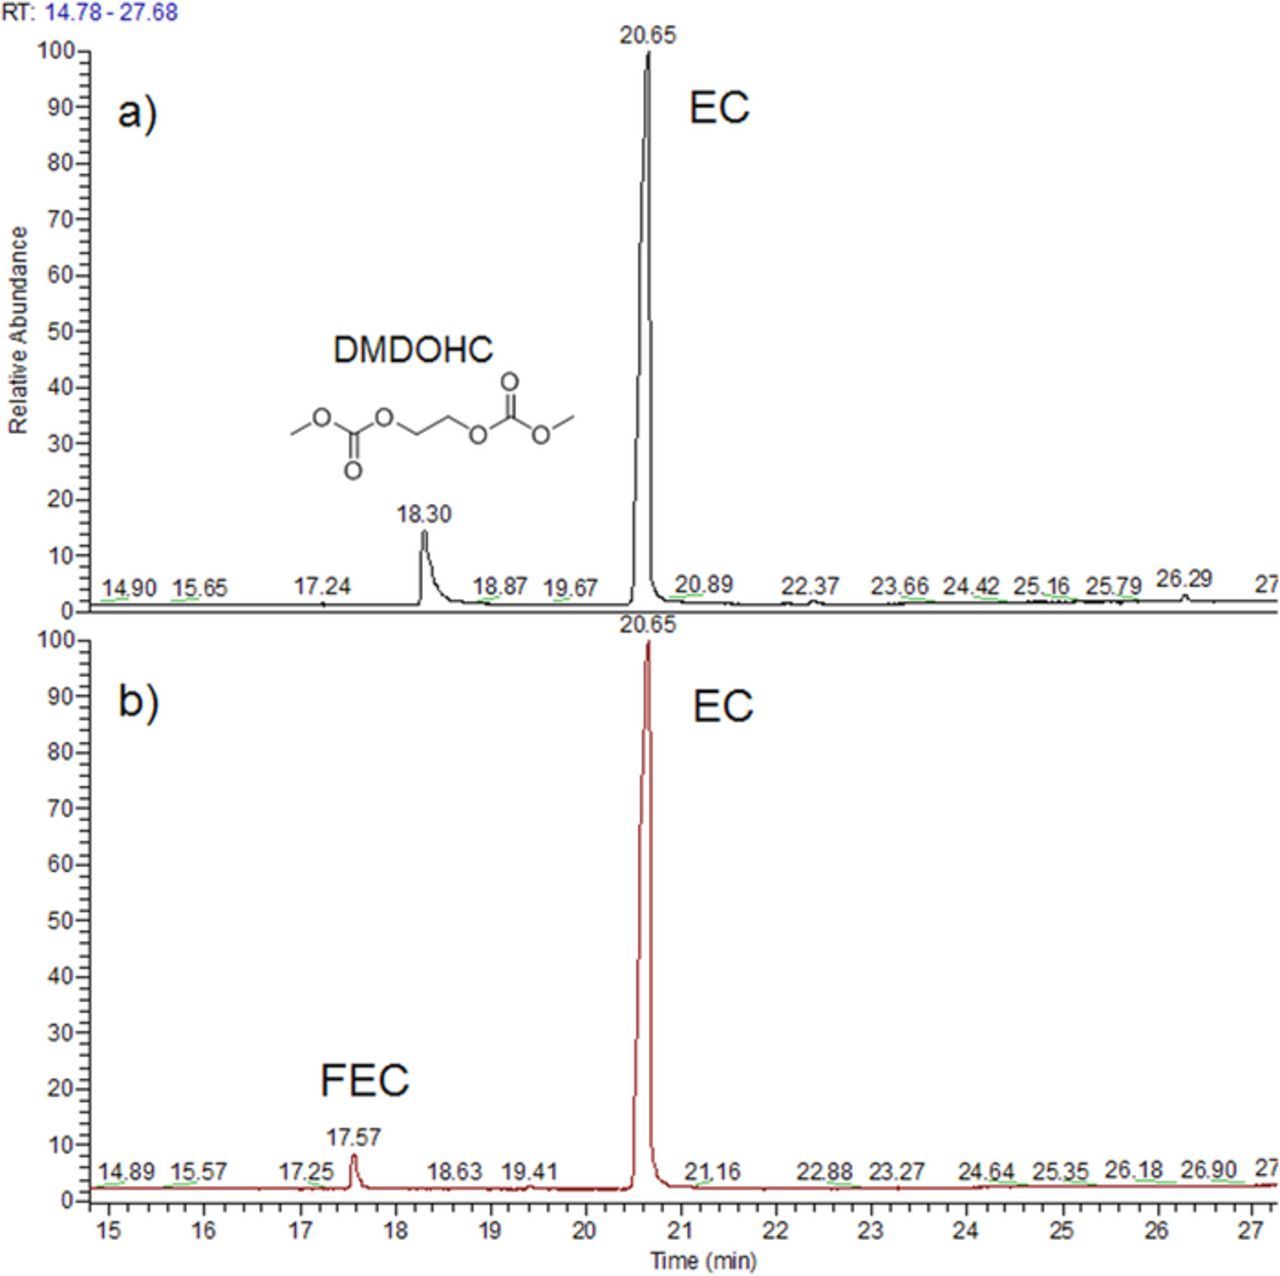
Figure 3. GC/MS chromatogram of liquid from reaction between Na metal and EC-DMC (1-1 w/w)-NaPF6, after 48 days a) without FEC b) with 3% of FEC.
This contrasts with the electrolyte containing 3% of FEC which after 5 days shows only (Fig. 2c) peaks of CO2 and DMC and no trace of methane or ethylene even after 48 days. These results indicate that neither EC nor DMC were reduced which is also consistent with our inability to detect any trace of DMDOHC in the liquid electrolyte (Fig. 3b). Like in Li-based systems, FEC is preferentially reduced preventing the reduction of EC and DMC electrolyte's solvents.15 Nonetheless, the intensity of the peak associated to CO2 in the experiments performed with sodium greatly increases between 5 and 48 days with its ratio to the DMC peak growing by a factor 37. This indicates a continuous reduction of FEC over the 5 to 48 days period and by the same token the absence of a stable covering SEI layer. Worthwhile mentioning, for reasons not determined yet, is the absence of FEC's reduction products within the recovered electrolyte, most likely due to their nature being either oligomers or charged species, which cannot be detected by GC/MS.
In parallel, we monitored the gas emission rates for the two solutions as a function of time (Fig. 4). In both cases we detected a rapid pressure increase during the first hours that we ascribed to solvent evaporation since we observed the same effect for a blank cell consisting only of electrolyte without any sodium or active material. Afterwards, for a period of 10 days a continuous gas evolution is observed irrespective of FEC presence, in good agreement with the GC/FTIR and GC/MS results discussed above, with larger gas emission for FEC-free electrolyte. Based on the ideal gas law we could deduce an emission of 120 μmol per cm2 of exposed sodium for the FEC-free electrolyte as compared to solely 20 μmol per cm2 in presence of FEC. These results could at first appear contradictory with the GC/FTIR data (Fig. 2) which shows a huge CO2 peak, but it has to be reminded that IR is very sensitive to CO2 so that tiny amounts can give rise to pronounced peaks. Lastly, worth mentioning is the quasi-linear pressure-time dependence for FEC that indicates a nearly constant gas evolution rate suggesting a constantly evolving SEI mediated by FEC.
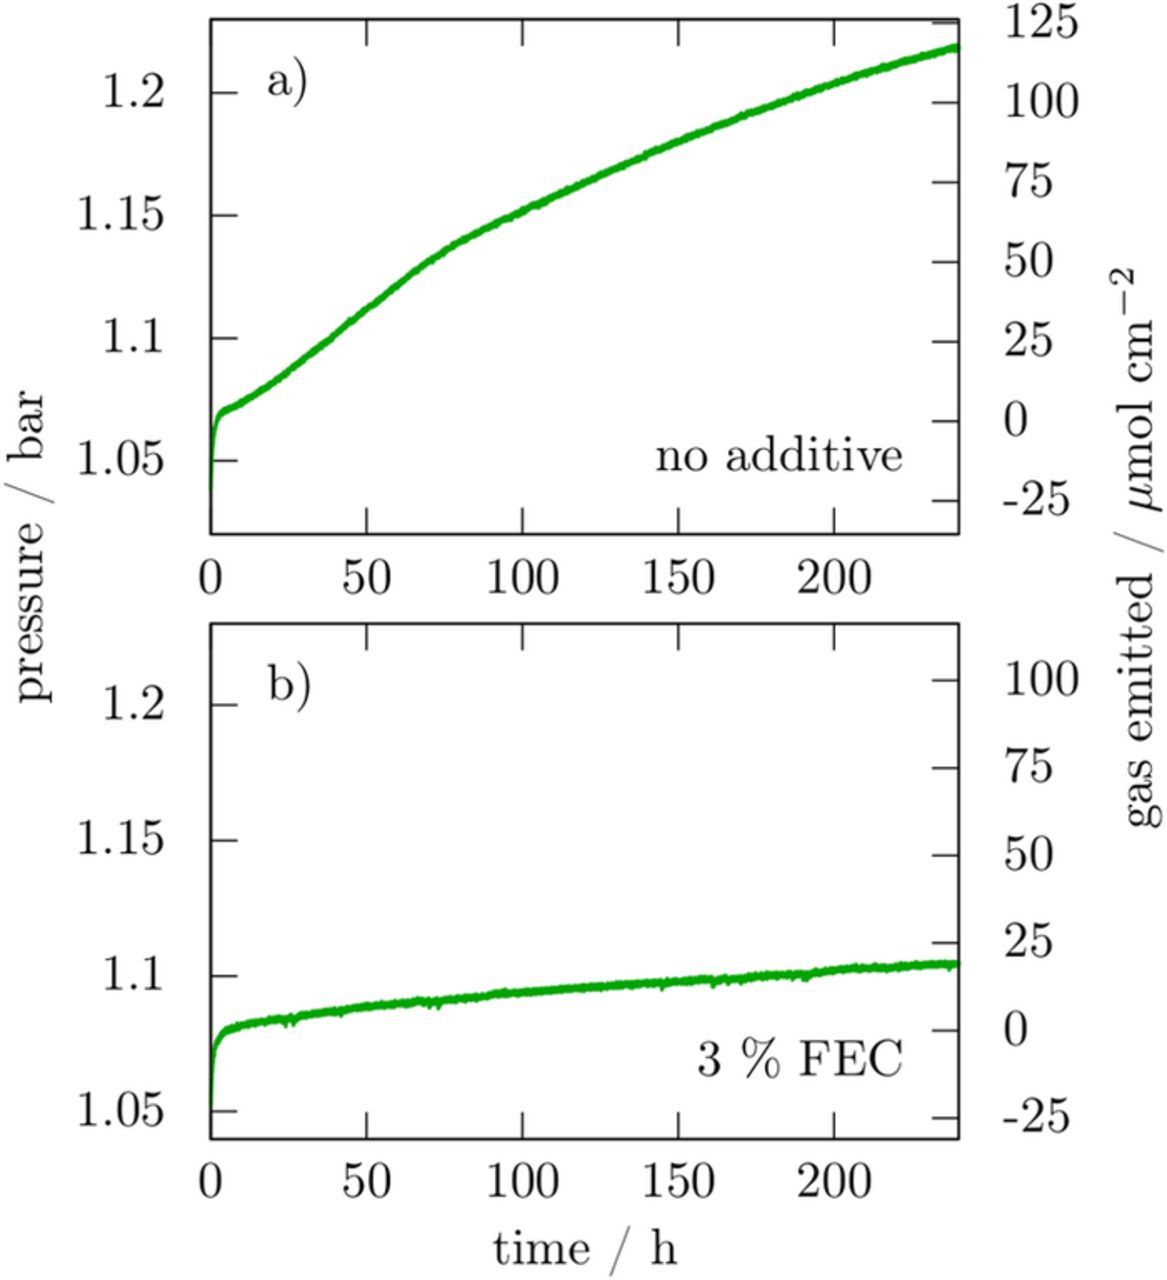
Figure 4. pressure variation in a 9.2 cm3 cell containing a 0.5 cm2 sodium electrode and 250 μL electrolyte without additive (a) and with 3% FEC in mass (b).
While FEC appears detrimental in the electrochemical response of symmetrical Na/Na cells, GC/FTIR, GC/MS analysis and gas evolution monitoring show a more beneficial aspect with lower gas evolution and no degradation of EC and DMC when FEC is present in the electrolyte. In the following, we investigate the implications of these characteristics on the response of active materials, both Na3V2(PO4)2F3 and C, in half-cells versus Na metal.
Figure 5 shows the voltage-capacity profiles of NVPF/Na (left) and C/Na (right) half cells cycled at C/10. For comparative purposes the capacities are plotted as C-Cirr with Cirr being the irreversible capacity. Starting with NVPF/Na cells we note a drastic reduction of the irreversible capacity from 31% to 2.6% when solely 3% of FEC additive is added to the electrolyte mixture, in agreement with FEC efficiently inhibiting parasitic processes. Note however that in presence of FEC, the potential of the low voltage plateau is shifted down by ∼100 mV with respect to the curve without additive, whereas the potential of the high voltage plateau is not modified. Surprisingly, this 100 mV potential mismatch is not observed in three electrode cells (Fig. 5b) in which the NVPF voltage is monitored vs. the Na reference electrode (i.e. no current flowing). This indicates that the voltage anomaly associated to the addition of FEC is an electrochemically-driven artefact related to the Na counter electrode side in the two-electrode cell. Interestingly, we also note that the amplitude of this artefact remains nearly constant upon cycling while the position at which it occurs (Fig. 5c) shifts progressively toward the end of discharge. Aside from being observed in many literature reports dealing with electrode materials in the presence of FEC-based electrolyte, this artefact has also been reported in EC-PC based electrolytes for cycling at high rate.16
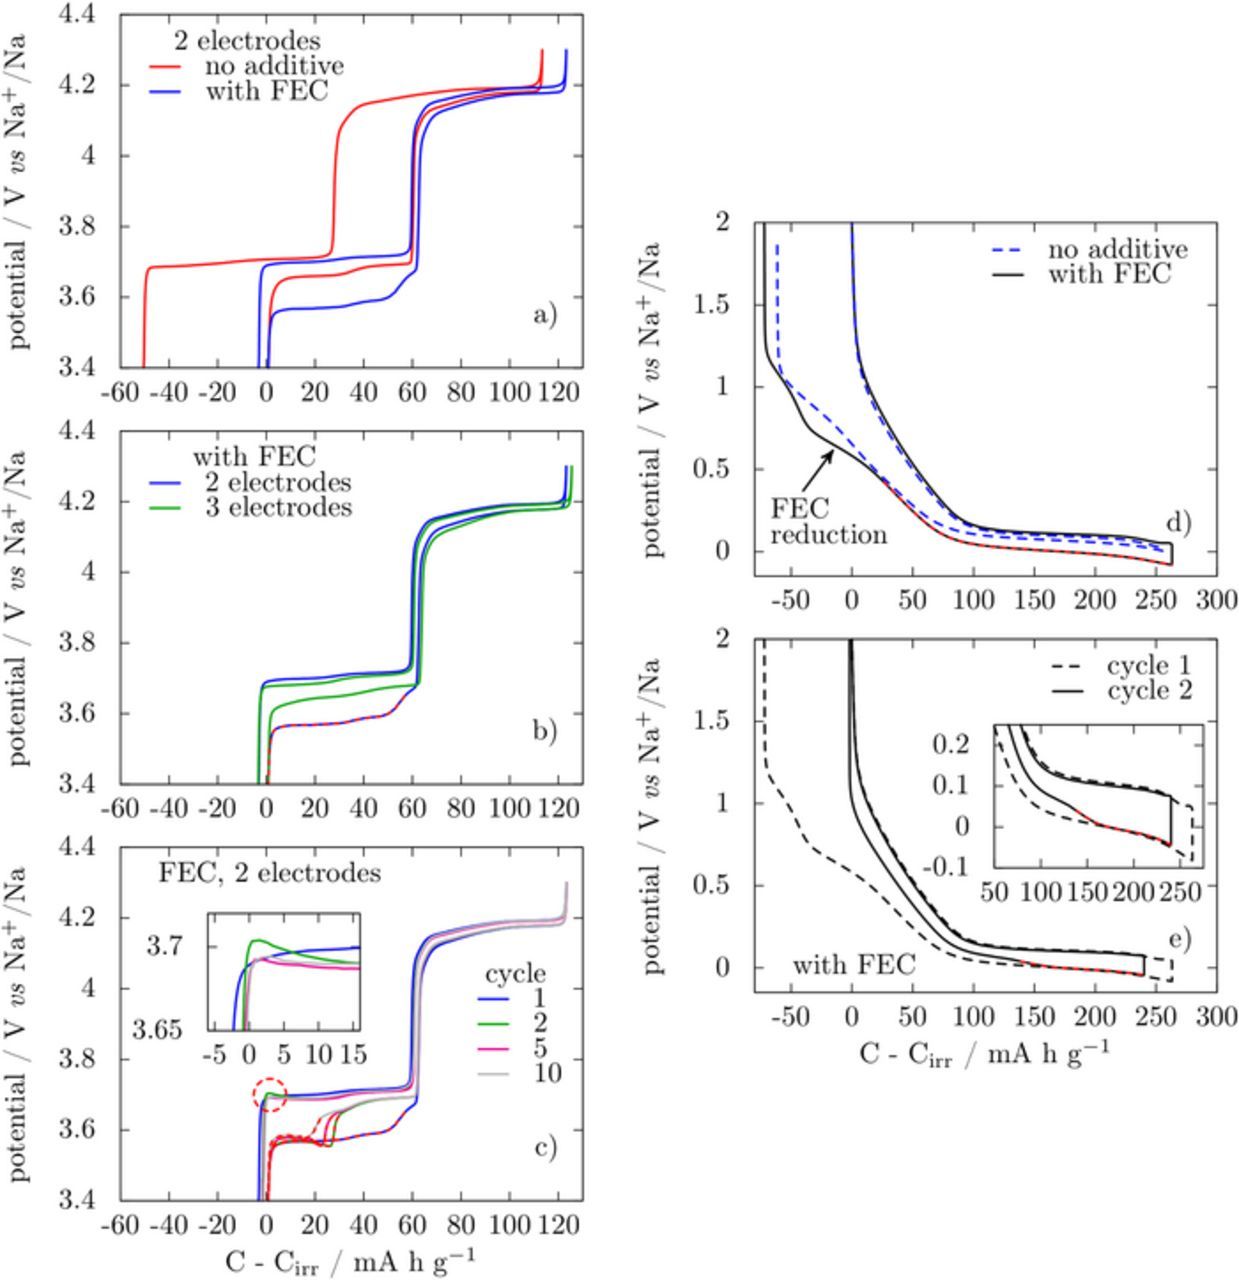
Figure 5. galvanostatic charge/discharge profiles of NVPF cathodes (left) and hard C anodes (right) vs. Na at C/10 in EC-DMC 1 M NaPF6 based electrolytes a) NVPF 1st cycle in 2-electrodes configuration with or without FEC as additive; b) NVPF 1st cycle in electrolyte with FEC in 2- or 3-electrodes configuration; c) 1st, 2nd, 5th and 10th cycle of NVPF with FEC; d) hard C 1st cycle in 2-electrodes configuration with or without FEC; e) 1st and 2nd cycle of hardC in 2-electrodes configuration with FEC. The profiles are plotted as a function of C-Cirr, where C and Cirr are the total and irreversible capacity at each cycle, respectively. Red dashes emphasize the zones where extra polarization is observed.
Turning to the Na/C half cells, the addition of FEC leads to a slightly higher irreversible capacity that reaches 72 mA h g−1 instead of 61 mA h g−1 for FEC-free electrolyte, in agreement with a previous report.17 A more prominent difference regarding the first discharge curve is the feature at 650 mV vs. Na+/Na in presence of FEC (Figure 5d) whereas a smooth voltage decrease is observed in absence of FEC. Beyond this feature the curve obtained with FEC keeps shifting toward lower potentials suggesting an impedance increase. This explains the need to lower the cutoff voltage to a negative value (−0,08 V) to reach a full sodiation of the carbon electrode. As previously reported,17 in a 3-electrode setup this gradual impedance increase is not observed and a 0 V cutoff can be used. Interestingly, during the second cycle, the cell shows lower polarization in reduction for the first 135 mA h g−1, and then a voltage drop to reach the voltage composition trace of the 1st cycle. In contrast a similar state of sodiation can be obtained by solely lowering the cutoff voltage to 0 V in absence of FEC.
From these results, two major effects regarding the addition of FEC in Na-half cells emerge. One regards the enhanced efficiency of the cathode's first cycle by lowering the irreversible capacity and the other one deals with increase polarization penalty generated in two-electrode configuration. The rationale to account for such effects finds its origin in the GC/FTIR and GC/MS experiments which show an intense degradation of EC and DMC in contact with Na metal leading to various gases (CH4, C2H4...) and soluble degradation products in absence of FEC additive. Such soluble species generated at the counter electrode can diffuse, as already observed in various Li-ion systems,18 to the working electrode to be oxidized, providing the additional capacity observed. Although it is not easy at this stage to identify such species, one can speculate that it may be either one of the oligomers previously mentioned, coming from the reduction of both EC and DMC through MeONa formation, or one of the charged soluble species that cannot be detected by GC/FTIR or GC/MS, like Na2CO3, MeONa or CH3COONa.
Let's now turn to the origin of the voltage anomaly associated to the increase in polarization observed in presence of FEC. Somewhat disturbing is its random occurrence upon cycling, namely during the reduction of the working electrode, that is during the Na stripping at the counter electrode. This is exemplified by further examining the behavior of Na-half cells (Fig. 5) having FEC as additive with either NVPF or C as working electrodes.
When NVPF is oxidized (i.e., Na is plated at the Na electrode) there is no polarization while on the following reduction (i.e., stripping of Na from the Na electrode) we note the appearance of a large polarization at the beginning of the low voltage plateau. Upon further cycling the oxidation curves (i.e., charge) nicely superimpose, while the reduction curves (i.e., discharge) still show a polarization on the low voltage plateau which appears as a sudden voltage drop. This voltage drop, which can be viewed as an enhanced difficulty to strip Na from the counter electrode, occurs at capacities shifting to the left upon cycling. Interestingly, neither of these effects is observed in a 3 electrode cell when the voltage of the NVPF is monitored against the Na reference electrode rather than the Na-counter electrode implying once more that the latter is the source of such anomalous artefacts.
Regarding Na/C cells (Fig. 5d), nothing is observed during the first reduction (i.e. Na stripping), with the exception of a gradual increase in polarization on the low voltage plateau, which once again translates into a more pronounced voltage feature upon cycling further. In contrast, the oxidation profiles remain smooth and alike irrespective of FEC presence.
Altogether these results highlight the operation problems of the Na-counter electrode in FEC containing electrolytes, whatever the type of Na half cells assembled. The stripping process appears significantly different after a plating step than just after cell's assembly. At this stage, one must recall that the Na electrochemical plating-stripping efficiency is always poor,3 which means that throughout the cycling tests of Na-half cells, the stripping process will in each step initially consume the freshly plated sodium (Naplated) and afterwards some additional Na from the bulk counter-electrode (Nabulk). So in short, the sudden voltage drops observed in the different tests reported in Figure 5 seem to be related to the transition between stripping of Naplated to stripping of Nabulk.
To further support this hypothesis, we simply assembled a cell with a FEC-based electrolyte and NVPF as the working electrode and a stainless steel disk, rather than metallic sodium, as counter-electrode. When the cell is charged the amount of sodium extracted from NVPF is i) plated at the stainless-steel electrode with its signature being visualized by the voltage spike at the beginning of the charge (Fig. 6) and ii) consumed to form the SEI. Since the formation of the SEI results in loss of sodium inventory, we cannot have residual plated sodium upon cycling. Whatever such a cell configuration, depleted of bulk Na, we never spotted a voltage anomaly in the voltage-composition profiles of such cells. This is an irrefutable proof that extra polarization observed for Na half cells with FEC solely occurs when all Naplated has been stripped from the counter electrode.
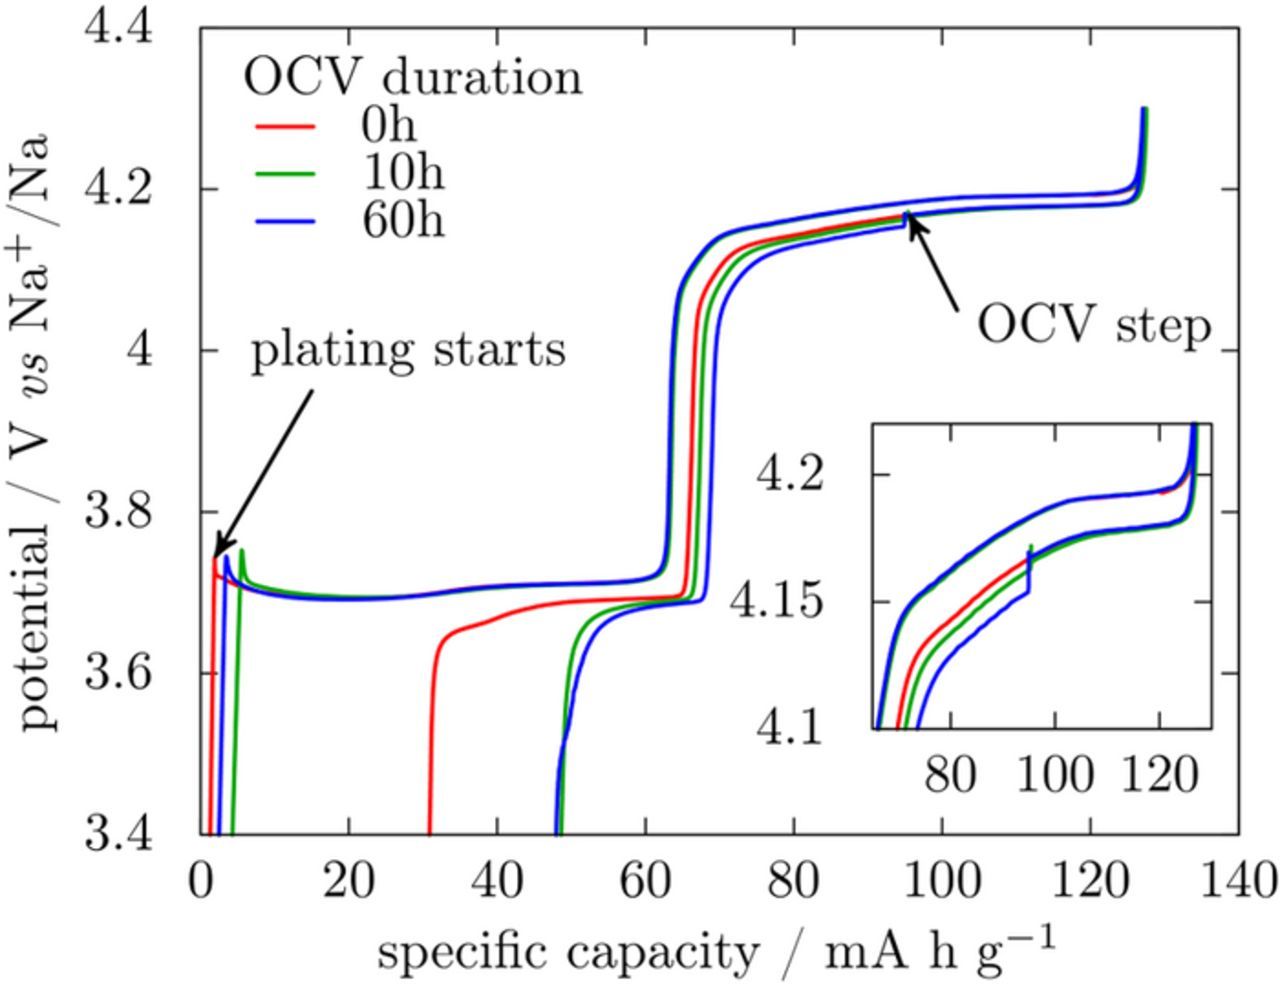
Figure 6. first cycle of NVPF versus stainless steel in EC:DMC–1 M NaPF6 with FEC and different OCV durations after 25% discharge.
Two hypotheses can be formulated to explain the extra polarization observed when FEC is used as an electrolyte additive: either Nabulk has a morphology or microstructure which hinders stripping when compared to Naplated; or some resistive layer grows at OCV on a half-cell with Na counter electrode before testing starts which limits the mass transfer from the counter electrode to the electrolyte. The fact that the voltage drops are not observed for cells without FEC while for such cells the switching from Naplated to Nabulk also occurs owing to the poor efficiency of the plating/stripping process (33–55%)3,17 seems to dismiss the first hypothesis. To confirm the validity of the second, NVPF/stainless steel cells were left at OCV in presence of Naplated on the stainless steel disk. After a complete charge, NVPF was partially re-sodiated (0.5 Na per formula unit) so that any polarization modification after the OCV step could clearly be detected. Indeed after 10 or 60 h at OCV, a gradual increase of the polarization is observed (inset in Fig. 6) whereas all curves superimpose (between 125 and 90 mA h g−1) at the beginning of discharge. This polarization increase is in agreement with a layer limiting Na stripping being formed when Na is left at OCV in presence of FEC. Interestingly, the reversible capacity is not affected by OCV varying between 10 and 60 h, suggesting that once initiated further FEC polymerization does not consume electrons, as described for polymerizable additives.19
At this stage a legitimate question deals with the origin of the FEC driven cell voltage modification when Nabulk rather than Naplated is stripped. The answer is most likely nested in the formation of a surface layer on the top of the Na metallic electrode that limits the stripping of Nabulk, as discussed above. Therefore, to limit the stripping of Nabulk without affecting plating and stripping of Naplated, as it is experimentally observed, the layer has to allow electron transfer so that plating can occur above this layer without being kinetically limited. This hypothesis of plating above a mixed conducting layer is supported by the slight overpotential peaks that can be observed in a 2-electrode NVPF-Na cell (circled in Figure 5c). Note that these peaks are simply less sharp than those (spikes) corresponding to Na plating on stainless-steel disc (Fig. 6) because we are deviating from an ideal electrodeposition experiment on a polished metallic surface.
All together the above results enable to propose a chemical/electrochemical scenario occurring at the sodium counter-electrode during galvanostatic cycling in FEC containing electrolytes, which is illustrated via schematic drawings of the evolution of the Na electrode structure upon cycling a Na/NVPF cell (Fig. 7). Initially, upon assembly of the battery the sodium electrode can be viewed as a complex layer consisting of two zones: an inner sublayer that enables electron transport either through tunnelling or by being intrinsically electron conductor and an outer sublayer on the electrolyte side that we regard here as an evolving SEI owing to its partial solubility in the electrolyte. Upon the first oxidation, electrons are transferred through the inner sublayer while the outer one is still nearly inexistent, so that plating occurs at the transition between the two sublayers, without any significant cell polarization. At this stage, the presence of metallic Na (Naplated) above the inner sublayer is expected to promote further FEC decomposition, so that SEI growth rate should increase. During the reduction step, stripping at the counter electrode starts by Naplated, requiring electron transfer through the inner sublayer and Na+ transfer through the outer sublayer, and no excess polarization is seen. Because plating/stripping is not 100% efficient, eventually all of Naplated is consumed and it becomes necessary to strip sodium from Nabulk to further sodiate the working electrode. This requires the transfer of Na+ through the inner sublayer, which gives rise to a high polarization at end of discharge, by adding extra impedance to the circuit.
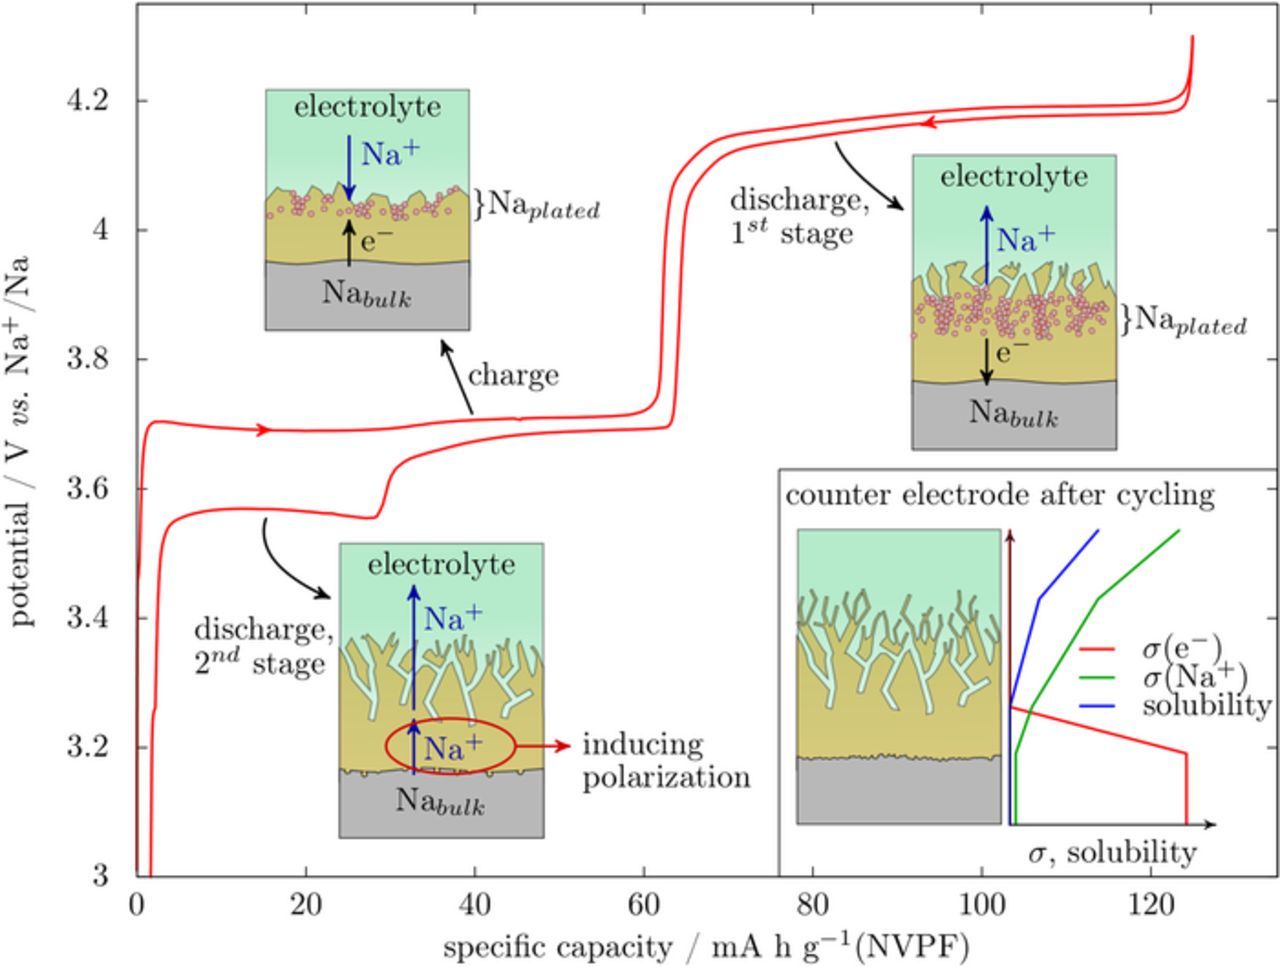
Figure 7. Scheme of the processes involved at the Na counter-electrode at the different stages of the galvanostatic cycling of a cathode material (NVPF). The counter electrode is constituted of metallic sodium (gray) and a layer formed by the reduction of FEC (yellow) with the liquid electrolyte above (light green). Inset shows the structure of the anode after cycling among with qualitative variations of the transport properties and solubility of the layer through its thickness.
After several cycles, this process would lead to the structure depicted in the bottom right inset in Figure 7. The inner sublayer is stable but repeated stripping of Nabulk might affect the interface with the sodium in terms of roughness. Equally, the outer sublayer is evolving with cycling and reached a steady state for which the growth by reduction of FEC is balanced by partial dissolution in the electrolyte. It is expected that such a structure will be maintained until all of the FEC is consumed and reduction of the electrolyte's solvents begins, in a similar way to the recently reported failure mechanism of Si-based Li-ion cells15,20 in which independent evidence of gradual FEC consumption is given.
Conclusions
We demonstrated that the use of FEC as additive minimizes the irreversible capacity of Na-half cells when NVPF is used as the positive electrode, thus enabling valid assessments of the capacities of cathode materials, while it slightly increases the irreversibility when C is used as positive electrode. Such an effect is accompanied in both cases by an increase in polarization which can lead to voltage abnormalities in the potential vs composition profile during Na striping. We demonstrated via complementary GC/MS and pressure measurements done under OCV conditions that FEC limits considerably the Na reactivity toward the electrolyte via the growth of a protecting layer whose impedance increases with time. To account for the voltage drops on Na stripping we proposed a model, as deduced from 2 and 3 electrode measurements, that distinguished the nature of the stripped Na (Nabulk vs. Naplated) and enlists a structured SEI having a stable inner part and an evolving outer part. Within this scenario, the Nabulk stripping requires ion transport through the inner layer which acts as an additional impedance hence leading to a voltage drop at the transition between stripping of Naplated to stripping of Nabulk.
The positive attribute of FEC in minimizing the irreversibility of cathode materials in Na-half cells does not come free as its effect is still associated to a continuous release of small quantities of gases which at long term could be detrimental to the cell performance. At this stage a burning question regards how these findings can be implemented to complete Na-ion cells. This calls for another full study aiming at quantifying the long-term benefits if any of adding FEC to full Na-ion cells that is being pursued and will be published in a shortcoming paper.
Acknowledgments
Authors acknowledge EC for funding through H2020 NAIADES project (LCE10-2014, Contract number 646433), L. Simonin and Y. Chatillon from CEA for sending the Na3V2(PO4)2F3 materials, and members of both the RS2E Na-ion task force and ALISTORE-ERI for fruitful discussions.