Abstract
This paper describes the spectroscopic detection of gases using macroporous silicon photonic crystals as narrow filters. The study begins by demonstrating the feasibility of photoelectrochemical etching to fabricate narrow filters along the mid infrared band. Next, we focus on the filter centered on the carbon dioxide fingerprint. The filter response is described for three different cell lengths and concentrations below 1%. Results show a concordance with the reformulated Beer-Lambert law. This can be used to predict the response of the filter for longer path lengths and higher concentrations, showing broad working ranges and compact sizes for CO2. In addition, optical robustness to external variations and long-term stability are also reported. Results are extrapolated to other macroporous silicon filters centered on the absorption spectra of N2O, OCS, NO2 and SO2. Finally, high sensitivity and selectivity is demonstrated by comparing them with some commercial filters.
Export citation and abstract BibTeX RIS

This is an open access article distributed under the terms of the Creative Commons Attribution 4.0 License (CC BY, http://creativecommons.org/licenses/by/4.0/), which permits unrestricted reuse of the work in any medium, provided the original work is properly cited.
Over the past few years, a number of detection systems based on different physical principles have proved their efficiency in gas sensing. Those that are less expensive and, therefore, have a greater projection in the market, are chemical sensors, in which some property of its active area varies accordingly to the amount of gas in the environment. However, despite the economic advantage, the improvement of cross sensitivity, selectivity, stability and response time still remains a challenge for them.1,2 An alternative are optical gas sensors, which solve many of those limitations. Within this group, laser-based gas detectors have the best performance since they work with monochromatic sources. This allows them to point to a specific gas absorption line and determine its concentration by comparing the received signal, that has traveled through a gas chamber, with the one emitted, as established by Beer-Lambert Law.3 Thus, these kind of sensors are extremely selective and sensitive. The counterpart is that small variations in temperature or pressure can cause a slight shift in the emission frequency, leading to very significant errors in detection. That is why they require complex thermal control systems and computer supports to accurately target the chosen absorption line.4 Consequently, laser-based gas sensors are non-portable high-cost devices whose applications are mainly restricted to industrial and academic environments.
Among the most commercial optical sensors are those based on Non Dispersive Infrared detection (NDIR). They are low cost, have low energy consumption, and, especially for CO2, provide high sensitivity –in the range of tens to hundreds parts per million (ppm) for a few cm of path length–. Their operation principle is similar to that in laser-based spectroscopy. But, instead of emitting a monochromatic light, NDIR sensors use broadband sources that are wider than the absorption spectrum of the target gas. This entails two main drawbacks: possible interferences between gases and considerably lower sensitivities with respect to laser-based spectroscopy.5 The problem with interferences in NDIR devices is that they cannot distinguish between two or more gases whose spectra fall within the emission window. This disadvantage can be partially solved by placing optical filters that reduce the detection window to the range of the gas to be studied.6 In this case, the received intensity in the detector follows the equation,
![Equation ([1])](https://content.cld.iop.org/journals/1945-7111/166/12/B1010/revision1/d0001.gif)
where ES is the emission envelope of the source, TA is the transmission of the filter, α the absorption coefficient in cm−1 and l is the path length in cm.7
The second drawback, concerning the sensitivity, is also related to the fact that NDIR devices emit with sources whose spectra are wider than the absorption range of the gas. Consequently, there is always part of the signal that reaches the detector without interacting with the gas molecules. Again, the solution is to use filters to block all frequencies, except those centered on the gas. Therefore, improving the sensitivity and the limit of detection of the device.
Recently, one-dimensional narrow filters based on photonic crystal cavities8–10 or crystalline coatings,11 were proposed for gas detection in the MIR and THz bands. However, although the reported devices show good performances, the experimental realization of these theoretical approaches still remains a challenge. Other 1D narrow filters based on photonic crystals were successfully commercialized for gas sensing purposes, among others.12–14 They consist on a multilayer structure deposited by sputtering that exhibit bandpass regions located in the absorption range of the target gas. However, although they present high transmission values and very broad forbidden bands, they have low quality factors. Which, at the end, has a negative impact in the reduction of sensitivity and selectivity of the devices.
In 2011, Pergande et al. reported a pioneer work with macroporous silicon PhCs developing a new technique for gas measurement.15 They used the fact that, at the edges of the bandgap, the group velocity is substantially reduced due to a higher number of internal reflections. As a result, the light-matter interaction increased 60 times. However, despite being an interesting result which opened the door to gas sensing with macroporous silicon, the proposed method required a complex and costly fabrication setup as well as a monochromatic detection system. Few years later, our team reported a new approach using 3D macroporous silicon PhCs for gas detection.16 In that case, a bandgap of about one micron was used as broadband filter. Consequently, only concentrations higher than 5% could be efficiently measured. In addition, the problem of selectivity was not solved and the measurement system, configured in reflection, was more complex than the one used here, which works in transmission.
Recent studies reported proofs of concept showing that macroporous silicon PhCs with a cavity in the middle can be used as narrow filters for the selective and sensitive detection of gases.17,18 The aim of this paper is to experimentally verify this point and to validate the technology in the entire mid-infrared band. The study begins by describing the optical response of several filters along the MIR –see Figure 1–. They were fabricated through photo-assisted electrochemical etching (PEC) using similar current profiles than the one shown in Figure 2a. The periodicity and the length of the cavity were adjusted in each case in order to place the filter at the desired frequency. Showing, in that way, the versatility of this single-etch process. Next, it is reported for the first time the use of macroporous silicon narrow filters for gas detection. Specifically for CO2, very important in many biological and industrial processes.19–21 We prove a sensitivity improvement over conventional NDIR devices, i.e. without filter, as a result of detection in the R-branch of the carbon dioxide. In addition, we experimentally demonstrate its optical robustness under temperature and pressure variations. To corroborate the suitability of this technology in the MIR band, the obtained results have been extrapolated to other four gases of interest using an in-house software. Finally, the study focus on the selectivity of these MIR filters. We demonstrate that, due to the high quality factors of our filters –Q > 120–, it is possible to discriminate between two partially overlapping gases by pointing to the area where they do not overlap.
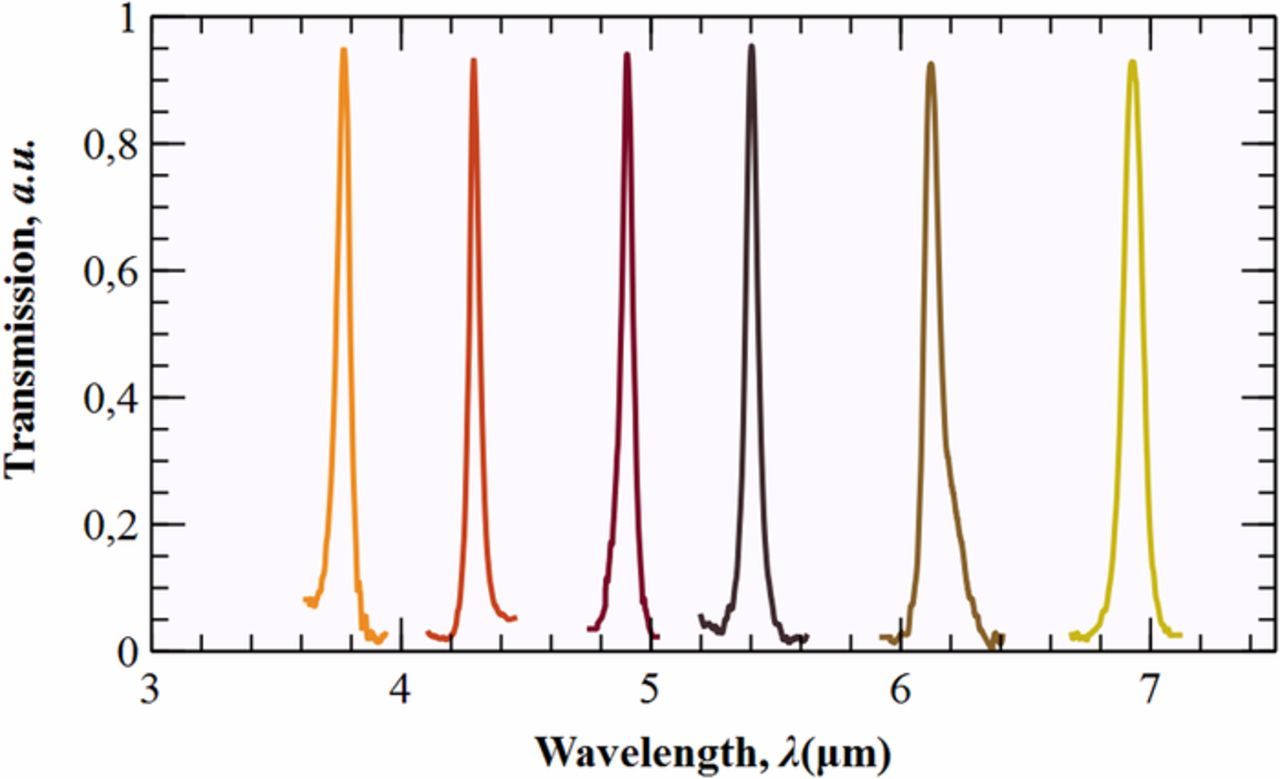
Figure 1. Fabricated macroporous silicon filters covering the mid-infrared band.
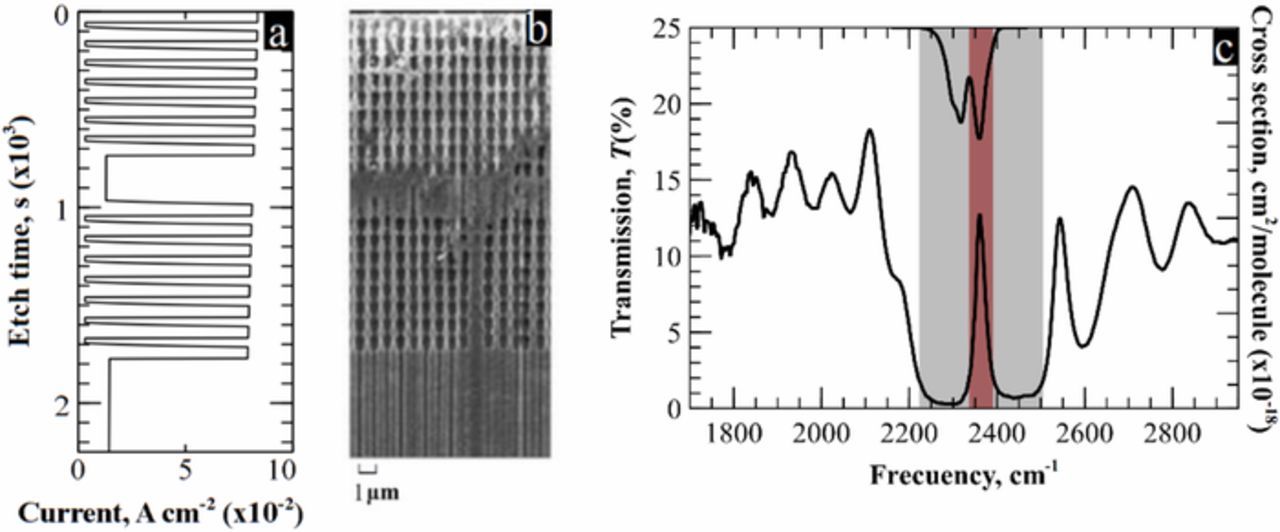
Figure 2. a) Current profile for the fabricated sample. b) SEM picture of the photonic crystal used in the measurements. c) Spectrum of the PhC –left axis– and CO2 absorption cross section –right axis-. The framed peak, that is used for detection in the R-Branch of carbon dioxide (red), is about six times narrower than the sensing area (gray).
Conclusions of the work highlight that macroporous silicon narrow filters are a robust and long-term stable technology that can be used to reduce the problem of spectral interferences in the MIR as well as to increase the sensitivity of current optoelectronic devices. Furthermore, the authors believe that this study opens the door to the future development of low-cost, versatile and compact gas sensors using macroporous silicon technology.
Experimental
Fabrication of macroporous silicon narrow filters
Before photoelectrochemical etching, several pre-processes –i.e. implantation, oxidation, lithography, etc.– had to be carried out in order to prepare the samples –details can be consulted elsewhere17–22–. As a result of this initial step, the front surface of the samples was pre-structured with a square array of inverted pyramids separated by a pitch of 700 nm. This was the starting point for the PEC attack. It was performed in six different samples with six different current profiles at 10°C and with a constant polarization of 1.5 V. After the process, all samples presented the same pore morphology. That is, two modulation areas with 8 periods each, a planar defect in the middle of both, and, at the end, a region of constant radius –see Figures 2a and 2b–. The only differences between samples were period length and cavity size, which ranged from 0.60 μm to 1.2 μm and from 1.2 μm to 3.0 μm, respectively. In all cases, the modulated areas were made using an asymmetrical trapezoidal current profile, in which the steepness of both ascending and descending slopes was optimized to increase the refractive index contrast of the PhCs. This improved the optical response of the filters. Particularly in the case of CO2, the quality factor of the peak was enhanced up to 120. In addition, a bandgap enlargement in respect to previous studies23 was also reported –see Figure 2c–. This led to a greater separation between the transmitted peak and the edges of the bandgap, thereby clearly discriminating the narrow filter within the forbidden band.
Another optical improvement of the manufactured filters was the decrease of the peak base line to almost zero transmission. Despite the improvement, there was still some remaining signal, especially in the right part of the peak, which reaches approximately the 7% of the maximum transmission. Although this does not have a high impact on the sensitivity, future works should focus on the total elimination of this transmission line to further increase the sensitivity of the proposed system.
Spectroscopic measurement of CO2
The optical response of the macroporous silicon PhC exposed to carbon dioxide was obtained using a Bruker Optic's Vertex FT-IR spectrometer with an aperture of 1 mm and a resolution of 4 cm−1. As shown schematically, in Figure 3, a gas cell with KBr windows transparent to the mid-infrared range was placed between the emitter and the receiver. In concrete, inside the sample compartment of the FT-IR. The detection process starts introducing a known concentration of carbon dioxide in the gas cell by regulating CO2 and N2 flowmeters. Then, a light emitted by the FT-IR source is filtered by the PhC, and afterwards, travels through the gas cell, where it interacts with the gas mixture. Finally, the FT-IR detector reads the signal and normalizes it with respect to the background case –i.e. the cell without carbon dioxide, only with N2–.
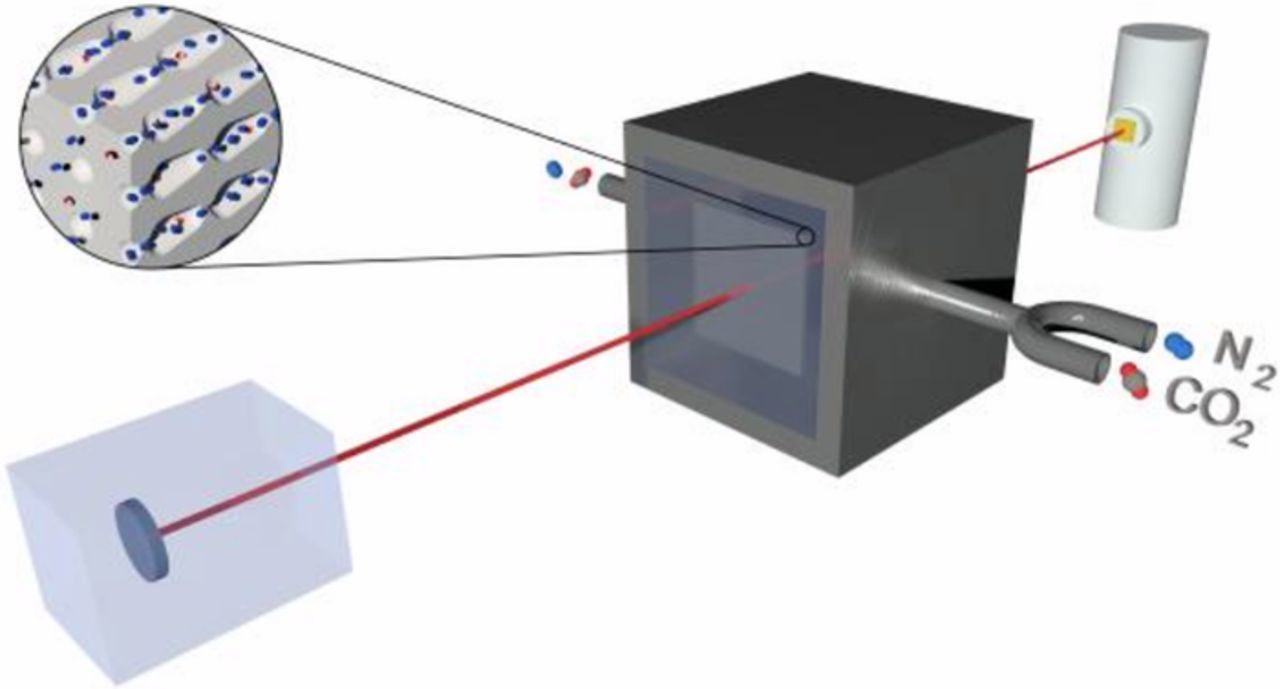
Figure 3. Schematic representation of the setup used for gas measurements; a gas chamber is in the middle of the emitter (left) and the receiver (right). Before light goes through the chamber, it is filtered by the macroporous silicon PhC. The output signal is detected and referenced to the non-CO2 case.
We measured with three different gas cell lengths, 2.2 mm, 1.4 cm and 2.4 cm., and under the same external conditions of pressure and temperature –1.07 atm. and 23°C–. Measurements started at 400 ppm and increased in steps of 200 ppm to approximately 10,000 ppm. Lower steps could not be performed due to the maximum uncertainty given by the mass rotameters. Therefore, the limit of detection (LOD) was imposed by them. However, in a final device, where the concentration is the parameter to be determined, the LOD is mainly given by the resolution of the detector. As a consequence, lower LOD is expected in a final sensor.
Simulations
A Python code was developed to apply Equation 1 in order to compare the experimental results with the theory. The cross sections of the different gases used in this paper –CO2, NO2, CO, OCS, N2O and SO2– were obtained from HITRAN database considering the same external conditions than in measurements –1.07 atm. and 23°C– and with the same resolution as in the FT-IR –4 cm−1 24–. As a result, cross sections, σ(λ), and transmission peaks, T(λ), were equally discretized, allowing Equation 1 to be applied at each discretized frequency for a given concentration c and a given length, l. Finally, and assuming a linear regression between points –200 frequencies were discretized between 2233 cm−1 and 2260 cm−1 –, the area of the resulting peak was calculated through the composite trapezoidal rule.
Results and Discussion
This section is organized as follows; in Data analysis subsection, experimental data are analyzed in order to model the optical response of the filter targeting the CO2. Specifically, its response is studied when exposed to concentrations below1% –10,000 ppm– and for three cell lengths, 2.2 mm, 1.4 cm and 2.4 cm. Next, in Higher concentrations and Longer lengths subsections, the model is used to obtain the response of the filter for both higher concentrations and longer path lengths, respectively. Then, in On thermal and pressure stability subsection, the optical robustness of the filter is tested by changing the working temperature and pressure. In Extending to other MIR gases, the model obtained for CO2 is extended to other filters pointing to four different gases in the MIR. Finally, On filter’s selectivity and sensitivity subsection. demonstrates the selectivity of our filters compared to others.
Data analysis
Figure 4 depicts the evolution of the peak when exposed to CO2 concentrations below 1% for three different path lengths. As expected from theory, peak reduction is more important for longer paths. As a consequence, higher sensitivities are reported for 2.4 cm than for 1.4 cm and 2.2 mm –see Figure 5–. It can be observed that in all three cases, experimental and theoretical curves follow an exponential fitting. Nevertheless, Figure 5a shows a quasi-linear relationship between the peak area and the gas concentration for the 2.2 mm case. This is in accordance with the theory since for low values of α(λ)l in Eq. 1 we are in the linear regime. Therefore, the decrease of the peak area is linearly proportional to the concentration. However, it can be observed that above 6,000 ppm, the slope of the experimental curve (green line) is lower than that obtained following Beer-Lambert's law (red line). As stated in previous reports, above a threshold concentration the absorbance starts to evidence non-monochromatic effects due to scattering, chemical reactions or stray radiation effects, among others.25–28 Two models have been applied to verify this point in the optical response of macroporous silicon filters,26,29,30 showing a great concordance with the exponential adjustment of the experimental data.
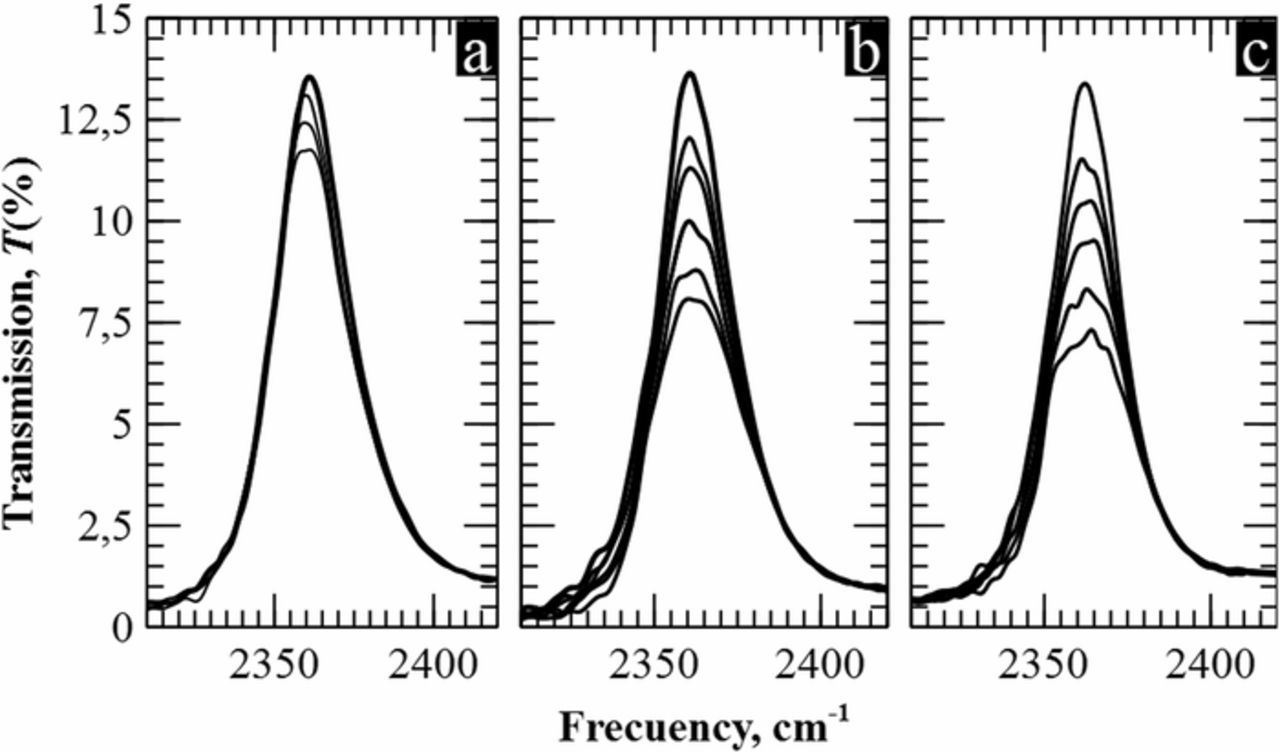
Figure 4. a) Experimental curves for 2,550, 6,400 and 10,200 ppm for a cell depth of 2.2 mm. b) and c) Measured area of the peak at different concentrations (0-2,900-4,750-6,800-8,100-10,500 ppm) for a path length of 1.4 cm and 2.4 cm, respectively.
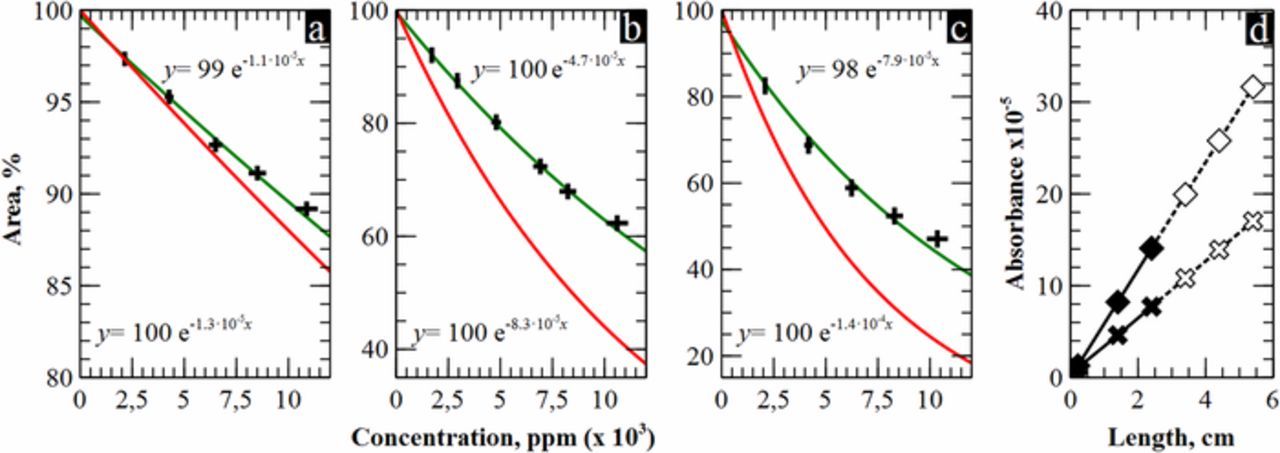
Figure 5. Experimental and simulated area for 0.22 mm a), 1.4 cm b) and 2.4 cm c). Both simulation (red) and experimental (green) follow an exponential fit. d) Absorbance vs length curve for experimental (cross) and simulation (squares) data. White marks are extrapolated values used for absorbance correction in the simulation program.
Figures 5b and 5c show a stronger exponential decay than in 2.2 mm, since we are no longer in the linear regime. The relationship between the exponent of the curves, or absorbance, and the cell length is represented in Figure 5d. Non-monochromatic effects are evidenced in the less steep slope of the experimental curve. Experimental and expected absorbance can be related in order to apply corrections in the simulation program. This allows going beyond the setup limits and predict the real response of the filter for concentrations higher than 104 ppm and cell lengths longer than 2.4 cm.
Higher concentrations
One of the most important features of a sensor is its operating range. In the present case, the upper limit of this range is given by the maximum concentration necessary to completely eliminate the peak. It is clear from Figure 4 that this point is not reached in any of the three reported datasets. Therefore, we have used the simulation program with the corrections done in previous section in order to obtain those limits, which are around 30% for 2.2 mm, 8% for 1.4 cm, and 5% for 2.4 cm –see left image of Figure 6a–.
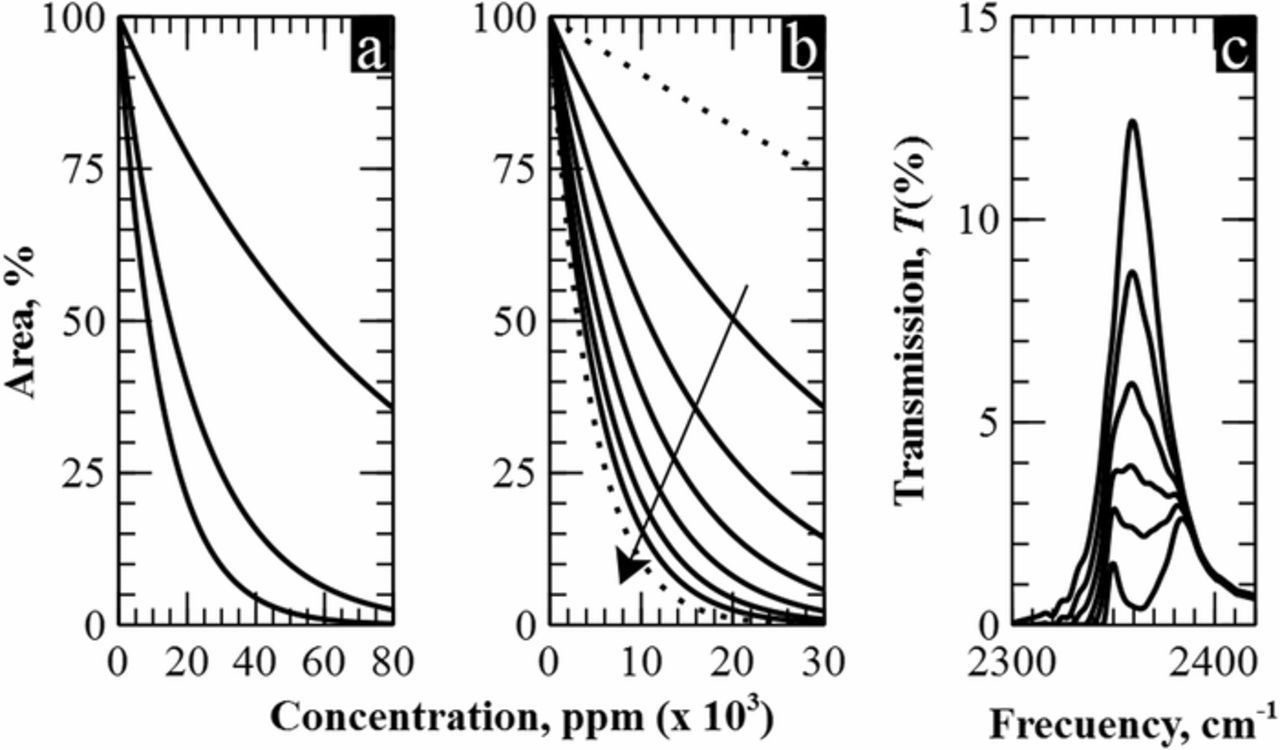
Figure 6. a) Extrapolation of the results to higher concentrations for the three lengths of 2.2 mm, 1.2 cm and 2.4 cm. b) Prediction of optical response for longer path lengths. c) Filter response for the optimal cell length of 4.5.
The shortest operating range of [0%–5%] represents an increase in the sensitivity and the resolution of more than an order of magnitude compared to the case of an unfiltered NDIR device working in the entire CO2 absorption range. In other words, simulations show that, an NDIR almost 5 times longer than ours would be required to obtain the same sensitivity. These results show that adding a macroporous silicon narrow filter to reported sensors7,31 will allow either reaching much higher sensitivity for the same length or having more compact devices for the same sensitivity.
Longer lengths
Figure 6b shows the evolution of the filter area for eight cell lengths and concentrations below 3%. It can be seen that the difference between two consecutive curves decreases as the length increases, having almost the same response for 6 cm as for 10 cm. Taking this into account, we conclude that a cell length of 4.5 cm offers a good compromise between size and optical response; it presents a very long operating range –from 0% to 2.5%– and twice the sensitivity than the 2.4 cm case. In addition, there is a substantial improvement in the LOD, as evidenced when comparing Figure 6c and Figure 4c, where a greater distance between two successive concentration curves is observed. Therefore, in a realistic gas sensor, lower concentration variations could be detected for the same resolution of the device.
On thermal and pressure stability
To know the impact that external variations have in our filters, we measured their transmission response sweeping temperature and pressure. Initially, the filter was placed inside the gas cell in nitrogen atmosphere and the pressure was increased from 1.07 bar to 1.21 bar in intervals of 0.03 bar. In all cases, equal transmission peaks were measured, proving no intrinsic changes in the filter due to pressure variations. Then, the filter was exposed to the same CO2 concentrations as in previous sections but, in this case, at 1.21 bars. Again, no difference was observed between these measurements and those taken at atmospheric pressure. Only in the case of high pressures, the reported method experiences slight variations in the optical response. In Figures 7a and 7b, it is shown the simulated response of the filter at 1 atm. and 2 atm. It can be seen that at 2 atm. the absorption spectrum of carbon dioxide gets broader in the R-branch, what slightly increases the sensitivity.
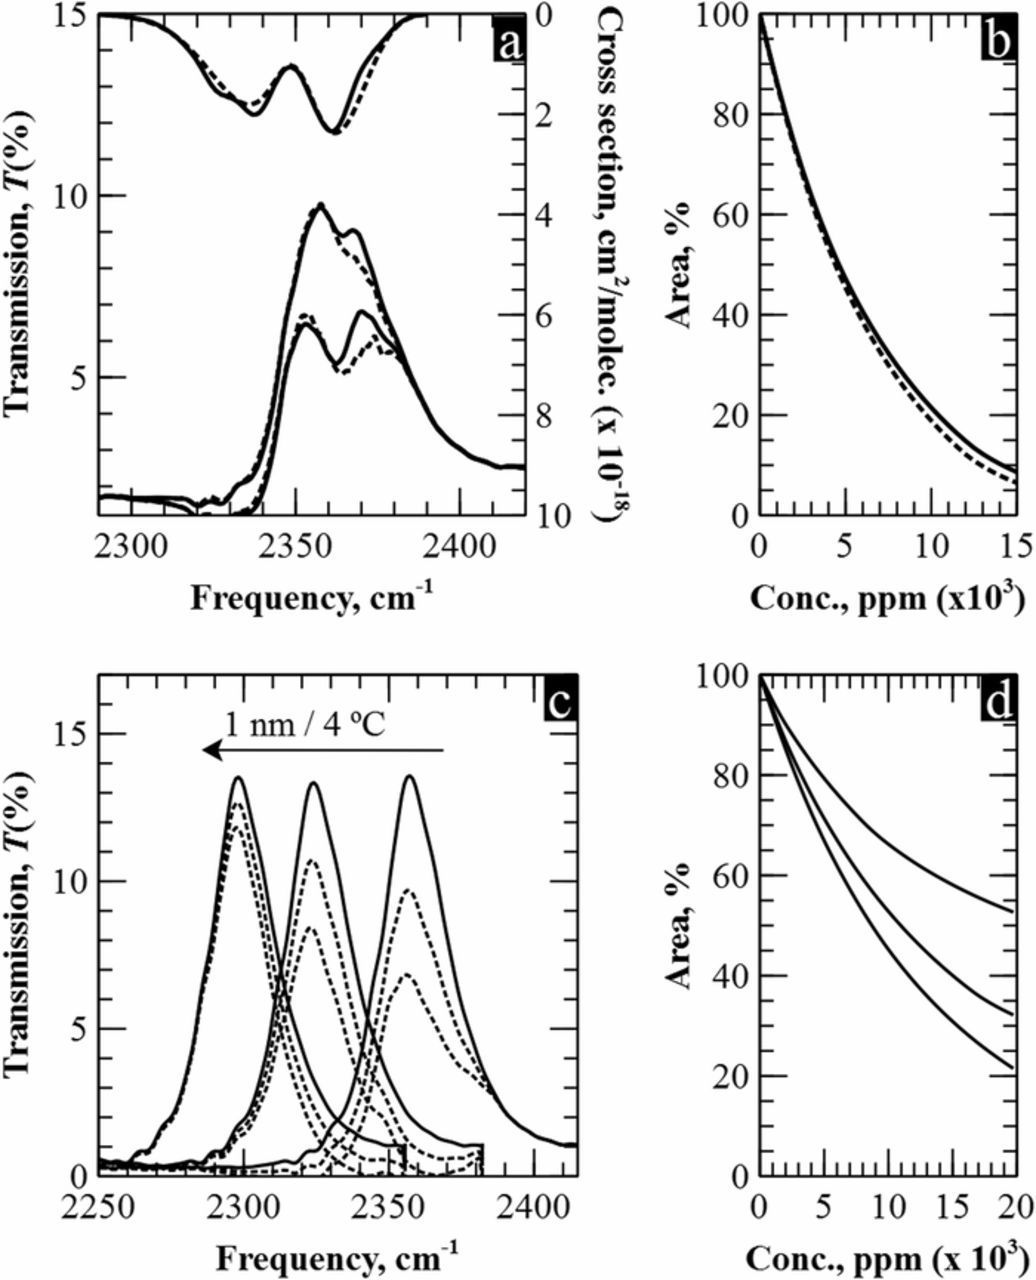
Figure 7. a) Comparison of the simulated response when the CO2 absorption spectrum is 1 atm. and 2 atm. b) Sensitivity curves at 1 atm. (solid line) and 2 atm. (dotted line). c) Measurements at 25°C, 175°C and 350°C and they respective optical responses d).
For testing the impact of temperature, the filters were heated up to 400°C with an external resistor. Figure 7c shows three experimental measurements at 25°C, 175°C and 350°C. It can be observed a total shift of nearly 100 nm towards lower frequencies due to thermal expansion of silicon, in good accordance to previous studies.32 This displacement leads to a decrease in sensitivity, as a consequence of misalignment between the filter and the carbon dioxide –see Figure 7d. Nevertheless, results show that for temperature variations lower than 50°C the peak does not experience a noticeable difference in its optical response.
Both results in pressure and temperature show a highly robust technology. In addition, the reported filters present long-term stability since the same optical response was measured in a time span of almost two years.
Extending to other MIR gases
In this section we extend the results obtained for CO2 to other filters distributed along the entire mid-infrared region. In concrete, we exemplify –but there are more cases– for those filters pointing dinitrogen monoxide (N2O), carbonyl sulfide (OCS), nitrogen dioxide (NO2) and sulfur dioxide (SO2). Optical robustness to external variations and long-term stability are intrinsic characteristics of the technology as well as LOD depends on the detector resolution in a final device. Therefore, working range and path length are studied. As seen in previous sections, they are directly related through the absorbance. To compare the results with the CO2 the optimal case, the working range was set to [0–2.5%] and the path length was adjusted in the software program for each case. Figure 8 shows that the length is reduced to 3 cm in the case of OCS because its absorption cross section is higher than carbon dioxide's. In the other three cases, longer lengths are obtained for the same working range, 8 cm (NO2), 8.2 cm (N2O) and 12.6 cm (SO2). It should be noted that in all of them, the path length is sufficiently small to consider macroporous silicon narrow filters as a platform for reliable and compact spectroscopic gas sensing.
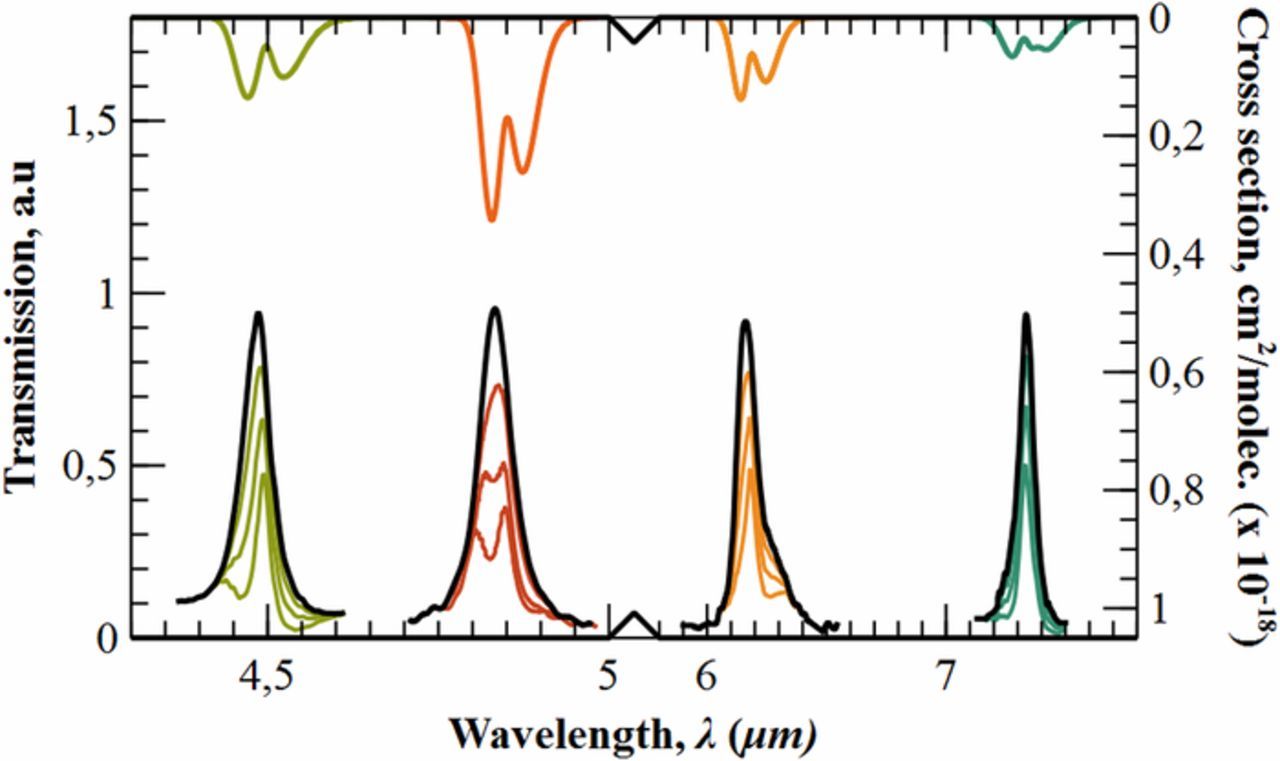
Figure 8. Cross section –right axis– of N2O (green), OCS (red), NO2 (orange) and SO2 (blue). Peak transmissions –left axis– when exposed to the same concentrations [0%–2.5%]. Below, a comparison in real scale of the calculated path lengths with the reference case of CO2 (black). The size of the cell is depicted as the difference between the last arrow of a particular color and the x-axis origin.
On filter's selectivity and sensitivity
It may occur that the absorption spectra of two gases overlap partially in the mid-infrared region. This is the case of nitrous oxide, N2O, and carbon monoxide, CO, whose spectra coincide in the band around 2200 cm−1. In Figure 9a is shown that our filter is narrow enough to entirely fit in the green band, pointing only to the non-overlapped part of N2O. On the contrary, the other filter33 covers part of the grey band where both gases coincide, entailing cross reference-detection. In Figure 9b it is depicted the response of both filters when exposed to different ambient conditions. Upper dashed line is the response of the commercial filter when there is no CO in the atmosphere. Therefore, it reports only the detection of N2O. The lower dashed line is the response of the commercial filter when the two gases complete the 100% of the atmosphere. This is, a 100% of CO when there is no N2O –left limit– and 97% of CO at the right limit, where there is a 3% of N2O. The gray area in between dashed lines represents inherent uncertainty of measuring N2O using the commercial filter due to presence of carbon monoxide in the atmosphere. The solid line in Figure 9b shows the response of our filter under the same conditions as on the bottom line. In this case, no measurement uncertainties are observed because our filter completely fits in the non-overlapping part of the N2O. In addition, in Figure 9b it can be also observed that the sensitivity of our filter is higher than the one for the commercial filter.
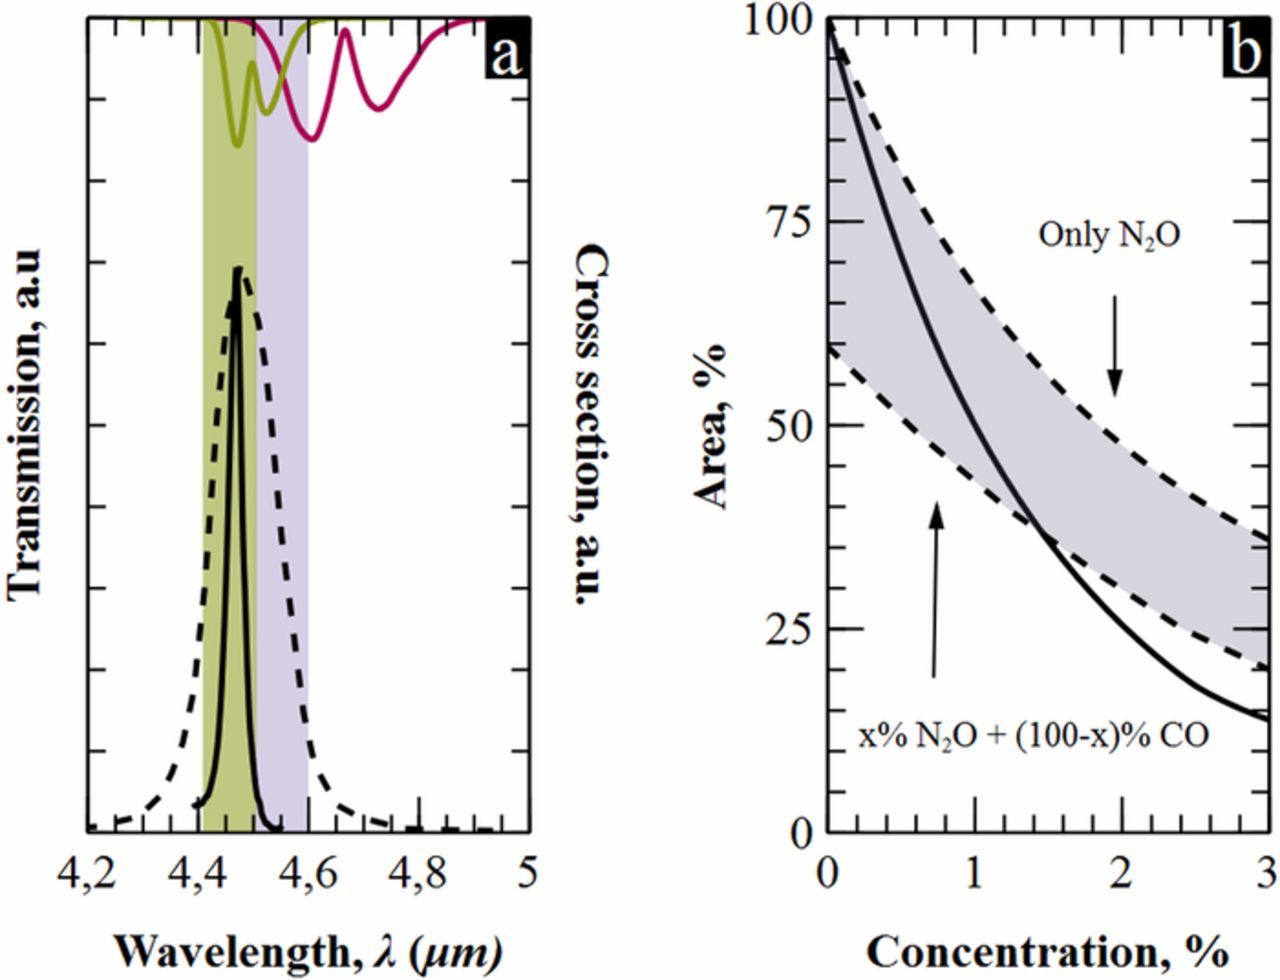
Figure 9. a) Left axis, transmission of macroporous silicon narrow filter (solid line) and a commercial filter (dashed line).33 Right axis, absorption cross section for N2O and CO. b) Cross-measurements for the two filters of Figure 9a.
There is more evidence that our filters report better selectivity and sensitivity than other devices. Specifically, there are commercial CO2 detectors that use active filters three times wider than ours,34,35 ranging from 2470 cm−1 to 2220 cm−1. This involves cross detection with N2O. The use of the filter studied in sections 4.1–4.4 would avoid such cross detection. Moreover, calculations show that it would increase the LOD by almost an order of magnitude or reduce five times the path length.
Conclusions
The spectroscopic detection of several gases using macroporous silicon PhCs was studied both theoretically and experimentally. Carbon dioxide was the first analyzed case; a narrow filter was placed within the R-branch of CO2 and the evolution of its area when exposed to concentrations below 1% was measured for three different cell lengths. The response in all three cases was adjusted by exponential curves, showing a linear relationship between the exponent of the fittings, or absorbance, and the length of the gas cell. Experimental absorbance showed a mismatch when compared to the theory due to non-chromatic effect. Hence, corrections in the theoretical absorbance were introduced in the simulation program in order to obtain realistic prediction of the filter's response for higher concentrations and longer cell lengths. For the case of carbon dioxide, optimal path lengths of 4.5 cm and concentrations ranges between 0% and 2.5% were reported. In addition, LOD lower than the ±100 ppm achieved experimentally were expected. The filter was exposed to pressure and temperature variations, showing a very robust optical response in wide ranges of [1–2] atm. and [20–400]°C, respectively. Furthermore, the filter demonstrated long-term stability. Results were extended to four other gases in the MIR, OCS, NO2, N2O and SO2. Finally, higher selectivity and sensitivity was reported comparing the fabricated filter with the commercial ones.
Therefore, macroporous silicon narrow filers could be used in actual opto-electronic devices for improving their features in gas detection.
Acknowledgments
This work was supported by project MICINN/FEDER RTI2018-093996-B-C31.
ORCID
David Cardador Maza 0000-0003-3069-1087