
Abstract
Graphite, which is the most wildly used anode material for lithium ion batteries, has a limited power performance at high charging rates (Li-ion input), while its alternatives, such as silicon and tin alloys, show an even inferior rate capability. Here, we describe a multi-channel graphite anode with channels etched into the graphite surface that enables lithium ions to quickly access graphite particles for fast chargeable lithium ion batteries. As a result, the multi-channel graphite anode showed an excellent charging rate capability of 83% for 6C charging and 73% for 10C charging, which is much better than pristine graphite material. Moreover, the multi-channel graphite anode showed a great enhanced discharge rate capability than pristine graphite. In addition, it showed excellent cyclability with a capacity retention of 85% at 6C after 3000 cycles without any additives. The multi-channel graphite anode is proposed for use in fast chargeable lithium ion batteries for electric vehicles and plug-in hybrid vehicles.
Export citation and abstract BibTeX RIS
With the fast-growing market for portable electronic devices and the development of electric vehicles, there has been an ever increasing and urgent demand for energy storage devices that are of high energy density and high power density. The current commercially available lithium ion batteries for electric vehicles that have a natural or artificial graphite anode and layer-structure LiMO2 (M = Mn, Ni, Co binary, or ternary system) cathode have a gravimetric energy density of more than 180 Wh/kg at the cell level but suffer from low power performance such as a poor charge and discharge rate capability and high-rate cyclability.1–6 However, these batteries can be improved by cell design engineering such as through low mass loading on both the anode (<100 g/m2 for a single side) and cathode (<220 g/m2 for a single side), having a high electrolyte coefficient (more electrolyte), increasing the porosity of both electrodes by having a lower press density or adding fillers, using more conductive additives (>7wt%),7 and using active material with a high surface area.8,9 These efforts will result in a much lower energy density and higher cost per Wh. Another strategy is to change the anode materials that play an import role in the kinetics of lithium transportation during charge and discharge. Among all the potential anode materials, lithium titanium oxide has attracted much attention for its high rate and long cycle life; however, the low capacity (175 mAh/g) and high potential vs. Li/Li+ (1.55 V) limits its application in high-energy-density lithium-ion batteries. Iron oxide was also reported to have a good charge and discharge rate performance; however, it may have safety problems caused by iron dendrites that form during charging and discharging. Carbon based materials, including soft carbon, hard carbon, and MCMB, have been widely investigated for lithium-ion battery (LiB) anodes owing to their excellent physical and chemical properties. Soft carbon and hard carbon have a very good rate capability because of a large interlayer distance. However, soft carbon usually has a limited capacity (∼250 mAh/g) and a lower average working potential, which makes it difficult to make a battery with a high energy density. Hard carbon has a capacity of up to 400 mAh/g. The same as soft carbon, hard carbon suffers from a low density, a low coulombic efficiency as well, and high cost. Graphite has still been the most commonly used anode material for lithium ion batteries because of its low cost, high capacity, and ease of processing. However, its rate capability is not good enough for transportation applications because it has small interlayer spaces (0.335 nm) with a lower ion diffusion rate compared with amorphous carbon, and there is a lack of lithium ion intercalation sites at the basal plane for both natural and artificial graphite. In this study, we would like to introduce a multi-channel graphite anode that could increase the rate capability of graphite materials due to channels on the surface of the graphite introduced by using a simple air oxidation method. A schematic diagram of the multi-channel graphite is shown in Fig. 1.
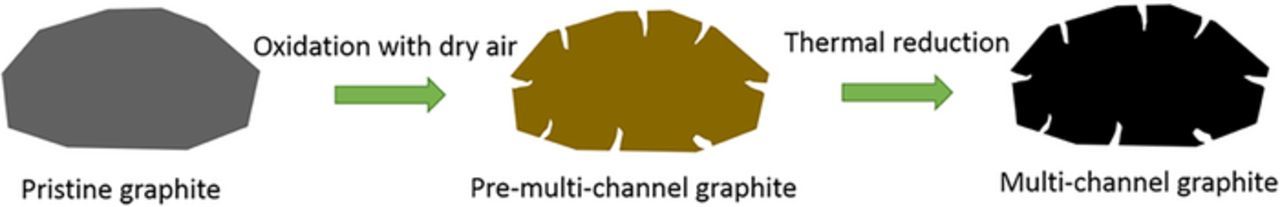
Figure 1. Schematic of multi-channel graphite.
Experimental
Synthesis of multi-channel graphite
Multi-channel graphite was synthesized from natural granulated graphite by using an air oxidation method. Ten grams of natural granulated graphite (CGB-20, Nippon Carbon Industries, Ltd) with a size of 20 μm were heat treated at 650°C, 750°C, and 850°C for 1 h with a dry air flow, followed by a further heat-treatment in a nitrogen atmosphere for 4 h. The acquired samples were used for a test.
Characterization
The morphology of the samples was carried out by field-emission scanning electron microscopy (FE-SEM) (Hitachi, SU8000). A cross-section of carbon particles was cut by using a focused ion beam (FIB) (JIB-4700F). The Fourier transform infrared (FT-IR) spectra of the samples were recorded by using a FT-IR spectrophotometer (Bruker Optics) with the KBr method. Raman spectroscopy was performed on an NRS-7000 series of laser Raman spectrometer with maximum resolution of 0.7 cm−1/0.3 cm−1 and measurement range from 50 to 8000 cm−1. The specific surface area was calculated by Brunauer-Emmett-Teller (BET) theory, and the pore distribution was analyzed by both MP (0.4–2 nm) and BJH (2–200 nm) methods. The electrochemical properties of the materials used for the proposed anode were characterized in both half-cell and full-cell configurations. The cut potential range for the half-cell measurement was from 0 to 1.5 V, while full-cell charge and discharge were carried out in a voltage range of 2.5 to 4.2 V.
Cell fabrication
Anode electrodes were prepared by coating a mixture of either pristine graphite (CGB-20, Nippon Graphite Industries) or multi-channel graphite, carbon black, carbonxymethy cellulose (CMC), and styrene-butadiene rubber (SBR) with a weight ratio of 97%:1%:1%:1% on copper film with a mass loading of 65 g/m2 for a single side. The density of the electrodes was pressed at 1.49 g/cc. The thickness of the copper foil was 10 μm. Cathode electrodes were prepared by coating a mixture of lithium nickel cobalt manganese oxide (NCM111, BASF), carbon black, and polyvinylidene fluoride (PVDF) with a weight ratio of 93%:3%:4% on aluminum film with a mass loading of 140 g/m2 for a single side. The density of the electrodes was pressed at 2.78 g/cc. Regarding the half-cell configuration, the anode and cathode electrodes were assembled with lithium-metal-deposited copper film as a laminate cell. The full cell was assembled with the as-prepared anode and cathode electrodes with an A/C ratio of 1.2. 1M LiPF6 EC/DEC (3:7) was used as the electrolyte. An 8-Ah laminate cell was fabricated with the same anode and cathode electrodes as described above (30 layers of cathode and 31 layers of anode), and the energy density was confirmed to be 167 Wh/kg. However, the rate capability and cycling performance were both tested in a small laminate cell (anode: 23 × 24 mm, cathode: 22 × 23 mm) with the same anode and cathode electrodes.
Results and Discussion
Characterization of materials
Figure 2 shows the morphologies of the carbon materials. Figure 2a is the pristine graphite materials, from which a smooth surface was revealed. The diameter of the natural granulated graphite was around 15 to 20 μm. Figure 2b shows an SEM image after air oxidation. It was revealed that the surface became rough after the treatment. An enlarged image of the surface after air oxidation is shown in Figs. 2c and 2d. It is clear that the smooth surface was oxidized with a lot of grooves, which are what we call "channels." These channels on the surface are expected to increase the sites at which lithium ions can intercalate and deintercalate during charging and discharging.
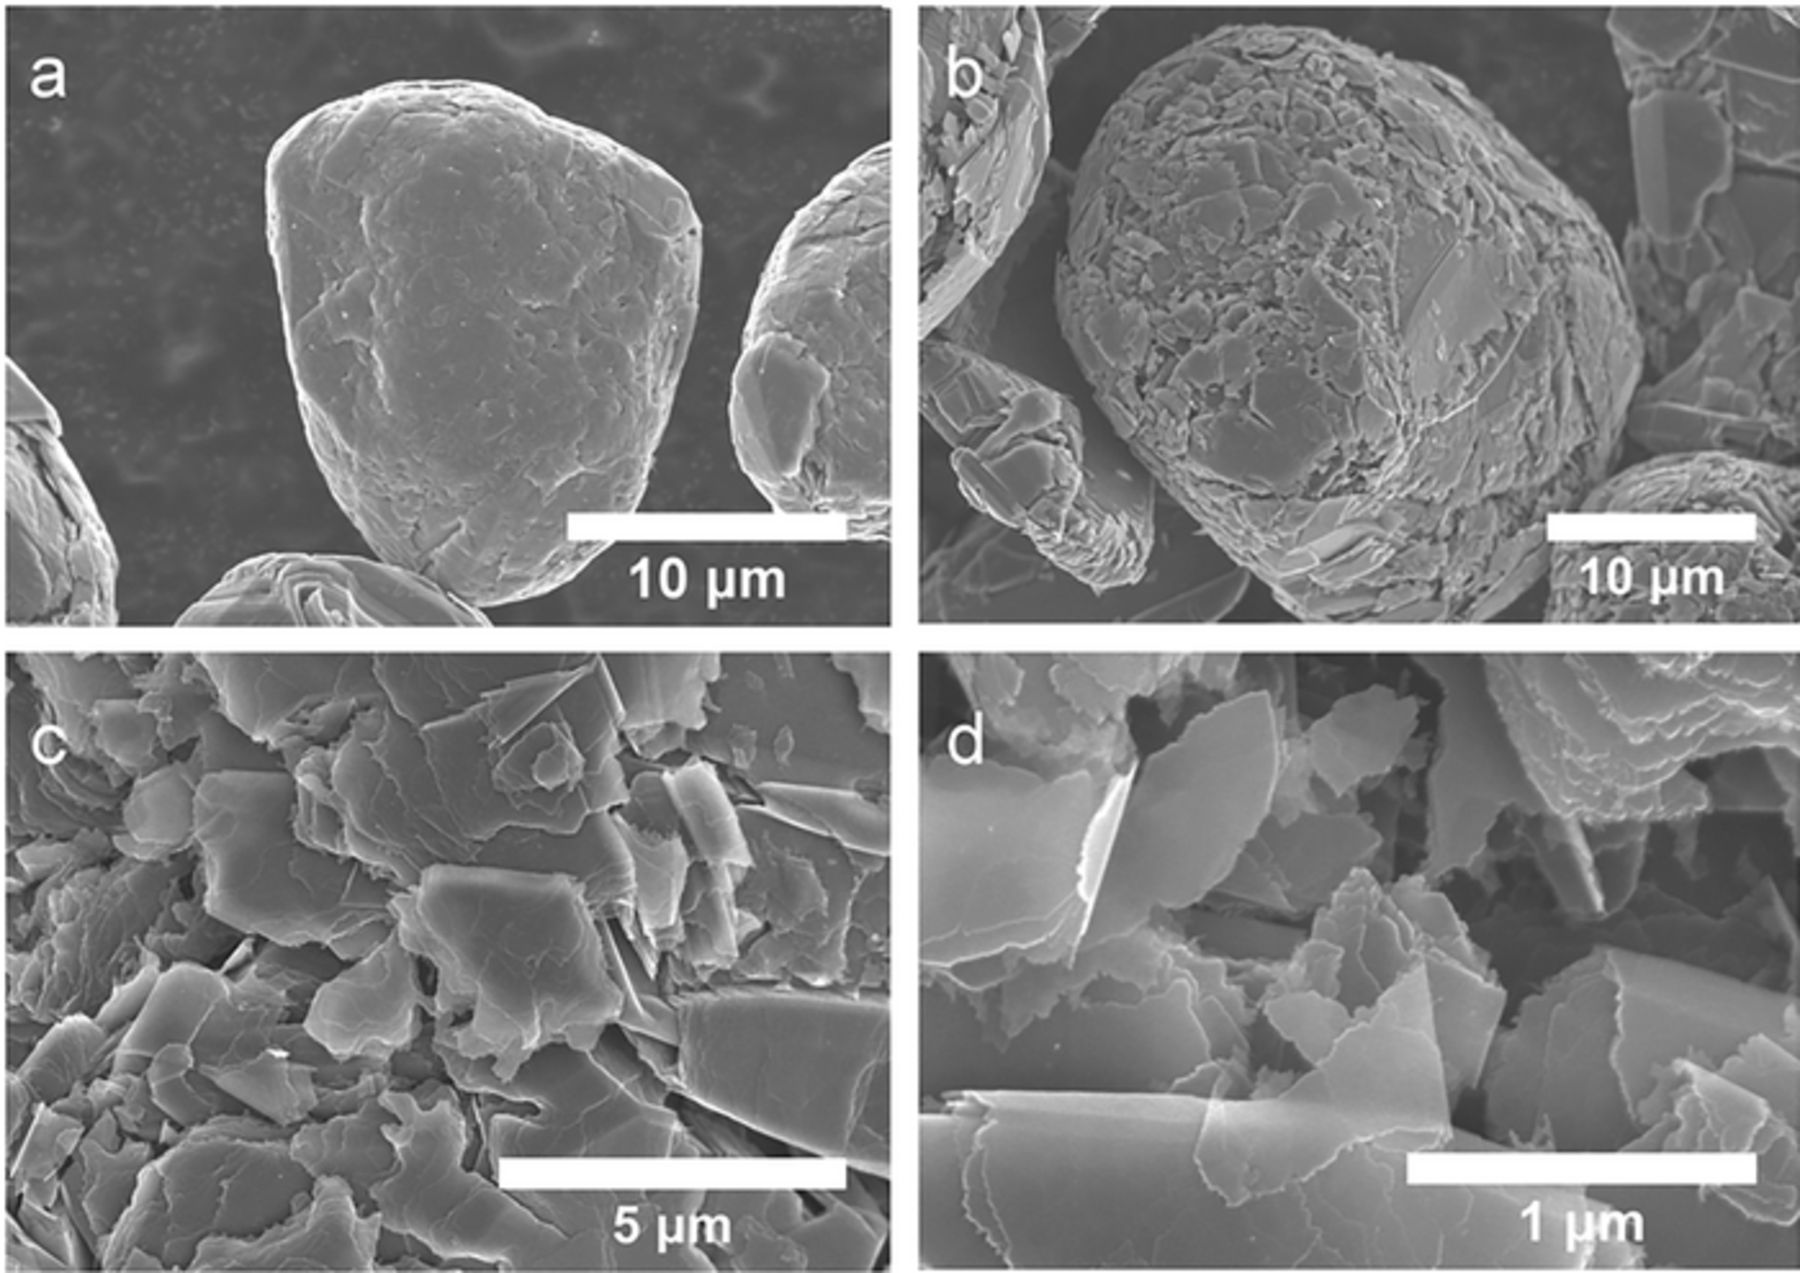
Figure 2. SEM images of a) pristine graphite. b, c, d) Multi-channel graphite at different magnifications.
A cross-sectional image of multi-channel graphite oxidized at 650°C, 750°C, and 850°C (referred to below as air graphite 650, air graphite 750, and air graphite 850) are shown in Fig. 3. The samples were sputtered with tungsten as a protective film before being cut by a focused ion beam (FIB). Figs. 3a–3c are SEM images of air graphite 650. The protective film can be revealed with a different contrast. Air graphite 650 was relatively dense as shown in the cross-sectional image. Air graphite 750 is shown to be the same in Figs. 3d–3f. First of all, more surface pores are shown in Fig. 3d than in Fig. 3a. Moreover, Fig. 3e shows a rougher surface of graphite particles compared with Fig. 3b, which is consistent with the result shown in Figs. 3d. The channels were formed almost near the surface of the graphite particles. Cross-sectional images of air graphite 850 are shown in Figs. 3g–3i. Air graphite 850 also showed a similar surface morphology as air graphite 750 with lots of surface pores. However, the channels were revealed throughout the whole particles instead of near the surface like air graphite 750. This suggests that the channels formed from the surface to the core part of the graphite due to the elevated temperature.
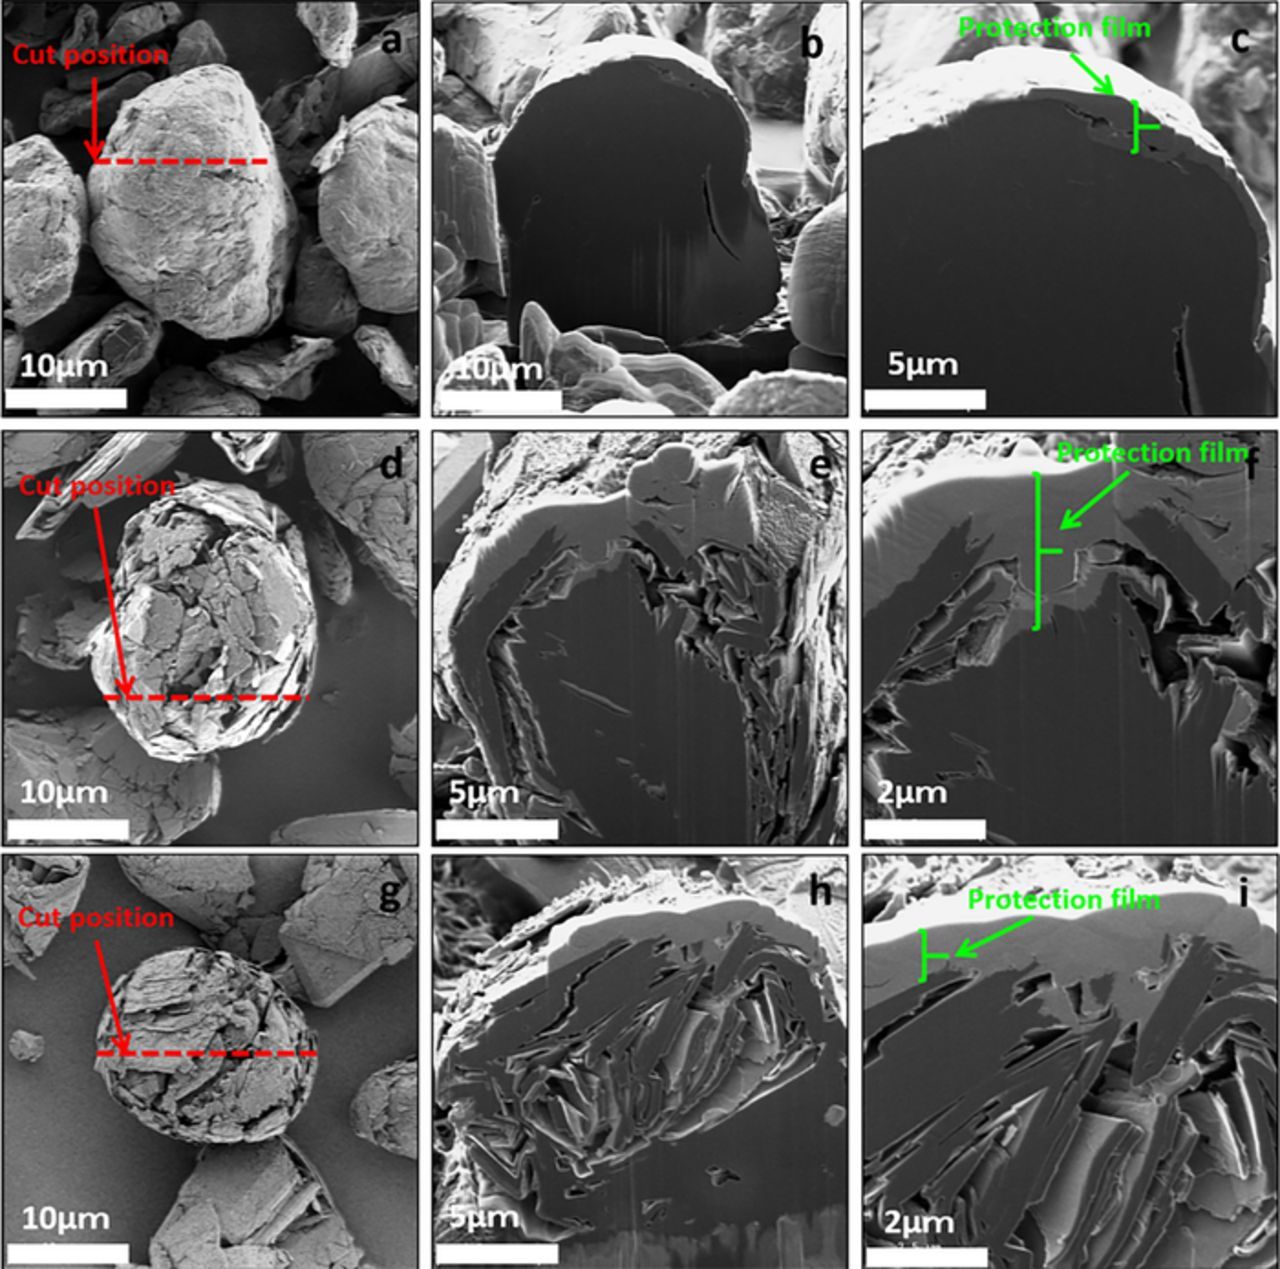
Figure 3. Cross-sectional SEM image of pristine graphite and multi-channel graphite. a, b, c) Pristine graphite. d, e, f) Multi-channel graphite synthesized at 750°C (air graphite 750). g, h, i) Multi-channel graphite synthesized at 850°C (air graphite 850).
Nitrogen adsorption was used to characterize the specific surface area and pore distribution of the pristine graphite and multi-channel graphite oxidized at 650°C, 750°C and 850°C. Figure 4a shows the pore size of the pristine graphite and multi-channel graphite characterized in high-resolution nitrogen (77.4 K) absorption/desorption experiments performed by using the Barrett-Joyner-Halenda (BJH) method. The specific surface area of the pristine graphite and multi-channel graphite oxidized at 650°C, 750°C, and 850°C (marked as air graphite 650, air graphite 750, and air graphite 850 in all figures) had a nitrogen BET specific surface area of 9.5, 11.8, 9.2, and 8.6 m2/g, respectively. This means that the specific surface area did not increase but rather decreased at a higher temperature after the surface etching. This is because the pristine natural graphite contained surface microspores and defects, which contributed a lot to increasing the specific surface area but made etching easier during air oxidation in high temperature. As a result, air graphite 750 and air graphite 850 showed smaller specific surface areas than pristine graphite, which may benefit the coulombic efficiency. What is more, the pore volume increased by three times from 0.01 to 0.03 cm3/g, and the average pore size increased by almost two times after the graphite was made into a multi-channel structure, which provided extra spaces for electrolyte absorption.
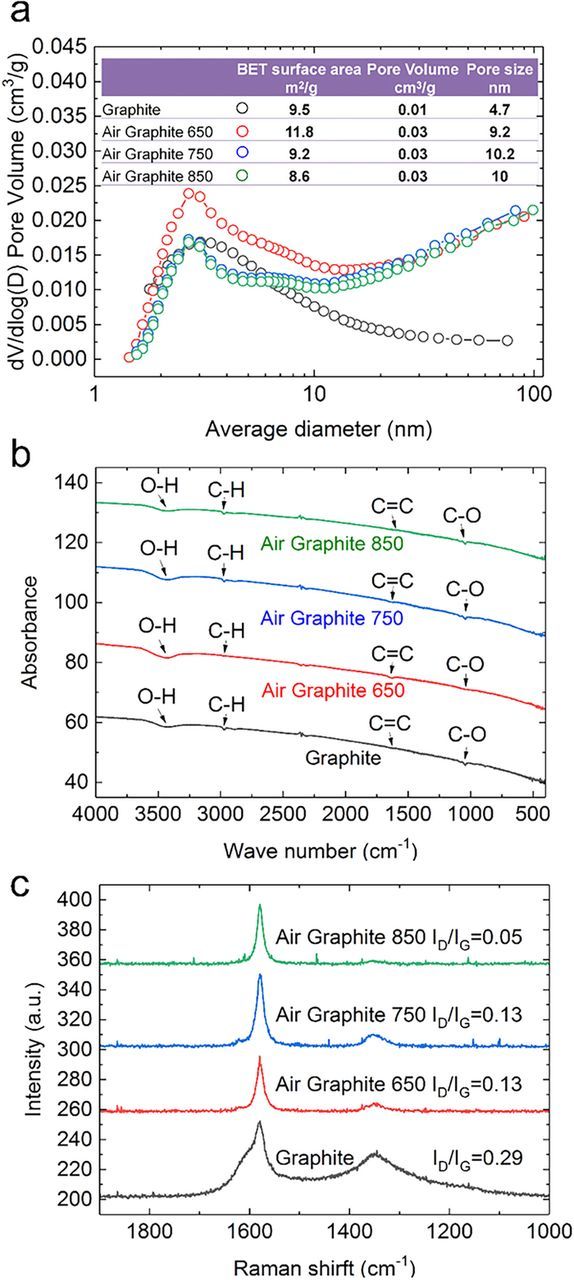
Figure 4. a). Specific surface area and pore distribution of pristine graphite, air graphite 650, air graphite 750, and air graphite 850. b). FT-IR spectra of pristine graphite, air graphite 650, air graphite 750, and air graphite 850. c) Raman spectra of pristine graphite, air graphite 650, air graphite 750, and air graphite 850.
FT-IR was used to detect the presence of functional groups on the pristine graphite and multi-channel graphite oxidized at 650°C, 750°C, and 850°C (Fig. 4b). Prominent features in the FT-IR spectrum of the carbon materials include absorption bands corresponding to C-O stretching at 1053 cm−1, C=C ring stretching at 1621 cm−1, aromatic C-H stretching at 3010 cm−1, and O-H stretching vibrations at 3428 cm−1.10–12 A broad band for O-H was shown in the spectra of the pristine graphite, air graphite 650, air graphite 750, and air graphite 850. It arose from the presence of hydroxyl (3000 to 3700 cm−1) and carboxyl (∼3550 cm−1) groups as well as water. In this broad band from 3250 cm−1 to 3600 cm−1, there were contributions involving the C-OH stretching at 3500 cm−1, which was attributed to the carboxyls, five-membered-ring lactols, hydroxyls located on both the basal plane and edge hydroxyls, and trapped water.13 The multi-channel graphite showed exactly the same species and peak intensities as the pristine graphite, which indicates that the surface oxidation did not change the surface functional group state of the graphite materials.
Figure 4c compares the Raman spectra of the pristine graphite and the air-oxidized multi-channel graphite treated at different temperatures. In the pristine graphite, a Stokes phonon energy shift caused by laser excitation created two main peaks attributed to the G band (1580 cm−1) and D band (1350 cm−1).14 We can also observe a small D' peak induced by activate phonons with a small wave vector q in defected graphite at 1620 cm−1 for the pristine graphite.15 The D' peak disappeared after the air oxidation, and a much smaller ID/IG ratio was achieved for air graphite 650, air graphite 750, and air graphite 850.15,16 The natural graphite with surface micropores and defects showed a relatively larger ID/IG. The air oxidation of the natural graphite at high temperatures made it easier to etch the surface micropores and defects. As a result, the lower ID/IG (better crystallinity) as well as the low specific surface area shown in Fig. 4a were achieved.
Electrochemical testing
Figure 5 shows initial and second charge and discharge curves for each sample. The pristine graphite showed a conventional capacity of 356 mAh/g and coulombic efficiency of 91%. The multi-channel graphite showed an increased capacity and better coulombic efficiency of up to 94%. The improvement in capacity and coulombic efficiency may be attributed to fewer defects and micropores after air oxidation, which was confirmed by nitrogen adsorption (Fig. 4a) and Raman spectroscopy (Fig. 4c).
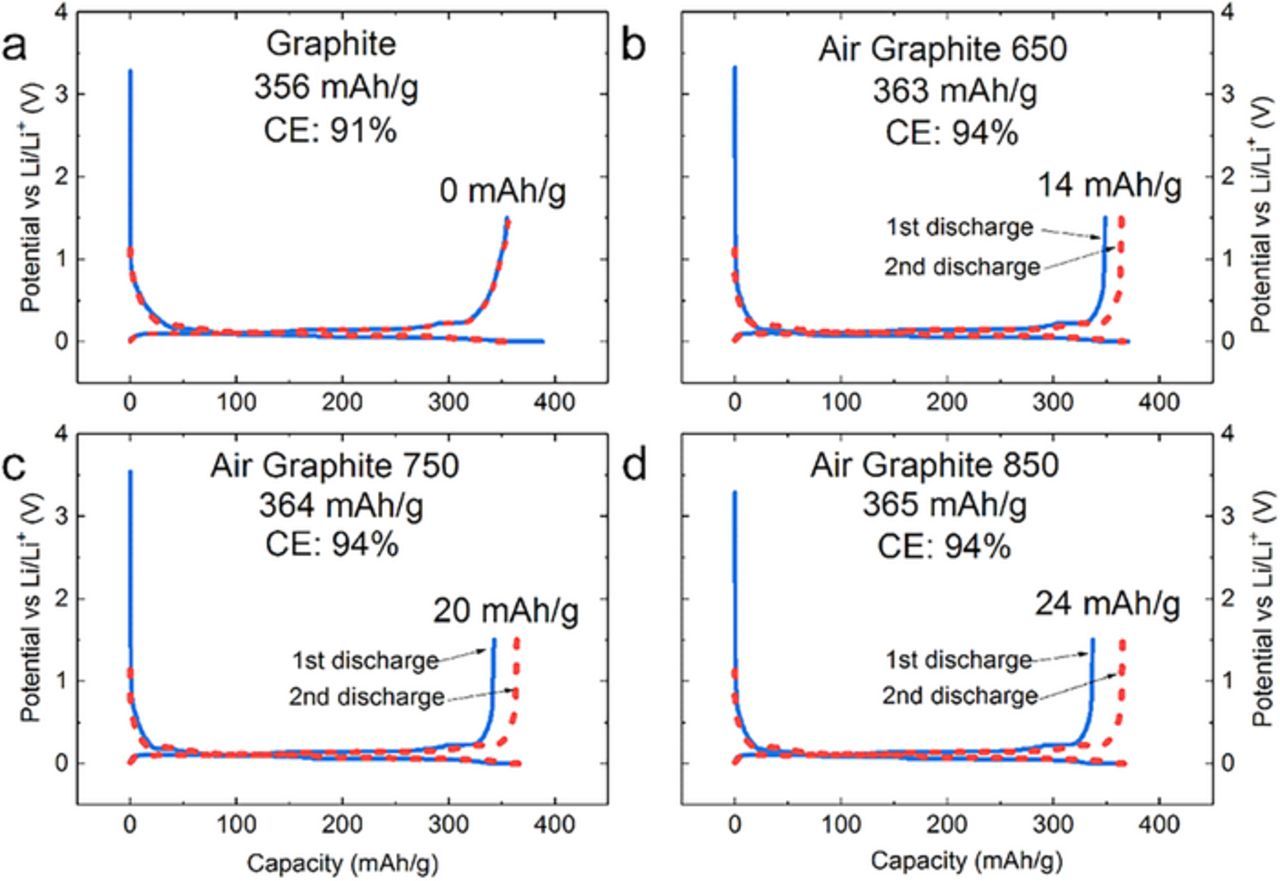
Figure 5. Comparison of initial charge and discharge curves vs. lithium metal. a) Pristine graphite. b) Air graphite 650. c) Air graphite 750. d) Air graphite 850.
The charge and discharge rate capabilities were evaluated in the full cell in Figure 6. Figure 6a is the lithiation (Li-input in anode) rate capability of the pristine graphite and air graphites 650, 750, and 850. The cells were charged at 0.1C, 0.2C, 0.5C, 1C, 2C, 3C, 4C, 6C, 8C, and 10C from 2.5 to 4.2 V and discharged at 0.1C from 4.2 to 2.5 V. The capacity at every C-rate is plotted in Fig. 6a. The air graphite generally showed a higher capacity than the pristine graphite, especially at a high C-rate. Among all air graphite samples, air graphite 850 showed the best result at 6C (83%) and 10C (73%) charging. Figure 6b is the delithiation (Li-output from anode) rate capability of the pristine graphite and air graphites 650, 750, and 850. The cells were charged from 2.5 to 4.2 V at 0.1C and then discharged from 4.2 to 2.5 V at 0.1C, 0.2C, 0.5C, 1C, 2C, 3C, 4C, 6C, 8C, and 10C. The capacity at every C-rate is plotted in Figure 6b. It can be observed that the cells with air graphite showed almost the same discharge rate capacity, and this capacity was better than that of the pristine graphite. This is because the kinetics of discharging not only depended on the Li-output of the anode side but were limited by the rate of the Li-input of the cathode side. We used the same cathode materials for this rate test, which is why air graphites 650, 750, and 850 showed the same discharge rate capability.
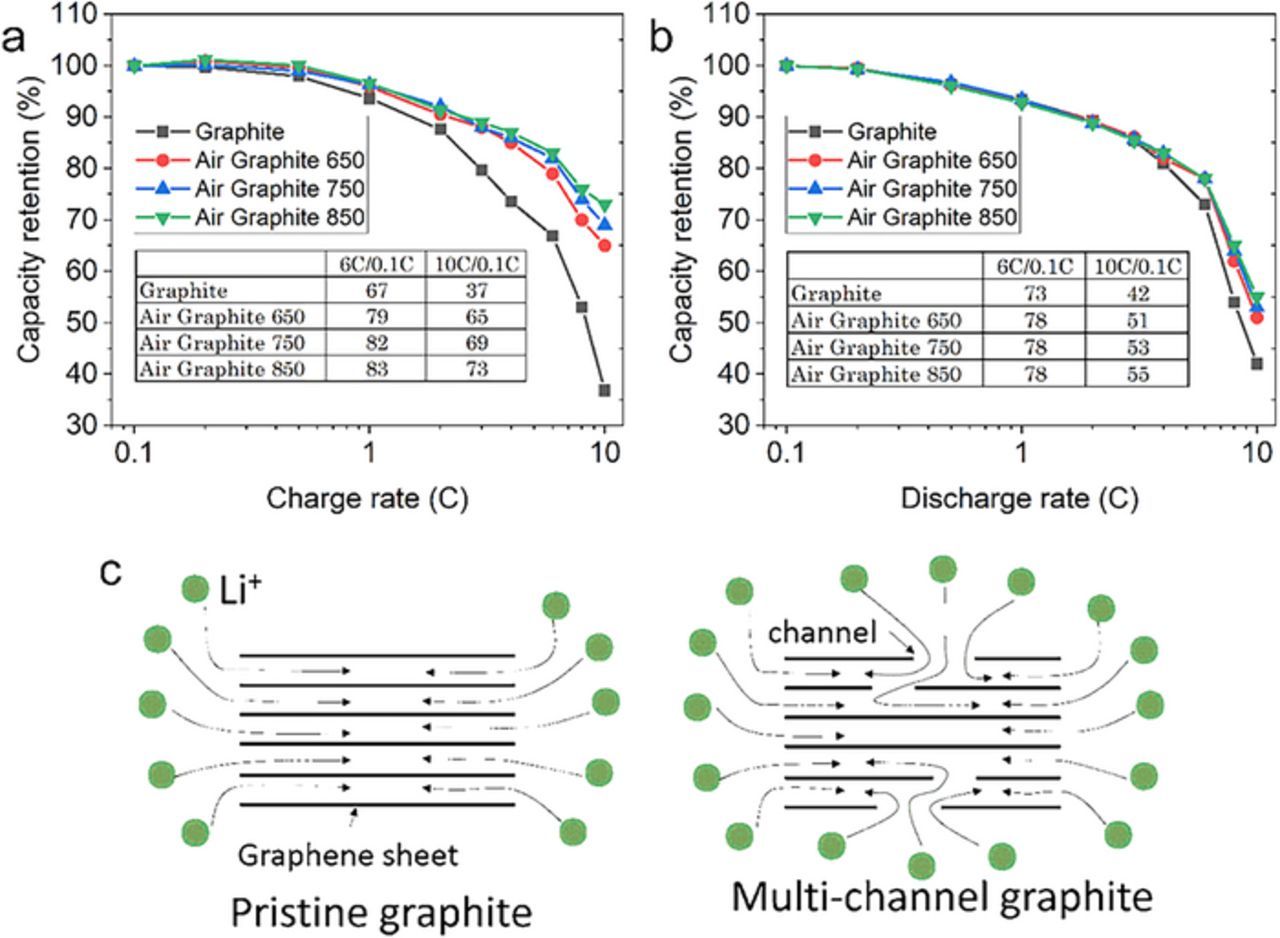
Figure 6. Full cell rate capability. a) Charging (Li-input) rate capability. b) Discharging (Li-output) rate capability. c). Schematic diagram of pristine graphite and multi-channel graphite, respectively.
The excellent rate capability of air graphite may be attributed to the following two reasons. First, the graphite surface channels could increase the sites for intercalation and deintercalation during charge and discharge. Second, the solid state diffusion path of lithium ions was shortened by the multi-channel structure. The lithium ion intercalation and diffusion in the pristine graphite and multi-channel graphite are shown in Figure 6c.
Electrochemical impedance spectroscopy (EIS) was used for impedance analysis to clarify the impedance response of the cells.17,18 The AC impedance of the pristine graphite and air graphites 650, 750, and 850 were characterized by in symmetric-cell configurations in SOC50 (graphite/graphite, air graphite 650/air graphite 605, air graphite750/air graphite 750, air graphite 850/air graphite 850). We propose an equivalent circuit, shown in Fig. 7a, for this cell that has components and interfaces equivalent to those in lithium ion batteries. The electrochemical reactions of a symmetric cell are expressed with two parts in a series. One part is attributed to SEI. Lithium ions were assumed to move into SEI by migration. The impedance component representing the SEI was made into a parallel connection of the resistance and the capacitance of the SEI layer.19–21 The other part was a parallel connection of the interfacial capacitance and the connected charge transfer resistance with Warburg impedance in a series. The circuit also contains an equivalent serial resistance (Rs) and an external inductive component consisting of an inductor (L) related to the wiring between the electrodes with the measuring equipment, including the scratched current collector. The variation of the capacitance in particles are represented as the constant phase element (CPE).
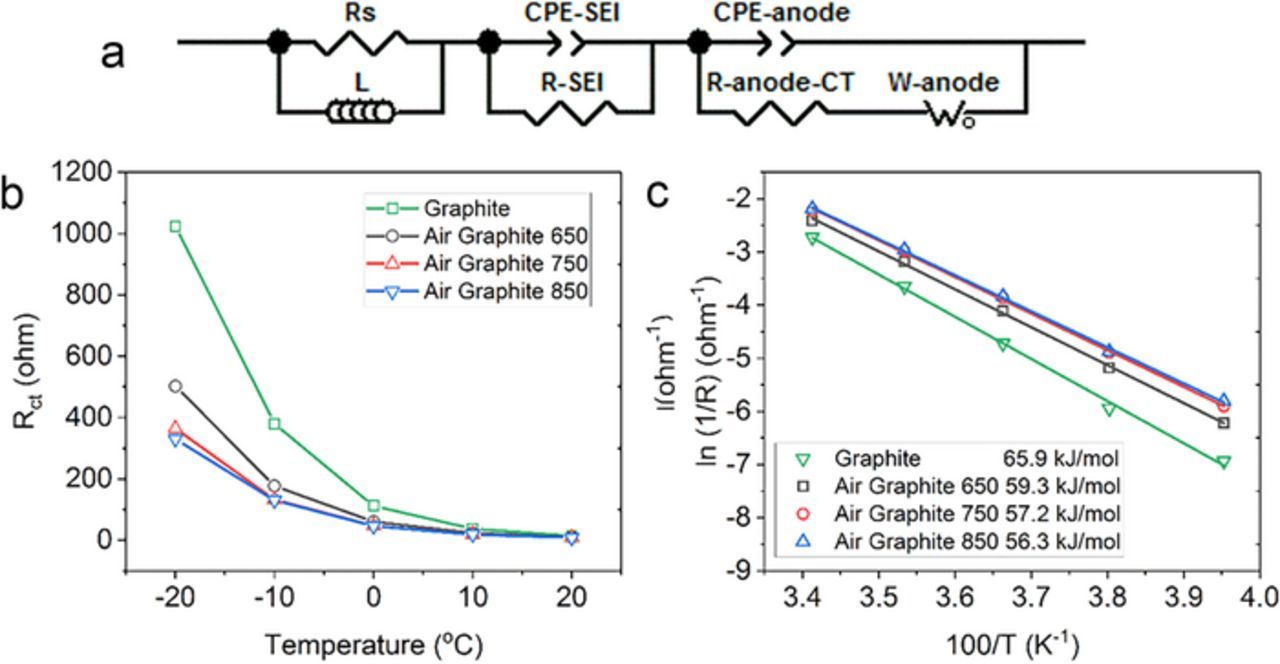
Figure 7. a) Equivalent circuit of symmetric cell. b) Charge transfer resistance vs. temperature. c) Arrhenius plot of charger transfer resistance with activation energy.
Figure 7b shows the fitting data of the charger transfer resistance with temperatures ranging from −20 to 20°C. The graphite with a multi-channel surface structure showed a lower charge transfer resistance compared with the pristine graphite. For example, air graphite 850 had a charge transfer resistance of 330 Ω, while that of pristine graphite was 1024 Ω at the same temperature. The air oxidation of the pristine graphite decreased the charge transfer resistance by 68% at −20°C. An Arrhenius plot is shown in Fig. 7c. Good linearity was observed, and the activation energy of the lithium diffusion was calculated to be 56.3 kJ/mol (air graphite 850), which was less than that of the pristine graphite (65.9 kJ/mol). This result is consistent with the rate capability in Figure 6.
Figures 8a and 8b are the cyclability of the pristine graphite and air graphite 850. Figure 8a is a cyclability comparison of the pristine graphite and air graphite 850 at a 6C CC charge and 0.1C CC discharge for 100 cycles. No additives were used in the electrolyte. Air graphite 850 had a capacity retention of up to 95% after 100 cycles, while the pristine graphite had a capacity retention of only around 70% with the same cycling conditions. Figure 8b is a 3000-cycle durability test at a 6C CC charge and 0.1C CC discharge for air graphite 850. A 0.1 CCCV 0.02C cut charge and 0.1 CC discharge-capacity confirmation cycle was added every 50th cycle. It was determined that air graphite 850 had a capacity retention of almost 90% even after 3000 cycles. The retention dropped only 5% after 3000 cycles at 6C, which indicates the excellent cyclability of multi-channel graphite. This excellent cycling stability is attributed to the successful design and synthesis of the multi-channel structure, which has a reduced specific surface area and larger average pore size after air oxidization for better coulombic efficiency.
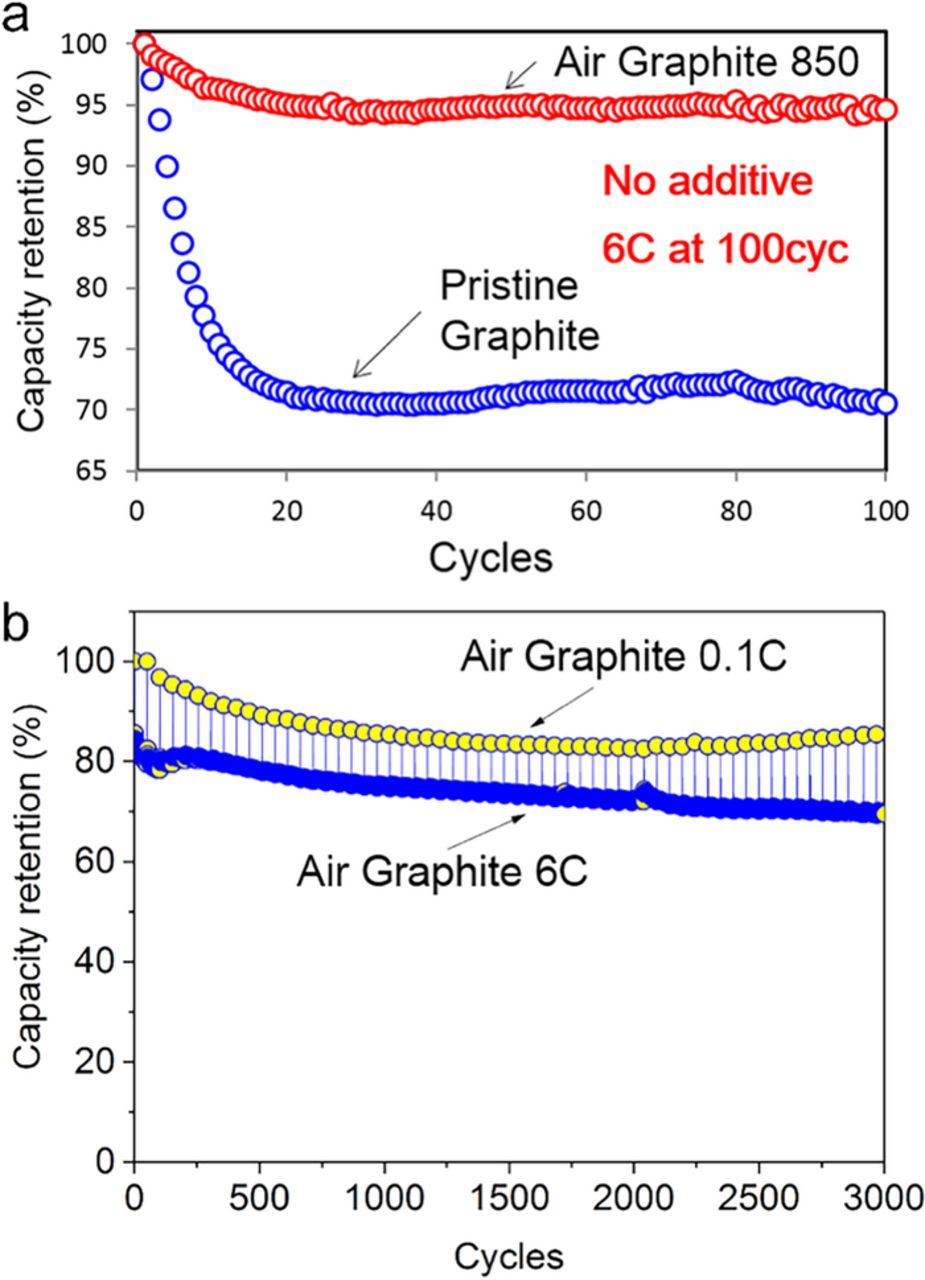
Figure 8. Cycling test of pristine graphite and air graphite. a) Cyclability comparison of pristine graphite with air graphite 850 at 6C for 100 cycles. b) 3000 cycles of air graphite 850 at 6C for charge durability test with 0.1C capacity confirmation every 50th cycle.
Conclusions
To increase the speed of charging and discharging, we designed and fabricated a graphite anode with a multi-channel structure by using a simple air oxidation process. The structure can increase the number and size of lithium intercalation and deintercalation sites and the accessibility of the internal part of the graphite of lithium ions with channels created on the surface while maintaining high coulombic efficiency. The anode showed an excellent charging and discharging rate capability. In addition, it showed excellent cyclability even at a high rate, which is very practical for real applications. This anode should be one of the most potential candidates for next generation Li-ion batteries that have a fast charging ability for electric vehicles and plug-in hybrid vehicles. As future work, we would like to optimize the activation process to further increase the property of graphite anode materials.
ORCID
Qian Cheng 0000-0002-4750-7859