

Abstract
The 18 650 and 21 700 cell format are state of the art for high-energy cylindrical lithium-ion batteries, while Tesla proposed the new 4680 format with a continuous "tabless" design as the choice for electric vehicle applications. Using an experimentally validated multidimensional multiphysics model describing a high energy NMC811/Si-C cylindrical lithium-ion battery, the effects of tabless design and cooling topologies are evaluated for 18 650, 21 700, and 4680 cell formats under varying charging protocols. Mantle cooling is found to be the most efficient cooling topology for a segmented tab design, whereas tab cooling performs equally well for tabless cells and achieves better performance for the 4680 format. By massively reducing polarization drops (approx. 250 mV at 3C) and heat generation inside the current collectors (up to 99%), the tabless design increases cell homogeneity and enables format-independent scalability of fast-charging performance with a tab-cooling topology. In addition, the 0 to 0.8 SoC charge time can be reduced by 4 to 10 min compared to cells with a segmented tab design, resulting in 16.2 min for the 18 650 and 21 700, and 16.5 min for the larger 4680 cell format.
Export citation and abstract BibTeX RIS

This is an open access article distributed under the terms of the Creative Commons Attribution 4.0 License (CC BY, http://creativecommons.org/licenses/by/4.0/), which permits unrestricted reuse of the work in any medium, provided the original work is properly cited.
Lithium-ion batteries (LIBs) are the key technology to meet the needs of next-generation electric vehicles (EVs), due to their high energy and power densities and lower costs. 1 However, widespread adoption of EVs is still impeded back by certain barriers such as effective driving range, 2 refueling times/charging rates, 3 battery lifetime, 4 and safety. 5
Adopting larger cell formats in order to maximize volumetric energy density at the cell and module level can increase vehicle range and reduce manufacturing costs, 6 but introduces new challenges, such as decreased cooling performance. 7 Optimizing macroscopic design aspects such as electrode geometry and tab design could potentially tackle the thermal problems of larger formats, while at the same time increase charging speeds, 8 safety, 9 and cycle life. 10
While many original equipment manufacturers focus on prismatic and pouch-type lithium-ion batteries, Tesla, the leader in global sales of EVs, utilizes the cylindrical cell format. 11 In 2019, the new Model Y was announced, which features batteries of a larger cylindrical format, the 4680. Together with the elimination of traditional tabs in favor of a continuous tabless design, Tesla promises to reach a higher range on pack level (+14%) while reducing cost per kWh (−14%) due to the form factor and tab design, and simultaneously increasing production speed. 12
In this work, we investigate the potential benefit of an optimized tab-design on the fast-charging behavior of cylindrical high-energy lithium-ion batteries. Our multidimensional, multiphysics modeling framework (MuDiMod) is extended to include the top and bot cap above/below the jelly roll with tab-dependent thermal conductivities, as well as the housing of the cell and previously neglected heat generation sources to more accurately predict 3D thermal behavior. A design study is conducted to investigate the effects of different cell formats (18650, 21 700, 4680) and tab designs (segmented, continuous/tabless) on fast-charge performance, cooling behavior, safety characteristics, and lifetime implications under various cooling topologies. In particular, the implications of a tabless design are characterized and theoretical fast-charge limits are highlighted. Finally, optimal cooling topologies and use cases are identified and format- and tab-specific scalability is evaluated at the module level.
Modeling and Simulation
The effects of tab design on lithium-ion battery performance, particularly current density distribution and heat generation in the current collectors, are well understood and discussed extensively in the literature. 10,13 Table I provides an overview of publications dealing with the effects of different tab designs on the behavior for the cylindrical cell format. As is evident, most authors consider only one specific format and focus on discharge performance, often for a high power density parameterization.
Table I. Overview of publications focusing on the effects of different tab designs on the performance of cylindrical lithium-ion batteries.
| References | FormatI | Tab Design | Application | C-Rate | Chemistry | TypeII | ModelIII |
|---|---|---|---|---|---|---|---|
| 14 | 18-650 | Multi-tab | discharge | 20 A | C/LMO | HP | ECM |
| 15 | 26-650 | Multi-tab | discharge | 10C | C/LFP | HP | exp. |
| 16 | 21-700 | Continuous | discharge | 3C | SiC/NMC-811 | HE | 3D el-th |
| 17 | 45-1300 | Continuous | discharge | 4C | C/NCA | HP | MSMD |
| 18 | 46-800 | Continuous | discharge | 1C | SiC/NMC-811 | HE | p2D+2D el-th |
| 10 | 44-1100 | Continuous | cycling | 4C | C/NMC-523 | HP | MSMD |
| 8 | 18-650 | Multi-tab | charge | 3C | SiC/NMC-811 | HE | MSMD |
| 21-700 | |||||||
| 26-650 |
a)18–650 = ⊘ 18 mm diameter and 65.0 mm height for the cylindrical cell format. b)HP = High-power density, HE = High-energy density. c)ECM = equivalent circuit model, exp = experimental, el-th = electrothermal, MSMD=multi-scale multi-domain model.
While Tranter et al. 18 used a high-energy cell with Tesla's new 4680 format in a direct comparison between a regular tab-based and a continuous current collector design, only 1C discharge performance for varying mantle cooling conditions was investigated. In addition, the model only resolves a 2D cross-section, which does not allow for an accurate 3D spatial consideration of tab hot spots.
Li et al. 16 studied the effects of single-tab and multi-tab variations up to a continuous "all-tab" design on discharge performance for a high-energy 21 700 cell format with a 3D electrothermal model. Furthermore, the influence of mantle cooling versus a top and base cooling strategy was investigated. However, the full 3D thermal cell model did not consider the effects of tab layout on axial thermal conductivity, e.g., better axial thermal conductivity for the continuous tabless design compared to a segmented tab design in the areas above and below the jelly roll.
To the authors' knowledge, there are no publications that examine the impact on fast-charging performance by switching from a regular tab design to a continuous tabless design in terms of electrochemical constraints (temperature, lithium plating), cell formats, and cooling strategies. Since inhomogeneity tends to increase for larger cell formats, spatially resolved 3D modeling becomes increasingly important for accurate prediction of cell behavior.
Multidimensional multiphysics modeling framework
A general overview of the MuDiMod framework is provided in Fig. 1 with the differential equation system shown in Table A·I. Since the basic functionalities have already been explained in detail in previously published works, 9,19 only the novel modifications are described here. The spatially resolved 3D thermal model of the full cell, used for local coupling of heat generation and temperature distribution for the 2D electrical model, is modified to include the regions above and below the jelly roll as well as the housing of the cell. This modification includes the addition of heat generation within the tabs as well as heat generation due to internal contact resistances between the tabs and the jelly roll and cell housing. A detailed cross-section view is shown in Fig. 1a. All domains of the 3D thermal model are meshed with a tetrahedral mesh, while the 2D electrical model uses a triangular mesh for the standard tab design and a quad mesh for the tabless design. The number of p2Ds used per model varies between 99 for the 18 650 to 207 for the 4680 cell format.

Figure 1. Overview of the MuDiMod framework (a), which consists of multiple p2D models, parallel connected via a 2D electrical model and a 3D thermal model. The p2Ds are coupled through electric potentials inside the current collectors, where the heat is cumulated and transferred via bidirectional coordination coupling to the 3D thermal model. The MuDiMod simulation cases incorporate three cell formats (18650, 21 700, 4680) and investigate the impact of tab design and cooling topology (b) on fast-charging performance through one CC and three MCC-CV fast-charging protocols (c).
Download figure:
Standard image High-resolution imageThe MuDiMod framework is based on the experimentally validated parameterization of an 18 650 high-energy SiC/NMC-811 (INR18650-MJ1, LG Chem) cell with a volumetric energy density of 713 Wh l−1, 20 shown in Table A·II and Table A·III. Thermal conductivity, density, and heat capacity for the upper and lower part of the 3D thermal model are derived from the simulation model published by Steinhardt et al. 21 and listed in Table II. Since no reference measurements or simulation data are available for the tabless design, values are estimated based on a parallel configuration of current collectors and argon (no overhang, polypropylene or steel). Finally, internal contact resistances are taken from the publication by Brand et al. 22 A combination of ultrasonic welding and resistance spot welding is assumed for the regular segmented tab design (tab to jelly roll and tab to housing), while press contact resistance is implemented for the tabless design.
Table II. Thermal parameters used in the modified 3D model for tabless and segmented tab design.
| Parameter | Unit | Jelly roll | Top cap | Bot cap | Case | ||
|---|---|---|---|---|---|---|---|
| Segmented | Tabless | Segmented | Tabless | ||||
| Heat capacity cp | J kg−1 K−1 | 944 c | 857 s | 525 c | 927 s | 502 c | 477 |
| Density p | kg m−3 | 2762 c | 1429 s | 133 c | 1690 s | 277 c | 7900 |
| Thermal conductivity λ∥ | W m−1 K−1 | 24.64 c | 0.59 s | 11.52 c | 0.53 s | 12.47 c | 14.6 |
| Thermal conductivity λ⊥ | W m−1 K−1 | 1.06 c | 0.59 s* | 0.02 c | 0.53 s* | 0.02 c | 14.6 |
c=calculated (analogous to Table A·II), s=simulated, *=adopted from in-plane conductivity, assumed to be a negligible error since through-plane is not the main thermal pathway, remaining values taken from Ref. 23.
Cylindrical cell formats, tab designs, and cooling topologies
Three cylindrical formats are considered in this study: the 18 650 and 21 700 cell formats, which represent the established state of the art for EV applications, and the novel 4680 format, which was introduced for the Model Y at Tesla's Battery Day 2020. 12 For each format, a segmented high-energy tab design based on the tab layout of the INR18 650-MJ1, and the continuous tabless design of Tesla's 4680 cells are examined. In the case of the segmented tab design, the layouts were designed considering the effective electrode length wele, defined as the maximum horizontal distance that electrons have to travel within the current collectors to reach a tab. The electrode dimensions and specific segmented tab layouts are given in Table III and are visualized together with the continuous tabless design in Fig. 2. For each format, a central void/mandrel space of 1 mm (rm=0.5 mm), a can thickness of 0.2 mm (dC), and 5 mm additional height for the top cap (hTC) and 2 mm for the bot cap (hBC) are assumed. 24
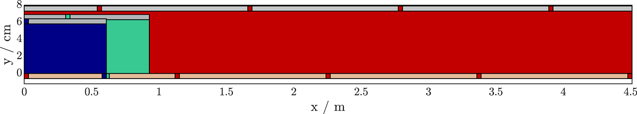
Figure 2. Comparison of the electrode and tab geometries for the 18 650 (blue), 21 700 (green), and 4680 (red) cell formats with the continuous tabless (aluminum/copper foil) and segmented tab design.
Download figure:
Standard image High-resolution imageTable III. Electrode dimensions, number and position of tabs as well as the effective electrode length of the 18 650, 21 700, and 4680 cell formats with segmented tab design.
| Format | Electrode size | Number of tabs | Position of tabs | Effective lengths | ||||
|---|---|---|---|---|---|---|---|---|
| Length | Height | + | − | + | − | + | − | |
| wele/cm | hele/cm | w+/cm | w−/cm | |||||
| 18 650 | 61.5 | 5.8 | 1 | 1 | {0} · wele | {1} · wele | 61.5 | 61.5 |
| 21 700 | 92.9 | 6.3 | 1 | 1 |

|

| 61.9 | 61.9 |
| 4680 | 451.1 | 7.3 | 4 | 5 |

|

| 56.2 | 56.1 |
In addition to varying tab designs and cell formats, a total of three cooling topologies are considered in this study. First, cooling of the lateral mantle surface, hereinafter also referred to as "M" cooling. Second, an equivalent to tab cooling, where cooling power is applied to the top and bottom of the cell, referred to as "T" topology. And finally, bottom cooling "B", which is a common cooling strategy at the module level in many modern battery electric vehicles. While bottom/"B" cooling is realized in the simulations via a constant temperature boundary condition, mantle/"M" and tab/"T" cooling are implemented through thermal convection and include heat transfer by radiation at the cooling surface.
The three cell formats, two tab designs, and three cooling topologies are tested with different charging protocols to derive optimal application strategies and characterize the potential improvements for high-energy cells in fast-charging applications with a tabless design approach.
Fast-charging simulation studies
The applied charging protocols are visualized in Fig. 1 and consist of one constant current (CC) and three multi-step constant current constant voltage (MCC-CV) simulations.
Simple CC charging simulations were carried out from 3.0 V to 4.2 V at 25 °C ambient temperature and 50 W m−2 K−1 "M" cooling from 0.1C to 3C for all three formats and both tab designs. Cell performances at 3C were evaluated to characterize the impact of tabless design on safety (thermal behavior) and aging (inhomogeneity, lithium plating).
The MCC-CV studies range from a state of charge (SoC) of 0 to 0.8 and are identical for each cell to allow a fair evaluation of fast-charge performance between the different formats and tab designs. Charging starts at 3.0 V with a 3C-CC phase until either 4.2 V or a maximum temperature or minimum anode potential criterion is reached. Both the temperature and anode potential criteria result in a stepwise reduction in current by 0.2C with a subsequent increase in temperature threshold by +1 °C in case of thermal limiting. After reaching 4.2 V, the protocol enters a CV phase until 80% of the nominal capacity, defined by standard charging according to the MJ1 data sheet, 25 is reached. Thus, the protocol aims to keep the cell within a safe operating window by preventing lithium plating and overheating while charging the cell to an SoC of 0.8 to allow comparability with fast-charging applications in electric vehicles. A total of three variations of the MCC-CV protocol were conducted.
First, a study of High-Power (HP) cooling at 25 °C and 40 °C ambient temperature was performed. A convective heat transfer coefficient αM of 100 W m−2 K−1 is applied for mantle/"M" cooling, while the value for tab/"T" cooling is adjusted accordingly to achieve equal cooling power:

All relevant values are provided in Table IV. The objective of this study is to determine the optimal cooling strategy for each format and tab design, characterize the thermal and electrochemical constraints/limitations, and investigate the impact on battery lifetime.
Table IV. Heat transfer coefficients, cooling areas of "M" and "T" topology, energy, and relative cooling power for the 18 650, 21 700, and 4680 cell formats used in the high-power cooling study.
| Format | Heat transfer coefficient | Area | Energy | Relative cooling power | ||
|---|---|---|---|---|---|---|
| αM | αT | AM | AT | Ecell | Pcool/Ecell | |
| /W m−2 K−1 | /W m−2 K−1 | /cm | /cm | /Wh | /W K−1 kWh−1 | |
| 18 650 | 100 | 711 | 37.4 | 5.3 | 12.2 | 30.7 |
| 21 700 | 100 | 641 | 48.1 | 7.5 | 20.0 | 24.1 |
| 4680 | 100 | 342 | 117.6 | 34.4 | 112.4 | 10.5 |
Second, active cooling was considered to further improve on charging times. The applied cooling topology for each format and tab design depends on the optimal case determined in the previous high-power study. The temperature threshold for activation and deactivation of convective cooling is set to 55 °C. Although this is relatively high, it is consistent with the initial temperature threshold of the HP charging study and allows better identification of format-dependent cooling constraints. Complementary isothermal simulations with a constant anode potential profile were conducted to identify optimal fast-charging times.
Finally, the effect of variability in cooling power on fast-charging performance was investigated with values ranging from 0.1 W K−1 kWh−1 to 50 W K−1 kWh−1 for the active cooling protocol. By scaling the cooling power to the energy of the respective cell format, a rough estimate of the required cooling capacity can be made at battery pack level and format-dependent cooling optima can be identified at the cell level.
Results and Discussion
Charge rate capability
To characterize the influence of the tabless design on rate capability for high energy lithium-ion batteries, CC charge simulations from 0.1C to 3C are performed for all three formats with mantle cooling at 50 W m−2 K−1. In Fig. 3, the normalized charged capacity at the end of charge (EoC) at 4.2 V is shown with both tab designs, segmented and tabless. Additionally, the right ordinate shows the benefit in charged capacity with a tabless approach for every format. While the charged capacity is very similar across the board for low C-Rates, the rate capability of tabless cells improves steadily with higher C-Rates compared to segmented design, resulting in a 19.1% increase in charged capacity at 3C for the 18 650, 21.0% for the 21 700, and 27.9% for the 4680 format. As shown in Table V, the main cause is a reduction in ohmic polarization, as the current flow in the current collectors and tabs causes an average voltage drop of 228mV to 286 mV for the cells with segmented design, compared to only 1 mV to 2mV for the tabless cells, increasing rate capability and energy efficiency.
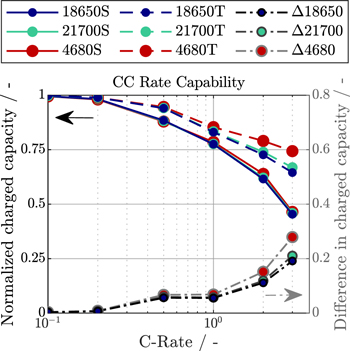
Figure 3. Constant current charge rate capability characterized by normalized charged capacity from 0.1C to 3C for the 18 650, 21 700, and 4680 formats at 50 W m−2 K−1 convective mantle cooling with segmented (S) and tabless (T) design, as well as the benefit for each format when using a tabless approach (Δ).
Download figure:
Standard image High-resolution imageTable V. Total heat generation and average cell polarization split between the through-plane (ec) part of the electrode and the in-plane resistive part within the current collectors and tabs (cc) , along with maximum spread in current density, temperature, and SoC at EoC for the 3C-CC rate capability simulations at 25 °C ambient temperature and "M" cooling topology at 50 W m−2 K−1 convective cooling. The equations for calculating the polarization values are given in Table A.4.
| Format | Heat Generation | Polarization | Inhomogeneity | |||||
|---|---|---|---|---|---|---|---|---|
| Qec | Qcc | Eec | Ecc | Δ Imax | ΔSoCEOC | Δ Tmax | Tmax | |
| /Wh | /Wh | /mV | /mV | /C-Rate | /% | /°C | /°C | |
| 18 650S | 0.44 | 0.29 | 367.7 | 228.2 | 0.75 | 8.66 | 12.7 | 65.5 |
| 18 650T | 0.75 | 0.003 | 404.5 | 1.4 | 0.16 | 2.73 | 5.4 | 50.7 |
| 21 700S | 0.72 | 0.50 | 360.1 | 237.2 | 0.62 | 7.25 | 7.9 | 66.4 |
| 21 700T | 1.24 | 0.005 | 389.9 | 1.6 | 0.19 | 3.38 | 7.3 | 55.1 |
| 4680S | 3.67 | 3.49 | 323.4 | 286.6 | 0.79 | 10.37 | 28.1 | 99.2 |
| 4680T | 6.89 | 0.05 | 337.2 | 2.2 | 0.17 | 3.18 | 18.3 | 77.3 |
Additional advantages of the tabless design include more uniform utilization of the electrode due to lower potential drops across the current collectors. The resulting lower gradients in the current density distribution, as well as shorter current pathways outward to the top and bottom of the electrode, lead to significantly reduced ohmic heat generation inside the current collectors and tabs. On average, Qcc is reduced by approx. 99% compared to the segmented tab design, resulting in both a lower average cell temperature and a lower maximum temperature gradient. While this can facilitate cell temperature control and allow prolonged operation at high C-Rates, heating the cell to optimal operating temperature may take longer if relying solely on intrinsic losses.
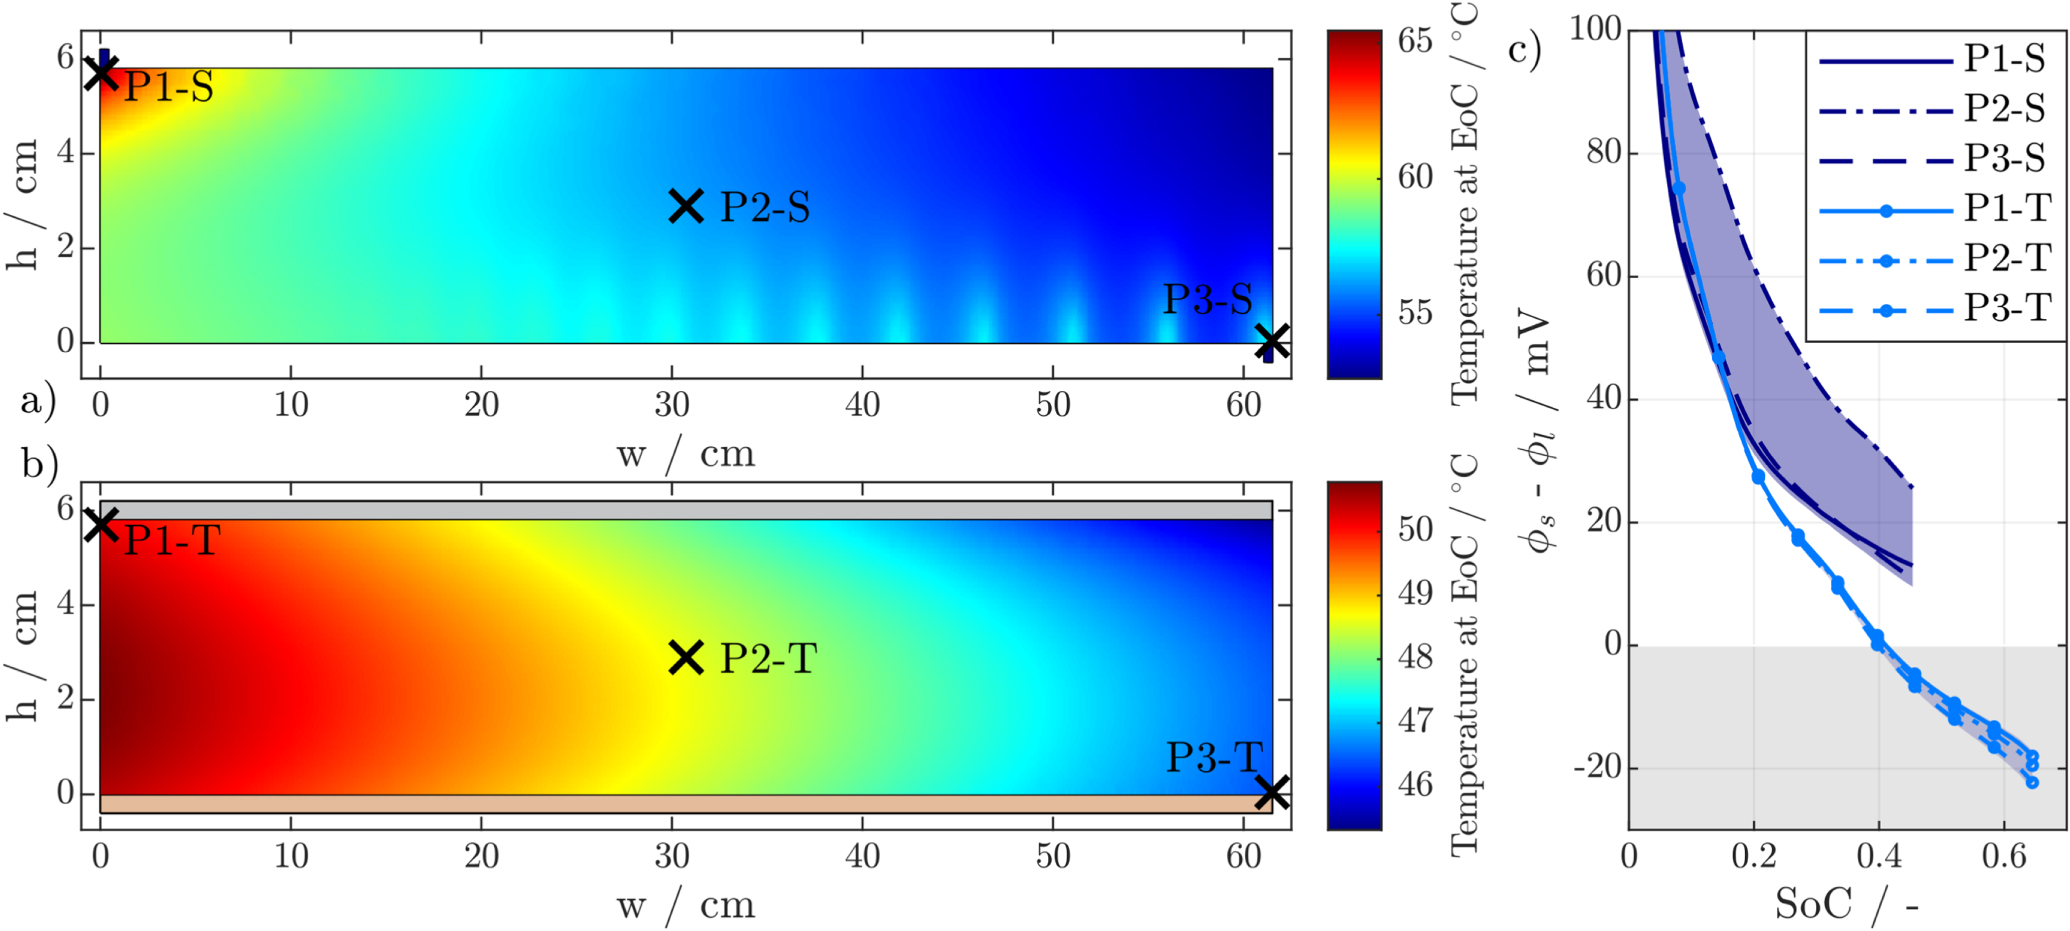
While reduced temperature gradients may be beneficial for battery lifetime, a reduction in cell temperature can lead to an increased risk of lithium plating due to lower anode potentials, as shown in Fig. 4c for the 18 650 format. Here, the tabless design falls below the threshold for lithium plating of (Φs − Φl) < 0 V after a SoC of 0.4 is reached. Furthermore, prolonged charging, possible due to lower cell polarization, leads to higher SoC values, which further increases the risk of lithium plating. In comparison, the voltage drop along the current collectors for the segmented design counteracts the risk of deposition on most of the electrode surface, as evidenced by a wider range of anode potentials. In addition, the lowest anode potentials are located near the positive or negative tab regions around P1 and P3 in Fig. 4a, where local temperature hot spots, caused by the current density distribution inside the current collectors, can help to counteract the onset of lithium plating.
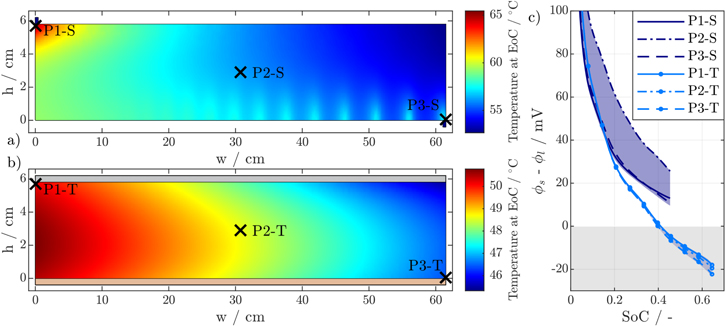
Figure 4. Temperature distribution at EoC of the 18 650 format with segmented (a) and tabless (b) design at 3C-CC charging from 3.0 V to 4.2 V and 50 W m−2 K−1 convective mantle cooling. The anode potentials over the SoC are evaluated at three different points P1 to P3 diagonally across the jelly roll (c).
Download figure:
Standard image High-resolution imageWhen comparing the charge rate capabilities between the three formats, there are no significant differences for the segmented tab design cells, while tabless cells show better performance with increasing size. Both observations are an effect of the higher operating temperatures of larger cell formats, caused by decreased coolability. This results in maximum cell temperatures of almost 100 °C for the 4680 with segmented tabs and 77 °C for the tabless design at 3C-CC, see Table V. A visualization of the temperature distribution across the electrode of the 21 700 and 4680 formats at EoC is provided in Fig. 5, together with the respective anode potentials over the SoC. It is evident that large-format high-energy lithium-ion batteries face serious thermal problems and risk overheating if a suitable cooling and charging strategy is not provided. In addition, even at elevated cell temperatures above 60 °C, the 4680 tabless cell is still susceptible to lithium plating toward the end of charge.
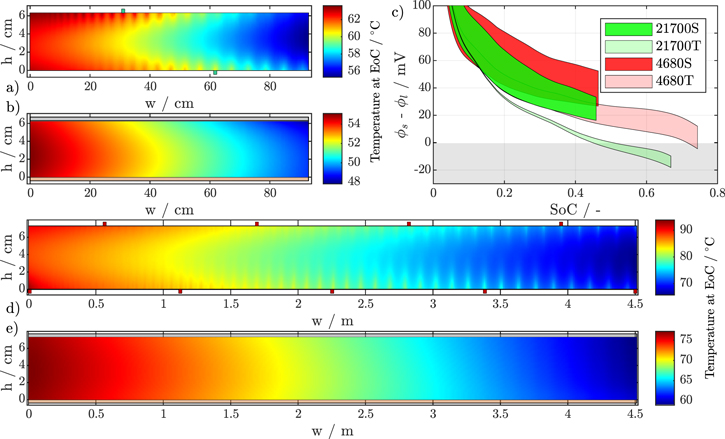
Figure 5. Temperature distribution at EoC of the 21 700 cell format with segmented (a) and tabless (b) design, and the 4680 cell format with segmented (d) and tabless design (e) at 3C-CC charging from 3.0 V to 4.2 V and 50 W m−2 K−1 convective mantle cooling. The anode potentials ranges are given over the SoC in (c).
Download figure:
Standard image High-resolution imageTo better assess the impact of tab design and cell format on fast-charging performance in a near-application scenario, the following simulation study is performed with an MCC-CV charging profile consisting of plating and temperature criteria that limit the charging rate stepwise by 0.2C to avoid operation in detrimental conditions. Simulations were performed at an ambient temperature of 25 °C, and also at 40 °C to investigate the effects of reduced cooling power and preheating on charging performance.
High-power cooling study
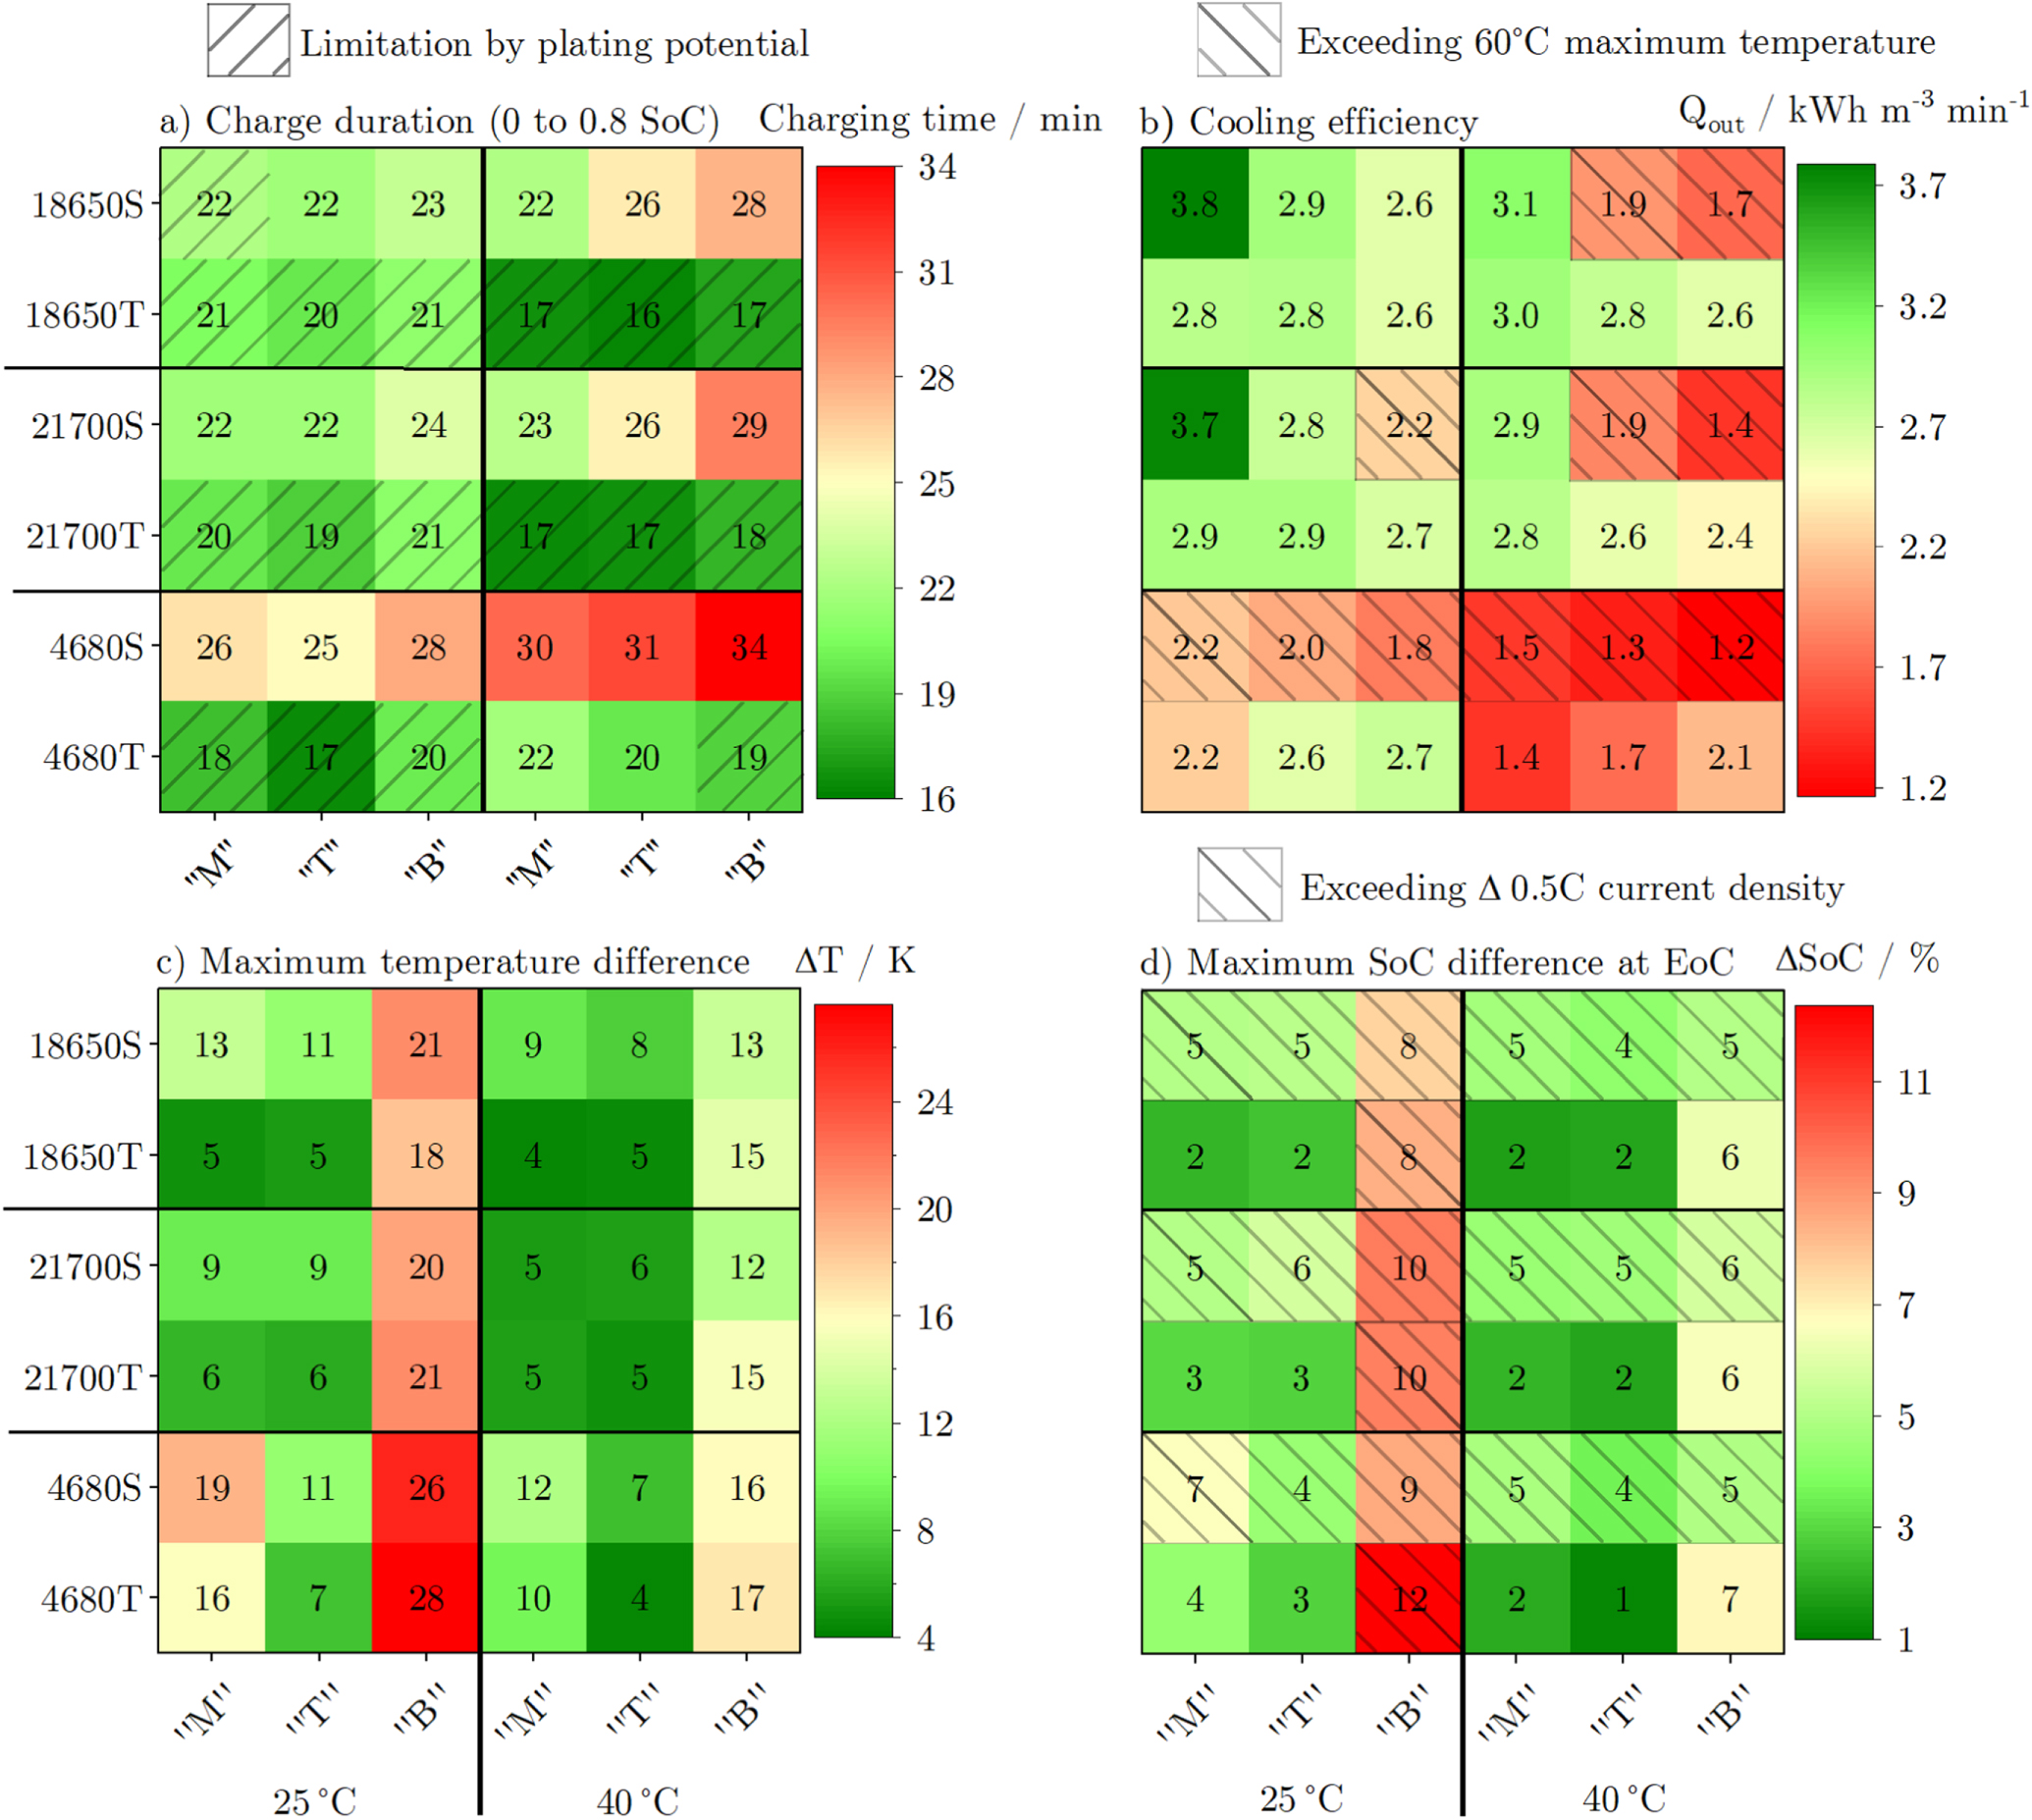
The voltage curves, current profiles, maximum cell temperatures, and minimum plating potentials for each simulation of the high-power cooling study are shown in Fig. A·1 and Fig. A·2 in the appendix. To provide a qualitative assessment of overall fast charge performance, optimal cooling topology, and potential impact on battery life with respect to cell format and tab design, four key performance indicators (KPIs) are selected for discussion: charge time to 0.8 SoC, cooling efficiency, maximum temperature spread across the jelly roll, and the local SoC spread across the electrode at EoC. The KPIs are visualized as heatmaps in Fig. 6.

Figure 6. Results of the high-power cooling MCC-CV simulation study for the 18 650, 21 700, and 4680 cell formats for three different cooling typologies (mantle cooling/"M", tab cooling/"T", constant temperature bottom cooling/"B"), two different ambient temperatures (25 °C and 40 °C), as well as two different tab designs (suffix S for segmented, T for tabless/continuous). The subplot (a) shows the total charging time from 0 to 0.8 SoC. The subplot (b) shows the cooling efficiency defined as the total heat extracted per minute and per cell volume. The subplots (c) and (d) show the maximum temperature difference across the jelly roll as well as the maximum spread in local cathode SoC at EoC (averaged over thickness) across the electrode surface.
Download figure:
Standard image High-resolution imageFast-charge performance The simulated charging times from 0 to 0.8 SoC are shown in Fig. 6a, and vary between 16 and 34 minutes. Across the board, the tabless design outperforms the segmented tab design with regard to charging speed. Especially at elevated ambient temperatures of 40 °C, where both convective cooling at the surface and heat transfer inside the cells become less efficient due to lower temperature gradients, the tabless formats perform exceptionally better. This is explained by shorter current pathways inside the positive and negative current collector and has two major effects: on the one hand, shorter current pathways lead to significantly reduced heat generation inside the cell and therefore a reduction in charge current due to thermal limitations is less likely to occur. On the other hand, polarization losses are reduced, which leads to a delayed transition into the CV phase and thus allows for longer charging at higher C-Rates.
Larger formats tend to have slower charge speeds, which is especially the case for cells with segmented tab design. In general, thermal properties deteriorate with increasing cell size, as a lower surface-to-volume ratio and longer thermal paths complicate heat dissipation. This can be observed in particular for the 4680 format, where charging times are up to 4–7 min longer than for the smaller formats under the same conditions.
Optimal cooling topology The cooling efficiency is introduced as an objective evaluation of the effectiveness of the applied cooling topology and is shown in Fig. 6b. It is defined as the average amount of heat removed from the cell per minute of charge time and per volume of cell format. Using this metric to select the optimal cooling topology in relation to tab design, cells with segmented configuration, regardless of format or ambient temperature, achieve the best results with mantle cooling. At the same time, the choice of cooling topology makes no significant difference for the smaller tabless cells, while 4680 cells with tab cooling achieve a significantly better result.
Generally, cooling efficiency drops for larger cell formats because of the aforementioned decrease in thermal cooling properties. Nevertheless, tab cooling topology scales comparatively better with increasing cell sizes, since the cylindrical format tends to increase mainly in diameter and not much in height. Thus, the thermal pathways through the top and bottom of the cell become only marginally longer, while those in radial directions increase significantly. For segmented tab designs, however, thermal conductivities above and below the jelly roll are not very high, making the practical application of tab cooling very inefficient. In contrast, tabless cells, with their continuous current collector design, have a much higher thermal conductivity, which allows efficient scaling with cell size.
Finally, constant temperature bottom cooling "B" was considered because this cooling mechanism is used in many current modern battery packs inside electric vehicles. While the values in terms of cooling efficiency were below the "M" and "T" topology for almost every case, the 4680 tabless format forms the exception and achieves its optimal performance for both ambient temperatures with this cooling topology.
Inhomogeneity Analysis of the temperature and current gradients can help to characterize the impact of fast charging on battery lifetime. In general, the behavior of the current density distribution across the electrode, and consequently the resulting SoC gradient at the end of charge, is closely coupled to the temperature gradients that occur. Since, according to Arrhenius' law, temperature has a positive influence on the electrochemical properties of the cell, a large temperature difference within a cell also leads to elevated local gradients in the current density. Thus, over the charging process, the local SoC increasingly drifts apart along the electrode surface. This is shown by a visible correlation between temperature and SoC difference in Figs. 6c and 6d.
With the exception of bottom cooling, the tabless design shows better behavior for all formats and ambient conditions in terms of temperature and SoC spreads. While the maximum temperature difference is reduced by 3 °C to 8°C compared to the segmented tab design, the SoC difference at EoC is only about half as large on average. Furthermore, no tabless cell format with mantle or tab topology exceeds a current density spread across the electrode of 0.5C during charging, with most well below 0.2C, whereas every single simulation with a segmented tab design crosses this limit.
In general, the temperature spread across the electrode that occurs under cooling increases with larger cell sizes because of longer thermal paths. However, the 18 650 format tends to have higher values than the 21 700 format despite its smaller size. Although this may seem counterintuitive at first, it can be explained by the different positions of the tabs and the resulting location of temperature hotspots in the jelly roll. The position of the positive tab for the 18 650 format at 0 wele is almost exactly at the center of the cell, while for the 21 700 format it is located at 1/3 wele, which correlates to a position at about 65% of the total cell radius, thereby reducing the distance between tab position and mantle surface. Additionally, the position of the heat generation hotspot caused by the positive tab in the 21 700 format does not match the actual temperature hotspot of the cell (located at the center, see Fig. 5a, resulting in lower temperature gradients across the cell diameter. Regarding the impact of format size on SoC spread at EoC, no noticeable correlation was found due to similar effective electrode lengths as well as only minor increases in electrode height across all formats.
While the mantle and tab cooling topologies have similar effects on the maximum SoC spread, tab cooling performs better in mitigating internal temperature differences. In contrast, bottom cooling leads to a significant increase in temperature inhomogeneity with values more than twice those of other cooling topologies, due to significantly longer thermal conduction paths. Since high temperature gradients have a detrimental effect on aging, bottom cooling should be avoided in the interest of long battery lifetimes.
Active cooling strategy and current profile optimization
To achieve optimal fast-charging performance, it is important to keep the cell temperature within a certain range, e.g., high enough for improved electrochemical performance and plating mitigation, but low enough to reduce safety and aging risks due to thermal runaway or harmful side reactions. The use of active cooling (AC) can help to better control the operating temperature range of lithium-ion cells. This Section examines the effectiveness of an MCC-CV active cooling protocol in terms of scaling up to larger cell formats and the potential improvements achieved by using a tabless design instead of a segmented tab design. The threshold for activation and deactivation of applied cooling is set to 55 °C maximum cell temperature and the applied topologies vary between mantle/"M" and tab/"T" cooling for each format, depending on which was determined to be the most efficient in the previous section. In addition, isothermal MCC-CV simulations at 55 °C are presented to characterize fast-charging performance independent of a cooling strategy. The resulting differences in charging time between AC and isothermal simulations can serve as an indicator of the severity of thermal constraints on the charging speed. Finally, simulations are extended to include a constant anode potential current profile under isothermal conditions that represents the theoretical fastest charging time achievable without the occurrence of lithium plating. This best-case scenario can be used as a measure of the degree of optimization.
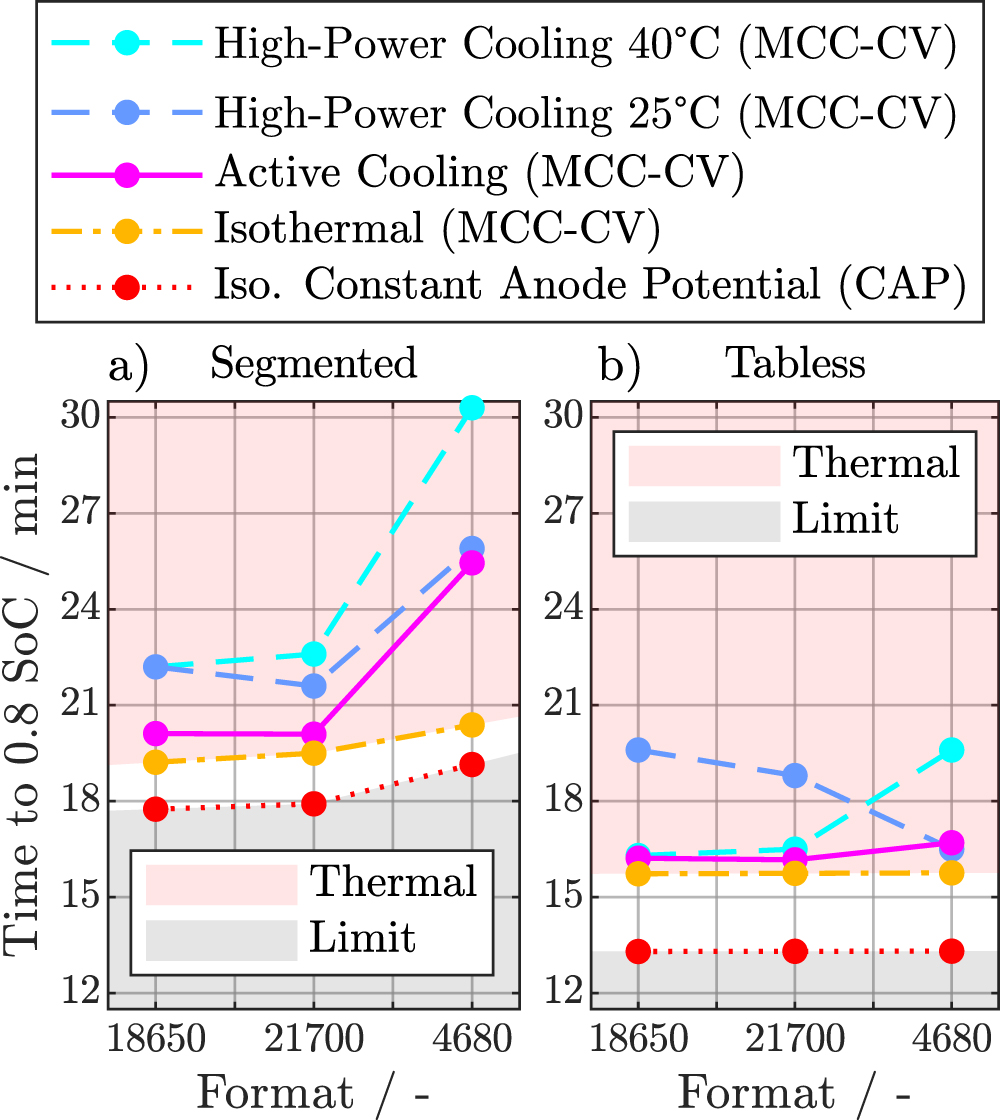
Figure 7 provides a direct comparison of the fast-charging times from 0 to 0.8 SoC for the different simulation studies presented in this paper in dependence of cell format and tab design. While an AC protocol can improve charging times for the smaller 18 650 and 21 700 cell formats with segmented tab design by up to 2 min compared to the previous HP cooling study, the larger 4680 format is still severely limited in charging speed by its thermal behavior, as indicated by the time difference between the AC strategy and the isothermal simulation. On the other hand, cells with a tabless design not only achieve faster charging times in comparison to the segmented design, e.g., almost four min for the 18 650 and 21 700 cell formats, but also scale better toward larger cell sizes, with only 0.5 min of additional charge time for the 4680 format. Using the aforementioned differences between AC and isothermal conditions as an indicator for thermal constraints, the tabless design shows good thermal performance with only minor room for improvement across all formats.
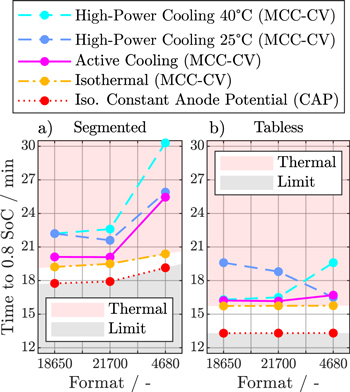
Figure 7. Comparison of the fast-charging times from 0 to 0.8 SoC for the 18 650, 21 700, and 4680 cell formats achieved under high-power cooling (MCC-CV) at 25 °C and 40 °C ambient temperature, under active cooling (MCC-CV) at 25 °C ambient temperature (MCC-CV), and under isothermal conditions (MCC-CV) at 55 °C for the segmented tab design (a) and tabless design (b). Additionally, a constant anode potential current profile (CAP) under isothermal conditions at 55 °C is shown as reference. The red area indicates possible improvements by optimizing the thermal management, while the gray area depicts charging times that cannot be achieved due to limitation by either lithium plating and/or cell polarization.
Download figure:
Standard image High-resolution imageIf fast-charging times similar to the isothermal conditions are to be achieved, either the operating strategy or the cell design have to be optimized. In the first case, preheating the cell before charging to reduce the increased polarization losses at lower operating temperatures could be an option. However, it is important to determine the optimal temperature value, as excessive preheating might lead to safety problems (overheating) later during the fast charging. In addition, the cooling strategy should be designed to dissipate as little heat as possible but also as much as necessary, while choosing a cooling topology that minimizes temperature gradients inside the cell. For the latter, the use of a continuous tabless design is helpful in two ways: first, current density and temperature inhomogeneity are reduced, and cooling in the axial direction is more efficient due to improved thermal conductivity. Second, the required power of the cooling system is reduced due to the massive reductions of ohmic polarization losses in the current collectors.
In Fig. 8, voltages curves, current profiles, temperature, and plating potentials are exemplarily shown for the 4680 cell format (see Fig. A·3 for the 18 650 and 21 700 formats) for both tab designs and AC strategy along with the isothermal CAP profiles. As can be seen in subfigures (b) and (c), the tabless design with AC strategy is able to effectively regulate the temperature of the cell with only one current-reduction step, while the segmented design is severely limited by its comparatively poorer thermal performance and cannot keep the maximum cell temperature below 60 °C. This results in multiple stepwise current reductions and a total charge time difference of nearly 9.5 min compared to the tabless design. However, there is no risk of lithium plating, whereas the tabless design is limited twice by the minimum anode potential approaching 0V.
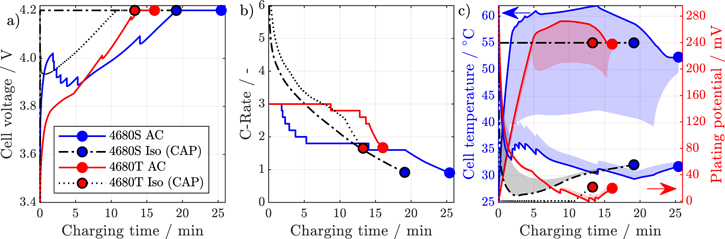
Figure 8. Comparison between the fast-charging simulation studies with active cooling at 25 °C ambient temperature and the isothermal constant anode potential optimal current profile at 55 °C for the 4680 cell format with segmented and tabless design. The voltage curves are shown in (a), the current profiles in (b), and the temperatures and plating potentials across the electrode in (c) with the maximum temperature and minimum potential in solid lines respectively.
Download figure:
Standard image High-resolution imageAs shown by the isothermal CAP simulations, two different limiting mechanisms prevent further improvements in charge time: The tabless 4680 cell is limited by the anode potential in order to prevent lithium plating, while the segmented tab design is limited by cell polarization and immediately transitions into a CV phase at the start of charging. At this point, further improvements are only possible if the polarization that occurs is reduced either by further increasing the operating temperature or by improving the electrochemical properties, e.g., by reducing the electrode thickness or increasing the cell porosity. However, this would lead to accelerated cell aging or a decrease in energy density and is therefore not investigated further in this publication.
In summary, the tabless design with the given AC protocol offers improved performance and scalability to larger cell formats due to better thermal behavior and increased homogeneity compared to the segmented design. While isothermal simulations suggest further optimization potential with a CAP profile, they represent a best-case scenario and direct transfer of simulation results to practical applications should be done with caution.
Varying cooling power
Finally, the heat transfer coefficient was scaled to the energy of the cell format and varied, resulting in a total cooling power between 0.01 W K−1 kWh−1 and 50 W K−1 kWh−1 for the AC strategy. Scaling the cooling power to the energy of each cell format enables an estimate of the required dimensions of the cooling system at the battery pack level. In Fig. 9, the time to 0.8 SoC is given over the applied peak thermal cooling power for all three cell formats, both tab designs, and for the mantle/"M" and tab/"T" cooling topologies. For the segmented tab design the "T" cooling topology was neglected due to the poor performance.
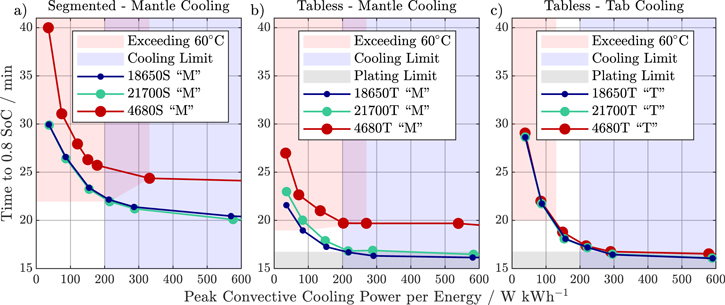
Figure 9. Simulation results for the active cooling fast charging study with varied convective cooling power from 0.01 W K−1 kWh−1 to 50 W K−1 kWh−1 for the 18 650, 21 700, and 4680 cell formats. The charging time to 0.8 SoC is depicted over the applied peak cooling power per energy W kWh−1 for segmented tab design with mantle cooling topology in (a), tabless design with mantle cooling topology in (b), and tabless design with tab cooling topology in (c). Simulations that exceed 60 °C maximum temperature are indicated in red, simulations that are limited in their charging speed by lithium plating are shown in gray, and simulations that exceed a cooling threshold (equivalent to 20 kW or more peak thermal cooling power for a 100 kWh battery pack) are depicted in blue.
Download figure:
Standard image High-resolution imageThe shape of the charging-speed curves shown is characterized by the thermal behavior of the cells at low cooling power. Here, the AC protocol is unable to effectively regulate the maximum cell temperature, and values exceed 60 °C. As the applied cooling power increases, charging time decreases until the performance of the cell is no longer limited primarily by external factors (cooling power), but by internal cell behavior, such as temperature gradients, effectiveness of thermal conduction, cell polarization, and anode potentials.
Applying a mantle cooling topology, the 18 650 and 21 700 cell formats show almost the same behavior with only negligible differences regardless of tab design, while the larger 4680 cell format performs comparatively worse due to the aforementioned poorer thermal behavior. However, by combining a tabless design and a tab-cooling topology, identical charging speeds can be achieved for the same applied cooling power per energy (see Fig. 9c), resulting in format-independent scalability because the cooling surface increases proportionally to the cell volume alongside only marginal increases in thermal path lengths.
To better asses the applicability in an EV vehicle, a cooling limit is introduced, which corresponds to a maximum thermal cooling power of 20 kW for a hypothetical 100 kWh battery pack (200 W kWh−1). While all three cell formats with segmented design and mantle topology have no overlap between safe operation (<60 °C) and realistic cooling power with the given AC protocol, switching to a tabless design allows a "sweet spot" for the smaller cell formats. Here, theoretical fast-charging times of 16 min and 41 s and 17 min and 04 s for the 18 650 and 21 700 formats are achievable. With tabless design and tab cooling, all cell formats can be safely charged, however the charging speeds of the smaller 18 650 and 21 700 cell formats at comparable peak cooling power are lower than with a mantle cooling topology. This is mainly due to the fact that the "M" topology creates higher temperature gradients (in the radial direction), which leads to lower average surface temperatures and thus lower peak cooling power at the same maximum cell temperatures compared to the "T" topology. However, with increasing format size, thermal conduction eventually limits the cooling capabilities, and switching from "M" to "T" topology yields better results.
Lastly, it should be noted that fast-charging performance on the cell level does not translate directly to the battery pack level due to electrical (parallel connections, differing capacities and resistances) and thermal (temperature of the cooling medium) spreads, cross effects between those two, and/or other limitation effects not present in the cell model. Additionally, the active cooling temperature threshold of 55 °C used in this study represents a "worst-case" scenario. At a more moderate temperature condition, e.g., 40 °C, optimal fast charging times could be achieved at lower peak cooling powers than presented here. Also, to achieve an equivalent cooling capacity with the "T" topology compared to the "M" topology, higher heat transfer coefficients are required, which may be more difficult to realize.
Conclusion
The effects of a tabless current collector design were investigated for cylindrical high-energy lithium-ion batteries of different state of the art formats (18 650, 21 700, 4680). By applying various cooling topologies and simulating multiple charging protocols, the overall fast-charging performance, cooling behavior, lifetime implications, and theoretical optima were characterized.
CC-charge simulations showed significantly improved performance at higher C-Rates for cells with a continuous tabless design compared to a segmented tab geometry. At 3C-CC from 3.0 V to 4.2 V, the average polarization drop across the current collectors is reduced by 225 mV to 284 mV and the heat generation inside the current collectors is reduced by up to 99%, resulting in capacity gains of up to 19.1%, 21.0%, and 27.9% for the 18 650, 21 700, and 4680 cell formats, respectively. However, due to higher SoC values at EoC, reduced potential drops across the current collectors, and lower average cell temperatures, lithium plating is more critical. Single p2D modeling can be used for smaller formats (18 650/21 700) and continuous current collector designs due to lower temperature gradients and smaller spreads of the anode potential. However, segmented tab design, regardless of the cell format, and continuous tab design for larger cell formats (4680) exhibit greater thermal inertia, higher electrical and electrochemical polarization effects, and greater inhomogeneity in the cell, making locally resolved models essential for accurate prediction of cell behavior.
The evaluation of the high-power cooling strategy revealed that the mantle topology is the best choice for cells with a segmented tab design, regardless of format. However, tab cooling achieves similar performance for cells with a tabless current collector design and smaller (18 650/21 700) formats, and is superior for the larger 4680 tabless cell format. In general, the mantle cooling performance for cylindrical cells diminishes for larger cell sizes because the surface-to-volume ratio decreases, reducing the relative effective cooling surface area and increasing thermal path lengths (cell radius). With tab cooling, the geometry of the 4680 cell format allows the cooling surface area to scale almost proportionally to the cell volume compared to the smaller formats, with only a slight increase in the maximum heat conduction length (cell height). While bottom cooling with a constant temperature boundary condition could be applicable for tabless cells due to the increased thermal conductivity in axial direction, the resulting cell behavior proved to be significantly more inhomogeneous, suggesting potentially detrimental effects on battery lifetime.
Active cooling was considered to improve charge times compared to the previous high-power cooling study. For all cell formats with the given segmented tab design, fast-charging from 0 to 0.8 SoC is limited to over 20 min due to polarization and thermal limitations, with a substantial decrease in performance for the larger 4680 cell format. Significant improvements are possible by switching to a tabless design, resulting in 16.2 min for the 18 650 and 21 700 cell formats and 16.5 min for the 4680 cell format, reducing the overall charge time by 4 to 10 min while allowing for format-independent scalability of charging performance. Further optimization of the current profiles indicate theoretical charge times of less than 14 min for the tabless cells under isothermal conditions from 0 to 0.8 SoC, with the onset of lithium plating being the limiting factor. However, due to possible inaccuracies in anode potential prediction and thermal gradients during operation, it is unlikely that these charge times can be achieved in real applications without elevated rates of aging.
Finally, variable cooling power was investigated to determine pack-level scalability as a function of format and tab design. Considering the limited cooling power in a battery pack and the prolonged charge times due to electrical and thermal spreads between the cells, as well as other effects not included in this study, a continuous current collector design is the best approach if a 20-minute pack-level charge time from 0 to 0.8 SoC is to be achieved. Additionally, for optimal pack-level performance, tab cooling should be considered for tabless high-energy lithium-ion cells of larger cylindrical formats such as the 4680.
In summary, the tabless design helps to improve the charging performance of high-energy lithium-ion cells by reducing polarization and ohmic heating, enabling better scalability to larger cylindrical formats, and improving overall cell homogeneity. This is particularly beneficial for EV applications, where the currently used 18 650 and 21 700 cell formats result in a high number of parallel connections in order to achieve the desired battery pack capacity, facilitating cell-to-cell inhomogeneity during operation. Moving to larger formats such as the 4680 lowers the required number of parallel connections and shifts the focus from inter-cell inhomogeneity to intra-cell behavior.
Nomenclature I.
| Greek symbols | ||
|---|---|---|
| α | — | Transfer coefficient |
| αconv | W m−2 K−1 | Heat transfer coefficient |
| β | — | Bruggeman coefficient |
| ε | — | Volume fraction |
| εrad | 0.75 | Radiation emission coefficient |
| η | V | Overpotential in Butler-Volmer kinetics |
| κ | S m−1 | Ionic conductivity |
| λ | W m−1 K−1 | Heat conductivity |
| ρ | kg m−3 | Mass density |
| σ | S m−1 | Electrical conductivity |
| σb | 5.67·10−8 W m−2 K−4 | Stefan-Boltzmann constant |
| τ | — | Tortuousity |
| Φ | V | Electrical potential |
| Indices | ||
| a | Negative electrode (Anode) | |
| act | Active area of anode and cathode overlap | |
| AM | Active Material | |
| app | Globally applied | |
| arc | Arc-length of archimedial spiral | |
| BC | Bottom Cap | |
| c | Positive electrode (Cathode) | |
| C | Can | |
| cc | current collector | |
| CC | Ohmic in-plane | |
| CR | Contact Resistance | |
| con | Heat conduction | |
| conv | Heat convection | |
| eff | Transport corrected (Bruggeman correlation 26 ) | |
| EC | Electrochemical through-plane | |
| ele | Electrode | |
| eq | Equilibrium | |
| g | Gravimetric | |
| l | Liquid phase | |
| m | Mandrel | |
| rad | Heat radiation | |
| r | Reaction heat | |
| ref | Reference | |
| rev | Reversible heat | |
| s | Solid phase | |
| sep | Separator | |
| ss | Active particle surface | |
| stack | Electrode stack | |
| TC | Top Cap | |
| + | Positive current collector | |
| − | Negative current collector | |
Nomenclature II.
| Latin symbols | ||
|---|---|---|
| a | m−1 | Specific surface |
| A | m−1 | Active cooling surface |
| bg | mAh g−1 | Maximum theoretical loading |
| c | mol m−3 | Concentration of lithium-ions (Li+) |

| mol m−3 | Maximum theoretical concentration of Li+ |
| cp | J kg−1 K−1 | Heat capacity |
| d | m | Thickness |
| D | m2 s−1 | Diffusion coefficient |
| Eeq | V | Equilibrium potential vs. Li/Li+ |
| f± | — | Mean molar activity coefficient of electrolyte |
| F | 96 485 As mol−1 | Faraday's constant |
| h | m | Height |
| i | A m−2 | Current density |
| I | A | Applied current |
| iapp | A m−2 | Applied current density |
| in | A m−2 | Current density perpendicular to particle surface |
| ip2D | A m−2 | Current density perpendicular to current collectors |
| i0 | A m−2 | Exchange current density |
| jn | mol m−2 s−1 | Pore-wall flux |
| k | m s−1 | Reaction rate constant |
| m | kg | Mass of the jelly roll |
| Pcool | W K−1 | Cooling Power |
| r | m | Radial-coordinate of particle domain in p2D model |
| r'' | m | Radial-coordinate in 3D model |
| R | 8.314 J mol−1 K−1 | Gasconstant |
| RCR | 8.314Ω | Contact Resistance |
| Rf | Ω m2 | Surface-layer resistance |
| Rp | m | Particle radius |
| q | W m−2 | Heat flux |
| Q | W | Heat generation rate |
| t | s | Time |
| ti | m | Thickness of layer i |

| — | Transference number |
| T | K | Temperature |
| w | m | Length of active electrode area |
| x | m | x-coordinate in p2D model |

| m | x-coordinate in 2D model |

| m | y-coordinate in 2D model |
| x'' | m | x-coordinate in 3D model |
| y'' | m | y-coordinate in 3D model |
| z'' | m | z-coordinate in 3D model |
Nomenclature III.
| Abbreviations | |
|---|---|
| AC | Active Cooling |
| B | Bottom |
| C | Graphite |
| CAP | Constant anode potential |
| CC | Current Collector |
| DMC | Dimethyl carbonate |
| EC | Ethylene carbonate |
| ECM | Equivalent-circuit model |
| EoC | End of charge |
| EV | Electric vehicle |
| HE | High Energy |
| HP | High Power |
| LCO | LiyCoO2 |
| LFP | LiyFePO4 |
| LIB | Lithium-ion-battery |
| LiPF6 | Lithium hexafluorophosphate |
| LMO | LiyMn2O4 |
| M | Mantle |
| MSMD | Multi-Scale Multi-Domain model |
| MuDiMod | Multidimensional multiphysics modelling framework |
| NCA | LiyNi0.8Co0.15Al0.05O2 |
| NMC-532 | LiyNi0.5Mn0.3Co0.2O2 |
| NMC-811 | LiyNi0.8Mn0.1Co0.1O2 |
| p2D | Pseudo-two dimensional model |
| PC | Poly-carbonate |
| PVDF | Polyvinylidene fluoride |
| SiC | Graphite host lattice with content of silicon |
| SoC | State of charge |
| T | Tab |
Acknowledgments
The authors thankfully acknowledge the German Federal Ministry of Education and Research (BMBF) for its financial support within the InnoCase project (03XP0207F).
Appendix
Table A·I. Differential Eqs. of the MuDiMod framework.
| P2D model | |
|---|---|
| Mass balance a) |
|

| |
| Potentials a) |

|
| |
| Charge balance a) |
|
| Electrode |
![${j}_{{\rm{n}}}(x,t)=\tfrac{{i}_{0}(x,t)}{F}\left[{\exp }\left(\tfrac{{\alpha }_{{\rm{a}}}\,F\,\eta (x,t)}{R\,T}\right)-{\exp }\left(-\tfrac{{\alpha }_{{\rm{c}}}\,F\,\eta (x,t)}{R\,T}\right)\right]$](https://content.cld.iop.org/journals/2754-2734/1/4/040502/revision2/ecsaac97e0ieqn14.gif)
|
| kinetics a) | η(x, t) = Φs(x, t) − Φl(x, t) − Eeq(x, t) − jn(x, t)F Rf |
| |
| Heat source |
|
| |

| |

| |
| Qp2D = QEC = Qr + Qrev + Ql + Qs | |
| 2D electrical model | |
![${\rm{\nabla }}={\left(\tfrac{\partial }{\partial \,x^{\prime} },\tfrac{\partial }{\partial \,y^{\prime} }\right)}^{{\rm{T}}}\qquad {\boldsymbol{\sigma }}=\left[\begin{array}{cc}{\sigma }_{\mathrm{cc},{\rm{x}}^{\prime} } & 0\\ 0 & {\sigma }_{\mathrm{cc},{\rm{y}}^{\prime} }\end{array}\right]$](https://content.cld.iop.org/journals/2754-2734/1/4/040502/revision2/ecsaac97e0ieqn20.gif)
| |
| Chargebalance | I = ∑i ip2D,i · Ai |
| Potentials |
|
| Heat source |
 c)·I2
c)·I2
|
| 3D thermal model | |
![${\rm{\nabla }}={\left(\tfrac{\partial }{\partial \,r^{\prime\prime} },\tfrac{\partial }{\partial \,\psi },\tfrac{\partial }{\partial \,z^{\prime\prime} }\right)}^{{\rm{T}}}\quad \quad {\boldsymbol{\lambda }}=\left[\begin{array}{ccc}{\lambda }_{\perp } & 0 & 0\\ 0 & {\lambda }_{\parallel } & 0\\ 0 & 0 & {\lambda }_{\parallel }\end{array}\right]$](https://content.cld.iop.org/journals/2754-2734/1/4/040502/revision2/ecsaac97e0ieqn23.gif)
| |
| Temperature a) , b) |

|
| Heat source |

|
| − Q conv − Q rad | |

| |
x*=x ∈ [0, ta] ∧ [ta + tsep, ta + tsep + tc] ** < 0 for cc,− and > 0 cc,+.
a)Ref. 27 b)Ref. 28 c)Ref. 22Table A·II. Parametrization of the MuDiMod framework 20,29 - Part I.
| Properties of single layers | Symbol | Unit | Anode | SeparatorP | Cathode | Electrolyte | ||
|---|---|---|---|---|---|---|---|---|
| Copper | SiC | NMC-811 | Aluminum | |||||
| Geometry | ||||||||
| Thicknessm | t | μm | 11 | 86.7 | 12 | 66.2 | 17.3 | |
| Density | ρ | kg m−3 | 8950 a) | 2242 b) | 1009 c) | 4870 d) | 2710 a) | 1130 c) |
| Particle radiusm,D50 | Rp | μm | 6.1 | 3.8 | ||||
| Active material fractione | εs | % | 69.4 | 74.5 | ||||
| Inactive fractione,P/C | εs,na | % | 9 | 8.4 | ||||
| Porosity | εl | % | 21.6 m | 45 e | 17.1m | |||
| Tortuosity e l) | τ | — |

|

|

| |||
| Thermodynamics | ||||||||
| Equilibrium potential m | Eeq | V | Ref. 20 | Ref. 20 | ||||
| Entropic coefficient m |

| V K−1 | Ref. 20 | Ref. 20 | ||||
| Stoichiometry m | 100% SoC | 0.855 | 0.267 | |||||
| 0% SoC | 0.031 | 0.927 | ||||||
| Gravimetric loading | bg | mAh g−1 | 415 b) | 275.5 e) | ||||
| Maximum Concentration e |

| mol m−3 | 34 684 | 50 060 | ||||
| Transport | ||||||||
| Solid diffusivity m) | Ds | m2 s−1 | 5E-14 f) | 5E-13 g) , h) | ||||
| Solid conductivity | σs | S m−1 |
 i)
i)
| 100 h) | 0.17 h) |
 j)
j)
| ||
| Film resistance | Rf | Ω m2 | 0.0035 k) | 0 e | ||||
| Kinetics | ||||||||
| Reaction rate constant e, m) | k | m s−1 | 3·10−11 | 1·10−11 | ||||
| Transfer coefficient e | αa/c | — | 0.5 | 0.5 | ||||
| Ref. concentration | cl,ref | mol m−3 | 1 | |||||
| Thermal properties | ||||||||
| Solid diffusivitye, m) |

| K | 1200 | 1200 | ||||
| Reaction rate constant e, m) |

| K | 3600 e | 3600 e | ||||
m=measured e=estimated P Polyolefin S Superposition of solid and liquid phase P/C PVDF-binder/Carbon black (Refs. 30, 31).
a)Ref. 32 b)Ref. 33 c)Ref. 23 d)Ref. 34 e)Ref. 35 f)Ref. 36 g)Ref. 37 h)Ref. 38 i)Ref. 39 j)Ref. 40 k)Ref. 41 l)Bruggeman Transport Correction: 26 . m)Arrhenius law:
42
. m)Arrhenius law:
42
 .
.Table A·III. Parametrization of the MuDiMod framework 20,29 - Part II.
| Property | Symbol | Unit | 1 mol LiPF6 in PC/EC/DMC |
|---|---|---|---|
| Salt diffusivity a) | Dl | m2s−1 |
|
| Ionic conductivity a) | κl | S m−1 |
|
| Activity a) |

| — |
|
| Transference a) |

| — | 0.38 |
| Initial concentration | c0 | mol m−3 | 1000 |
a)Ref. 43
Table A·IV. Calculation of the electrochemical through-plane polarization 9,44 in the electrodes and ohmic in-plane polarization in the current collectors and tabs incorporated in the MuDiMod framework.
| Polarization | Symbol | Unit | Anode | Separator | Cathode |
|---|---|---|---|---|---|
| Bounds of integration | |||||
| Thickness | x0 | μm | 0 | ta | ta + tsep |
| x1 | μm | ta | ta + tsep | ta + tsep + tc | |
| Reference current | |||||
| Current flow p2D | itot | A m−2 |

| n.a. I |

|
| Current flow 2D | iCC | A m−2 |

| n.a. a) |

|
| Polarization | |||||
| Electrolyte Diffusion | △ ED,l | V |
| ||
| Particle Diffusion | △ ED,s | V |
 b)
b)
| n.a. |

|
| Ohmic loss (l) | △ EΩ,l | V |

| ||
| Ohmic loss (s) | △ EΩ,s | V |

| n.a. |

|
| Reaction kinetics | △ EBV | V |
| n.a. |

|
| Total through-plane Pol. | △ EEC | V | △ ED,l + △ ED,s + △ EΩ,l + △ EΩ,s + △ EBV | ||
| Ohmic in-plane Polarization | △ ECC | V |
 + + 
| ||
a)Referred to the total current flow through the cathode. b) Eeq,ave calculated from the lithium-ion concentration on average within the particle.
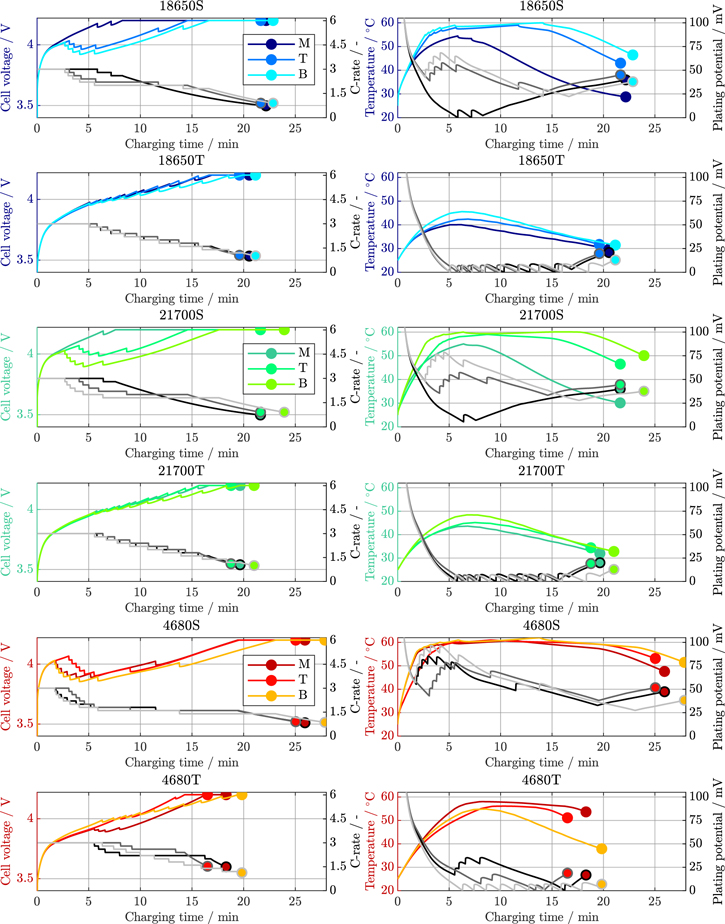
Figure A·1. Voltage, C-Rate, maximum temperature, and minimum plating potential of the 18 650, 21 700, and 4680 cell formats (suffix S for segmented, T for tabless/continuous) for the high-power cooling study at 25 °C ambient temperature.
Download figure:
Standard image High-resolution image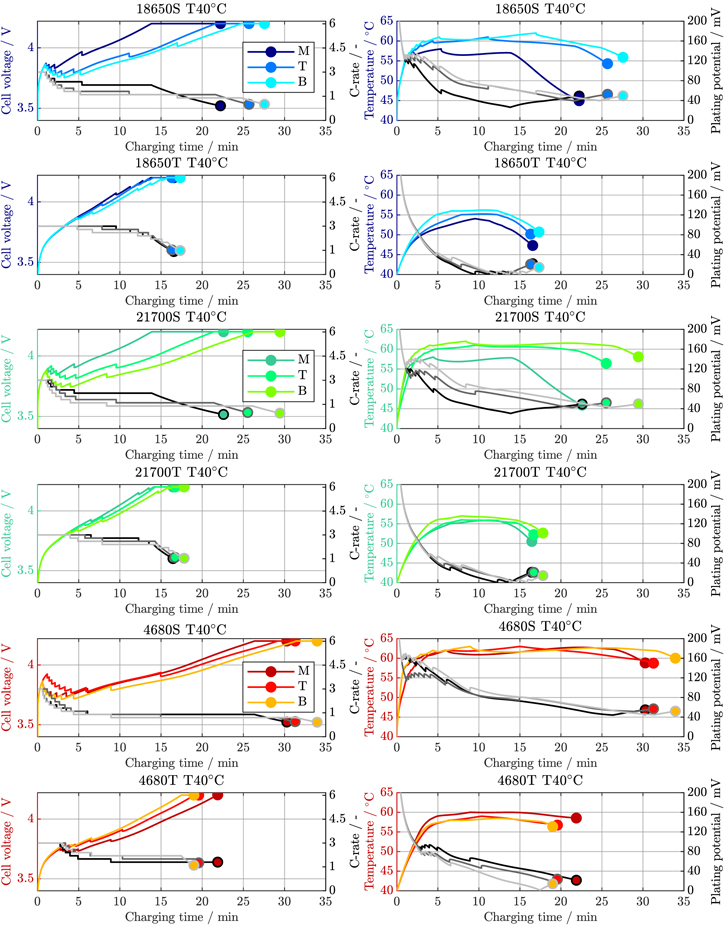
Figure A·2. Voltage, C-Rate, maximum temperature, and minimum plating potential of the 18 650, 21 700, and 4680 cell formats (suffix S for segmented, T for tabless/continuous) for the high-power cooling study at 40 °C ambient temperature.
Download figure:
Standard image High-resolution image
Figure A·3. Comparison of the active cooling simulation study for the 18 650 and 21 700 cell formats together with the optimal fast-charging behavior under isothermal conditions at 55 °C with a constant anode potential current profile as a reference case. The cell voltages are shown in (a) and (d), the applied C-Rates in (b) and (e), and the cell temperature range and plating potentials across the jelly roll are shown in (c) and (f) for the 18 650 and 21 700 format respectively.
Download figure:
Standard image High-resolution image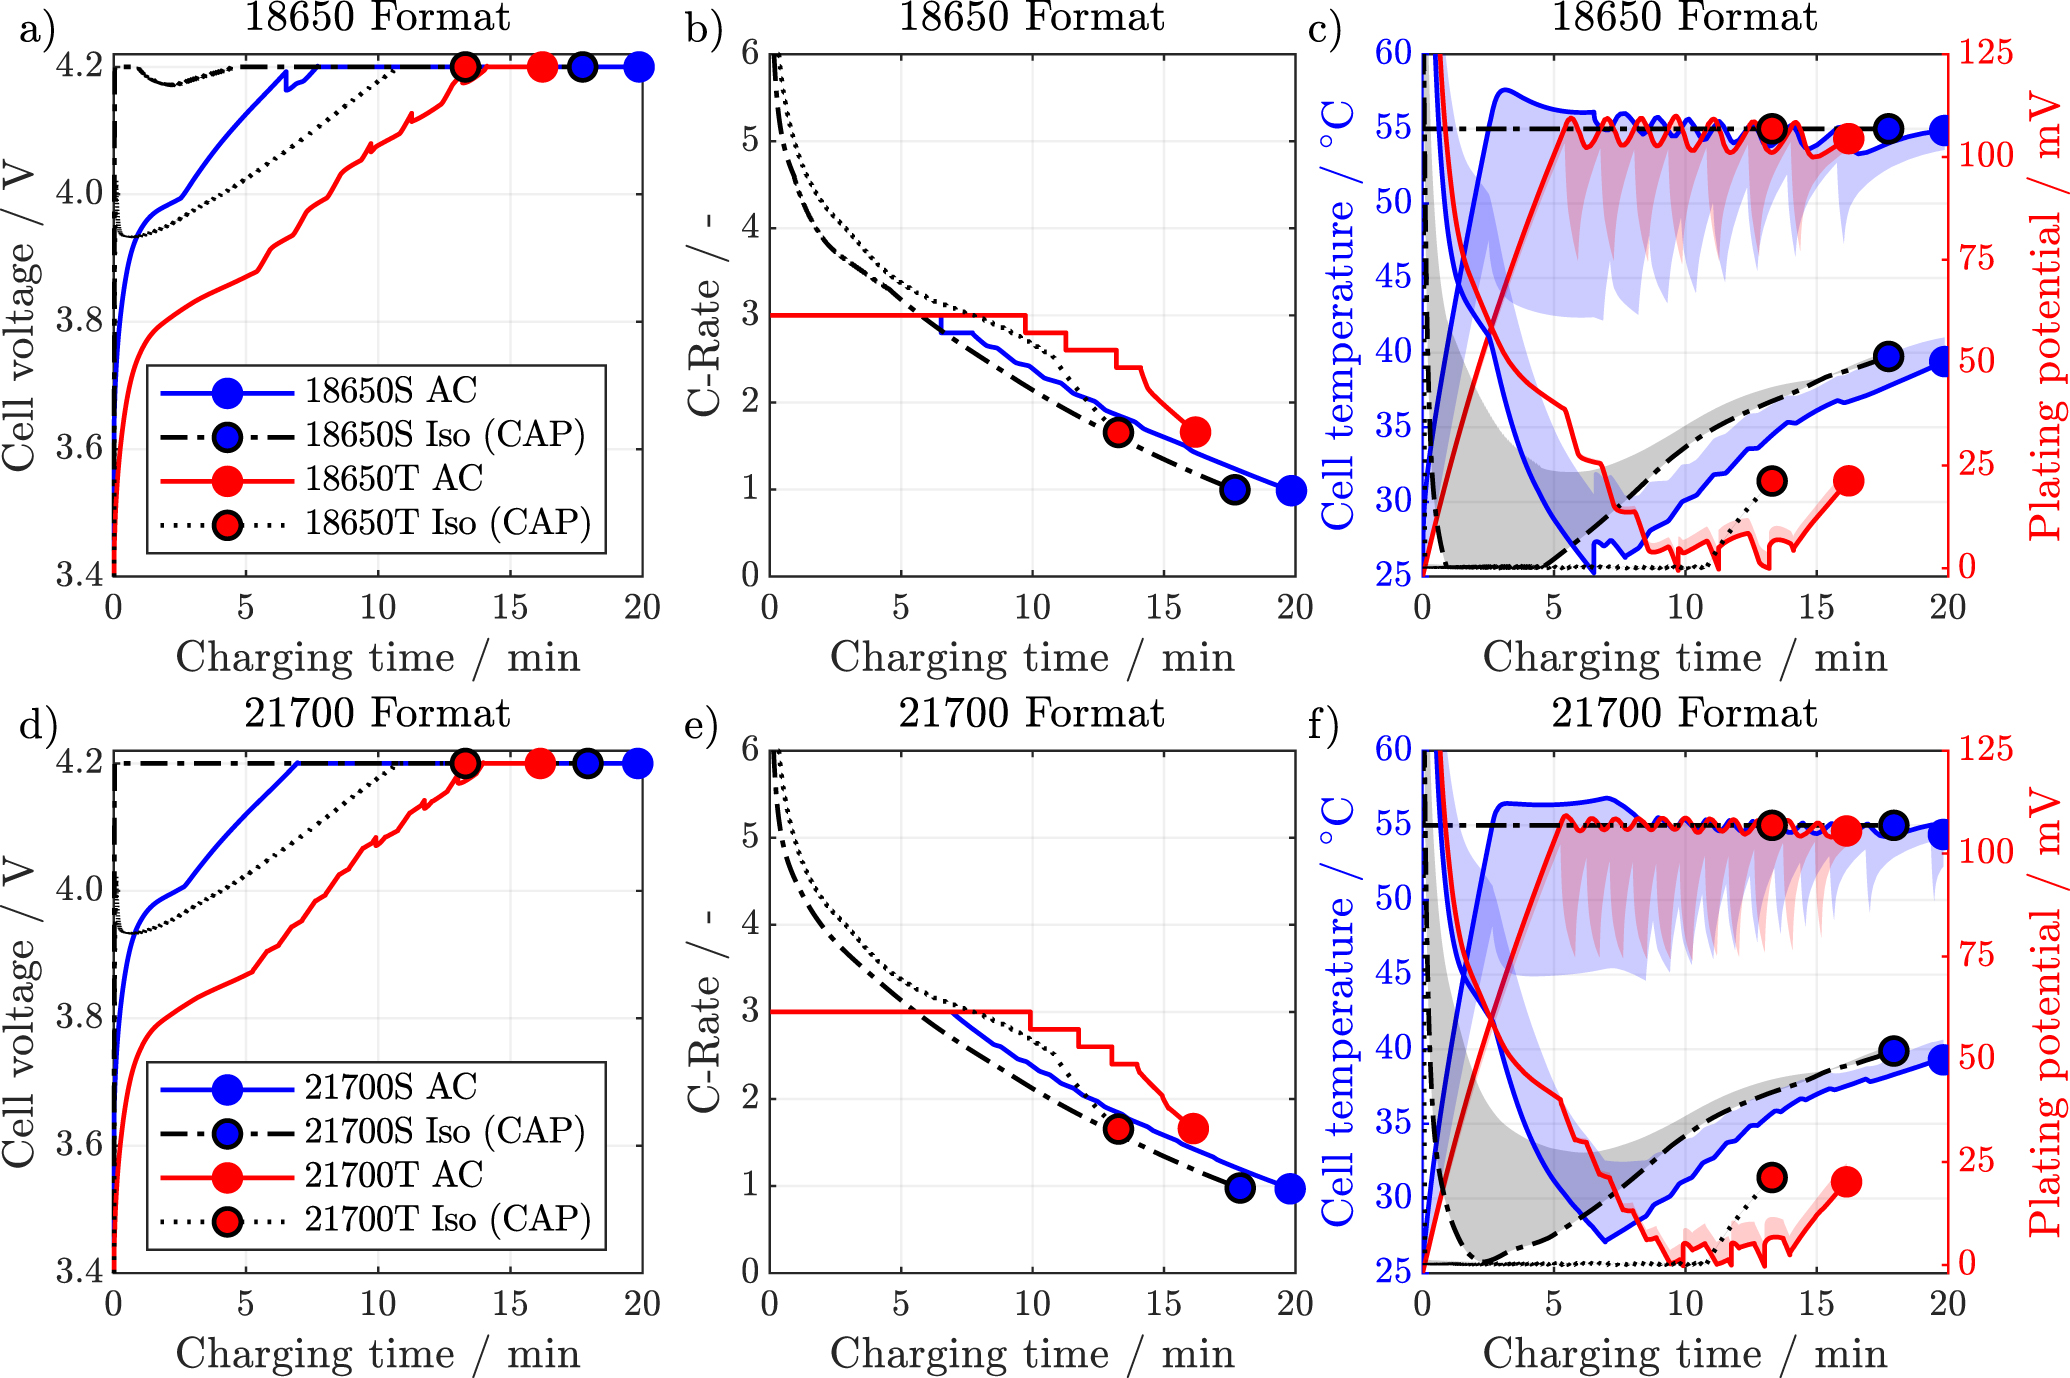