


Dolan & Doyle (Reference Dolan and Doyle2000) provide a helpful review of clinical and actuarial measures in violence risk prediction. The evidence shows that prediction can be significantly better than chance. However, they present only one half of the story. How well do the best instruments perform in the real clinical world where prediction leads to action, including restrictions on the liberty of patients regarded as dangerous? False positives are very serious from an ethical (including resource allocation) point of view. Here we encounter the ‘base rate’ problem that the authors inexplicably fail to mention.
The rate at which violent acts occur in the population of interest is critical to the predictive abilities of any instrument. The authors reproduce a receiver operator characteristics (ROC) curve of a well-performing instrument which, as they say, shows the trade-off between the true positive rate and the false positive rate (or conversely the true negative rate). Where that trade-off should lie depends on the relative costs of false positives v. false negatives. One usually looks at the point of maximum perpendicular distance from the diagonal line. For this ROC, a true positive rate of 0.7 and a false positive rate of 0.3 (equivalent to a true negative rate of 0.7) is probably the optimum. A test has to predict accurately who will be violent as well as who will not be violent. Although this ROC is statistically significant against chance at the P < 0.001 level in predicting violence, how does it fare in practice?
It is difficult to describe how prediction instruments perform in a way that is easily comprehensible to non-mathematicians. Perhaps probability trees can help. Figure 1 shows a probability tree in which the essential data are presented in relation to a population in which 20% of patients will actually be violent during the follow-up period. Using the test represented by the ROC described, it can be seen that the positive predictive value, that is, the proportion of patients predicted by the test to be violent who indeed turn out to be violent, is 0.37. But this means also that the prediction will be wrong about six times out of ten. Perhaps a base rate of 20% is appropriate to some forensic populations. In a community mental health service, even an inner-city one, the rate of violent acts, of any severity, over a 6-month period is more likely to be around 6% (Reference Shergill and SzmuklerShergill & Szmukler, 1998). Substituting the figures 6 and 94 in the probability tree the reader will discover that the positive predictive value drops to 0.14; that is, the prediction will be wrong almost nine times out of ten. For very serious violence, perhaps at a rate of 1%, the test will be wrong about 97 times out of a 100. For homicides, at around 1 in 10 000 per annum committed by patients with a psychosis, prediction is meaningless.
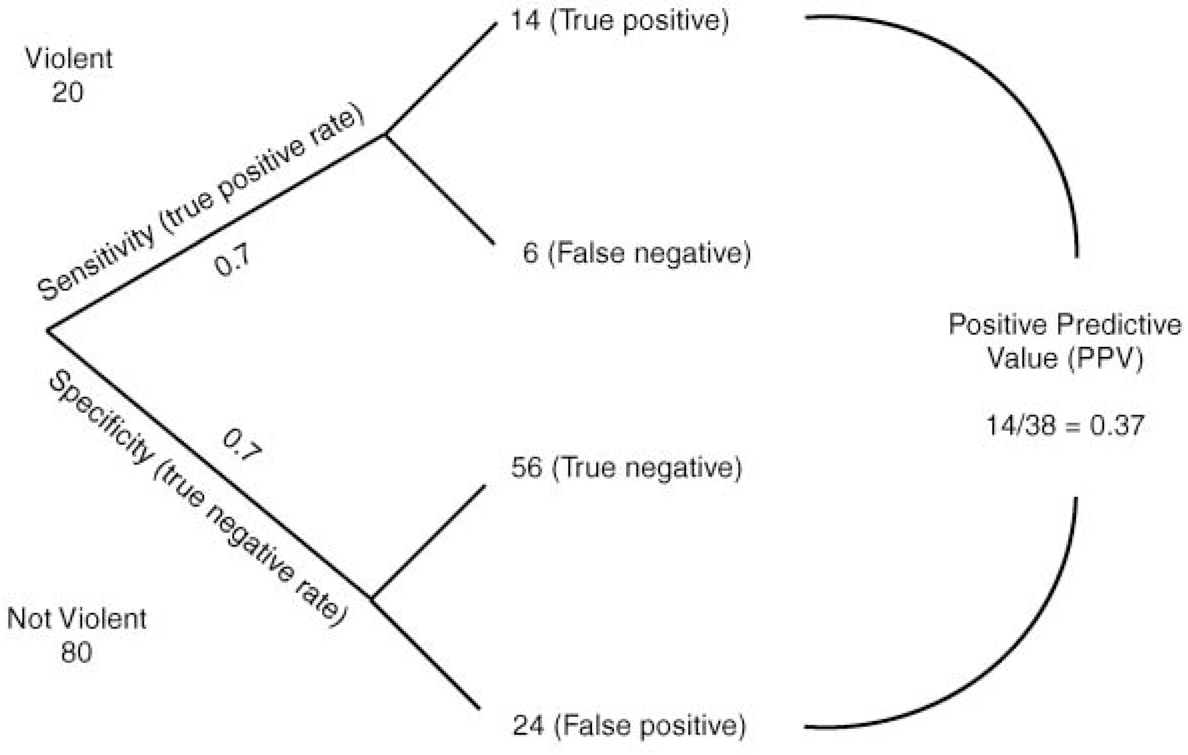
Fig. 1 Probability tree for determining the predictive ability of a test for violence. The rate of violence in the population is 20%. The test has a true positive rate of 0.7 and a true negative rate of 0.7.
Rare events are inherently difficult to predict. Even a test with an impossible 0.9 accuracy for both true positives and true negatives will be wrong more than nine times out of ten at a base rate of 1%. Thus highly statistically significant ROC curves look very limited indeed in their practical application in a community context. How unfair is it then that mental health services in the UK seem to be expected to prevent what is, in practice, unpredictable?


eLetters
No eLetters have been published for this article.