


Characteristics and burden of personality disorders
Personality disorders are characterised by significant impairments in self (identity or self-direction) and interpersonal (empathy or intimacy) personality functioning and the presence of pathological personality traits, which are relatively stable across time and consistent across situations.1 They are associated with high mortalityReference Fok, Hayes, Chang, Stewart, Callard and Moran2, Reference Skodol3 and comorbidity.Reference Moran, Romaniuk, Coffey, Chanen, Degenhardt and Borschmann4 For example, 85% of patients with borderline personality disorder (BPD) have at least one more disorder on Axis I of the DSM-IV1 and 74% have another personality disorder.Reference Grant, Chou, Goldstein, Huang, Stinson and Saha5 Furthermore, increased rates of alcohol and drug consumption,Reference Moran, Romaniuk, Coffey, Chanen, Degenhardt and Borschmann4, Reference Frankenburg and Zanarini6 as well as elevated risks for self-harm, suicidality and increased risk for suicides, are very common in individuals with personality disorders.Reference Hiroeh, Appleby, Mortensen and Dunn7, Reference Oldham8 Personality disorders are also associated with lower levels of education and frequent interpersonal difficulties.Reference Moran, Romaniuk, Coffey, Chanen, Degenhardt and Borschmann4 The latter are particularly of concern as these can have a negative effect on the treatment quality, which can increase the risk for chronicity, which in turn has a negative effect on the treatment outcome.Reference Tyrer, Reed and Crawford9 These severe negative effects of a personality disorder for the individual are also associated with significant burden at the societal level. Personality disorders are often associated with an impairment of the capacity to work,Reference Moran, Romaniuk, Coffey, Chanen, Degenhardt and Borschmann4 leading to indirect costs through absence from work.Reference Barrett and Byford10 Furthermore, personality disorders are associated with high direct costs through high utilisation of healthcare systems.Reference Wagner, Roepke, Marschall, Stiglmayr, Renneberg and Gieb11 BPD, the most prevalent personality disorder in clinical settings, causes noticeably higher annual costs than other mental and physical disorders (BPD: approximately €26 000, depression: approximately €2900, diabetes: approximately €11 870).Reference Wagner, Roepke, Marschall, Stiglmayr, Renneberg and Gieb11
Relevance and lack of epidemiological studies
Despite the significant individual and societal burden associated with personality disorders, the epidemiology appears insufficiently described. At the same time, prevalence rates in different studies are very heterogeneous, ranging between 4 and 15% in European and North American cross-sectional studies.Reference Torgersen, Kringlen and Cramer12–Reference Coid, Yang, Tyrer, Roberts and Ullrich14 These differences may be attributable to the use of different study populations, sampling methods and diagnostic assessment. However, establishing reliable epidemiological data can enable adequate planning of mental healthcare provision.
So far, no meta-analysis on the prevalence of personality disorders exists. Accordingly, the primary aim of this study was to assess the prevalence rates of personality disorders in the general adult population in Western countries. The secondary aim was to examine potential moderator variables that may affect heterogeneity in prevalence rates.
Method
Search strategy and selection criteria
We used two methods to identify studies for this systematic review and meta-analysis. First, we searched the databases PsycINFO, PSYNDEX and Medline within the timeframe from 1 January 1994 (publication of the DSM-IV) to 31 July 2017, using the following search terms: personality disorder, axis-ii-disorder and prevalence. An example of a complete search strategy is provided in Supplementary Table 3, available at https://doi.org/10.1192/bjp.2018.202. Second, we used the ancestry and descendant approach, searching reference lists and citing articles of included articles and other relevant studies.Reference Tyrer, Reed and Crawford9, Reference Torgersen, Kringlen and Cramer12, Reference Huang, Kotov, de Girolamo, Preti, Angermeyer and Benjet15 The study is registered with PROSPERO under the record CRD42016053026 (http://www.crd.york.ac.uk/PROSPERO/display_record.php?ID=CRD42016053026).
Studies were included if they (a) reported prevalence rates of personality disorders in the general adult population (minimum mean age 18 years and minimum individual age 16 years) in Europe, North America, Australia or New Zealand; (b) identified personality disorders with standardised diagnostics according to the DSM-IV/DSM-5 or ICD-10Reference Bach, Maples-Keller, Bo and Simonsen16–18 and (c) were published in English or German. We only included studies conducted in Western countries to limit heterogeneity of the data with regard to cultural background. Studies were also excluded if they used sample restrictions other than age or gender, such as origin or ethnicity. Studies conducted before 1994 were also excluded to allow only diagnostic assessments made according to the DSM-IV, ICD-10.
Data abstraction and quality assessment
We defined the coding procedure a priori and made adaptations in the course of data abstraction (e.g. for sample restrictions and measurement tools). Two independent raters extracted the following data from the articles: author names, study name, publication year, year of data collection, country, diagnosis of personality disorder, comorbidity, gender distribution, age mean, s.d. and range, prevalence rate and type, diagnostic criteria, measurement tool, exclusion criteria, type of sampling, type of sample, response rate, contacted sample and final sample size, and incentives.
For the quality assessment of the studies, we used an adapted version of the Newcastle–Ottawa Scale (NOS).Reference Wells, Shea, O'Connell, Peterson, Welch and Losos19 The original NOS comprised the following criteria: (a) sample representativeness, (b) sample size, (c) non-respondents, (di) ascertainment of personality disorder diagnosis by common measures and (e) quality of descriptive statistics reporting. We added two further criteria to this scale: (dii) ascertainment of personality diagnosis by self-rating versus expert rating and (f) ascertainment of prevalence estimate. A rating of 1 (low risk of bias) or 0 (high risk of bias) was assigned for each study. Based on the classification provided by Rotenstein et al,Reference Rotenstein, Ramos, Torre, Segal, Peluso and Guille20 individual criteria are summed to generate a total score that can range from 0 to 5, and studies can be judged to be of low risk of bias (≥3 points) or high risk of bias (<3 points). For the adapted version with two additional criteria, total scores can range from 0 to 7, and the cut-off for a low and high risk of bias was modified (≥4 points and <4 points, respectively). The adapted NOS with a detailed description of the rating procedure is provided in the Supplementary Material.
Abstract screening, reading of full-text articles and subsequent data extraction and risk of bias ratings were completed by all authors, independently from each other. Screenings, extraction and ratings were then crosschecked, and consensus on disagreements was reached through discussion.
Statistical analysis
The primary outcome of this meta-analysis was the prevalence rate of personality disorders. We coded these prevalence rates into simple proportional effect sizes (by dividing the number of cases by the total number of study participants) and used double arcsine transformation to avoid the squeezing of variance effect.Reference Barendregt, Doi, Lee, Norman and Vos21 After analysis, values were back-transformed for reporting. A random-effects model was chosen as this model addresses heterogeneity between studies and study populations, and is more robust in case of large variations in sample size.Reference Cooper, Hedges and Valentine22 The magnitude of heterogeneity was assessed by the I 2 index.Reference Lipsey and Wilson23 Reported confidence intervals reflect a 95% criterion.
To examine potential sources of bias, meta-regression analyses were conducted for each personality disorder individually, for Clusters A, B and C, and for any personality disorder. We investigated the effect of potentially distorting risk of bias criteria. All meta-regression analyses were performed with the restricted maximum likelihood estimate method, a random-effect approach that accounts for residual between-study heterogeneity.Reference Lipsey and Wilson23 Publication bias was assessed for each personality disorder individually and for any personality disorder by visual inspection of funnel plots and applying Egger's test.Reference Egger, Davey Smith, Schneider and Minder24, Reference Sterne and Egger25 To analyse the robustness of the results, we performed sensitivity analyses by sequentially removing each study and rerunning the analysis. We also conducted separate analyses for studies where subsamples with clinical ratings were available, and analyses excluding studies with high risk of bias rating to determine whether potential methodological weaknesses influenced meta-analytic results. All major analyses were conducted with the meta package in R version 3.3.2.Reference Schwarzer26 There was no funding source for this study.
Results
Of the initial 1427 records identified (1003 after elimination of duplicates), the majority (928) was excluded after screening of titles and abstracts because they were not applicable to the aim of this meta-analysis (see Fig. 1). Of those that were reviewed in full text, 42 were excluded. The three most common reasons for exclusion were prevalence rates according to DSM-III (24 records), no prevalence rates reported (seven records) and lack of adult community samples (i.e. adolescents or clinical samples) (five records). The final sample comprised ten studies (published in 27 articles), which met the inclusion criteria for this meta-analysis (see Fig. 1).
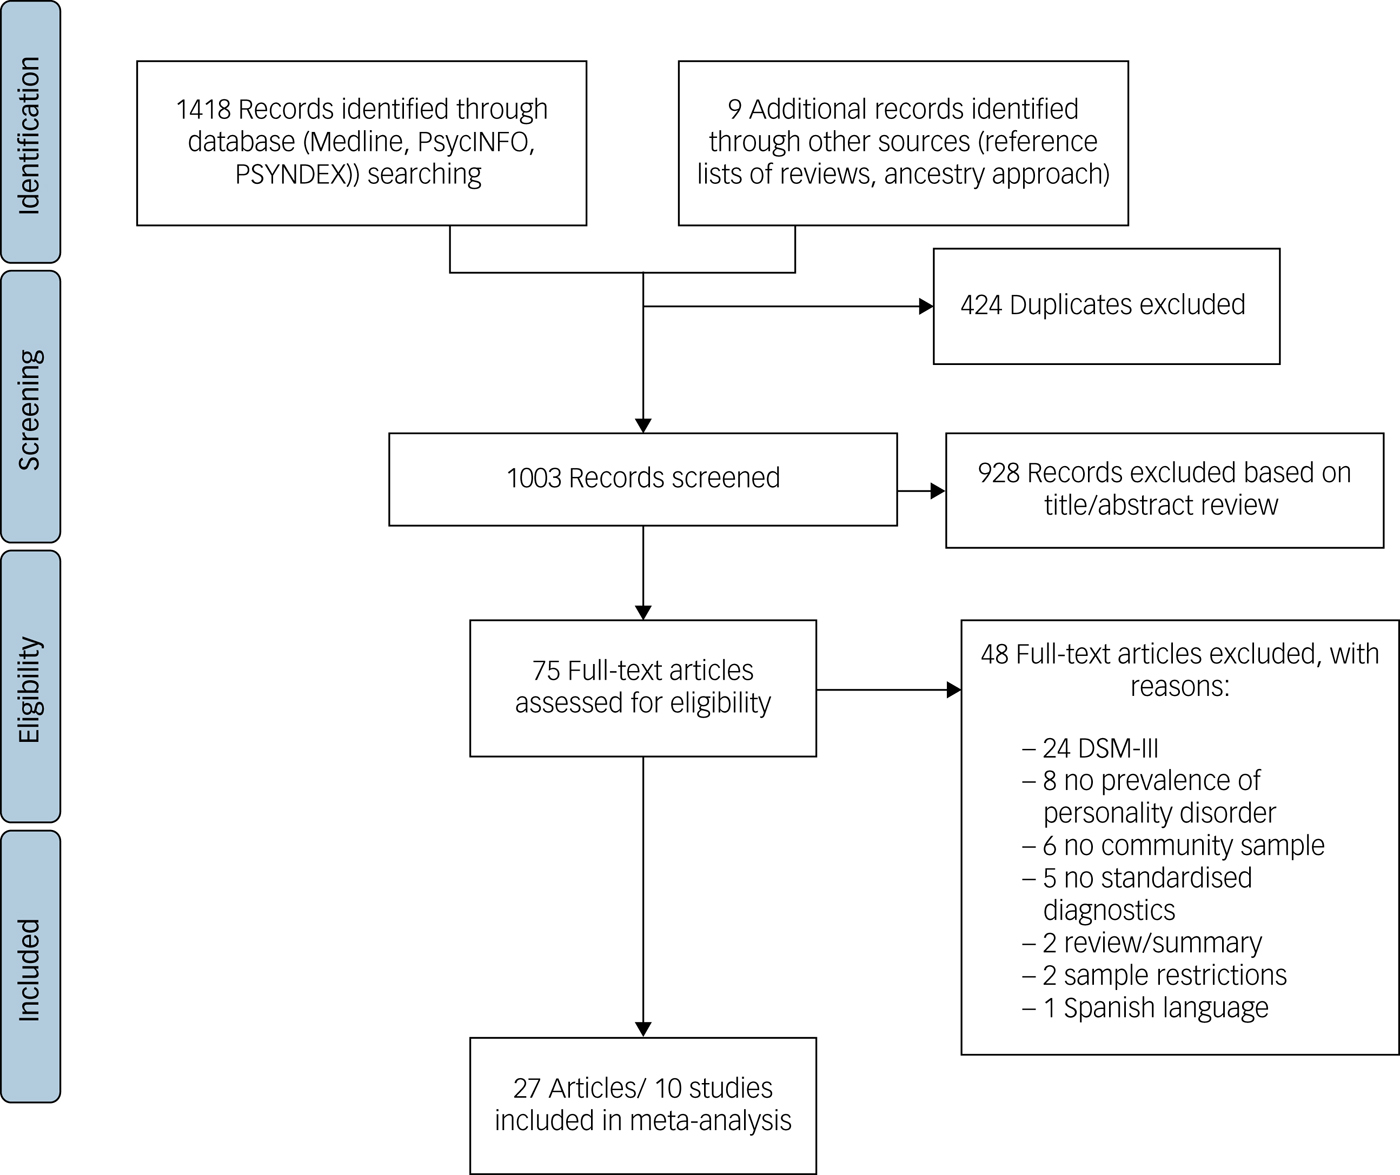
Fig. 1 Study selection for inclusion in meta-analysis.
Table 1 shows the characteristics of the ten studies from 27 articles, with a total of 113 998 individuals included in this meta-analysis (complete references are provided in Supplementary Table 1). Data comes from seven different countries: Australia (study 7), Germany (study 6), the Netherlands (study 10), Sweden (study 5), Turkey (study 9), UK (study 8) and USA (studies 1, 2, 3 and 4). The USA contributed the largest number of studies (k = 4). Most studies used diagnostic criteria according to the DSM-IV for the diagnosis of personality disorders. The most commonly used diagnostic interview was the International Personality Diagnostic ExaminationReference Loranger, Sartorius, Andreoli, Berger, Buchheim and Channabasavanna27 (k = 3, studies 3, 4 and 10), followed by the Structured Clinical Interview for DSM Disorders Axis IIIReference First, Gibbon and Spitzer28 (k = 2, studies 6 and 8) and Alcohol Use Disorder and Associated Disabilities Interview Schedule, DSM-IV VersionReference Grant, Dawson and Hasin29 (k = 2, studies 1 and 2). One study used a self-report version of the International Personality Diagnostic Examination (study 7), and two studies used the DSM-IV and ICD-10 Personality Disorder QuestionnaireReference Ottosson, Bodlund, Ekselius, Knorring, Kullgren and Lindström30 (k = 2, studies 5 and 9). Five studies assessed lifetime prevalence rates of personality disorders (studies 1, 2, 4, 7 and 10), two studies assessed a 5- to 10-year time period (studies 6 and 8) and three studies assessed a 5-year time period (studies 3, 5 and 9). The majority of studies (k = 9) used a random sample, one study used a partly random sample (study 4) and seven studies used a representative sample (studies 1, 2, 3, 6, 7, 9, 10). In seven studies (studies 1, 2, 5, 7, 8, 9, 10), samples were stratified by different criteria, mainly ethnicity (k = 3, studies 1, 2 and 7). The participants’ age ranged from 16 to 94 years, with a mean age range from 33 to 51 years. The proportion of female participants ranged between 49.5 and 63%. With regard to the type of personality disorder investigated, the majority of studies assessed BPD (k = 9), paranoid, schizoid, histrionic, antisocial, avoidant, dependent and obsessive–compulsive personality disorder (each k = 7). The least frequently investigated personality disorder was personality disorder not otherwise specified, with only one study (study 3). The sample size varied largely across studies, from n = 557 (study 5) to n = 43 093 (study 1).
Table 1 Study characteristics of included studies in meta-analysis
The complete reference citations are provided in Supplementary Table 1. ANSMHWB, Australian National Survey of Mental Health and Wellbeing Part II; AUDADIS-IV, Alcohol Use Disorder and Associated Disabilities Interview Schedule DSM-IV Version; BNSPM, British National Survey of Psychiatric Morbidity 2000; DIP-Q, DSM-IV and ICD-10 Personality Disorder Questionnaire; IPDE, International Personality Disorder Examination; LEGEND, Life-Events and Gene-Environment Interaction in Depression; NCS-R, National Comorbidity Survey-Replication; NEMESIS, Netherlands Mental Health Survey and Incidence Study-2; NESARC, National Epidemiologic Survey on Alcohol and Related Conditions; SCID-II, Structured Clinical Interview for DSM-IV Axis II; SHIP, Study of Health in Pomerania.
a. NESARC wave 1 sample.
b. NESARC wave 2 sample.
c. NCS-R total sample.
d. Clinical reappraisal interview sample.
e. SCID-II self-report screening questionnaire sample.
f. SCID-II interview sample.
The quality assessment (see Supplementary Fig. 1) showed that nine studies included in the meta-analysis had a low risk of bias through comprehensive ascertainment of prevalence estimate. The majority of studies also achieved a low risk of bias rating for the quality of descriptive statistics reporting (80%), using expert rating (80%) and a common tool for ascertainment of diagnosis (80%). High risk of bias ratings were obtained for all studies for bias through non-respondents (non-response rate >15%, difference between respondents and non-respondents was not tested or statistically significant) and the majority of studies for bias through sample size n < 10 000 (70%) (Fig. 2).
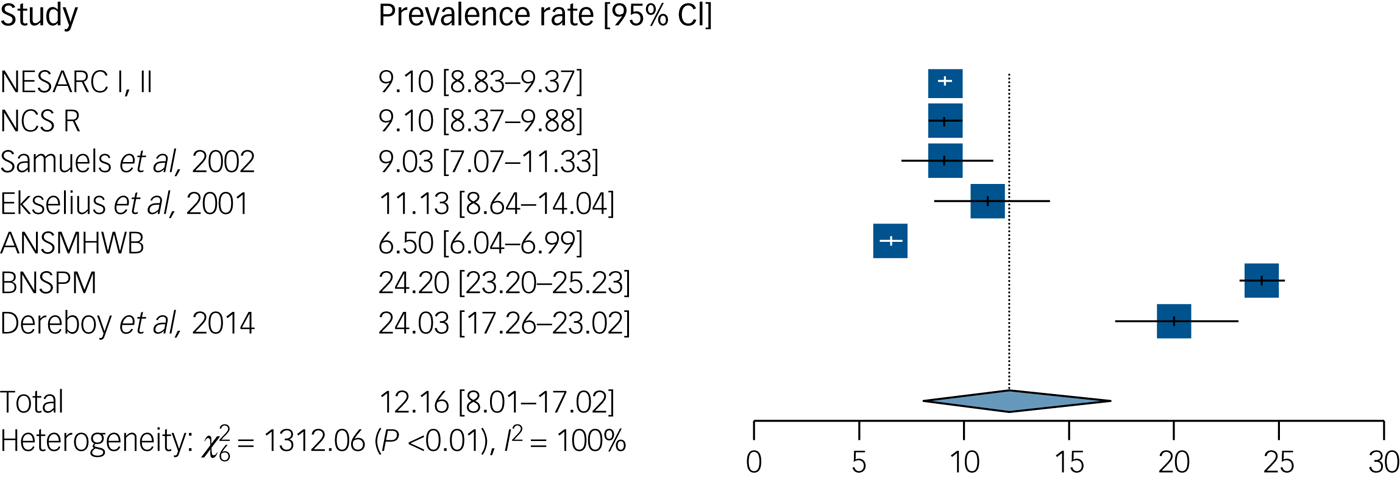
Fig. 2 Prevalence of any personality disorder. ANSMHWB, Australian National Survey of Mental Health and Wellbeing Part II; BNSPM, British National Survey of Psychiatric Morbidity 2000; NCS-R, National Comorbidity Survey-Replication; NESARC, National Epidemiologic Survey on Alcohol and Related Conditions. The complete reference citations are provided in Supplementary Table 1.
With regard to the overall risk of bias rating for individual studies, seven studies achieved a low risk of bias rating (≥4 points) and three studies achieved a high risk of bias (<4 points) according to the rating with the adapted NOS. When applying the original criteria provided by Rotenstein et al,Reference Rotenstein, Ramos, Torre, Segal, Peluso and Guille20 no differences in ratings emerged.
The overall random-effects estimate for the ten included studies was 12.16% for the prevalence of any personality disorder (95% CI, 8.01–17.02%) (Fig. 2). The heterogeneity in the prevalence for any personality disorder was statistically significant and large in magnitude (I 2 = 99.60%; Q = 1313.20, P < 0.0001).
With regard to DSM Clusters, the overall random-effects estimate was highest for any Cluster A personality disorder with 7.23% (95% CI, 2.37–14.42%, I 2 = 99.80%, Q = 1658.68, P < 0.0001), followed by any Cluster C personality disorder with 6.70% (95% CI, 2.90–11.93%, I 2 = 99.60%, Q = 988.01, P < 0.0001) and was lowest for any Cluster B personality disorder with 5.53% (95% CI, 3.20–8.43%, I 2 = 99.00%, Q = 388.05, P < 0.0001). With regard to specific personality disorders, the overall random-effects estimates ranged from 0.78% for dependent personality disorder (95% CI, 0.37–1.32%, I 2 = 95.30%, Q = 127.54, P < 0.0001) to 4.32% for obsessive–compulsive personality disorder (95% CI, 2.16–7.16%, I 2 = 99.30%, Q = 808.40, P < 0.0001). Within Cluster A, the overall random-effects estimates for specific personality disorders ranged between 2.82% for schizoid personality disorder (95% CI, 0.57–6.62%, I 2 = 99.70%, Q = 1814.57, P < 0.0001) and 3.04% for schizotypal personality disorder (95% CI, 1.21–5.64%, I 2 = 98.70%, Q = 375.25, P < 0.0001). For Cluster B personality disorders, we found rates between 0.83% for histrionic personality disorder (95% CI, 0.36–1.48, I 2 = 96.50%, Q = 170.45, P < 0.0001) and 3.05% for antisocial personality disorder (95% CI, 2.10–4.16, I 2 = 98.30%, Q = 356.98, P < 0.0001). The overall random-effects estimate for BPD was 1.90% (95% CI, 0.85–3.34%, I 2 = 99.10%, Q = 875.03, P < 0.0001), and 1.23% for narcissistic personality disorder (95% CI, 0.43–2.40%, I 2 = 97.00%, Q = 166.82, P < 0.0001). For personality disorder not otherwise specified, the estimate was 1.6% with only one included study (Table 2). For all analyses, heterogeneity in estimates was statistically significant (P < 0.0001) and large in magnitude (ranging between I 2 = 95.30% for dependent personality disorder and I 2 = 99.80% for any Cluster A personality disorder).
Table 2 Summary prevalence rates of individual, Cluster A, B and C and any personality disorders
The complete reference citations are provided in Supplementary Table 1. Superscript numbers and letters indicates the study identifier and sample from Table 1, respectively. I 2 index, measure of heterogeneity; NOS, not otherwise specified.
a. Excluding studies 5, 3c, 8e.
The results of Egger's test did not reveal evidence for a publication bias (regression coefficients ranging between ß = 0.04, P = 0.20 for histrionic personality disorder and ß = 0.29, P = 0.50 for any personality disorder). However, these results should be interpreted with caution because the number of included studies was too low to properly assess the funnel plot or use more advanced regression-based assessments.
We investigated the effect of risk of bias with meta-regression analyses. A low prevalence rate was significantly associated with a low risk of bias through the ascertainment of diagnosis by expert-rating (versus self-rating) for the majority of personality disorders, namely paranoid (ß = −0.16, P < 0.01), schizotypal (ß = −0.21, P < 0.001), BPD (ß = −0.21, P < 0.0001), histrionic (ß = −0.15, P < 0.0001), narcissistic (ß = −0.16, P < 0.0001), avoidant (ß = −0.12, P < 0.01), dependent (ß = −0.13, P < 0.0001), obsessive–compulsive (ß = −0.17, P < 0.01), any Cluster B (ß = −0.23, P < 0.0001) and any Cluster C (ß = −0.19, P < 0.05). A low prevalence rate was also significantly predicted by a low risk of bias through the quality of reported descriptive statistics, but only for antisocial personality disorder (ß = 0.11, P < 0.0001).
Sensitivity analyses were performed for assessing the robustness of prevalence rates of different personality disorders. The results show the largest increase in prevalence for any Cluster A personality disorder by 1.75% (from 7.23 to 8.98%) when study 1 is excluded, and the largest decrease for any Cluster A personality disorder by 2.03% (from 7.23 to 5.2%) when study 9Reference Dereboy, Güzel, Dereboy, Okyay and Eskin31 is excluded. Furthermore, study 9 and study 7 were most frequently associated with the largest variations in prevalence estimates compared with the other studies: study 9 was associated with the largest decreases in prevalence for 11 out of 15 personality disorder diagnoses (schizotypal, paranoid, any Cluster A, BPD, histrionic, antisocial, narcissistic, any Cluster B, dependent, obsessive–compulsive and any Cluster C), with the largest changes for any Cluster A (−2.03%), any Cluster B (−1.81%) and any Cluster C personality disorders (−1.77%). Exclusion of study 7, in contrast, was associated with moderate increases in prevalence for six out of 15 personality disorder diagnoses (schizoid, paranoid, histrionic, avoidant, dependent and any personality disorder), with the largest increases for paranoid (+0.78%) and any personality disorder (+1.11%).
Because of the large variations associated with study 9, we recalculated all analyses excluding this study. The overall random-effects estimate for the nine remaining studies was 11.03% for any personality disorder (95% CI, 6.85–16.06%; Table 2). With regard to DSM Clusters, the overall random-effects estimate excluding study 9 was 5.20 (95% CI, 1.07–12.16%) for any Cluster A, 3.72 (95% CI, 1.93–6.06%) for any Cluster B, and 4.93 (95% CI, 1.65–9.82%) for any Cluster C (Table 2). With regard to specific personality disorders, the overall random-effects estimates of the nine studies ranged from 0.36% (95% CI, 0.17–0.61%) for histrionic (Table 2) to 3.20% (95% CI, 1.40–5.69%) for obsessive–compulsive personality disorder (Table 2). For analyses excluding study 9, heterogeneity in estimates decreases but remains statistically significant and large in magnitude for all personality disorders (ranging between I 2 = 85.6% for dependent personality disorder and I 2 = 99.80% for any Cluster A).
Furthermore, in light of the significant association of risk of bias through ascertainment of diagnosis with self-rated methods and prevalence estimates, we recalculated all analyses with the clinical reappraisal interview subsamples available for a number of personality disorder diagnoses in studies 3 (n = 214) and 8 (n = 626) (and also excluding study 9). The overall random-effects estimate for the majority of personality disorders decreased; for example, for any personality disorder it decreased to 7.74% (95% CI, 6.00–9.67%; Table 2) and for any Cluster A it decreased to 2.36% (95% CI, 1.51–3.38%). For these analyses, heterogeneity for the majority of estimates remains large and statistically significant (ranging between I 2 = 76.1% for schizotypal personality disorder and I 2 = 98.8% for BPD and obsessive–compulsive personality disorder). However, for dependent, histrionic and any Cluster A personality disorder, heterogeneity drops to I 2 = 4.6, 18.6 and 71.7%.
Discussion
Our aim was to estimate the prevalence of personality disorders in the general adult population in Western countries and to examine potential moderating factors. Overall personality disorders have been investigated in only very few epidemiological studies compared with other mental disorders. The low number of available epidemiological studies may be because the diagnosis of personality disorders is more complex and resource intensive.
This meta-analysis shows that prevalence rates of personality disorders are fairly high, with a rate of 12.16% for any personality disorder in the general adult population in Western countries, which is comparable with earlier cross-sectional, community-based studies in Western countries that used the DSM-III-R.Reference Tyrer, Reed and Crawford9 The comparison between the three personality disorder clusters shows that prevalence estimates are highest for Cluster A (7.23%). With regard to individual personality disorders, the prevalence rate is highest for obsessive–compulsive personality disorder (4.32%), and lowest for dependent personality disorder (0.78%).
Hence, personality disorders have a similar prevalence to physical health conditions, like low back pain and chronic respiratory diseases (approximately 12 and 7% each in high-income adult populations), and are much more prevalent than diabetes mellitus and cardiovascular diseases (each approximately 3% in high-income adult populations) or depressive and anxiety disorders (each approximately 6%).32 Although the disability-adjusted life-years for these diseases have been investigated and range between 1.6 (diabetes mellitus) and 7.8% (low back pain), personality disorders so far have not been included in Global Burden of Disease studies.32 Furthermore, our study shows that the prevalence of personality disorders in community samples is considerably lower than those reported in clinicalReference Beckwith, Moran and Reilly33 or forensic samples,Reference Fazel and Danesh34 where rates range between 25 and 65%.
According to the results of our moderator analysis, heterogeneity in prevalence rates is associated with a high risk of bias through the use of self-rated instead of expert-rated diagnostic assessment. In particular, studies using the self-rating assessments DSM-IV and ICD-10 Personality Disorder Questionnaire and Structured Clinical Interview for DSM Disorders Axis II screening questionnaire consistently report higher prevalence rates for the majority of personality disorders. Correspondingly, our prevalence estimate for any personality disorder based on expert-rated measures only was substantially lower at 7.74%. Prevalence estimates based on clinical interviews also substantially dropped for Clusters (e.g. Cluster A dropped to 2.36%) and individual personality disorders (e.g. obsessive–compulsive personality disorder dropped to 2.36% and paranoid personality disorder dropped to 0.97%). Self-report measures, which are more economic to use, have been criticised for overestimating prevalence, whereas diagnostic interviews require clinical expertise, intensive training and are more time consuming.Reference Tyrer, Coombs, Ibrahimi, Mathilakath, Bajaj and Ranger35 One study in particular (study 9) was consistently associated with large variations in prevalence estimates, which may also be associated with the use of a self-report measure in this study. Furthermore, variations may be associated with limitations of a transcultural diagnostic assessment of personality disorders, as this study was conducted in Turkey, which could be regarded as a non-Western country. The a priori definition of Western countries, however, was made on a geographic basis.
A number of limitations of this meta-analysis need to be considered. First, the literature search was limited to articles published in English or German. Still, no evidence of publication bias was found. Second, the number of included studies is low, which may have influenced confidence intervals and limit the generalisability of findings. Because of the low number of studies, no subgroup analyses with regard to age, gender or socioeconomic status were possible. Third, only studies from Western countries were included to reduce heterogeneity. At the same time, this also limits the number of studies included in the analysis. Fourth, with regard to the quality assessment, all studies had a high risk of bias for the non-respondents criterion. Hence, the risk of bias for this criterion could not be assessed. This may also affect the estimation of prevalence. If significant differences between responders and non-responders existed, prevalence of personality disorders may be underestimated, assuming that more severely impaired individuals are less likely to participate in studies. Fifth, with regard to specific personality disorders, analysis of prevalence data for ICD-specific diagnoses, e.g. emotionally unstable personality disorder – impulsive type, was not possible. Also, for the DSM diagnosis personality disorder not otherwise specified, which is commonly used in clinical practice, only one study was included in our analysis.
Because of the large heterogeneity in prevalence rates, a larger authoritative database on the epidemiology of personality disorders in the general adult population is required. Furthermore, the prevalence of personality disorders in other non-Western countries and clinical populations could prove informative.
In light of the high prevalence of personality disorders and in line with the Research Domain Criteria,Reference Insel, Cuthbert, Garvey, Heinssen, Pine and Quinn36 advancement of the understanding of the basic dimensions underlying the development of personality psychopathology is urgently needed and can inform the advancement of evidence-based preventive and therapeutic interventions. There are indications that critical phases of life predict the development of personality disorder in early childhood, and the starting point for prevention and early intervention should be in the transition from the childhood to the adolescence.Reference Newton-Howes, Clark and Chanen37 Knowledge about the early developmental psychopathological pathways of personality disorders can also form the basis to identify specific mechanisms of change in the treatment.
At the same time, there is a need for psychometrically sound, resource-friendly diagnostic instruments that can be applied in large-scale epidemiological studies. Future studies are also needed to investigate the epidemiology of personality disorders based on the newly updated classification systems DSM-5 and ICD-11,Reference Moran, Romaniuk, Coffey, Chanen, Degenhardt and Borschmann4, Reference Bach, Sellbom, Kongerslev, Simonsen, Krueger and Mulder38 and in particular to investigate personality functioning and personality traits according to the alternative DSM-5 model. Diagnostic criteria of personality disorders have been criticised for their low discriminant validity and overlap of many criteria, which is associated with high comorbidity and low clinical utility. An assessment based on a dimensional approach,Reference Sharp, Wright, Fowler, Frueh, Allen and Oldham39 which regards personality functioning and traits to be present in healthy and clinical populations with varying degree of severity and interlinks personality pathology with the five-factor model, appears promising. In the ICD-11, individual categories of personality disorders will disappear. Increase of prevalence rates may be one implication as the diagnosis can then be made at any time of life.Reference Tyrer, Crawford, Sanatinia, Tyrer, Cooper and Muller-Pollard40 Newly developed instruments like the Personality Inventory for DSM-5, which covers the 25 trait facets of the alternative DSM-5 model Criterion B and has shown initially good reliability and validity,Reference Bach, Maples-Keller, Bo and Simonsen16 may prove useful.
Furthermore, the course of personality disorders needs to be investigated.Reference Newton-Howes, Clark and Chanen37 For some personality disorders, it has been argued that specific symptoms decline with age, e.g. emotional instability in BPD. However, in light of lacking systematic data, longitudinal studies are required. Moreover, in light of the high prevalence of personality disorders and associated substantial individual and societal burden, personality disorders should be included in global studies of the burden of mental disorders to improve understanding of population mental health.Reference Skodol3, Reference Moran, Romaniuk, Coffey, Chanen, Degenhardt and Borschmann4 Finally, a larger epidemiological database based on a sound and sophisticated methodology would allow for more accurate treatment planning and the provision of efficient treatments for patients with personality disorders. This could potentially reduce the burden and cost of personality disorders and reduce stigma and discrimination.
Supplementary material
Supplementary material is available online at https://doi.org/10.1192/bjp.2018.202.


eLetters
No eLetters have been published for this article.