


Traumatic injuries affect millions of people each year, and cause marked impairment. For example, road traffic traumatic injuries are projected to be the third largest burden of disease globally by 2020. Reference Murray and Lopez1 These injuries often result in psychological injury and particularly post-traumatic stress disorder (PTSD). Reference Bryant, Creamer, O'Donnell, Silove, Clark and McFarlane2 One study of 2931 injury patients found that 23% developed PTSD at 12 months after the injury. Reference Zatzick, Rivara, Nathens, Jurkovich, Wang and Fan3 One of the major limitations of previous research on psychological effects of injury is the focus on the diagnostic category of PTSD. This is limited because it presumes that the PTSD diagnosis adequately captures those patients with impairment. However, subsyndromal levels of PTSD can contribute to marked impairment, Reference Stein, Walker, Hazen and Forde4 indicating that it is more important to study the severity of symptoms than the diagnostic category. In recent years latent growth mixture modelling (LGMM) has been applied to studying PTSD responses following traumatic events. Reference Muthén and Kaplan5 This approach classifies homogenous groups in a population to identify class of individual variation over time. The growth curves can be modelled separately, which permits identification of different trajectories of response. Most studies of PTSD trajectory have identified four major trajectories following traumatic experience: (a) resilient class with consistently few PTSD symptoms (also referred to as ‘resistant’ by some researchers Reference Norris, Tracy and Galea6 ), (b) recovery with initial distress then gradual remission over time, (c) delayed reaction with worsening symptoms over time, and (d) chronic distress with consistently high PTSD levels. These patterns have been found across different trauma populations. Reference Pietrzak, Van Ness, Fried, Galea and Norris7,Reference Bonanno, Mancini, Horton, Powell, Leardmann and Boyko8 The limitation of these studies to date is the short-term nature of the assessments; the majority have limited their study to 1 year after the trauma and the longest trajectory analysis of traumatic injury survivors is 6 months. Reference deRoon-Cassini, Mancini, Rusch and Bonanno9 Accordingly, this study reports the largest, and longest, multisite analysis of PTSD reactions following traumatic injury that indexed PTSD reactions in hospital following traumatic injury and again at 3, 12, 24 and 72 months after injury.
Method
Participants
These data were collected as part of a 6-year follow-up of injury patients recruited from four hospitals in three states of Australia (in the period April 2004 to February 2006). All patients were admitted into the trauma service for at least 24 h and met the DSM-IV Criterion A1. 10 Approval for this study was gained from the Human Research Ethics Committee (HREC) at each hospital. Patients were recruited to the study if they had experienced a traumatic injury (following motor vehicle accident, assault, traumatic fall or work injury) that required a hospital admission of greater than 24 h, were aged between 16 and 70 years, and had sufficient English comprehension to complete the assessment. Patients were excluded if they experienced a moderate to severe traumatic brain injury, or were currently suicidal or psychotic.
Weekday trauma service admissions over a 22-month period were randomly selected. Only weekday admissions were included because of limitations in recruitment resources. Random selection occurred through an automated procedure, stratified by length of stay; this was done because the numbers of patients admitted to each trauma service was far greater than the study’s recruitment resources allowed. Of the 1590 patients identified for the study, 1084 (68%) consented to participate. At 72 months 613 (56.5% of participants) completed the assessment. Of the 1084 initially assessed, 437 (40%) sustained a mild traumatic brain injury (mTBI), which was defined as acute brain injury resulting from external insult to the head and confusion or disorientation, loss of consciousness for 30 min or less, post-traumatic amnesia for less than 24 h and a Glasgow Coma Scale (GCS) of 13 to 15 after 30 min. Reference Carroll, Cassidy, Holm, Kraus and Coronado11 Participant characteristics, according to mTBI status, are presented in Table 1.
Table 1 Demographic characteristics
| Total, % (n) (n = 1084) |
Mild traumatic brain injury, % (n) (n = 437) |
Non-mild traumatic brain injury, % (n) (n = 647) |
|
|---|---|---|---|
| Gender | |||
| Male | 72.7 (788) | 71.7 (310) | 73.9 (478) |
| Female | 27.3 (296) | 28.3 (127) | 26.1 (169) |
| Age | |||
| 18–24 | 21.2 (230) | 26.8 (117) | 17.5 (113) |
| 25–34 | 23.3 (253) | 24.7 (108) | 22.4 (145) |
| 35–44 | 22.6 (245) | 20.6 (90) | 24.0 (155) |
| 45–54 | 19.4 (210) | 16.7 (73) | 21.2 (137) |
| 55–64 | 11.2 (121) | 10.3 (45) | 11.7 (76) |
| 65+ | 2.3 (25) | 0.9 (4) | 3.2 (21) |
| Type of injury | |||
| Transport | 64.5 (699) | 75.9 (332) | 56.7 (367) |
| Assault | 6.1 (66) | 8.7 (38) | 4.3 (28) |
| Traumatic fall | 14.4 (156) | 7.8 (34) | 18.9 (122) |
| Work Injury | 7.2 (78) | 2.5 (11) | 10.4 (67) |
| Other Injury | 7.8 (85) | 5.0 (22) | 9.7 (63) |
| Injury Severity Score | |||
| Minimum | 7.5 (81) | 4.8 (21) | 9.3 (60) |
| Moderate | 28.8 (312) | 25.4 (111) | 31.1 (201) |
| Severe | 44.2 (479) | 38.0 (166) | 48.4 (313) |
| Serious | 13.4 (145) | 21.3 (93) | 8.2 (53) |
| Critical | 6.1 (66) | 10.5 (46) | 3.0 (20) |
| Ethnic status | |||
| White | 87.6 (950) | 86.3 (377) | 86.2 (558) |
| Other | 12.4 (134) | 13.7 (60) | 13.8 (89) |
| Marital status | |||
| Married/de facto | 48.2 (522) | 48.5 (212) | 47.9 (310) |
| Single | 51.9 (562) | 51.5 (225) | 52.1 (337) |
| Employment status | |||
| Employed | 78.8 (854) | 79.2 (346) | 78.5 (508) |
| Unemployed | 6.0 (65) | 5.7 (25) | 6.2 (40) |
| Not in labourFootnote a | 15.2 (165) | 15.1 (66) | 15.3 (99) |
| Education | |||
| Bachelor degree or higher | 17.2 (186) | 16.7 (73) | 17.5 (113) |
| Diploma | 5.4 (58) | 5.0 (22) | 5.6 (36) |
| Trade | 36.5 (396) | 36.8 (161) | 36.3 (235) |
| High school | 41.0 (444) | 41.5 (181) | 40.6 (263) |
a. Neither employed nor seeking work.
Of those who completed the 6-year assessment, the majority were male (72%; n = 441) with an average age of 40 years (s.d. = 13.48). Half the sample was married or in a de facto relationship (53%; n = 325). On average patients spent 13.32 days (s.d. = 14.61) in hospital. In total, 43% of participants sustained a mTBI (n = 236) and the mean Injury Severity Score (ISS) Reference Baker, O'Neil, Haddon and Long12 was 11.12 (s.d. = 7.80), which is in the moderate range of severity. The principal mechanism of injury was transport accident (66%, n = 407), followed by traumatic falls (16%, n = 97), assault (6%, n = 36), work-related accidents not specified in the above categories (5%, n = 30) and other (such as electrocution, mudslides and rockfalls, and near-drownings; 7%, n = 43).
Individuals who refused to participate in the study did not differ from participants in gender, the presence of a mTBI, education, mechanism of injury, length of stay or ISS. Those who did not complete the 72-month assessment did not differ from those who were recruited in terms of gender, the presence of a mTBI, education, mechanism of injury, length of stay or ISS. Those who did not complete the 6-year assessment differed from completers in that they were more likely to be younger (mean 36.33 (s.d. = 13.56) v. 39.53 (s.d. = 13.48), (t(1126) = 3.97, P<0.001) and have higher baseline Clinician-Administered PTSD Scale for DSM-IV (CAPS) Reference Blake, Weathers, Nagy, Kaloupek, Charney and Keane13 scores (mean 20.21 (s.d. = 17.89) v. 16.13, (s.d. = 15.06), (t(1113.9) = 4.17, P<0.001).
Procedures
The study procedures were fully explained to the patients who met inclusion criteria and written informed consent was obtained. Whereas the baseline assessment was conducted in person in hospital, each subsequent assessment was conducted via telephone to determine psychiatric diagnosis and self-report questionnaires with prepaid return envelopes were sent to participants to assess disability and quality of life.
Measures
PTSD
Symptom severity of PTSD and diagnosis were assessed using CAPS. Reference Blake, Weathers, Nagy, Kaloupek, Charney and Keane13 This structured clinical interview is one of the most widely used tools for diagnosing PTSD and has demonstrated excellent reliability and validity. Reference Weathers, Keane and Davidson14 The CAPS interviews were conducted via telephone, a method that has been shown to be as valid and reliable as face-to-face interviews. Reference Aziz and Kenford15 All interviews were digitally recorded to ensure ongoing adherence to the protocol. To test interrater reliability, 5% of all CAPS interviews were assessed by an independent assessor who was masked to the original scoring. Overall, the diagnostic consistency on the CAPS was 100%.
Lifetime psychiatric disorder
The Mini International Neuropsychiatric Interview Version 5.5 (MINI) Reference Sheehan, Lecrubier, Harnett-Sheehan, Amorim, Janavs and Weiller16 was used at the baseline assessment to assess a diagnosis of major depressive episode, panic disorder, agoraphobia, social phobia, obsessive-compulsive disorder, generalised anxiety disorder, alcohol misuse and dependence, and marijuana misuse and dependence. The MINI is a short, structured diagnostic interview based on the DSM-IV and the ICD-10 17 classification of mental illness, especially designed to be used in clinical trials and epidemiological studies. The MINI consists of a set of screening questions and modules; modules are administered if a patient responds positively to the screening question. The MINI has good reliability for all diagnosis when compared with the CIDI. Reference Sheehan, Lecrubier, Harnett-Sheehan, Amorim, Janavs and Weiller16
Functional outcomes
We used the psychological domain scale from the World Health Organization Quality of Life – Bref (WHOQOL-Bref) Reference Harper and Power18 to measure quality of life. The WHOQOL-Bref psychological domain is an eight-item scale that assesses quality of life in terms of perception and satisfaction across a number of life areas. The WHOQOL-Bref demonstrates good discriminant validity, content validity, internal consistency and test-retest reliability. Reference Harper and Power18 In the current study, a scoring algorithm was used to standardise scores to a 0–100 scale with higher scores indicating higher quality of life. Australian population norms were used to identify thresholds and a score of 55.5 was used as the cut-off for poor psychological quality of life. Reference Hawthorne, Herrman and Murphy19
Stressful life events
Subsequent aversive events were assessed by an adaptation of the Recent Life Events Questionnaire. Reference Brugha, Bebbington, Tennant and Hurry20 The RLEQ indexes the occurrence of 20 common stressful life events that encompass both traumatic (for example, assaults) and aversive (for example, losing one’s job) events.
Data analysis
We employed latent class growth analysis (LCGA) to examine PTSD trajectories, using Mplus version 6.2 for Windows. Reference Muthén and Muthén21 LCGA models heterogeneity in longitudinal data by identifying symptom trajectories across time. Mplus employs a robust full information maximum likelihood estimation procedure to account for missing data. We first identified the best-fitting unconditional trajectory model by comparing the model fit of progressive numbers of classes. After finding the best fitting unconditional model, we integrated covariates into this model (conditional model). The following variables were examined on the basis of evidence that they influence risk for PTSD: gender, age at admission, heart rate upon admission, respiration rate upon admission, ISS, mTBI, admission into the ICU and psychiatric history. Reference Brewin, Andrews and Valentine22 Only variables that significantly predicted class membership were retained (see online supplement).
We then tested a series of nested models using the five-class solution to identify covariates that improved model fit. We tested the same covariates listed above, as well as recent stressful life events at 3 months, 12 months and 24 months. Only covariates that were significant predictors of class membership and improved model fit were retained in the final solution. We used multiple imputation in MPlus to impute missing values of covariates. Logistic regression analyses were conducted to identify predictors of class membership for the five-class conditional model (see Table 3).
Table 3 Baseline predictors of trajectory membership

| Class, odds ratio (95% CI) | ||||
|---|---|---|---|---|
| Variable | Chronic | Recovered | Worsening/recovery | Worsening |
| Compared with resilient | ||||
| Gender | 5.47Footnote * (2.48–12.07) | 2.91Footnote ** (1.31–6.44) | 0.82 (0.36–1.87) | 2.13Footnote ** (1.19–3.82) |
| Mild traumatic brain injury | 2.88Footnote ** (1.29–6.43) | 2.25 (0.83–6.13) | 1.94Footnote ** (1.06–3.55) | 2.01 (1.09–3.70) |
| Life events 3 months | 1.67Footnote * (1.41–5.35) | 1.34 (1.01–1.77) | 1.30Footnote ** (1.03–1.64) | 1.16 (0.92–1.47) |
| Life events 12 months | 1.54Footnote * (1.23–1.98) | 1.27Footnote ** (0.99–1.65) | 1.44Footnote * (1.21–1.71) | 1.55Footnote * (1.31–1.84) |
| Life events 24 months | 1.31Footnote * (1.09–1.58) | 1.14 (0.97–1.32) | 1.23Footnote ** (1.06–1.43) | 1.05 (0.90–1.22) |
| Compared with worsening | ||||
| Gender | 2.57 (1.06–6.23) | 1.37 (0.56–3.34) | 0.38 (0.15–1.00) | |
| Mild traumatic brain injury | 1.43 (0.53–3.91) | 1.12 (0.46–2.75) | 0.96 (0.45–2.05) | |
| Life events 3 months | 1.43Footnote * (1.15–1.78) | 1.15 (0.89–1.48) | 1.12 (0.88–1.42) | |
| Life events 12 months | 1.02 (0.81–1.28) | 0.82 (0.59–1.13) | 0.93Footnote * (0.74–1.15) | |
| Life events 24 months | 1.25Footnote ** (1.03–1.52) | 1.08 (0.90–1.30) | 1.18 (0.97–1.43) | |
| Compared with worsening/recovery | ||||
| Gender | 6.69Footnote * (2.30–19.48) | 3.56Footnote ** (1.36–9.29) | ||
| Mild traumatic brain injury | 1.49 (0.55–3.99) | 1.16 (0.43–3.11) | ||
| Life events 3 months | 1.28 (1.03–1.59) | 1.03 (0.82–1.29) | ||
| Life events 12 months | 1.10 (0.85–1.42) | 0.89 (0.67–1.18) | ||
| Life events 24 months | 1.07 (0.87–1.30) | 0.92 (0.76–1.12) | ||
| Compared with recovered | ||||
| Gender | 1.88 (0.62–5.72) | |||
| Mild traumatic brain injury | 1.28 (0.32–5.19) | |||
| Life events 3 months | 1.24 (0.99–1.57) | |||
| Life events 12 months | 1.24 (0.87–1.77) | |||
| Life events 24 months | 1.16 (0.95–1.41) | |||
* P < 0.001
** P < 0.01.
Results
Unconditional model
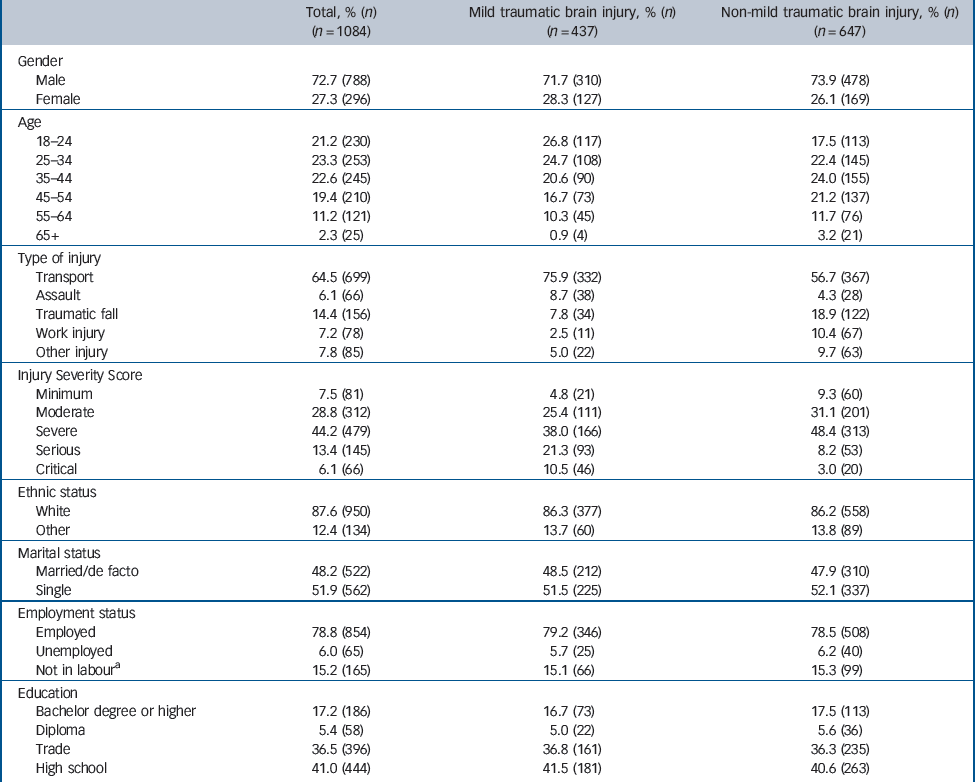
Figure 1 displays the trajectories identified in the five-class solution. Individuals in the chronic class (4%) displayed a pattern of initially high levels of PTSD symptoms that increase over the subsequent 24 months, and remain elevated by the 6 year measurement. Those in the recovery class (6%) displayed a pattern of high levels of PTSD symptoms initially that reduce consistently over the subsequent 6 years. Participants in the worsening/recovery class (8%) displayed a pattern of relatively low initial symptoms of PTSD that increase over the subsequent 24 months before returning to their initial level by the 6-year measurement. Individuals in the worsening class (10%) displayed a trajectory in which participants report relatively low levels of PTSD symptoms at baseline but these increase gradually over the subsequent 6 years. Finally, those in the resilient class (73%) displayed consistently low levels of PTSD symptoms over the 6 years of the study (see online supplement).
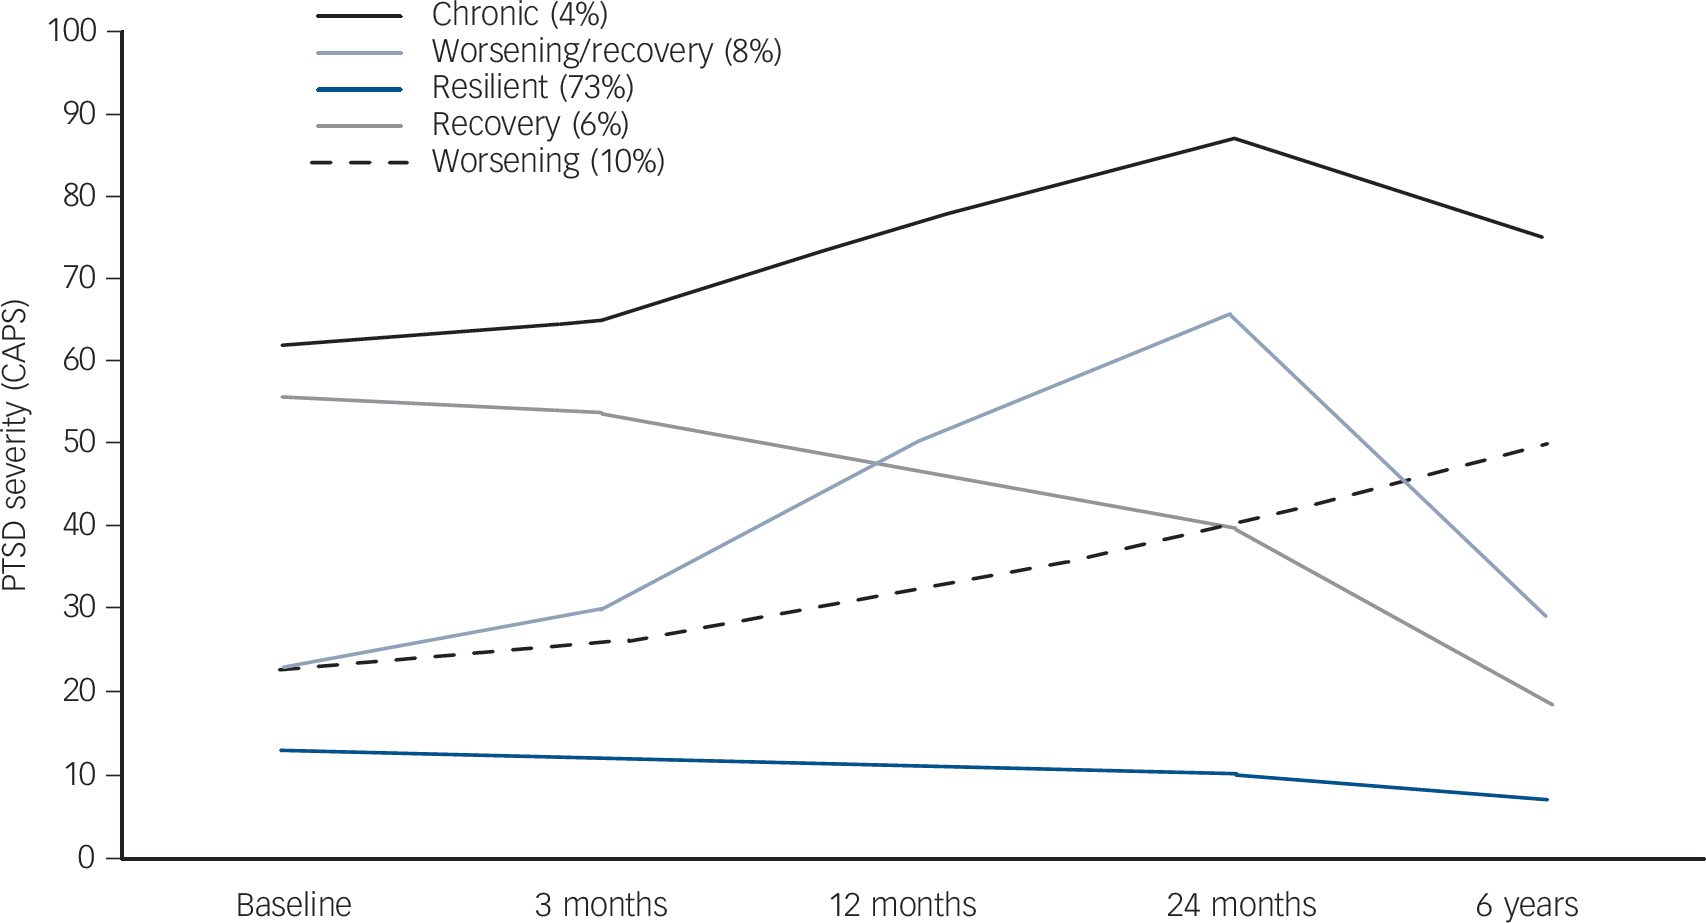
Fig. 1 Trajectories of post-traumatic stress disorder (PTSD) response after traumatic injury.
Patients followed five distinct trajectories: a chronic class (4%), a recovery class (6%), a worsening/recovery class (8%), a worsening class (10%) and a resilient class (73%). CAPS, Clinician-Administered PTSD Scale for DSM-IV.
Functional impairment
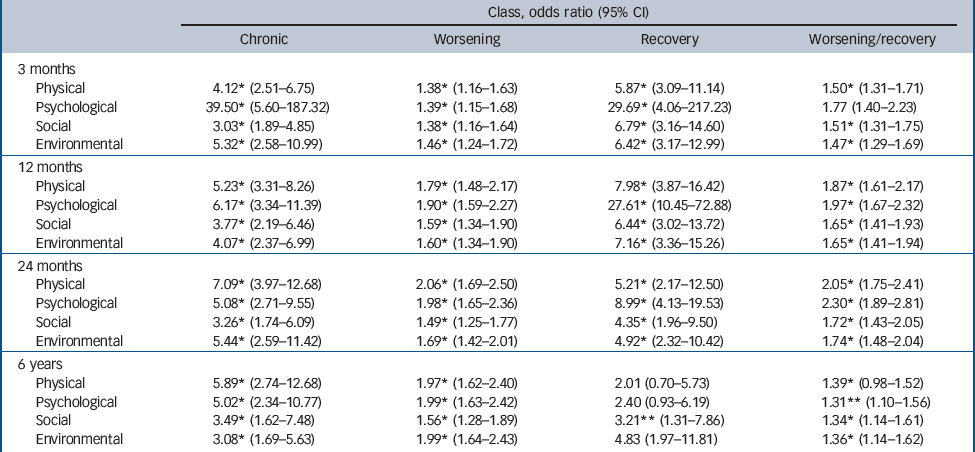
Table 2 presents the odds ratios of impaired functioning (as indexed by the WHOQOL) for each trajectory class at 3, 12, 24 months and 6 years. Notably, each of the chronic, worsening, recovery and worsening/recovery classes displayed more impaired functioning across the different functioning domains than the resilient class over the initial 2 years. Interesting patterns emerged at the 6-year assessment, however, when the recovery and worsening/recovery class showed less impairment. The recovery class was no more impaired than the resilient class by 6 years. Although the worsening/recovery class was still more impaired than the resilient class at 6 years, the extent of this difference had diminished markedly relative to the previous assessments; the odds ratios of impaired functioning in the worsening/recovery class were at least one-third of those at the 24- and 12-month assessments.
Table 2 Odds ratios of functioning impairment according to trajectory class relative to resilient class
| Class, odds ratio (95% CI) | ||||
|---|---|---|---|---|
| Chronic | Worsening | Recovery | Worsening/recovery | |
| 3 months | ||||
| Physical | 4.12Footnote * (2.51–6.75) | 1.38Footnote * (1.16–1.63) | 5.87Footnote * (3.09–11.14) | 1.50Footnote * (1.31–1.71) |
| Psychological | 39.50Footnote * (5.60–187.32) | 1.39Footnote * (1.15–1.68) | 29.69Footnote * (4.06–217.23) | 1.77 (1.40–2.23) |
| Social | 3.03Footnote * (1.89–4.85) | 1.38Footnote * (1.16–1.64) | 6.79Footnote * (3.16–14.60) | 1.51Footnote * (1.31–1.75) |
| Environmental | 5.32Footnote * (2.58–10.99) | 1.46Footnote * (1.24–1.72) | 6.42Footnote * (3.17–12.99) | 1.47Footnote * (1.29–1.69) |
| 12 months | ||||
| Physical | 5.23Footnote * (3.31–8.26) | 1.79Footnote * (1.48–2.17) | 7.98Footnote * (3.87–16.42) | 1.87Footnote * (1.61–2.17) |
| Psychological | 6.17Footnote * (3.34–11.39) | 1.90Footnote * (1.59–2.27) | 27.61Footnote * (10.45–72.88) | 1.97Footnote * (1.67–2.32) |
| Social | 3.77Footnote * (2.19–6.46) | 1.59Footnote * (1.34–1.90) | 6.44Footnote * (3.02–13.72) | 1.65Footnote * (1.41–1.93) |
| Environmental | 4.07Footnote * (2.37–6.99) | 1.60Footnote * (1.34–1.90) | 7.16Footnote * (3.36–15.26) | 1.65Footnote * (1.41–1.94) |
| 24 months | ||||
| Physical | 7.09Footnote * (3.97–12.68) | 2.06Footnote * (1.69–2.50) | 5.21Footnote * (2.17–12.50) | 2.05Footnote * (1.75–2.41) |
| Psychological | 5.08Footnote * (2.71–9.55) | 1.98Footnote * (1.65–2.36) | 8.99Footnote * (4.13–19.53) | 2.30Footnote * (1.89–2.81) |
| Social | 3.26Footnote * (1.74–6.09) | 1.49Footnote * (1.25–1.77) | 4.35Footnote * (1.96–9.50) | 1.72Footnote * (1.43–2.05) |
| Environmental | 5.44Footnote * (2.59–11.42) | 1.69Footnote * (1.42–2.01) | 4.92Footnote * (2.32–10.42) | 1.74Footnote * (1.48–2.04) |
| 6 years | ||||
| Physical | 5.89Footnote * (2.74–12.68) | 1.97Footnote * (1.62–2.40) | 2.01 (0.70–5.73) | 1.39Footnote * (0.98–1.52) |
| Psychological | 5.02Footnote * (2.34–10.77) | 1.99Footnote * (1.63–2.42) | 2.40 (0.93–6.19) | 1.31Footnote ** (1.10–1.56) |
| Social | 3.49Footnote * (1.62–7.48) | 1.56Footnote * (1.28–1.89) | 3.21Footnote ** (1.31–7.86) | 1.34Footnote * (1.14–1.61) |
| Environmental | 3.08Footnote * (1.69–5.63) | 1.99Footnote * (1.64–2.43) | 4.83 (1.97–11.81) | 1.36Footnote * (1.14–1.62) |
* P < 0.001
** P < 0.01.
Conditional model
Following the unconditional model, we examined a series of nested five-class models to investigate the impact of the inclusion of covariates on model fit. Significant covariates included gender, mTBI and life events at 3 months, 12 months and 24 months following trauma exposure. Model fit was improved by the inclusion of these covariates. The structure of the five-class solution remained consistent between the unconditional and conditional models. Class membership proportions, and intercept, linear slope and quadratic slope parameters for each class are presented in online Table DS2 for the unconditional and conditional models. Class membership remained largely consistent across the unconditional and conditional models (Chronic unconditional 5.2% v. conditional 5.2%; worsening/recovery unconditional 8.1% v. conditional 8.1%, worsening unconditional 9.6% v. conditional 10.2%, recovery unconditional 5.7% v. conditional 8.2%, resilient unconditional 72.3% v. conditional 68.3%). Similarly, the magnitude and significance of intercept, linear slope and quadratic slope parameters remained consistent across the unconditional and conditional models, with the exception of the quadratic slope component of the resilient class, which was statistically significant in the unconditional model, but not in the conditional model.
Covariate predictors of trajectory class
Female gender was associated with membership in the chronic, recovered, and worsening classes (relative to the resilient class; Table 3). Membership in the chronic, worsening/recovery and
worsening classes was predicted (relative to the resilient class) by the presence of mTBI at the time of injury. Stressful recent life events at 3 months predicted membership in the chronic, recovered and worsening recovery classes (relative to the resilient class). Stressful recent life events at 12 months predicted membership in all of the symptomatic classes, compared with the resilient class. Stressful recent life events at 24 months predicted membership in the chronic and worsening/recovery classes, relative to the resilient class. Female gender predicted membership in the chronic and resilient classes, compared with the worsening/recovery class.
Mental health service utilisation
A one-way analysis of variance (ANOVA) of visits to mental health professionals between trajectory classes indicated a significant effect (F(4, 611) = 20.53, P = 0.000). Participants in the chronic class (mean 7.16, s.d. = 9.76) and the worsening class (mean 4.02, s.d. = 6.53) reported more mental health visits than those in the worsening/recovery class (mean 2.57, s.d. = 5.77) and recovery class (mean 1.05, s.d. = 2.80), who in turn had more visits than those in the resilient class (mean 0.70, s.d. = 2.29).
Discussion
Main findings
This study found five different trajectories of PTSD response over the 6 years after injury. Consistent with previous studies, we observed a chronic trajectory that maintained elevated PTSD symptoms over 6 years, a resilient group that had very few symptoms at any point, a recovery trajectory that showed initial symptoms that eased over time, and a delayed or worsening trajectory. In addition, and unlike previous studies, we observed a group of patients who worsened over time but then recovered (worsening/recovery).
The most concerning finding of this study is that a small, but significant, proportion of trauma survivors display persistently chronic stress reactions. The chronic class showed no signs of remitting, even after 6 years, and suggests that they are embarking on a very long-term course of PTSD. Worryingly, this group had more overall psychological impairment, as measured by the WHOQOL, than any other group at each assessment. This pattern suggests that this subgroup of injury survivors is likely to experience long-term impairment. The other curious finding, in those with a recovery trajectory, was that they had comparably impaired functioning relative to those in the chronic class. This points to the possibility that having experienced more severe PTSD this left residual impairments despite the remission of symptoms; this interpretation is consistent with findings that comparable levels of impairment are found in people with full and subsyndromal PTSD. Reference Stein, Walker, Hazen and Forde4,Reference Zlotnick, Franklin and Zimmerman23
Comparison with findings from other studies
The most novel aspect of this study was it followed up trauma survivors at least 3 years longer than previous studies. By adopting this approach, we were able to demonstrate that nearly one-tenth of the cohort who appeared to be moving on a trajectory towards worsening PTSD 2 years after the injury, subsequently recovered by 6 years. This suggests that it will take some trauma survivors considerably longer to adapt to the injury than others, even though it appears in the initial years that they are on a worsening trajectory. This observation contrasts with previous studies that have ceased assessing patients at shorter time frames since the trauma. Whereas these studies conclude that a subgroup of trauma survivors will be on a course of worsening symptoms, Reference deRoon-Cassini, Mancini, Rusch and Bonanno9,Reference Bonanno, Kennedy, Galatzer-Levy, Lude and Elfstrom24 our longer-term follow-up suggests that these short-term follow-ups portray an incomplete profile of adaptation because many of these patients who are initially worsening over time do eventually recover.
Identifying those most at risk of long-term mental health problems
One of the challenges raised by the current findings is how early detection can be achieved in the acute phase after traumatic injury to identify the subsequent trajectory that patients will follow. Figure 1 highlights that in hospital there were essentially two groups of patients: those with elevated PTSD levels (including those belonging to the chronic and recovery classes) and those with low PTSD levels (including those belonging to the resilient, worsening and worsening/recovery classes). The current findings underscore how mental health outcomes cannot necessarily be predicted on the basis of severity of injury, as injury severity score was not a consistent predictor of subsequent outcome. Prior attempts to identify longer-term adaptation after trauma have been modest. Reference Bryant25 However, admission to ICU did differentiate the chronic from resilient class, suggesting that ICU admission may be one potential marker of those who are more at risk of long-term PTSD symptoms. The current findings highlight that a major reason for this difficulty in accurate prediction of outcome of psychological state is that there is not a linear relationship between acute and longer-term responses.
In terms of predictors of trajectory classes, mTBI may contribute to worse outcomes following trauma for several possible reasons. The prevailing models of PTSD postulate that the disorder is maintained because of impaired regulation of the amygdala by the ventral medial prefrontal cortex. Reference Rauch, Shin and Phelps26 The prefrontal cortex is commonly impaired in mTBI and so this damage may compromise the capacity of patients to manage the emotional sequelae and cognitive demands of the traumatic experience. Reference Bryant27 This finding suggests that patients with mTBI should be considered at higher risk for one of the trajectories that will lead to longer-term psychological problems following traumatic injury.
The finding that stressful life events since the trauma characterised poor adjustment at each assessment accords with evidence that post-trauma stressors are associated with PTSD. Reference Smid, van der Velden, Lensvelt-Mulders, Knipscheer, Gersons and Kleber28 Fear-reinstatement models explain this finding in terms of subsequent stressors reactivating previously conditioned trauma responses. Reference Norrholm, Jovanovic, Vervliet, Myers, Davis and Rothbaum29 Sensitisation models posit that trauma can sensitise neural circuitry, which then leads to excessive stress responses to aversive events. Reference Post, Weiss, Smith, Friedman, Charney and Deutch30 Further, resource models account for this pattern in terms of additional stressors diminishing limited resources following trauma, and this compounds the PTSD reaction. Reference Hobfoll, Tracy and Galea31 In any case, these findings highlight that the trajectory one follows after trauma will be influenced by ongoing stressors.
The pattern of female gender being associated with more distressed trajectory classes is consistent with evidence that females are markedly more at risk of PTSD than males. Reference Brewin, Andrews and Valentine22 One curious finding was that female gender predicted membership of the resilient class relative to the worsening/recovery class. The worsening/recovery class, which has not been previously identified in trajectory analyses, reflects a course in which there is a time-limited period of worsening distress followed by good mental health. This trajectory is poorly understood and it is difficult to understand why females are more likely to be included in the resilient class than in the class that is worsening and then recovering. It is possible that worsening symptoms followed by recovery reflects a distinctive pathway that is less susceptible to the expected influences of gender. This course requires further study to understand the predictors of this long-term recovery. In this context, we also note that it is possible that some traumatic injury patients may have a worsening trajectory during the protracted period of physical injury, pain and rehabilitation, followed by remission of symptoms as they progress beyond this period.
Three of the trajectories were characterised by a worsening of symptoms over the initial year after traumatic injury: the chronic, worsening, and worsening/recovery classes. This observation is consistent with sensitisation models of PTSD, which propose a vulnerability to excessive responses to less stressful events following traumatic exposure because neural circuitry is sensitised by the initial traumatic experience. Reference McFarlane32 This model accords with evidence that prior trauma is linked to more reactive responses to subsequent stressors. Reference Breslau, Davis and Andreski33 There is also evidence that trauma survivors who subsequently develop PTSD do not display elevated startle responses immediately after the traumatic event but do so after several months have elapsed. Reference Shalev, Peri, Brandes, Freedman, Orr and Pitman34 It is possible that the psychological effects of the traumatic injury may not be fully experienced by survivors in the initial period, however, the subsequent stressors that are often faced by injury survivors may compound initial reactions via sensitisation processes, thereby leading to more severe PTSD responses in the following year. This conclusion remains speculative because to address this issue directly, studies need to model ongoing stressors in terms of how people can transfer between classes over time (via latent transition analysis).
Limitations
We recognise several limitations. First, nearly half the sample was lost by the 6-year assessment, and these participants were younger and had more severe initial PTSD at baseline than those who were retained; this differential drop-out may have affected results. Second, the cohort comprised injury survivors who had been admitted to hospital, and so the findings need to be confirmed in samples exposed to different types of trauma. Third, we assessed PTSD at each follow-up by structured clinical interview via the telephone rather than face-to-face interview; we note, however, that there is very strong concordance between these two formats. Reference Aziz and Kenford15 Fourth, this was a largely male sample and these results may not generalise to females. Fifth, future research could usefully index utilisation of general health services to map how people in different trajectories access services, including profiling of health economics associated with each class.
Implications
The major outcome of this study is that it highlights the long-term psychological dysfunction and associated impairment, experienced by a proportion of traumatically injured patients. One implication of the study is that by identifying the majority of those who are resilient, primary care facilities may be able to triage the remainder of patients to a category that may benefit from either early intervention or subsequent monitoring to index their mental health. Further work is required, however, to develop the means to discriminate between injured patients in the hospital setting who are most likely to enjoy a resilient trajectory and those who at some time may benefit from mental health assistance.


eLetters
No eLetters have been published for this article.