


His-Purkinje conduction system (HPS) pacing involves placing permanent pacing leads along the HPS with the goal of maintaining or restoring physiological, synchronous biventricular activation.1,2 The field of HPS pacing is still in the early development phase and we are far from understanding the complete electrocardiographic and electrophysiological characterisation of this pacing modality. Since the early studies in this field, confirmation of HPS capture has been considered an important aspect of this technique and new diagnostic approaches and criteria are still being developed.3 These methods and criteria focus on differentiation between non-selective (ns) capture – capture of the HPS and the adjacent myocardium – and myocardial-only capture. This review gives a summary of the current knowledge regarding this aspect of HPS pacing.
Standard ECG for Diagnosis of Conduction System Pacing
HPS capture results in faster and more homogenous depolarisation of the left ventricle (LV) than right ventricular septal (RVS) myocardial-only capture. Specifically, depolarisation of the LV does not require slow cell-to-cell spread of activation from the right side to the left side of the interventricular septum but starts at the same time as QRS onset, as in native depolarisation. These phenomena seriously influence QRS complex morphology and form the basis for electrocardiographic differentiation between HPS and myocardial paced QRS.
QRS Notching and Slurring During His Bundle and Left Bundle Branch Pacing
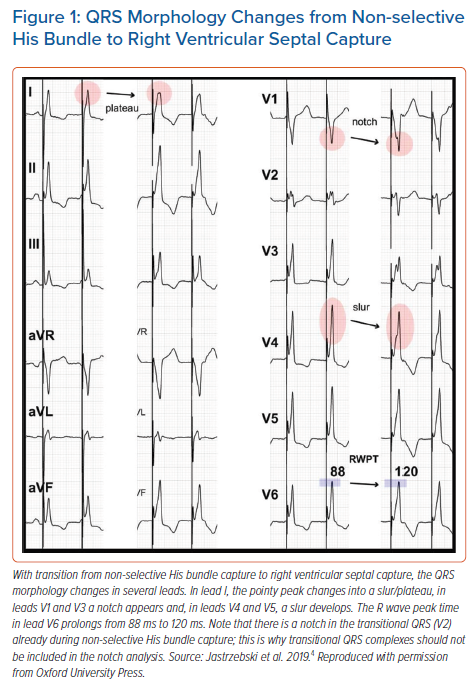
The development of a mid-QRS notch/slur/plateau in left ventricular leads (I, V4-V6), which appears immediately with the loss of HB capture, provides a straightforward, specific morphological criterion (Figure 1).4 These morphological features likely have a similar aetiology to the QRS notch/slur seen during left bundle branch block (LBBB). Loss of HB capture and activation of the LV via the spread of the depolarisation wavefront through the working myocardium of the interventricular septum is parallel to the situation seen during LBBB. Similarly, the use of a QRS notch/slur to recognise loss of HB capture parallels the use of a QRS notch/slur to diagnose loss of conduction in the left bundle branch (LBBB criteria).5
Occasionally, a QRS notch/slur can be seen despite confirmed HB capture. This could be a marker of a non-corrected intra-Hisian or intra-left ventricular conduction disturbance. A non-corrected intra-Hisian conduction problem resulting in a long HV (His-ventricle) interval leads to an excessively large contribution by the direct septal depolarisation to the QRS morphology. Although from a formal point of view in such cases there is HB capture, the ventricular depolarisation is non-physiological and more akin to RVS than ns-HB capture. Therefore, from a clinical point of view, such capture cases could be seen as suboptimal capture or even equivalent to lack of HB capture.
None of ns-LBB, s-LBB or left ventricular septal (LVS) capture typically produces a QRS notch/slur in the left ventricular leads (I, aVL, V4-V6) (Figures 2 and 3). Therefore, this feature, although occasionally observed, is not useful for the diagnosis of loss of conduction system capture during LBB pacing.
Time to V6 R-wave Peak During Conduction System Pacing
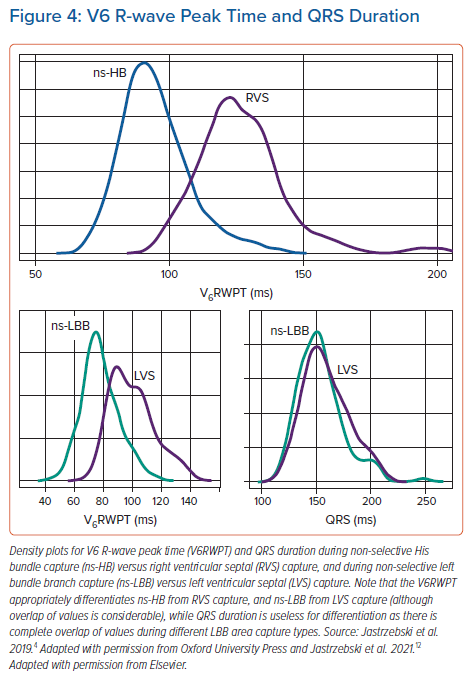
The V6R-wave peak time (V6RWPT) corresponds to the intrinsicoid deflection time in lead V6 that reflects the time it takes for the depolarisation wavefront to reach the epicardial surface of the lateral wall of the LV.6 Since the velocity of conduction in the HPS is much higher than in the working myocardium, it is logical that the V6RWPT would be shorter during HB capture than during RVS capture (Figure 1) and, similarly, shorter during LBB capture than during LVS capture (Figure 2). While this is true, there is a considerable overlap of activation time values, making any V6RWPT criterion based on a fixed cut-off value a trade-off between sensitivity and specificity (Figure 4).4 It may seem that the V6RWPT changes are similar in this regard the global QRS duration change and that it might be enough to assess the QRS duration for differentiation.
However, assessing V6RWPT has several advantages over measuring QRS duration. First, the R-wave peak offers a distinct point for precise measurements; this is in contrast to the QRS offset, which often has a low amplitude and transitions smoothly into the ST-T complex. For this reason, QRS duration measurements have poor reproducibility and accuracy. Second, during non-selective capture, the QRS duration is affected not only by HPS capture or non-capture but also by direct non-physiological septal depolarisation. Third, right ventricle (RV) depolarisation delay during LBB capture and HB capture with non-corrected RBBB significantly prolong the QRS duration. In contrast, the V6RWPT is affected by neither direct septal depolarisation nor RV depolarisation delay. This is because during ns-HB/ns-LBB capture, the lateral wall of the LV is activated purely via the left ventricular HPS.
The term RWPT rather than left ventricular activation time (LVAT) is preferred in this review even though LVAT is used more commonly in HPS pacing-related literature. The term RWPT is recommended by major cardiac societies for the description of the intrinsicoid deflection time and I see no reason to create an alternative term for this well-known, well-established ECG descriptor.6,7 The term RWPT is purely descriptive while LVAT implies a physiological correlation that is somewhat misleading. LV activation lasts until the end of the QRS, not until the R-wave peak; a popular derivative term, such as ‘time to LVAT’, seems grammatically illogical, while ‘peak LVAT’ raises questions on how to define peak activation. Moreover, the term LVAT is already used/defined in cardiac resynchronisation therapy patients for a different, more appropriate ECG metric by Sweeney et al.8 Perhaps the term LVAT should be reserved for examinations such as ECG imaging or endocardial mapping that can determine activation times more precisely.9
Binary Cut-off Criteria Based on V6RWPT
The easiest way to use the V6RWPT as a diagnostic tool is to follow an established, fixed cut-off criterion with known sensitivity and specificity to capture diagnosis. It is vital to ensure measurements are precise as differences of 5–10 ms are diagnostically important. This can be best achieved using digital calipers and a fast sweep speed of 100–200 mm/s; alternatively, a standard ECG at 25 mm/s can be used, albeit only when some method of enlargement is available (computer-based enlargement of a simple graphic file is sufficient).
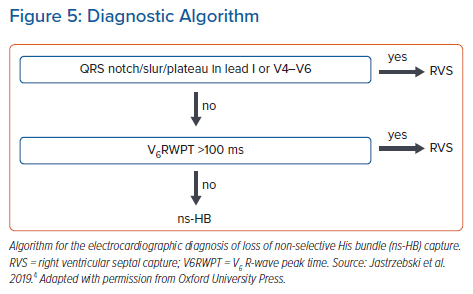
After analysis of a large cohort of patients with HB capture/loss of HB capture, my colleagues and I proposed the criterion of V6RWPT to be ≤100 ms (measured from the pacing stimulus) as 100% specific for HB capture.4 To better balance sensitivity and specificity, a criterion of V6RWPT ≤110 ms might be used. The V6RWPT criterion can be combined with the QRS notch/slur/plateau criterion in the form of a validated diagnostic two-step algorithm (Figure 5).4
Early in the development of the LBB pacing technique, experts proposed using the V6RWPT for the diagnosis of LBB capture, although without recommending a cut-off value.10 Various cut-off points (75–90 ms) have been used since then, as there were no validation studies, and the sensitivity and specificity of these arbitrary cut-offs were not known. Two recent validation studies support the use of V6RWPT <75 ms as a nearly 100% specific criterion; this offers quick and firm LBB capture diagnosis, albeit not in all patients as the sensitivity of this criterion is rather low (70–82%).11,12 In our cohort, V6RWPT <83 ms was identified, with receiver operating characteristics curve analysis having optimal overall diagnostic accuracy for LBB capture diagnosis with a sensitivity and specificity of 84.7% and 96.3%, respectively; this is the value we recommend for general use although, at the time of procedure, a more specific value of <75 ms might be preferred.
For patients with a severely damaged LV conduction system, the above fixed cut-off V6RWPT criteria are even less sensitive; in such patients, it is not uncommon to see LBB capture with V6RWPT >90 ms (one of the reasons for the overlap in values illustrated in Figure 4). Although we have proposed a different cut-off for such patients (V6RWPT <101 ms as diagnostically optimal and V6RWPT <80 ms as 100% specific), it seems that this population requires the use of an individualised V6RWPT criterion for better diagnostic accuracy (see below).12
Using Native QRS/V6RWPT as a Physiological Reference
Conduction system pacing is a physiological pacing method par excellence. The electrocardiographic hallmark of physiological pacing is the preservation or restoration of physiological activation times in the LV.12–14 Therefore, a ‘healthy’ native QRS might offer the best reference to determine if conduction system capture has been achieved. This principle is already implied in the fixed cut-off V6RWPT criteria discussed above. Note that the upper normal value for intrinsicoid deflection time in lead V6 is 50–60 ms (LBBB criteria). If the 40–50 ms of the normal HV interval is added to this interval, then we have the recommend cut-off value of 100–110 ms for HB capture diagnosis given above. Since the usual duration of the LBB potential to QRS interval is approximately 25 ms, then the above V6RWPT criteria of 75–83 ms for LBB capture also conform with known upper limits of normal physiological conduction (25 ms + 50–60 ms = 75–85 ms). However, given the substantial variability of normal activation times and because HPS pacing is often implemented in patients with diseased HPS, a more precise method of determining capture is to compare the obtained activation time during pacing with the native V6RWPT in a particular patient; this serves as an individualised reference (Figure 6).
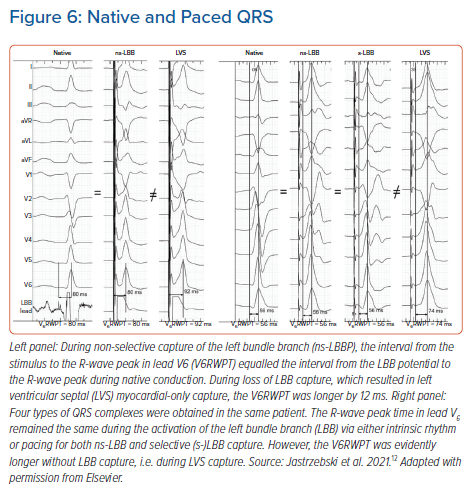
Initially, we applied the above reasoning for patients with LBB pacing, proposing the criteria presented below. If the paced V6RWPT does not exceed the native V6RWPT by more than 10 ms, then LBB capture should be diagnosed but, if it does exceed it, then LVS capture should be diagnosed.12 This approach resulted in a sensitivity of 95–98% and a specificity of 86–88% for the diagnosis of LBB capture, depending on the measurement method used (from LBB potential or from real QRS onset). Note that, to compare native and paced QRS, two physiologically corresponding intervals must be used (Figure 6). If the paced QRS is measured from the pacing stimulus, then the corresponding native interval starts with the conduction system potential (as the pacing stimulus captures the conduction system exactly at the site where the potential is recorded). Therefore, the paced V6RWPT equals the time from the LBB potential to the V6R-wave peak. If the native QRS is measured from the QRS onset rather than from the LBB potential (which is often absent), then the corresponding measurement during pacing should not start from the pacing stimulus – and should omit the initial latency (usually 30 ms of the isoelectric line, partially obscured by the post-stimulus artefact) – but from the true onset of the QRS complex (all 12 leads; high augmentation and fast sweep speed have to be used for this measurement).
As with any diagnostic method, to use this correctly, the limitations and caveats must be known, two of which are especially important.
In patients with LBBB, the ‘healthy’ native V6RWPT cannot be obtained directly. Three possibilities were explored for such patients. First, the most simple method is to obtain the native V6RWPT from fortuitous beats with RBBB morphology (if, during the procedure, complete AV block develops due to the lead/sheath bump on the RBB, then conduction via LBB or escape rhythm originating in distal LBB often appears).12 Second, a more elaborate method is to calculate the approximate myocardial intra-LV conduction time by subtracting the transseptal conduction time from the intrinsicoid deflection time measured in LBBB QRS; if the obtained paced V6RWPT is shorter, it indicates LBB capture.12 Third, the most precise and elegant method is to temporarily restore conduction in the LBB via high-output HB pacing and then approximate the expected native V6RWPT during LBB capture.13
The second caveat is that if the interval from the potential to the QRS is short (<20 ms), indicating that this is not the main LBB potential but the Purkinje potential of LBB arborisation, so the interval from the potential to the R-wave peak does not correspond with the paced V6RWPT since, during pacing, the conduction pathway is partially retrograde.
Recently, we have also used the native left ventricular lateral wall activation time as the reference for the diagnosis of HB capture. Since, in contrast to LBB pacing, during HB pacing the HB potential is almost always recorded at the pacing site and during ns-HB pacing there is no initial latency, only the first method of comparison of conduction times is applicable (i.e. stimulus-V6RWPT = HBpotential-V6RWPT). We formulated the criterion that the interval from the stimulus to the V6RWPT (i.e. paced V6RWPT) should not exceed the corresponding interval during native conduction by more than 12 ms. This criterion offered unparalleled diagnostic accuracy (sensitivity of 100% and specificity of 99.1%).14 However, this method can be used only for patients with non-LBBB native QRS morphology and a normal HV interval duration (55–35 ms). When global QRS duration is used in a similar fashion (stimulus to QRS offset ≤ potential to QRS offset, as proposed by experts), the diagnostic accuracy is much lower (unless the method is limited to patients with narrow QRS), since QRS duration, in contrast to the V6RWPT, is influenced by direct septal myocardial capture.1,14–16
V6–V1 Interval Criterion
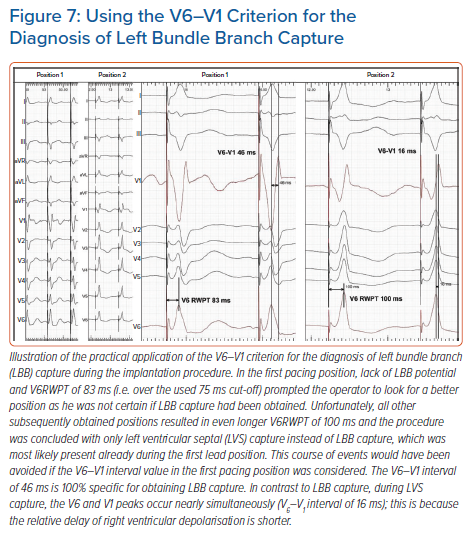
We recently developed a novel marker for LBB capture – the V6–V1 interval.17 This was based on observations that LVS capture results in simultaneous activation of the RV and LV and that in V1 and V6 R-wave peaks occur simultaneously, while during LBB capture RV activation is delayed in comparison to LV activation, hence the V6–V1 interval is longer. This criterion was intended to address some limitations of the V6RWPT criterion.
Long V6RWPT might be caused not only by lack of LBB capture but also be due to initial latency, slower propagation via diseased HPS, substantial LV dilatation or, often, a combination of these factors. The V6–V1 interpeak interval is likely less influenced by these limitations. If there is substantial initial latency or slow conduction through the myocardium, it will affect the timing of the activation of the RV and LV to a similar degree. Consequently, the R-wave peak will be delayed in both V1 and V6, and the V6–V1 interpeak interval will not be affected much. In other words, the R-wave peak in V1 may provide a better reference time point than the pacing stimulus in assessing the timing of the R-wave peak in V6. A value of ≥33 ms was found to be diagnostically optimal to confirm LBB capture, while a value >40 ms was highly specific (recommended to use during the procedure).17
The V6–V1 is especially useful when the V6RWPT criterion is not diagnostic; using both criteria increase the diagnostic yield of ECG analysis. A clinical vignette illustrating the use of this new criterion is presented in Figure 7.
Global QRS Duration for His Bundle Capture Diagnosis
The global QRS duration – the QRS duration measured from the pacing stimulus to the QRS offset using all 12 standard ECG leads – should enable an intuitive and perfect diagnostic criterion. Unfortunately, as we have shown in earlier studies, there is a considerable overlap between the ns-HB QRS and the RVS QRS, and an almost complete overlap between the ns-LBB and the LVS-paced QRS duration.4,12
In patients with a normal HV interval, the paced QRS duration during ns-HB capture equals the sum of the HV interval and the baseline intrinsic QRS duration. Since the upper normal values of the HV interval and QRS are 55 ms and 110 ms, respectively, then an ns-HB-paced QRS, even in the absence of any intraventricular conduction disturbances, can be as wide as 165 ms. A similar duration is obtainable with RVS pacing. Non-corrected intraventricular conduction disturbances can further prolong the duration of an ns-HB-paced QRS. An average ns-HB QRS should be expected to be around 140 ms (HV of 45 ms + QRS of 95 ms) and, indeed, the median value of the ns-HB QRS in a large cohort was 140 ms.4 A diagnostically optimal differentiating cut-off for QRS duration seems to be around 150 ms, while values of <120–130 ms lack sensitivity but are 100% specific for ns-HB capture. The important caveat is that the analysed QRS should be a fully paced QRS and not a fused QRS as is often the case in patients with preserved native conduction during DDD pacing.
Global QRS Duration for Left Bundle Branch Capture Diagnosis
The typical ns-LBB-paced QRS has the terminal R/r wave in lead V1, which is a marker of partially non-corrected delay in RV activation. This delay considerably prolongs ns-LBB-paced QRS duration. While the LVS-paced QRS is relatively narrow, as during LVS capture, there is relatively fast activation of the LV from the left side of the septum, possible early engagement of the LV conduction system and a similar delay in RV and LV activation. Consequently, there is a nearly complete overlap of QRS duration values between ns-LBB and LVS pacing (Figure 4), eliminating QRS duration as a useful parameter for the diagnosis of LBB capture.
Pacing Manoeuvres to Diagnose Conduction System Capture
The HPS and the working myocardium are two different tissues in the heart muscle that vary not only in their conduction velocities but also in their refractoriness and capture thresholds. The two differences can used in the diagnosis of HPS capture/loss of capture using dynamic pacing manoeuvres.
QRS Transition due to Differences in Capture Thresholds During HB Pacing
During the implantation procedure and device follow-up, the most practical and conceptually straightforward method to determine HB capture is a simple threshold test performed in the unipolar pacing mode from the lead tip.3,15 When the pacing output slowly decreases, starting with 8–10 V at 0.5 ms, it is possible to observe a sudden change in QRS morphology in 90–95% of cases (Supplementary Material Figure 1S). When HB or RVS capture is lost, a transition to the RVS QRS or selective (s)-HB QRS, respectively, is observed. The type of transition (ns-HB to RVS or ns-HB to s-HB) depends on which tissue has the higher capture threshold.
It is of diagnostic importance to define when a change in QRS morphology can be considered a transition. Transition to s-HB is diagnosed by the appearance of a latency interval after the pacing stimulus and QRS morphology identical to the native supraventricular QRS, while transition to RVS is diagnosed by QRS prolongation, appearance of a notch/slur/plateau in the left ventricular leads, and sudden prolongation in the V6RWPT by 20 ms or more.4 In patients with an undamaged distal conduction system, the V6RWPT on average prolongs by 33 ms with loss of HB capture; prolongation by less than 20 ms usually indicates non-corrected conduction disturbance (such as LBBB or nonspecific intraventricular conduction delay), resulting in a long V6RWPT during ns-HB capture. Such a situation, as well as the equal HB and RVS capture thresholds seen in 6–10% of cases, can be quite misleading and often requires other manoeuvres to determine HB capture (see below).
In patients with bundle branch blocks, it is possible to observe more QRS transitions because additional correction or loss of correction of LBBB or RBBB often occurs. These transitions are described in detail elsewhere, and are conceptually and clinically important.18 However, in essence, any transition is diagnostic of HB/RBB capture, since during RVS pacing the QRS morphology remains stable until complete loss of capture. One important caveat is that anodal capture should be ruled out; for this, it is enough to perform a threshold test in a unipolar mode.
QRS Transition due to Differences in Capture Thresholds During LBB Pacing
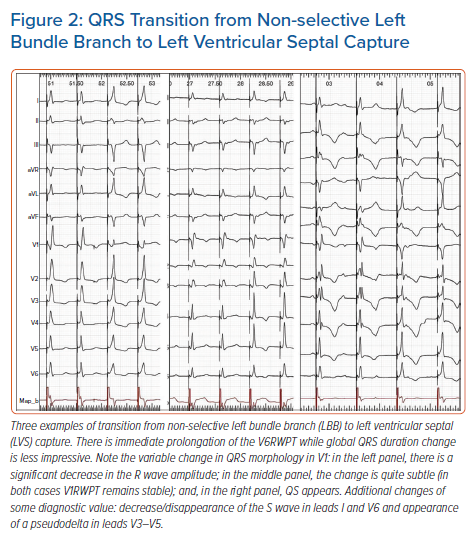
For LBB pacing, output-dependent QRS transition is less useful than it is for HB pacing, as equal capture thresholds are predominant. In our series of >500 LBBP cases, output-dependent QRS transition was observed in only approximately 35% of cases during the procedure and less frequently during follow-up (estimated 18%). Moreover, transition in the acute phase is often a fleeting phenomenon (due to injury/recovery of both tissues) and should be assessed several times; often, it is possible to observe both types of transition on subsequent attempts and then no transition at all at the end of the procedure. Another method to increase diagnostic yield of this method is to use repeated testing at different intermediate lead depths in the septum or during continuous pacing during lead rotation.10,19 A more proximal pacing site and the presence of LBB potential increase the prevalence of output-dependent transition. This is probably why, in a study by Su et al., QRS transition (to s-LBB) was observed intraprocedurally more frequently (74% of cases) than in our laboratory although, similarly to our experience, this was less frequent at follow-up (reduced from 74% to 30%).20 Clearly, this method, although important, cannot serve as the mainstay diagnostic tool for LBB pacing as it could for HB pacing. Typical examples of QRS transition during ns-LBB pacing are illustrated in Figure 2.
Like with HB pacing, a non-selective (ns)-LBBP QRS can transition to either selective (s)-LBB capture QRS or left ventricular septal myocardial (LVS) capture QRS. Transition to LVS capture is marked by sudden V6RWPT prolongation, albeit this is much less prominent in comparison with loss of HB capture and occurs without simultaneous notch/slur development, hence it is easy to miss. This is because during LVS capture, despite the lack of direct depolarisation of the LBB, the activation wavefront does not need to cross the interventricular septum to reach the LV conduction system. Consequently, the V6RWPT prolongs only by the time it takes to reach the nearby Purkinje network/myocardium interface. On average, the V6RWPT prolongs by 18 ms only. Assuming that the myocardial cell-to-cell conduction velocity is 0.5 m/s, the HPS/myocardium interface is located on average only 9 mm from the LBB capture site. V6RWPT prolongation by 10 ms or more was found by us to be 100% sensitive albeit not 100% specific for loss of LBB capture, therefore we used a cut-off of 15 ms as this was 100% specific and still sensitive (97%).12 Recently, Wu et al. found that a cut-off value of 10 ms had similar diagnostic properties (specificity 100%; sensitivity not reported; n=30).11
Apart from V6RWPT prolongation, another important transitional change occurs in the lead V1: the terminal R/r wave decreases in amplitude (although the V1RWPT usually remains stable) or disappears (QS complex in V1) (Figure 2). The type of V1 morphology during LVS capture probably depends on the depth of the pacing helix in the interventricular septum and hence balanced RV/LV activation (QS complex), preferential activation of the RV (broader QS complex), or preferential activation of the LV (Qr/QR complex) occurs.
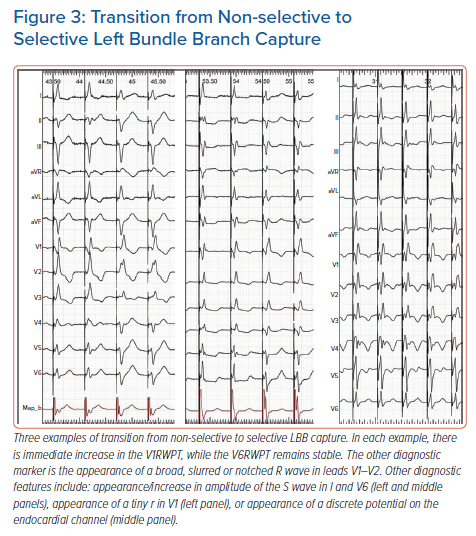
Transition to s-LBB, in contrast to transition to LVS, does not result in V6RWPT prolongation but in V1RWPT prolongation and the spiky terminal R/r wave changing into a broader, slurred R/r wave.17 Often with s-LBB capture, a tiny r wave in leads V1–V2 appears together with an S wave in leads I and V6 (Figure 3).
Besides relying on the above QRS morphology changes as markers of output-dependent QRS transition, two ancillary methods can be employed to ensure that a bona fide transition does occur: appearance of a discrete endocardial potential on the endocardial channel (Figure 3); and appearance of a short latency interval (approximately 20 ms) before the QRS. Appearance of a latency interval is diagnostic of s-HB capture, although it might be missed during s-LBB capture, as it is shorter than during s-HB capture and often obscured by the post-pacing interval artefacts/oversaturation. Moreover, the diagnostic value of latency decreases during LBB pacing since, surprisingly, there is often also an isoelectric interval, which is especially obvious in the precordial leads during LVS capture (Figure 2).
QRS Transition due to Differences in the Absolute Refractory Period
When the capture thresholds of the HPS and the adjacent myocardium are equal, the method of output-dependent QRS transition does not work. This is frequently encountered with LBBP but also occasionally seen with distal HB/RBB pacing. To address this problem, we developed the technique of programmed HPS stimulation, which exploits differences in refractoriness between the HPS and the myocardium.21–23 This method was initially validated for HB capture diagnosis and then also for confirmation of LBB capture. It can be used during implantation, when a programmable external pacemaker/electrophysiological system is employed, or during follow-up using a non-invasive programmed stimulation function implemented in most pacemakers.
Depending on the type of QRS transition obtained – from non-selective to selective HPS or from non-selective to myocardial – we classified the responses to programmed stimulation as ‘selective response’ or ‘myocardial response’; selective response is unquestionably diagnostic of HPS capture, while myocardial response requires differentiation with QRS change due to the encroachment on the relative refractoriness of the myocardium. This is usually not problematic for HB pacing as RVS QRS is most often considerably different from ns-HB QRS (Figures 1 and 8; Supplementary Material Figure 1S), but it is an important limitation of programmed LBB stimulation since differences between LVS QRS and ns-LBB QRS are often relatively subtle (Figures 2 and 6).
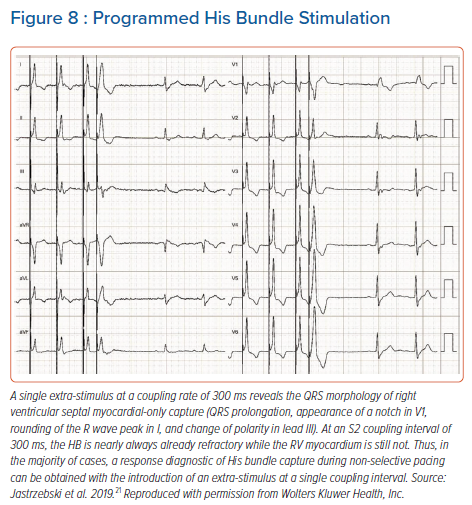
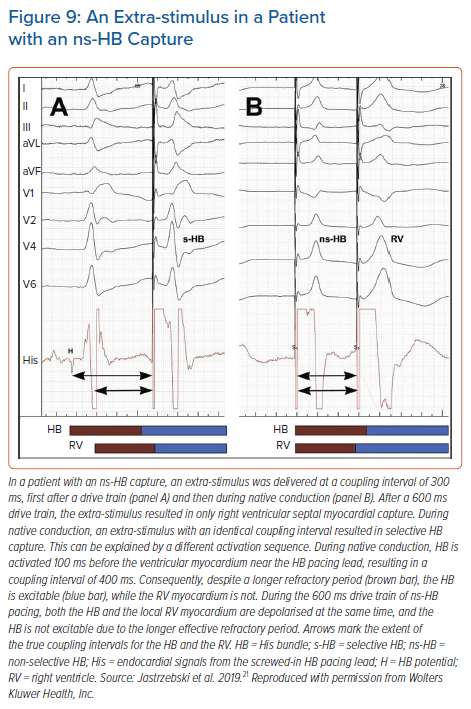
For programmed HB pacing, it is enough to perform an 8-beat drive (S1) with a 600 ms cycle + S2 starting from 400–450 ms and decreasing in 10 ms steps; this will provide a diagnostic response in nearly 100% of cases. With progressively shorter coupling intervals, a sudden change in the QRS morphology of S2 occurs, usually around a coupling interval of 380–320 ms (Figure 8). To obtain a selective HB response, single or double extra-stimuli on intrinsic rhythm or dedicated pacing protocols (see below) are recommended. An extra-stimulus delivered during intrinsic rhythm is more likely to produce selective HB capture because of the local timing of the HB and septal depolarisation at the basal septum; there is more time for the HB to recover and less time for the myocardium to recover (Figure 9). Alternatively, especially during follow-up, an asynchronous slow pacing mode (VOO) can be used to obtain both selective and myocardial response (Figure 2S).
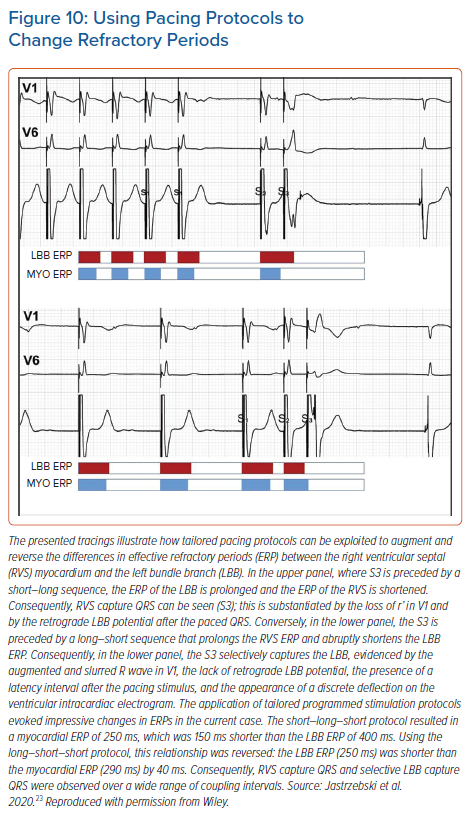
Programmed LBB stimulation is much more rewarding than programmed HB stimulation because it can provide definitive diagnosis of LBB capture, which is so often lacking. Unfortunately, interpretation of responses and pacing protocols are less straightforward. To increase the diagnostic yield of this method, we prefer to use protocols tailored for obtaining selective LBB response and clear-cut myocardial response (Figure 10).23 This is because the standard S1 600 ms drive + S2 often results in a response that is difficult to interpret, owing to the overlap of the QRS morphology change resulting from the bona fide transition with the QRS morphology change resulting from QRS prolongation, due to the relative refractoriness of the myocardium. These two QRS morphology changes can be differentiated by rejecting the QRS change that occurs within the relative refractory period (30–40 ms before complete refractoriness), careful analysis of the change in V6RWPT and assessment of the V6–V1 interval (unpublished data).
To use tailored programmed pacing protocols, it must be realised that the refractory periods are not fixed but determined by the preceding cycles. Generally, short preceding cycles shorten the absolute refractory period. However, as showed by Denker et al., myocardial refractoriness demonstrates the cumulative effect of several preceding cycle lengths (i.e. mainly the basic drive cycle length or intrinsic rhythm), whereas conduction system refractoriness is predominantly influenced by the immediately preceding cycle length.24 This physiology can be easily exploited for HPS capture diagnosis (Figure 10). Myocardial response is facilitated by a fast drive that shortens myocardial refractoriness, followed by one long cycle that prolongs HPS refractoriness. In contrast, a selective response is facilitated by a slow drive that prolongs myocardial refractoriness, followed by one short cycle that shortens HPS refractoriness. If slow drive pacing cannot be accomplished due to faster intrinsic rhythm, then the best alternative to obtain selective LBB response is to try single and double extra-stimuli on intrinsic rhythm, as this is the slowest rhythm obtainable (Supplementary Material Figure 3S).
Alternative methods that can visualise refractoriness-dependent QRS morphology transition are burst and incremental pacing.25 If a selective response cannot be achieved with programmed stimulation, it can be obtained occasionally with burst and/or incremental pacing (Supplementary Material Figure 4S).26 In our practice, we routinely use incremental pacing up to the cycle length of 250 ms – this both ensures that capture is distal to the conduction block and provides additional information regarding capture diagnosis. For burst pacing, we start with a cycle length of 250 ms; if this is not diagnostic due to 2:1 capture, then the cycle length is increased with the goal to observe transition from 2:1 to 1:1 capture, as the sudden change of capture cycle length is most fruitful diagnostically. This method works well for HB pacing although it is limited when used for LBB capture diagnosis. One major limitation of burst pacing is that the predominant type of response is myocardial response, which is even more difficult to categorise for burst pacing than for programmed pacing. Moreover, burst pacing occasionally induces serious ventricular arrhythmias so has to be used with caution in individuals with a vulnerable substrate.
Miscellaneous Methods for His-Purkinje Conduction System Capture Diagnosis
Device Electrograms and Ventriculo-atrial Interval Analysis
Saini et al. reported the use of device electrograms (EGM) analysis for differentiation of various forms of capture during HB pacing.27 They analysed far-field EGM QRS duration, near-field EGM time-to-peak and near-field EGM polarity and found that the device EGM transitions correlated well with QRS morphology transition on a 12-lead ECG. The near-field EGM time-to-peak is a device-based equivalent of the presence or absence of discrete local potential on the endocardial channel during implantation and the far-field EGM QRS duration is the equivalent of surface ECG global QRS duration. Far-field EGM QRS duration was shorter during ns-HB capture than during RVS capture (103 versus 145 ms), and transition to RVS capture was always accompanied by prolongation of the far-field EGM QRS duration by at least 40 ms. EGM data can be supported with marker channel data as it provides reliable information regarding sudden increase in ventriculo-atrial (VA) interval that indicates loss of HB capture (mean delta VA = 70 ms).27,28 This last method is limited to patients without atrial fibrillation and with preserved retrograde conduction but it can also be used to analyse regular surface ECG, occasionally providing the strongest evidence for loss of conduction system capture (Supplementary Material Figure 5S).
Automated Methods and Artificial Intelligence
Analysis of conduction system pacing ECG may pose a considerable challenge to an inexperienced interpreter and automated interpretation by standard ECG machines and pacemaker analysers would be welcome. Arnold et al. applied machine learning to diagnose loss of HB capture.29 Although the overall accuracy of 75% during differentiation of various forms of HB area capture was disappointing, this is a promising method. Perhaps simply including V6RWPT and V1RWPT in automated ECG interpretation reports would be helpful.
Conduction System Potential Mapping
Activation mapping of the conduction system enables the determination of HPS capture with high accuracy, making this technique an excellent research tool.
Wu et al. studied 30 patients using His bundle potential mapping and multielectrode catheter mapping of the left septal HPS to determine LBB capture.11 Multielectrode left septal mapping can also be used to determine the correction of the LBBB during HB pacing.30,31 Upadhyay et al. observed presystolic recruitment of latent Purkinje potentials in patients with complete conduction block in the left bundle during His corrective pacing.30,31
When such extensive HPS mapping is performed, diagnosis of LBB capture can be based on simple observations (Supplementary Material Figure 6S). The interval from HB potential to LBB potential (approximately 22 ms) during anterograde native conduction should be similar as the interval from LBB potential to HB potential during retrograde conduction when LBB is captured during pacing.10,11 This criterion assumes that retrograde and anterograde conduction velocity does not differ much. Also, left septal HPS potentials should precede the ventricular electrogram on the multielectrode catheter when LBB capture is achieved.
During myocardial-only capture, the situation is different: left septal HPS potentials do not precede the QRS but are buried within it, while the HB potential is absent on the HB lead. Using retrograde HB potential for LBB capture diagnosis requires a diagnostic catheter or a separate lead implanted in the HB region (which can be later used for atrial pacing). This method is limited to patients with preserved conduction in the proximal HPS and requires extra time for HB lead positioning.
Another caveat is that retrograde conduction during HPS capture does not give 100% certainty that anterograde conduction from the capture site is also present. Practicalities of the invasive left septal potential mapping constitute a serious limitation of this technique for routine implantation.
Conclusion
At the current state of knowledge, no single method for differentiation between HPS and myocardial-only capture can be recommended as straightforward and 100% accurate. Nevertheless, an accurate diagnosis can be reached in the vast majority of cases using the methods and criteria developed over the last couple of years (Tables 1 and 2).
Click here to view Supplementary Material.
Clinical Perspective
- The goal of His-Purkinje conduction system (HPS) pacing is maintaining or restoring physiological, synchronous biventricular activation of the heart.
- HPS pacing is a promising technique with potential for application in both bradyarrhythmia and heart failure patients.
- During HPS pacing, it is crucial to confirm capture of the His bundle or left bundle branch versus myocardial-only capture.
- HPS capture results in faster and more homogenous depolarisation of the left ventricle than ventricular myocardial-only capture. This influences QRS complex morphology and form the basis for electrocardiographic differentiation between HPS and myocardial paced QRS.
- The HPS and working myocardium differ in their capture thresholds and refractoriness. These differences can be exploited for the diagnosis of HPS capture using dynamic pacing manoeuvres such as differential output pacing and programmed stimulation.