Abstract
Colloidal silica is an important biocompatible, inert and non-toxic material for imaging, therapy, and drug delivery biomedical applications. In this context, the evaluation of colloidal suspensions and their stabilities by a Fiber Optic Quasi-Elastic Light Scattering sensor is proposed. Two different silica nanoparticles were prepared and characterized by scanning electron microscopy and X-ray diffraction, being completely amorphous, with mean diameters of 125 and 159 nm and average specific weight of 1.94 g.cm-3. The nanoparticles were dispersed in deionized water in different concentrations ranging from 0 to 2% (m/m), resulting in suspensions with mean kinematic viscosity of 0.009157 cm².s-1. The sensor showed different sensitivities regarding concentrations and diameters, with an increase in the light intensity dispersion caused by the scattering. A decreasing tendency of the decay rate of the autocorrelation function of the light intensity signal was verified with the variation of pH, and this decay rate also showed an abrupt decrease with the enhancement of the ionic strength, detecting the limits of the colloidal stability. This work presents a simple and reliable methodology for the colloidal assessment in a low-cost and minimally invasive way, easily extendable for different chemical and biological systems.
Keywords:
Optical fiber sensor; Colloidal silica; Colloidal stability; Quasi-Elastic Light Scattering
INTRODUCTION
Colloids are metastable suspensions of particles dispersed in a base fluid (Hunter, 2004Hunter, R. J. Foundations of Colloid Science (Oxford University Press, 2004).). In spite of the application of these systems to several fields, from heat and mass transfer studies (Taylor et al., 2013Taylor, R. A., Coulombe, S., Otanicar, T., Phelan, P., Gunawan, A., Lv, W., Rosengarten, G., Prasher, R., Tyagi, H. Small particles, big impacts: a review of the diverse applications of nanofluids. J. Appl. Phys., 113, 011301 (2013). https://doi.org/10.1063/1.4754271
https://doi.org/10.1063/1.4754271...
) to gene therapy and drug-delivery in biomedicine (Balbino et al., 2016Balbino, T. A., Serafin, J. M., Gasperini, A. A. M., Oliveira, C. L. P., Cavalcanti, L. P., Jesus, M. B., la Torre, L. G. Microfluidic assembly of pDNA/cationic liposomes lipoplexes with high pDNA loading for gene delivery, Langmuir, 32, 1799-1807 (2016). https://doi.org/10.1021/acs.langmuir.5b04177
https://doi.org/10.1021/acs.langmuir.5b0...
), the detection and characterization of colloidal systems rely on the use of laborious methods and on expensive and bulk instrumentation (Hunter, 2004; Hall et al., 2007Hall, J. B., Dobrovolskaia, M. A., Patri, A. K., McNeil, S. E. Characterization of nanoparticles for therapeutics. Nanomedicine, 2, 789-803 (2007). https://doi.org/10.2217/17435889.2.6.789
https://doi.org/10.2217/17435889.2.6.789...
). Particularly, the assessment of colloid stability, i.e., the capability of particles to oppose aggregation processes and remain dispersed in the fluid medium is a critical aspect concerning not only the engineering applications, but also the storage and safety tests for food and pharmaceutical colloids.
The colloidal stability is usually determined by means of zeta-potential (ζ) measurements combined with Laser Doppler Velocimetry (LDV)-based characterization of the particle dimensions by dynamic light scattering (DLS) (Tomaszewska et al., 2013Tomaszewska, E., Soliwoda, K., Kadziola, L., Tkacz-szczesna, B., Celichowski, G., Cichomski, M., Szmaja, W., Grobelny, J. Detection limits of DLS and UV-vis spectroscopy in characterization of polydispersive nanoparticles colloids. J. Nanomat., 60, 1-10 (2013). https://doi.org/10.1155/2013/313081
https://doi.org/10.1155/2013/313081...
; Mondragon et al., 2012Mondragon, R., Julia, J. E., Barba, A., Jarque, J. C. Characterization of silica-water nanofluids dispersed with an ultrasound probe: a study of their physical properties and stability. Powder Technol., 224, 138-146 (2012). https://doi.org/10.1016/j.powtec.2012.02.043
https://doi.org/10.1016/j.powtec.2012.02...
). The zeta-potential is the electric potential resulting from the distribution of charges around a particle, which constitute the so-called electrical double layer, and allows the indirect evaluation of the colloid stability limit (the isoelectric point) (Kirby and Hasselbrink, 2004Kirby, B., Hasselbrink, E. Zeta potential of microfluidic substrates: 1. Theory, experimental techniques, and effects on separations. Electrophoresis, 25, 187-202 (2004). https://doi.org/10.1002/elps.200305754
https://doi.org/10.1002/elps.200305754...
). However, this technique requires sampling and operation in a controlled environment, which is not suitable for assessing dynamic phenomena like the formation, decomposition, or coalescence of the colloidal particles (Heurlin et al., 2015Heurlin, M., Anttu, N., Camus, C., Samuelson, L., Borgström, M. T. In-situ characterization of nanowire dimensions and growth dynamics by optical reflectance. Nano Lett., 15, 3597-3602 (2015). https://doi.org/10.1021/acs.nanolett.5b01107
https://doi.org/10.1021/acs.nanolett.5b0...
). Another approach is based on the absorption spectrum analysis with spectrophotometers (Zhou et al., 2009Zhou, J., Ralston, J., Sedev, R., Beattie, D. A. Functionalized gold nanoparticles: synthesis, structure and colloid stability. J. Colloid Interface Sci. , 331, 251-262 (2009). https://doi.org/10.1016/j.jcis.2008.12.002
https://doi.org/10.1016/j.jcis.2008.12.0...
), but such methodology presents limitations in terms of sample preparation and data processing time, and again exposes the colloid to environmental effects, introducing errors in the measurements.
In this scenario, optical fiber sensors (OFS) are promising technologies for the monitoring of processes involving colloidal suspensions, providing important information on the dynamic characteristics of the system (Zhou et al., 2017Zhou, C., Gong, Y., Chen, Q., Rao, Y.-J., Peng, G.-D., Fan, X. Reproducible fiber optofluidic laser for disposable and array applications. Lab Chip, 17, 3431-3436 (2017). https://doi.org/10.1039/C7LC00708F
https://doi.org/10.1039/C7LC00708F...
). In addition to the intrinsic characteristics of the OFS, such as compact size, remote sensing capability, and immunity to electromagnetic interference, silica optical fibers are inert to a wide variety of biological agents, presenting high thermal and chemical resistances (Wolfbeis, 2008Wolfbeis, O. S. Fiber-optic chemical sensors and biosensors. Anal. Chem., 80, 4269-4283 (2008). https://doi.org/10.1021/ac800473b
https://doi.org/10.1021/ac800473b...
). Currently, the analysis of the concentration and average size of colloidal particles can be accomplished by different setups of both intrinsic and extrinsic OFS based on the processing of the scattered light (Macfayden and Jennings, 1990Macfayden, A. J., Jennings, B. R. Fibre-optic systems for dynamic light scattering-a review. Opt. Laser Technol., 22, 175-187 (1990). https://doi.org/10.1016/0030-3992(90)90105-D
https://doi.org/10.1016/0030-3992(90)901...
). Examples of such sensors include the use of complex schemes with goniometers or fiber bundles to retrieve the angular information of the light scattering phenomenon (Rička, 1993Rička, J. Dynamic light scattering with single-mode and multimode receivers. Appl. Opt., 32, 2860-2875 (1993). https://doi.org/10.1364/AO.32.002860
https://doi.org/10.1364/AO.32.002860...
; Holthoff et al., 1996Holthoff, H., Egelhaaf, S. U., Borkovec, M., Schurtenberger, P., Sticher, H. Coagulation rate measurements of colloidal particles by simultaneous static and dynamic light scattering. Langmuir, 12, 5541-5549 (1996). https://doi.org/10.1021/la960326e
https://doi.org/10.1021/la960326e...
). Furthermore, in recent studies, optical fiber DLS sensors were demonstrated for the assessment of highly concentrated samples (Nakamura et al., 2014Nakamura, S., Sato, Y., Ishii, K. High-sensitivity low-coherence dynamic light scattering and particle sizing for nanoparticles (II): SM-fiber probe system applied to dense particle suspensions. Proc. SPIE, v.9232 (2014). https://doi.org/10.1117/12.2063641
https://doi.org/10.1117/12.2063641...
), as well as for the evaluation of the thermal properties of colloids (Fujiwara et al., 2018Fujiwara, E., Gomes, M. K., Soares, M. C. P., Rodrigues, M. S., Schenkel, E. A., Suzuki, C. K. Characterization of colloidal silica by optical fiber sensor. Proc. IEEE SBFoton Int. Opt. Photon. Conf. (SBFoton IOPC, 2018). https://doi.org/10.1109/SBFoton-IOPC.2018.8610896
https://doi.org/10.1109/SBFoton-IOPC.201...
). However, most of the related works have successfully reported the use of OFS for characterizing colloidal dispersions only in well-established conditions, with the samples properly dispersed and sonicated, so it is crucial to develop minimally invasive and sensitive techniques to investigate the stability limits of colloids.
In this context, an optical fiber sensor based on the quasi-elastic light scattering (Fiber Optic Quasi-Elastic Light Scattering, FOQELS sensor) phenomenon for monitoring colloidal stability is proposed. The experiments were carried out by evaluating silica nanoparticle suspensions with different concentrations and average sizes, allowing the investigation of the sample behavior in terms of pH and ionic strength of the medium. Thus, a feasible and straightforward instrument for characterizing the stability limits of colloidal dispersions is provided.
FUNDAMENTALS OF COLLOIDAL STABILITY
In colloidal systems, the dispersed particles are submitted to drag and gravitational forces and to the diffusive Brownian motion, resulting in random movements and in the possibility of encounters between them. The colloidal stability is therefore defined as their capability to stay free in the medium, i.e., to collide with other particles without resulting in permanent contact and formation of aggregates (Overbeek et al., 1977Overbeek, J. T. G. Recent Developments in the Understanding of Colloid Stability. J. Colloid Interface Sci., 58, 408-422 (1977). https://doi.org/10.1016/0021-9797(77)90151-5
https://doi.org/10.1016/0021-9797(77)901...
). In terms of the electrical double layer theory: in a stable suspension, a potential energy barrier prevents this coagulation, and the double layer electrostatic repulsion overcomes the van der Waals attraction forces (Wiese and Healy, 1970Wiese, G. R., Healy, T. W. Effect of Particle Size on Colloid Stability. Trans. Faraday Soc., 66, 490-499 (1970). https://doi.org/10.1039/tf9706600490
https://doi.org/10.1039/tf9706600490...
; Israelachvili, 2011Israelachvili, J. Intermolecular and Surface Forces, Third Edition (Academic Press, 2011).).
Stability in relation to pH
The protonation and adsorption of other species that occur on the particles’ surfaces as consequences of the variation of pH are capable of changing their surface charge, producing a variation in the local electric field (Kirby and Hasselbrink, 2004Kirby, B., Hasselbrink, E. Zeta potential of microfluidic substrates: 1. Theory, experimental techniques, and effects on separations. Electrophoresis, 25, 187-202 (2004). https://doi.org/10.1002/elps.200305754
https://doi.org/10.1002/elps.200305754...
). This variation is responsible for changing the attraction or the repulsion of a particle by other charged species, and colloidal suspensions are only stable for pH conditions where their zeta-potentials are not null. This critical-stability pH (where ζ → 0) is a specific characteristic of each species, and the algebraic signal of ζ only indicates if the repulsion is between positive (ζ > 0) or negative charges (ζ < 0) (Kirby and Hasselbrink, 2004; Mondragon et al., 2012Mondragon, R., Julia, J. E., Barba, A., Jarque, J. C. Characterization of silica-water nanofluids dispersed with an ultrasound probe: a study of their physical properties and stability. Powder Technol., 224, 138-146 (2012). https://doi.org/10.1016/j.powtec.2012.02.043
https://doi.org/10.1016/j.powtec.2012.02...
).
In the particular case of colloidal silica, there is a strong decrease in the modulus of the zeta-potential when the pH is lower than 4.0, and ζ → 0 for pH ≈ 2.7, its critical pH-value (Kirby and Hasselbrink, 2004Kirby, B., Hasselbrink, E. Zeta potential of microfluidic substrates: 1. Theory, experimental techniques, and effects on separations. Electrophoresis, 25, 187-202 (2004). https://doi.org/10.1002/elps.200305754
https://doi.org/10.1002/elps.200305754...
; Mondragon et al., 2012Mondragon, R., Julia, J. E., Barba, A., Jarque, J. C. Characterization of silica-water nanofluids dispersed with an ultrasound probe: a study of their physical properties and stability. Powder Technol., 224, 138-146 (2012). https://doi.org/10.1016/j.powtec.2012.02.043
https://doi.org/10.1016/j.powtec.2012.02...
). On the other hand, for pHs higher than 4.0, there is a slight increase in the absolute value of ζ with pH, until it reaches a final baseline of maximum stability (Mondragon et al., 2012). The reason is that lower pHs result in the protonation (and consequent charge neutralization) of the (-SiO-) superficial groups, leading to a reduction in the magnitude of the surface charge. The excess of OH- ions in solutions at higher pHs, in turn, enhances the ionization of the silanol (-Si-OH) superficial groups (generating negative -SiO- charges), increasing both the surface charge and the suspension stability, due to the higher electrostatic repulsion. The baseline is reached when all of the silanols are ionized, so the addition of base no longer enhances the magnitude of the surface charge (Iler, 1978Iler, R. K. The Chemistry of Silica Solubility, Polymerization, Colloid and Surface Properties, and Biochemistry (John Wiley and Sons, 1978).; Cotton and Wilkinson, 1980Cotton, F. A., Wilkinson, G. Advanced Inorganic Chemistry (John Wiley and Sons, 1980).; Kirby and Hasselbrink, 2004; Israelachvili, 2011Israelachvili, J. Intermolecular and Surface Forces, Third Edition (Academic Press, 2011).).
Stability in relation to ionic strength (I)
The reduction of the colloidal stability with the increase of the ionic strength (I) is again explained as a resultant of the intermolecular and surface forces present in the system (Israelachvili, 2011Israelachvili, J. Intermolecular and Surface Forces, Third Edition (Academic Press, 2011).): the van der Waals forces that act between all particles and surfaces are always attractive for similar particles, tending to coagulate and to precipitate them out as solid materials. If the particles are dispersed in water or in other liquids with high dielectric constants, however, they are usually charged, with charges of the same sign, and electrostatic repulsive forces prevent their coagulation (Israelachvili, 2011).
The addition of salts, on the other hand, increases the ionic strength and enhances the conductivity of the suspension (Skoog et al., 2014Skoog, D., West, D., Holler, F. J., Crouch, S. Fundamentals of Analytical Chemistry, Ninth Edition (Cengage Learning, 2014).), facilitating the particles’ discharge process. Consequently, in a medium with high conductance (high I), the electrostatic repulsion is reduced and the particles can get closer to each other. Once the van der Waals forces follow a power law in relation to the inverse of the distance between particles, these forces can become dominant if the distances are sufficiently low, resulting in the coalescence and formation of a solid precipitate. This phenomenon is favored by higher suspensions concentrations, since this increase naturally leads to smaller distances between particles in the liquid medium (Israelachvili, 2011Israelachvili, J. Intermolecular and Surface Forces, Third Edition (Academic Press, 2011).; Levy and Andelman, 2012Levy, A., Andelman, D. Dielectric Constant of Ionic Solutions: A Field-Theory Approach. Phys. Rev. Lett., 108, 227801, 2012. https://doi.org/10.1103/PhysRevLett.108.227801
https://doi.org/10.1103/PhysRevLett.108....
).
MATERIALS AND METHODS
Silica nanoparticle synthesis and characterization, and preparation of colloidal suspensions
Silica soot nanoparticles were synthesized by the Vapor-phase Axial Deposition (VAD) method, according to the procedure described in previous research where the process parameters are detailed (Soares et al., 2018Soares, M. C. P., Mendes, B. F., Schenkel, E. A., Santos, M. F., Fujiwara, E., Suzuki, C. K. Kinetic and thermodynamic study in pozzolanic chemical systems as an alternative for Chapelle test. Mat. Res., 21, e20180131, 2018. https://doi.org/10.1590/1980-5373-mr-2018-0131
https://doi.org/10.1590/1980-5373-mr-201...
). Basically, a high-temperature O2-H2 flame promotes the hydrolysis and oxidation of SiCl4 on the surface of a rotating target, producing the silica nanoparticles in accordance with Reaction 1. The particles formed are completely amorphous and spherical, and both the particles morphology and their polydispersity can be precisely controlled by adjusting VAD parameters, such as the flow rates of the gases H2, O2, N2, and SiCl4.
Particles were intentionally produced with two statistically different average diameters for allowing the study of differences in the FOQELS signal regarding their dimensions. The two nanomaterials were named silica S1 and silica S2, and their “bottom-up” synthesis was performed using a VAD burner-target distance of 15.0 mm, target rotation speed of 10 rpm, and the following parameters: flows of 5,300 sccm (standard cubic centimeter per minute) of H2, 8,000 sccm of O2, 380 sccm of Ar, 250 sccm of N2 and total consumption of SiCl4(l) of 72 mL during 180 min, under constant temperature of ~850°C (silica S1); flows of 5,800 sccm of H2, 6,000 sccm of O2, 230 sccm of He, 540 sccm of N2, and total consumption of SiCl4(l) of 120 mL during 300 min, under constant temperature of ~930°C (silica S2).
The silica nanoparticles were analyzed by the scanning electron microscopy (SEM) technique at the Brazilian National Nanotechnology Laboratory (LNNano) microscope (FEI Quanta 650 FEG, USA). The samples were prepared by depositing the colloidal solution (soot and water) over the stub and the water was dried using a hot-plate. After this procedure, the samples were gold-coated using a Bal-Tec SCD 050 Sputter Coater to obtain images under a high vacuum regime.
The particle diameters were then evaluated with the Image Viewer application of the software MATLAB 2013 (Mathworks, USA), which was calibrated for measuring the diameter of 64 particles in five different images. The scale of each image was measured in arbitrary pixel units and applied for the evaluation of the diameter distribution histograms. Finally, the statistical significance of the difference between the mean particle diameters and the 95% confidence intervals (CI) of the average diameters were calculated with the statistical software Minitab 17 (Minitab Inc, USA) using the analysis of variance (ANOVA) procedure, which performs the evaluation of the t-distribution and the F-test.
Silicas S1 and S2 presented average diameters of (125 ± 9) and (159 ± 9) nm, respectively. Their 95% CI for the mean diameters, the particle diameter distribution histograms and the SEM images are shown in Figure 1.

(A) SEM image of silica nanoparticles S1 (average diameter of 125 ± 9 nm); (B) particle diameter distribution histogram and the 95% CI of the mean diameter for silica S1; (C) SEM image of silica nanoparticles S2 (average diameter of 159 ± 9 nm); (D) particle diameter distribution histogram and the 95% CI of the mean diameter for silica S2.
It is possible to notice in Figure 1 that the particles are spherical and that the histograms show a relatively low dispersity of the diameters. It is also possible to observe grain bordering on the particles that we believe are consequence of the gold coating process used for the SEM analysis. The gold is normally used to increase the contrast of the particle edges and to minimize effects of electric charge loading during the image formation. However, brighter particle images may be the result of micro-failures in the formation of the metallic film, generating electric charging zones. When irradiated for a long time, these areas become saturated with electrical charges and start repelling electrons from the microscope beam, making it impossible to obtain images of the regions (Raimer, 1998Raimer, L. Scannig Electron Microscopy. Physics of Image Formation and Microanalysis. Second Edition (Springer, 1998).). It can also be noted that the uncertainties (95% CI of the average diameter) are relatively low in comparison to the respective mean diameter (~7.2% of the mean diameter, for the 125 nm particles, S1, and ~5.7%, for the 159 nm particles, S2), showing the low polydispersity characteristic of the VAD synthesis process (Soares et al., 2018Soares, M. C. P., Mendes, B. F., Schenkel, E. A., Santos, M. F., Fujiwara, E., Suzuki, C. K. Kinetic and thermodynamic study in pozzolanic chemical systems as an alternative for Chapelle test. Mat. Res., 21, e20180131, 2018. https://doi.org/10.1590/1980-5373-mr-2018-0131
https://doi.org/10.1590/1980-5373-mr-201...
).
Figure A.1, in the Appendix, shows the particles of Silica S1 under lower magnification, proving that the material obtained is very homogeneous and that the selected images are representative of the general aspect of the silica. Due to the difficulty in observing and analyzing diameter differences between S1 and S2 when using this lower magnification (it is not even possible to observe the gold bordering), only silica S1 is shown.
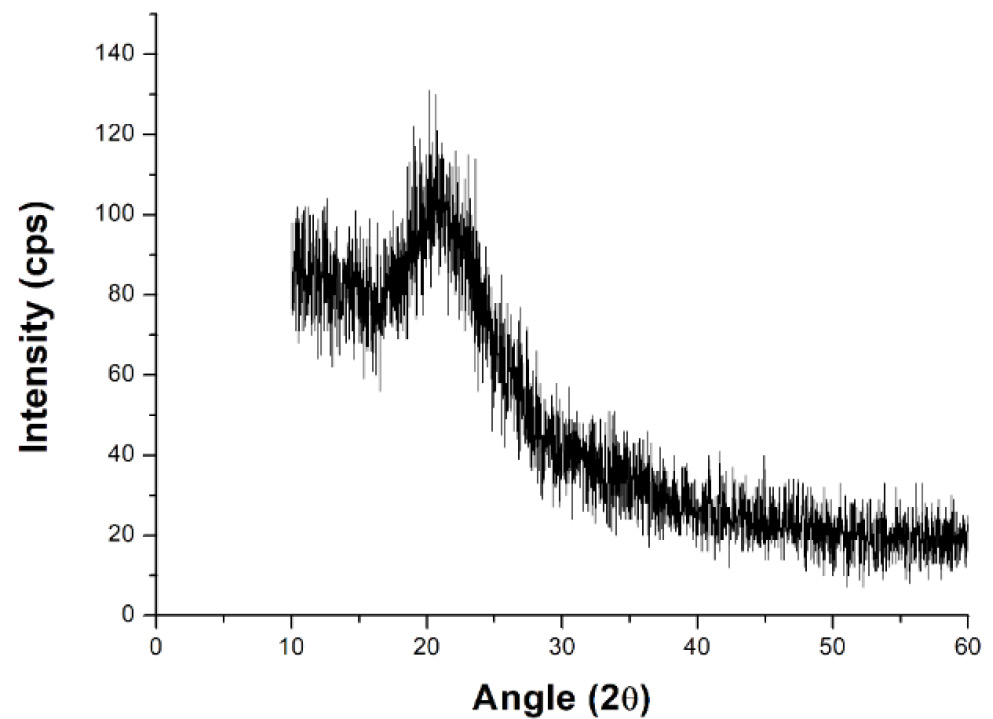
The particles were also characterized by X-Ray Diffraction (XRD), using a Rigaku DMAX 2200 diffractometer (Rigaku, Japan), with a fine focus Cu tube (λ = 1.54 Å), Bragg-Bretano geometry (θ-2θ), 0.02° step and 2.5 s/step exposition time. The XRD diffractogram is shown in Figure A.2 of the Appendix and presents no crystalline peak, revealing that this material is very pure and completely amorphous. This was already expected, since our VAD equipment is designed for the fabrication of silica glass of high transparency destined to the production of optical fiber preforms and other photonic components (Santos et al., 2011Santos, J. S., Ono, E., Fujiwara, E., Manfrim, T. P., Suzuki, C. K. Control of optical properties of silica glass synthesized by VAD method for photonic components. Opt. Mater., 33, 1879-1883 (2011). https://doi.org/10.1016/j.optmat.2011.03.007
https://doi.org/10.1016/j.optmat.2011.03...
). Again, the pattern observed for both materials is quite similar, so only the image obtained for Silica S1 is shown.
An important practical consequence of these results is that the mean diameters obtained are comparable in magnitude to the wavelength of the fiber sensor laser (1310 nm). Therefore, as will be explained in a further section, the particles are expected to be able to scatter the light, according to QELS theory (Finsy, 1994Finsy, R. Particle Sizing by Quasi-Elastic Light Scattering. Adv. Colloid. Interface Sci., 52, 79-143 (1994). https://doi.org/10.1016/0001-8686(94)80041-3
https://doi.org/10.1016/0001-8686(94)800...
), and are considered adequate for the use in this research.
The soot specific weight was obtained with the pycnometry test in order to allow the posterior evaluation of the dynamic viscosity, another important parameter affecting the QELS phenomenon (Finsy, 1994Finsy, R. Particle Sizing by Quasi-Elastic Light Scattering. Adv. Colloid. Interface Sci., 52, 79-143 (1994). https://doi.org/10.1016/0001-8686(94)80041-3
https://doi.org/10.1016/0001-8686(94)800...
). The empty pycnometer, for which the internal volume was previously known, had its mass quantified on an analytical balance. Then, it was filled with an arbitrary amount of silica powder, and the sum of the pycnometer and the powder masses was verified. Finally, the pycnometer was completely filled with deionized water (DI), and the air was carefully removed before the evaluation of the total mass. The mass of the added water was quantified and the volume of the powder mass was determined by subtracting the volume of water (calculated from the available data of water density (Çengel and Cimbala, 2006Çengel, Y., Cimbala, J. Fluid Mechanics, Fundamentals and Applications (McGraw-Hill, 2006).)) from the internal volume of the pycnometer. The experiment was repeated 4 times (2 times for silica S1 and 2 times for S2) and both the mean value, taken as the specific weight value, and the half of the length of the 95% confidence interval (CI), taken as the uncertainty, were calculated. All of the experiments were conducted at ~25°C, and the relation between the silica mass and its volume resulted in the soot density ρsoot.
The colloidal suspensions were then prepared by the standard Svedberg dispersion procedure for colloid preparation (Hunter, 2004Hunter, R. J. Foundations of Colloid Science (Oxford University Press, 2004).) with no addition of tensoactive. Different soot masses were dissolved in DI water, the suspensions were mechanically mixed, and then they were maintained in a temperature-controlled ultrasound bath (Ultronique 5.9L Ultrasound Bath, Ultronique, Brazil) during 180 min until no more separated phase of solid material could be observed without a microscope. The investigated concentration of silica ranged from 0 to 2% in mass. This process is required for minimizing the agglomeration of the particles (Henderson et al., 2010Henderson, K., Park, Y.-G., Liu, L., Jacobi, A. M. Flow-boiling heat transfer of R-134a-based nanofluids in a horizontal tube, Int. J. Heat Mass Transf., 53, 944-951 (2010). https://doi.org/10.1016/j.ijheatmasstransfer.2009.11.026
https://doi.org/10.1016/j.ijheatmasstran...
) and improving the fluid thermal properties (Shin and Banerjee, 2011Shin, D., Banerjee, D. Enhancement of specific heat capacity of high-temperature silica-nanofluids synthesized in alkali chloride salt eutectics for solar thermal-energy storage applications. Int. J. Heat Mass Transf. , 54, 1064-1070 (2011). https://doi.org/10.1016/j.ijheatmasstransfer.2010.11.017
https://doi.org/10.1016/j.ijheatmasstran...
). It is also important to notice that a separated solid phase could block the flow through a capillary and prevent the viscosity test, affecting the QELS results interpretation (Finsy, 1994Finsy, R. Particle Sizing by Quasi-Elastic Light Scattering. Adv. Colloid. Interface Sci., 52, 79-143 (1994). https://doi.org/10.1016/0001-8686(94)80041-3
https://doi.org/10.1016/0001-8686(94)800...
).
The colloidal silica suspensions with different particle concentrations, ranging from 0.12 to 2.00% (m/m), were analyzed under ~25 ºC by capillary viscosimetry using a Cannon-Fenske viscosimeter indicated for the handling of transparent or opaque fluids (internal diameter of 0.42 mm, Cannon-Fenske constant KCF = 4 x 10⁻⁵, maximum sensitivity for kinematic viscosities ranging from 0.008 to 0.032 cm².s-1, Laborglass, Brazil). By attaching a syringe to the viscosimeter larger aperture and then pulling its piston, it is possible to create a pressure difference that makes the fluid to flow through the capillary. The kinematic viscosity νB is then obtained in cm².s-1 by simply multiplying the value of the time (in seconds) required by the fluid to cross two sequential markings on the viscosimeter surface by the constant KCF. For each suspension concentration, the test was repeated four times (two for silica S1 and two for S2), allowing both the verification of differences in viscosity related to different diameters and the presence of changes in the FOQELS signal regarding the viscosity.
Both S1 and S2 dry silica nanoparticles presented an average specific weight of ρsoot (25 ºC) = 1.94 g.cm-3, with no statistical difference regarding the diameter, which can be explained by the fact that both diameters are on the same order of magnitude and by the limited sensitivity of the analogic instrumentation used. Furthermore, it is important to note that the density results collected for silica and for other porous solids depend on both the synthetic method used for their fabrication and on the particular experimental technique applied for the density quantification, and several lower values are reported in the literature for this class of material.
Quercia et al. (2013Quercia, G., Lazaro, A., Geus, J. W., Brouwers, H. J. H. Characterization of morphology and texture of several amorphous nano-silica particles used in concrete. Cem. Concr. Compos., 44, 77-92 (2013). https://doi.org/10.1016/j.cemconcomp.2013.05.006
https://doi.org/10.1016/j.cemconcomp.201...
), for example, reported values of densities ranging from 1.05 to 1.40 g.cm-3 for nanostructured amorphous silica samples obtained by chemical vapor deposition (densities calculated by glass and helium pycnometry). Kucheyev et al. (2005), in their turn, fabricated amorphous ultralow-density nanoporous silica of only 0.010 g.cm-3 using aerogel synthesis (density obtained by the Brunauer-Emmett-Teller (BET) method in a high precision surface analyzer equipment). Pope and Mackenzie (1986Pope, E. J. A., Mackenzie, J. D. Sol-gel processing of silica: II. The role of the catalyst. J. Non-Cryst. Solids, 87, 185-198 (1986). https://doi.org/10.1016/S0022-3093(86)80078-3
https://doi.org/10.1016/S0022-3093(86)80...
) synthesized silica by the sol-gel method and verified that, after the gel dried, the silica showed apparent density (defined by the authors as the density of the matrix including closed pores) ranging from 1.13 to 2.09 g.cm-3, and bulk density (total density including both closed and open pores) varying from 0.70 to 2.08 g.cm-3 (values obtained by the Archimedes method using ethanol as the saturating liquid). Finally, it is also important to cite that rocks obtained directly from geological deposits and that contain a major fraction of amorphous silica but also high content of quartz (crystalline silica) and other minerals tend to show a substantially higher density in comparison to the amorphous nanomaterials synthetically obtained. Davraz and Gunduz (2005), for example, reported a geological material that was classified as amorphous silica (but containing quartz, alumina, iron oxide and other small amounts of minerals) with a density of 2.39 g.cm-3.
The viscosity tests with suspensions ranging from 0 to 2% (m/m) of silica, in turns, resulted in an approximately constant value of kinematic viscosity. Then, there are no differences in suspensions’ viscosities regarding the use of particles with different diameters for the tested concentration range. The experiments resulted in the average kinematic viscosity of νB = 0.009157 cm².s-1, quite similar to the water kinematic viscosity, 0.008937 cm².s-1 at 25°C (Çengel and Cimbala, 2006Çengel, Y., Cimbala, J. Fluid Mechanics, Fundamentals and Applications (McGraw-Hill, 2006).). Details on the calculations of density and viscosity results are given in Appendix.
All these abovementioned results are in accordance with the study of Mondragon et al. (2012Mondragon, R., Julia, J. E., Barba, A., Jarque, J. C. Characterization of silica-water nanofluids dispersed with an ultrasound probe: a study of their physical properties and stability. Powder Technol., 224, 138-146 (2012). https://doi.org/10.1016/j.powtec.2012.02.043
https://doi.org/10.1016/j.powtec.2012.02...
), which verified the Newtonian behavior for silica nanoparticles colloidal suspensions and obtained viscosities similar to water’s, except for colloids with very high concentrations (10-20 % in mass, one order of magnitude superior than the suspensions tested in this research) submitted to very high shear rates on the order of 100 s-1.
Optical fiber sensor design
The FOQELS used in this research consists of an analytical equipment containing a semiconductor laser with continuous emission at the 1310 nm wavelength. The light is emitted from a laser diode through a standard single-mode optical fiber (SMF) to the bulk of the sample solution where the fiber probe is immersed. Part of the light is transmitted to the liquid medium and another fraction is reflected back to the fiber. The light that returns to the equipment is converted to an electrical signal by a photodetector, and the signal is received and converted to digital information by a data acquisition system. Then, the measured values are analyzed using MATLAB routines which convert the reflection intensity data into QELS information (Soares et al., 2019Soares, M. C. P., Vit, F. F., Suzuki, C. K., de la Torre, L. G., Fujiwara, E. Perfusion Microfermentor Integrated into a Fiber Optic Quasi-Elastic Light Scattering Sensor for Fast Screening of Microbial Growth Parameters. Sensors, 19, 2493 (2019). https://doi.org/10.3390/s19112493
https://doi.org/10.3390/s19112493...
). The complete process of preparing and analyzing the suspensions and the design of this FOQELS and its application for the monitoring of a silica nanoparticle colloidal suspension are illustrated on Figure 2.

(A) Procedure of preparation of the colloidal suspensions and FOQELS analysis; (B) schematic of the experimental apparatus using an optical fiber sensor for the evaluation of the quasi-elastic light scattering on silica colloidal suspensions.
Given an optical signal transmitted through the silica fiber - refractive index n1 ≈ 1.46 (Fujiwara et al., 2012Fujiwara, E., Ono, E., Suzuki, C. K. Application of an optical fiber sensor on the determination of sucrose and ethanol concentrations in process streams and effluents of sugarcane bioethanol industry. IEEE Sens. J., 12, 2839-2843 (2012). https://doi.org/10.1109/JSEN.2012.2204246
https://doi.org/10.1109/JSEN.2012.220424...
) - to another medium with refractive index n2, in a direction which is normal to the separation interface of the two media, the power reflectance R between the emitted and the reflected light intensities, I0 and IR, respectively, can be evaluated with Equation 2, the Fresnel equation (Saleh and Teich, 1991Saleh, B. E. A., Teich, M. C. Fundamentals of Photonics, 1st Edition (John Wiley and Sons, 1991). https://doi.org/10.1002/0471213748
https://doi.org/10.1002/0471213748...
).
After the preparation of the colloidal suspension, the optical fiber probe is directly inserted in the liquid medium at ~25°C, with the sensor calibrated for collecting 20,000 data at a 1 kHz sampling rate.
QELS autocorrelation function and decay rate
The photodetector of the instrument shown in Figure 2 is able to quantify the intensity of the reflected light IR(t) that is transmitted through the optical fiber, from the medium to its detection area. This intensity is modulated by the difference between the refractive index of the fiber and the medium, according to Equation 2, and it is related to the chemical composition of the suspension. Moreover, when analyzing a colloid, an increase of the dispersion of IR(t) is usually observed as result of the Quasi-Elastic Light Scattering (QELS) phenomenon, and so the IR signal provides information about the colloidal system. For the correct interpretation, it is also important to notice that QELS is a mechanism of radiating energy which occurs when particles are hit by a wavelength comparable in magnitude to their diameter, scattering the light in a secondary way in directions determined by the dimensions and by the total amount and polydispersity of particles in suspension (Finsy, 1994Finsy, R. Particle Sizing by Quasi-Elastic Light Scattering. Adv. Colloid. Interface Sci., 52, 79-143 (1994). https://doi.org/10.1016/0001-8686(94)80041-3
https://doi.org/10.1016/0001-8686(94)800...
).
The QELS properties can be evaluated by the autocorrelation function G2(τ) of the reflected light intensity IR(t). The function G2(τ) is defined by Equation 3 (Berne and Pecora, 1976Berne, B. J., Pecora, R. Dynamic Light Scattering with Applications to Chemistry, Biology and Physics (John Wiley and Sons, 1976).; Finsy, 1994Finsy, R. Particle Sizing by Quasi-Elastic Light Scattering. Adv. Colloid. Interface Sci., 52, 79-143 (1994). https://doi.org/10.1016/0001-8686(94)80041-3
https://doi.org/10.1016/0001-8686(94)800...
), where τ is an arbitrary delay time.
The decay rate Γ of G2(τ) is correlated to the translational diffusion coefficient of a particle A in a fluidic medium B, DAB, by Equation 4, where q is the magnitude of the scattering vector, the difference between the emitted light and the reflected light vectors (Finsy, 1994Finsy, R. Particle Sizing by Quasi-Elastic Light Scattering. Adv. Colloid. Interface Sci., 52, 79-143 (1994). https://doi.org/10.1016/0001-8686(94)80041-3
https://doi.org/10.1016/0001-8686(94)800...
).
The coefficient DAB can be estimated by an appropriate mass transfer correlation. A simple relation which is successful in describing the diffusion behavior of colloidal particles and of large spherical molecules dispersed in a solvent is the Stokes-Einstein model, which considers the solvent a continuous phase. Einstein proposed that, for a spherical particle P immersed in a fluid where the Stokes flow conditions are satisfied, the Brownian motion flux would be dependent on the local particle concentration and would drag P to a random position, creating a region with lower instant concentration. This new concentration gradient would be the driving force of a process of mass transfer and, when the equilibrium was reached, the mass flow described by the Fick Law would balance the Brownian flow described by the Stokes equations (Çengel and Cimbala, 2006Çengel, Y., Cimbala, J. Fluid Mechanics, Fundamentals and Applications (McGraw-Hill, 2006).), resulting in Equation 5, the Stokes-Einstein equation (Hunter, 2004Hunter, R. J. Foundations of Colloid Science (Oxford University Press, 2004).; Welty et al., 2008Welty, J. R., Wicks, C. E., Wilson, R. E., Rorrer, G. L. Fundamentals of Momentum, Heat and Mass Transfer, 5th Edition (John Wiley and Sons, 2008).).
In Equation 5, k = 1.38 x 10⁻²³ m².kg.s-2.K-1 is the Boltzmann constant (Welty et al., 2008Welty, J. R., Wicks, C. E., Wilson, R. E., Rorrer, G. L. Fundamentals of Momentum, Heat and Mass Transfer, 5th Edition (John Wiley and Sons, 2008).); T is the system’s temperature, in K; RA is the average radius of the colloidal particles, in m; and μB is the dynamic viscosity of the fluid, in kg.m-1.s-1. Equation 5 is one of several mass transfer models which show the effect of the dynamic viscosity of the silica suspensions (μB = ρsoot.νB) on QELS, and then reveals the importance of evaluating μB for correctly interpreting the optical signal.
The application of Equation 5 to the silica colloidal suspensions used in this research led to an estimated silica nanoparticles diffusivity (obtained with Equation 5) of DAB, S1 (25 ºC) = 3.75 x 10⁻⁸ cm².s-1 for the particles with diameter of 125 nm, and DAB, S2 (25 ºC) = 2.95 x 10⁻⁸ cm².s-1 for the particles with diameter of 159 nm. Details of the calculus involved are given in Appendix, as well as further analyses regarding the limitation of the applied instruments.
Finally, the G2(τ) function experimentally obtained by the FOQELS for a colloidal suspension with a given nanoparticle concentration is related to the average decay rate Γm by the Siegert relation, Equation 6 (Finsy, 1994Finsy, R. Particle Sizing by Quasi-Elastic Light Scattering. Adv. Colloid. Interface Sci., 52, 79-143 (1994). https://doi.org/10.1016/0001-8686(94)80041-3
https://doi.org/10.1016/0001-8686(94)800...
), where α and β are parameters obtained by fitting Equation 6 to the G2(τ) data.
The MATLAB routine reads the experimental values IR(t) obtained by the fiber sensor and then applies to them the algorithm described by Equations 3 to 6, obtaining the QELS information. Since νB and DAB are essentially constant for a given particle diameter (125 nm or 159 nm in this work), νB and DAB are essentially constant for a particular temperature, and so the differences detected in the FOQELS signals for the range of 0 to 2% (m/m) of silica nanoparticles dispersed in water are not consequence of changes of viscosity. Therefore, we can conclude that it is not necessary neither to perform further analysis about the influence of the viscosity on the results nor to perform corrections on measurements regarding this particular parameter for the tested range of concentration.
It is also important to cite that a previous work showed that, for systems mainly comprised of water (more than 98% in mass), this liquid dominates the suspension’s thermo-optic behavior and, once it is a fluid with slightly negative thermo-optic coefficient, the refractive index n2 is approximately constant for the temperature range of 20 - 60 ºC. Consequently, there is no variation on the modulation of light for this temperature range, and no thermal corrections on the value of IR(t) need to be applied to the algorithm’s Equations 2 and 3 (Fujiwara et al., 2018Fujiwara, E., Gomes, M. K., Soares, M. C. P., Rodrigues, M. S., Schenkel, E. A., Suzuki, C. K. Characterization of colloidal silica by optical fiber sensor. Proc. IEEE SBFoton Int. Opt. Photon. Conf. (SBFoton IOPC, 2018). https://doi.org/10.1109/SBFoton-IOPC.2018.8610896
https://doi.org/10.1109/SBFoton-IOPC.201...
).
Finally, some materials show refractive indexes dependent on the particular wavelength used. Thus, when using the same setup of Figure 2, but with a laser of different wavelength, care must be taken when applying Equation 2, since corrections on n1 and n2 may be necessary. Despite the fact that the algorithm comprised of Equations 3 to 6 is not changed by this variation, the modulation of light is a non-linear function of the refractive indexes, so we strongly advise the construction of new correlations and calibration curves when changing the wavelength or light source.
Correlation between stability and FOQELS signal
If the environmental physicochemical characteristics disfavor colloidal stability, there is a strong increase in the tendency of coagulation, originating aggregates of higher apparent diameters, as analyzed in previous sections (Hunter, 2004Hunter, R. J. Foundations of Colloid Science (Oxford University Press, 2004).; Israelachvili, 2011Israelachvili, J. Intermolecular and Surface Forces, Third Edition (Academic Press, 2011).). A first prediction based on Equations 4 and 5 is that particles with larger diameters present lower diffusivities and, consequently, the assessment of their dispersions in water results in lower average decay rates Γm. In the limit of stability, when the aggregates are so large that the colloid is just about to precipitate, the particle apparent diameters get so high that they are no longer comparable in order of magnitude to the wavelength of the light, and so no QELS is expected to be observed (Finsy, 1994Finsy, R. Particle Sizing by Quasi-Elastic Light Scattering. Adv. Colloid. Interface Sci., 52, 79-143 (1994). https://doi.org/10.1016/0001-8686(94)80041-3
https://doi.org/10.1016/0001-8686(94)800...
).
Evaluation of the optical fiber sensor response
Average decay rate as a function of suspension concentration and of the particle mean diameter
Colloidal suspensions of both the particles classified as silica S1 and as silica S2, with concentrations ranging from 0.6 to 2.0 % (m/m), were applied for the evaluation of the effect of particle concentration on the average decay rate Γm. For each diameter and suspension concentration, the FOQELS was used for the analysis of the colloids and two different curves correlating Γm to the concentration of silica dispersed in water were obtained.
For each curve, the sensor sensitivity was calculated as the absolute value of the rate of variation of Γm with the variation of silica concentration. All the tests were performed at ~25°C.
Colloidal stability tests
The colloidal stability was analyzed in terms of the average decay rate as a function of the medium pH and of the ionic strength, and in terms of the presence of solid precipitation. Since we did not want to introduce diameter differences, we chose silica S1 (125 nm) for the analyses, due to the higher sensitivity obtained for this particle, as shown in a further section.
In the case of the pH tests, solutions of silica S1 with concentrations of 1.5 and 2.0% (m/m) were prepared in duplicate. The first group of each solution was progressively acidified by adding an aqueous solution with 0.1 mol.L-1 of HCl, and the second group had its pH progressively increased by the addition of a solution with 0.1 mol.L-1 of NaOH in water. Every time a volume of acid or base was added (drop-by-drop addition of the solutions), the sample pH was verified (pH meter PG 2000 equipped with a SC26 Sensoglass electrode, capable of handling temperatures up to 90°C, Gehaka, Brazil). The samples were simultaneously monitored with both the pH meter and the FOQELS, and values of Γm corresponding to each tested pH were obtained. The additions were performed every 1 min, allowing the obtention of a stable pH reading and the collection of the 20,000 optical measurements. All these experiments were conducted at ~25°C.
Then, suspensions of particles classified as silica S1 with concentrations of 1.5 and 2.0 % (m/m) were used for evaluating the colloidal stability in terms of the medium ionic strength I. NaCl (s) was progressively added (additions of solid every 1 min, allowing the evaluation of the suspension mass in an analytical balance) to flasks containing 100 mL of each suspension, and the system was kept at ~25°C. No volumetric expansion was observed, and the Γm was calculated as the salt concentration increased. In order to convert the value of NaCl concentration into the corresponding ionic strength I, Equation 7 was applied (Edwards et al., 1975Edwards, T., Newman, J., Prausnitz, J. Thermodynamics of Aqueous Solutions Containing Volatile Weak Electrolytes. AIChE J., 21, 248-259 (1975). https://doi.org/10.1002/aic.690210205
https://doi.org/10.1002/aic.690210205...
).
In Equation 7, zj represents the charge of each ion j dissolved in solution and wj is its respective molal concentration, in mols of ions per kg of solvent. For NaCl, z = +1 for the ion Na+ and z = -1 for the ion Cl-. Both ions have the same concentration in solution (equals to the concentration of the dissolved NaCl, as the stoichiometry is 1:1 in this case), and the concentration of H+ and OH- derived from the self-ionization of water can be considered negligible in relation to the concentration of Na+ and Cl- (Skoog et al., 2014Skoog, D., West, D., Holler, F. J., Crouch, S. Fundamentals of Analytical Chemistry, Ninth Edition (Cengage Learning, 2014).). Then, by applying the value of 0.997 kg.L-1 for the water density at 25°C (Çengel and Cimbala, 2006Çengel, Y., Cimbala, J. Fluid Mechanics, Fundamentals and Applications (McGraw-Hill, 2006).) and the value of 58.443 g.mol-1 for the NaCl molar mass (Cotton and Wilkinson, 1980Cotton, F. A., Wilkinson, G. Advanced Inorganic Chemistry (John Wiley and Sons, 1980).), it is possible to simplify Equation 7 to the correlation expressed by Equation 8, where mNaCl is the added mass of NaCl, in g, Vw is the total volume of water, in mL, and the ionic strength I is given in mol.kg-1.
For all of the stability tests, the systems were kept mechanically stirred, except during the small-time intervals necessary for weighing them for mass quantification. The intervals between every acid, base or salt addition were sufficient for acquiring stable optical readings, with no need for signal-filtering procedures. During the procedure, care must be taken to not allow mechanical contact between the magnetic stirrer and the pH-meter, which could damage it due to its mechanical fragility.
RESULTS AND DISCUSSION - OPTICAL FIBER SENSOR RESPONSE ANALYSIS
Decay rate correlated to the particle concentrations and diameters
The results obtained for the correlation between the decay rate Γm and the silica concentration (25 ºC) are shown in Figure 3 for both S1 and S2 silica nanoparticles, and there is an approximately linear growth for a given mean diameter, confirming the existence of functions relating Γm to the nanoparticle concentration.

Average decay rate detected for the suspensions as a function of the silica concentration. Both particles S1 (mean diameter of 125 nm) and S2 (mean diameter of 159 nm) were evaluated and curves with different angular coefficients were obtained for each one.
Before analyzing the results, it is important to cite that QELS is a statistical measurement which quality depends on the total number of dispersed particles (Berne and Pecora, 1976Berne, B. J., Pecora, R. Dynamic Light Scattering with Applications to Chemistry, Biology and Physics (John Wiley and Sons, 1976).; Finsy, 1994Finsy, R. Particle Sizing by Quasi-Elastic Light Scattering. Adv. Colloid. Interface Sci., 52, 79-143 (1994). https://doi.org/10.1016/0001-8686(94)80041-3
https://doi.org/10.1016/0001-8686(94)800...
). Thus, it is expected that the use of a small number of dispersed particles will lead to poor statistics and to loss of sensitivity of the system. This fact is noted even when working with precision LDV-based light scattering instruments, which demands the determination of the optimum concentration of the colloid before the performance of tests (Holthoff et al., 1996Holthoff, H., Egelhaaf, S. U., Borkovec, M., Schurtenberger, P., Sticher, H. Coagulation rate measurements of colloidal particles by simultaneous static and dynamic light scattering. Langmuir, 12, 5541-5549 (1996). https://doi.org/10.1021/la960326e
https://doi.org/10.1021/la960326e...
; Mondragon et al., 2012Mondragon, R., Julia, J. E., Barba, A., Jarque, J. C. Characterization of silica-water nanofluids dispersed with an ultrasound probe: a study of their physical properties and stability. Powder Technol., 224, 138-146 (2012). https://doi.org/10.1016/j.powtec.2012.02.043
https://doi.org/10.1016/j.powtec.2012.02...
).
There is also a physical aspect regarding the nanoparticles that is important for the data interpretation: the decay rate Γm is proportional to the diffusivity (Equation 4), which is in turn favored by smaller particle diameters (Equation 5). One can then expect that the lower frequency of the Brownian motion verified for particles with higher diameters (lower diffusion coefficients) will lead to smaller values of Γm (Finsy, 1994Finsy, R. Particle Sizing by Quasi-Elastic Light Scattering. Adv. Colloid. Interface Sci., 52, 79-143 (1994). https://doi.org/10.1016/0001-8686(94)80041-3
https://doi.org/10.1016/0001-8686(94)800...
).
Figure 3 presents the values of Γm as a function of the silica concentration, and suspensions comprised of both silica nanoparticles (S1 and S2) were used. It is possible to observe that each nanoparticle average diameter corresponds to a curve of Γm with a different angular coefficient, what is a consequence of the difference of diffusivity, as stated above (DAB, S1 = 3.75 x 10⁻⁸ cm².s-1 and DAB, S2 = 2.95 x 10⁻⁸ cm².s-1 at 25 ºC, estimated earlier). By determining the calibration curves of Γm as a function of the particle concentration for different known diameters, one can perform a data consistency analysis between the calibration and the decay rate curve observed for a given sample with particles of unknown dimensions. Then, it is possible to make inferences about the nanoparticles’ average diameter.
If the nanoparticle mean diameter is known, on the other hand, the value of Γm will be correlated to a specific value of concentration. For concentrations higher than 1.2% (m/m), the curves of Figure 3 show values of Γm quite different for each diameter, which enhances the quality of such estimations. For concentrations lower than 1.2%, the curves show lack of differences regarding the diameter and the results present more oscillation. This fact is probably a consequence of the lower number of dispersed particles, which impairs the statistics, as previously mentioned.
It is also important to note that, for concentrations above 1.2% (where the diameter differences are more evident in the curves), the evaluation of suspensions containing particles of larger diameters (159 nm) indeed resulted in lower values of Γm for the same silica concentration, as expected from the abovementioned analysis of the effect of diameter differences (Equation 4).
The fitting of Γm data to straight lines allows the calculation of the Fiber Optic Quasi-Elastic Light Scattering (FOQELS)-sensor sensitivity for each particle diameter: 2.35 x 10³ s-1 and 1.06 x 10³ s-1 for the particles with mean diameter of 125 nm (silica S1) and 159 nm (silica S2), respectively.
Figure 4, in its turn, compares the normalized reflected intensity signal obtained for DI water with the one collected for the suspension containing 2.0% (m/m) of silica S1. In the case of water, the autocorrelation function G2 (τ) shows no exponential decay, whereas there is a clear decay of G2 (τ) obtained for the silica suspension (a consequence of the QELS phenomenon and that allows the evaluation of Γm). The signals were normalized in relation to an internal light intensity reference of the equipment, and there is a small difference in the average values that is probably related to mechanical macrobendings or to spatial position variations of the fiber probe during the tests.

Normalized reflected intensities IR and the corresponding autocorrelation functions G2(τ): (A) IR for DI water; (B) G2(τ) for DI water, showing no exponential decay; (C) IR for the suspension containing 2.0% in mass of silica S1; (D) G2(τ) for the suspension containing 2.0% in mass of silica S1, showing an exponential decay caused by QELS. The red dashed lines in (A) and (C) represent the mean normalized intensity, μ, and the limits of the intervals corresponding to μ ± 3σ, where σ is the standard deviation of the signal. It is possible to observe a significant increase in the signal variance (3σ goes from 0.006 to 0.029, an increase of almost 5 times) when the concentration goes from 0 to 2.0% (m/m) of silica, which is caused by the scattering of light.
The signal-to-noise ratio (SNR) can be calculated from Figure 4 as the relation μ²/σ², where μ is the mean value of the optical signal and σ² is its variance (Saleh and Teich, 1991Saleh, B. E. A., Teich, M. C. Fundamentals of Photonics, 1st Edition (John Wiley and Sons, 1991). https://doi.org/10.1002/0471213748
https://doi.org/10.1002/0471213748...
), what results in SNR = 2.73 x 10⁵ and 1.05 x 10⁴ for the DI water and for the silica suspension (2.0% in mass of silica S1), respectively. This could be also interpreted in terms of the comparison between the intervals μ ± 3σ, which are commonly took as simplified estimations of the total uncertainties of the signals: 3σ goes from 0.006, in the case of DI water, to 0.029 for silica, an increase of almost 5 times caused by the scattering. In systems analyzed by QELS, however, poor SNRs are consequence of the presence of a higher number of particles scattering light, so they correspond to an increase in Γm and favor the colloidal assessment (Soares et al., 2019Soares, M. C. P., Vit, F. F., Suzuki, C. K., de la Torre, L. G., Fujiwara, E. Perfusion Microfermentor Integrated into a Fiber Optic Quasi-Elastic Light Scattering Sensor for Fast Screening of Microbial Growth Parameters. Sensors, 19, 2493 (2019). https://doi.org/10.3390/s19112493
https://doi.org/10.3390/s19112493...
).
Because of the higher sensitivity obtained for Silica S1 (Figure 3), this material was chosen for the other analyses performed in this research, enhancing the quality of the collected data. Due to the lack of sensitivity and confidence for the results obtained with concentrations equal to or lower than ~1.2 % (m/m), we decided not to evaluate the QELS phenomenon for suspensions with concentrations under this value.
Effect of pH on colloidal stability and correlation with QELS decay rate (Γm)
The QELS decay rate Γm was analyzed in terms of the pH in order to simulate different chemical conditions and to correlate Γm with the colloidal stability. In this evaluation, the kinetic analysis was not carried out: the pH was varied and we simply performed the FOQELS measurements and finally correlated the data with the visible presence of solid precipitate. In this circumstance, a given silica nanoparticle suspension was considered stable if there was no solid precipitate formation for a particular pH value.
This study was not intended to provide a direct correspondence between the QELS and to the pH (since it would imply the construction of a very complex curve of Γm as a function of pH, corrected for concentration and time, taking in account the dilution of the colloid caused by the addition of solution), but to verify if there were variations in the Γm pattern regarding the lack of stability. Then, to show this possibility and that there is no need for more expensive tests, we decided not to perform the comparison with the already cited techniques of zeta-potential or spectrophotometry, but only to the theory and to the presence of solids. Besides being the more common methodologies applied, these measurements are not capable of directly quantifying the stability, being based on indirect assessments (Zhou et al., 2009Zhou, J., Ralston, J., Sedev, R., Beattie, D. A. Functionalized gold nanoparticles: synthesis, structure and colloid stability. J. Colloid Interface Sci. , 331, 251-262 (2009). https://doi.org/10.1016/j.jcis.2008.12.002
https://doi.org/10.1016/j.jcis.2008.12.0...
Israelachvili, 2011Israelachvili, J. Intermolecular and Surface Forces, Third Edition (Academic Press, 2011).).
For these experiments, silica nanoparticles S1 (125 nm) were used and the results of Γm as a function of different initial concentrations and pHs are presented in Figure 5.

Decay rate as a function of pH, for two different initial concentrations of silica S1 nanoparticles (mean diameter of 125 nm). The black dashed line represents the baseline of the stability for higher pH values. The color scale represents the region of visual inspection of colloidal stability and the values of pH when the particles start aggregating (lack of stability).
According to Equation 4 and to QELS theory (Finsy, 1994Finsy, R. Particle Sizing by Quasi-Elastic Light Scattering. Adv. Colloid. Interface Sci., 52, 79-143 (1994). https://doi.org/10.1016/0001-8686(94)80041-3
https://doi.org/10.1016/0001-8686(94)800...
), lower values of the decay rate Γm can be related to the presence of a smaller number of particles with diameters comparable to the laser wavelength. Then, Γm is expected to get progressively lower as the colloidal stability falls and particles aggregate.
Figure 5 shows that, for a given concentration, there is a region (highlighted in green) where Γm stays approximately constant, at a high value, and no solid precipitate is observed. Then, as the pH falls, a gradual decrease in Γm is observed from pH ~ 4.0, as indicated by the gray dashed region in Figure 5. At a critical pH value, ~ 2.0, Γm drastically falls to zero and solid precipitate can be observed.
The Γm profiles of Figure 5 present a very similar qualitative interpretation to the results obtained by Mondragon et al. (2012Mondragon, R., Julia, J. E., Barba, A., Jarque, J. C. Characterization of silica-water nanofluids dispersed with an ultrasound probe: a study of their physical properties and stability. Powder Technol., 224, 138-146 (2012). https://doi.org/10.1016/j.powtec.2012.02.043
https://doi.org/10.1016/j.powtec.2012.02...
) using a light scattering equipment with LDV, a much more complex and expensive instrument. In the case of the study of Mondragon et al. (2012), the decrease of the colloidal stability for pH values lower than 4.0 was verified in terms of the zeta potential, whereas in the present study it was observed as a decrease of the average decay rate detected by the optical fiber sensor.
It is important to observe that care must be taken, in the case of silica, when analyzing the alkaline stability. As already mentioned previously, hydroxide ions deprotonate the silica silanol groups, creating ionic species (Si-O-) on the material’s surface that could destroy the particles and dissolve the silica. Because we observed the presence of quasi-elastic light scattering (represented by the decay rate Γm) in all of the tests, we concluded that this phenomenon did not take place and that the particles were still dispersed and scattering the light at the end of the experiment. However, if a sudden decrease in the signal had been observed for higher pHs, this would have been a feasible cause for the experimental observation.
Despite the lack of dynamic analysis that could prove the formation of aggregates of particles or the reduction of their electrical double layer, a strong hypothesis is that, if the environmental physicochemical characteristics disfavor the stability, there is an increase in the tendency of coagulation. Because the silica nanoparticles are rigid, they form aggregates with random geometry and higher effective diameter (the apparent diameter of the clusters formed by aggregated particles and by the hydration molecules closest to their surface) (Welty et al., 2008Welty, J. R., Wicks, C. E., Wilson, R. E., Rorrer, G. L. Fundamentals of Momentum, Heat and Mass Transfer, 5th Edition (John Wiley and Sons, 2008).; Israelachvili, 2011Israelachvili, J. Intermolecular and Surface Forces, Third Edition (Academic Press, 2011).).
Then, the direct application of Equation 5 is no longer correct for such aggregates, and angle-dependent light scattering measurements are necessary for a correct analysis. However, many mass transfer models (Welty et al., 2008Welty, J. R., Wicks, C. E., Wilson, R. E., Rorrer, G. L. Fundamentals of Momentum, Heat and Mass Transfer, 5th Edition (John Wiley and Sons, 2008).) correlate the diffusivity to the inverse of the apparent size of the dispersed materials, so we can conclude that there is a reduction in the Brownian motion frequency (which is responsible for the scattering) as the clusters are formed (Finsy, 1994Finsy, R. Particle Sizing by Quasi-Elastic Light Scattering. Adv. Colloid. Interface Sci., 52, 79-143 (1994). https://doi.org/10.1016/0001-8686(94)80041-3
https://doi.org/10.1016/0001-8686(94)800...
; Israelachvili, 2011Israelachvili, J. Intermolecular and Surface Forces, Third Edition (Academic Press, 2011).). This is, therefore, the probable cause of the decrease in the value obtained for Γm and, in the limit of this process, the apparent aggregate size is no longer comparable to the laser wavelength and no light is scattered, so the signal falls to zero.
Effect of ionic strength on colloidal stability and correlation with the QELS decay rate
Considering the important effect of ionic strength (I) on colloidal stability, we also evaluated Γm as a function of I. Thus, the concentration of NaCl was varied in order to change the ionic strength, and Γm was measured in a similar way as performed for the pH evaluation, using again silica S1 nanoparticles (125 nm) for the analysis. As stated for the pH, we aimed to identify the limit of the colloidal stability in terms of I (when the nanoparticles start aggregating), but decided not to compare it with the more commonly used high-cost techniques, which also provide only an indirect evaluation of stability.
The results obtained for the experiments correlating Γm to I for the solutions of 1.5 and 2.0 % (m/m) of silica S1 in water are shown in Figure 6, where we can observe a point with an abrupt decrease of Γm. As I increases, there is a reduction of colloidal stability, leading to phase separation and to the decrease in the Γm signal. Figures 6(B) and 6(C) show the stable colloidal suspension of 2.0% (m/m) at low I, and the two-phase system with solid precipitate obtained at the end of the process of increasing I, respectively.

(A) Decay rate as a function of medium ionic strength for two different concentrations of silica S1 (125 nm). The color scale represents the region of stability and the formation of aggregates. The lines are just to guide the eye; Silica nanoparticle suspension with concentration of 2% (m/m); (B) stable colloid, at I=0; (C) two-phase system obtained when I is increased beyond the stability limit, and a clarified phase with lower density and a solid precipitate on the bottom of the glassware can be observed.
As expected, Figure 6 shows an initial decay rate that is higher for the most concentrated suspensions, due to the presence of more dispersed particles able to scatter the light (Finsy, 1994Finsy, R. Particle Sizing by Quasi-Elastic Light Scattering. Adv. Colloid. Interface Sci., 52, 79-143 (1994). https://doi.org/10.1016/0001-8686(94)80041-3
https://doi.org/10.1016/0001-8686(94)800...
). It was observed, for a given concentration of silica in water, that there is a point of abrupt reduction of Γm, indicating the limit of stability (gray dashed points of Figure 6(A)). If the ionic strength is increased even beyond this critical value, then the solid precipitate is observed and the FOQELS signal drops to zero. It is important to emphasize that the ionic strength of the pure water was considered approximately equals to zero in all of the experiments, since the concentration of the charged species derived from the water’s auto-ionization process is in the order of 10-7 mol.L-1 at 25 ºC (Skoog et al., 2014Skoog, D., West, D., Holler, F. J., Crouch, S. Fundamentals of Analytical Chemistry, Ninth Edition (Cengage Learning, 2014).), a value that is negligible compared to the NaCl concentration.
It is also noticeable in Figure 6 that the lower concentration used, 1.5%, shows a small stability range before the abrupt decrease of Γm. The more concentrated suspension, 2% (m/m), in its turn, shows an intense decrease in the decay rate almost as soon as the ionic strength begins to increase. Since the particles are closer to each other in the more concentrated medium, the average time between successive collisions of nanoparticles is shorter in the 2.0% case (Israelachvili, 2011Israelachvili, J. Intermolecular and Surface Forces, Third Edition (Academic Press, 2011).). So, the effect of reducing the electrical double layer thickness and favoring the formation of aggregates is verified earlier, as a decrease of Γm concomitant with the first addition of salt.
If we compare Figures 5 and 6, we can observe substantially inferior values of Γm for the pH tests. The reason is that there is no volume variation in Figure 6 (the initial concentration of silica is maintained constant), which is not true for the case of the pH procedure consisting of the drop-by-drop addition of acid or basic solutions.
This pH procedure was chosen because silica particles present an unknown number of silanol and oxide amphoteric groups - which are responsible for the acid-base interactions with the dielectric medium (Iler, 1978Iler, R. K. The Chemistry of Silica Solubility, Polymerization, Colloid and Surface Properties, and Biochemistry (John Wiley and Sons, 1978).; Cotton and Wilkinson, 1980Cotton, F. A., Wilkinson, G. Advanced Inorganic Chemistry (John Wiley and Sons, 1980).) - so the force of the interactions with the added chemicals and the volume required for changing a single pH-unit (the total number of drops) varies as the solutions are added.
Our major concern, on the other hand, was to obtain stable pH readings that could be interpreted in terms of Γm, and the differences in the numbers of drops between each measurement enhance the difficulty on obtaining a direct and complete correlation. That is because it would be necessary to analyze Γm in terms of the instant concentration (dependent on the volume added), time, and pH, requiring controlled flow rates of acid or basic solutions. This is not feasible for most of industrial and practical situations (the objective of this study) where it may be difficult to associate the pH variations that destabilize the colloid with known volume variations.
Therefore, the magnitude of Γm is lower in Figure 5 due to the dilution associated with the addition of acid or base. This does not seem to be a problem, because the experiments lead to the same results obtained by Mondragon et al. (2012Mondragon, R., Julia, J. E., Barba, A., Jarque, J. C. Characterization of silica-water nanofluids dispersed with an ultrasound probe: a study of their physical properties and stability. Powder Technol., 224, 138-146 (2012). https://doi.org/10.1016/j.powtec.2012.02.043
https://doi.org/10.1016/j.powtec.2012.02...
) for silica dispersions with two different initial concentrations, being able to assess the stability limits.
In relation to the reproducibility of the tests, it is important to emphasize that the autocorrelation function is already a statistic that takes in account all of the 20,000 data collected by the equipment in each measurement cycle (Equation 3). When we repeat the cycle for the same sample and adopt the same values of τ, a typical variation lower than 2 x 10⁻⁵ s-1 (not observable on the graphs) is verified for the calculated values of Γm.
CONCLUSIONS
We demonstrated that the Fiber Optic Quasi-Elastic Light Scattering sensor was successful in showing sensitivity regarding the colloidal properties, being able to differentiate the concentrations of suspensions made of amorphous particles with different diameters (125 and 159 nm) due to the differences in diffusivities. The analysis of suspension viscosities showed that there was no significant influence of this parameter on the FOQELS signal obtained for a given temperature, so it is not necessary to perform signal corrections related to this parameter.
A remarkable result was the obtention of decreasing tendencies in the QELS decay rate when the medium was subjected to variations that disfavor the colloidal stability in terms of pH and ionic strength. A maximum stability baseline of Γm was reached for pHs above 4.0, and no signal was detected under pH 2.0, which are approximately the same critical stability limits of silica colloidal suspensions reported on literature (Mondragon et al., 2012Mondragon, R., Julia, J. E., Barba, A., Jarque, J. C. Characterization of silica-water nanofluids dispersed with an ultrasound probe: a study of their physical properties and stability. Powder Technol., 224, 138-146 (2012). https://doi.org/10.1016/j.powtec.2012.02.043
https://doi.org/10.1016/j.powtec.2012.02...
). Such information about the stability is traditionally obtained with complex light scattering instruments with LDV and, since our instrument presents the advantage of integrability to a remote and online control system, it is possible to envision many future applications, saving costs on storage tests and correcting the environmental conditions before the system loses its stability.
The system presents the limitation of not being able to quantify multivariate data, obtaining, for example, the spatial information required for the calculation of the light scattering vector q and of the particle diameter distribution, or the electrical signals required for quantification of the zeta-potential of the nanoparticles. On the other hand, it is made of low cost and widely available telecommunication devices, does not require a dark chamber and can be used in-situ. It can thus be applied for the premature detection of a decrease in colloidal stability with changes in pH, preventing solid precipitation, with applications in pH and ionic strength control of colloidal media where the sensor could be simply immersed in the suspension for remote monitoring and online control: if the value of Γm showed a tendency to decrease, then the monitoring unit would detect the loss of colloidal stability and actuate a system of pumps or valves, adding acid or base into the suspension, and the correction of pH would avoid coagulation. The correction of I, on the other hand, could be performed by simply diluting the colloid. A researcher could also use this sensor to perform a fast screening of the stability regarding those parameters, an analysis that is traditionally performed with spectrophotometers, limited for remote monitoring (Zhou et al., 2009Zhou, J., Ralston, J., Sedev, R., Beattie, D. A. Functionalized gold nanoparticles: synthesis, structure and colloid stability. J. Colloid Interface Sci. , 331, 251-262 (2009). https://doi.org/10.1016/j.jcis.2008.12.002
https://doi.org/10.1016/j.jcis.2008.12.0...
), and that require removing samples of the suspension from the storage vessel at definite times.
The powerful and versatile methodology applied in this research can be easily extended for the analysis of other types of important chemical and biological colloidal systems, which are also commonly constituted of more than 98% of water in mass. Next researches will be focus on miniaturizing the sensor, providing integration with smartphones, including our system in the context of Industry 4.0.
ACKNOWLEDGMENTS
This work was supported in part by FAPESP under grants 2017/06190-7 and 2017/20445-8, CNPq, and CAPES, financial code 001. We thank the Brazilian National Nanotechnology Laboratory (LNNano) for the SEM images.
REFERENCES
- Balbino, T. A., Serafin, J. M., Gasperini, A. A. M., Oliveira, C. L. P., Cavalcanti, L. P., Jesus, M. B., la Torre, L. G. Microfluidic assembly of pDNA/cationic liposomes lipoplexes with high pDNA loading for gene delivery, Langmuir, 32, 1799-1807 (2016). https://doi.org/10.1021/acs.langmuir.5b04177
» https://doi.org/10.1021/acs.langmuir.5b04177 - Berne, B. J., Pecora, R. Dynamic Light Scattering with Applications to Chemistry, Biology and Physics (John Wiley and Sons, 1976).
- Çengel, Y., Cimbala, J. Fluid Mechanics, Fundamentals and Applications (McGraw-Hill, 2006).
- Cotton, F. A., Wilkinson, G. Advanced Inorganic Chemistry (John Wiley and Sons, 1980).
- Davraz, M., Gunduz, L. Engineering properties of amorphous silica as a new natural pozzolan for use in concrete, Cem. Concr. Res., 35, 1251-1261 (2005). https://doi.org/10.1016/j.cemconres.2004.11.016
» https://doi.org/10.1016/j.cemconres.2004.11.016 - Edwards, T., Newman, J., Prausnitz, J. Thermodynamics of Aqueous Solutions Containing Volatile Weak Electrolytes. AIChE J., 21, 248-259 (1975). https://doi.org/10.1002/aic.690210205
» https://doi.org/10.1002/aic.690210205 - Finsy, R. Particle Sizing by Quasi-Elastic Light Scattering. Adv. Colloid. Interface Sci., 52, 79-143 (1994). https://doi.org/10.1016/0001-8686(94)80041-3
» https://doi.org/10.1016/0001-8686(94)80041-3 - Fujiwara, E., Gomes, M. K., Soares, M. C. P., Rodrigues, M. S., Schenkel, E. A., Suzuki, C. K. Characterization of colloidal silica by optical fiber sensor. Proc. IEEE SBFoton Int. Opt. Photon. Conf. (SBFoton IOPC, 2018). https://doi.org/10.1109/SBFoton-IOPC.2018.8610896
» https://doi.org/10.1109/SBFoton-IOPC.2018.8610896 - Fujiwara, E., Ono, E., Suzuki, C. K. Application of an optical fiber sensor on the determination of sucrose and ethanol concentrations in process streams and effluents of sugarcane bioethanol industry. IEEE Sens. J., 12, 2839-2843 (2012). https://doi.org/10.1109/JSEN.2012.2204246
» https://doi.org/10.1109/JSEN.2012.2204246 - Hall, J. B., Dobrovolskaia, M. A., Patri, A. K., McNeil, S. E. Characterization of nanoparticles for therapeutics. Nanomedicine, 2, 789-803 (2007). https://doi.org/10.2217/17435889.2.6.789
» https://doi.org/10.2217/17435889.2.6.789 - Henderson, K., Park, Y.-G., Liu, L., Jacobi, A. M. Flow-boiling heat transfer of R-134a-based nanofluids in a horizontal tube, Int. J. Heat Mass Transf., 53, 944-951 (2010). https://doi.org/10.1016/j.ijheatmasstransfer.2009.11.026
» https://doi.org/10.1016/j.ijheatmasstransfer.2009.11.026 - Heurlin, M., Anttu, N., Camus, C., Samuelson, L., Borgström, M. T. In-situ characterization of nanowire dimensions and growth dynamics by optical reflectance. Nano Lett., 15, 3597-3602 (2015). https://doi.org/10.1021/acs.nanolett.5b01107
» https://doi.org/10.1021/acs.nanolett.5b01107 - Holthoff, H., Egelhaaf, S. U., Borkovec, M., Schurtenberger, P., Sticher, H. Coagulation rate measurements of colloidal particles by simultaneous static and dynamic light scattering. Langmuir, 12, 5541-5549 (1996). https://doi.org/10.1021/la960326e
» https://doi.org/10.1021/la960326e - Hunter, R. J. Foundations of Colloid Science (Oxford University Press, 2004).
- Iler, R. K. The Chemistry of Silica Solubility, Polymerization, Colloid and Surface Properties, and Biochemistry (John Wiley and Sons, 1978).
- Israelachvili, J. Intermolecular and Surface Forces, Third Edition (Academic Press, 2011).
- Kirby, B., Hasselbrink, E. Zeta potential of microfluidic substrates: 1. Theory, experimental techniques, and effects on separations. Electrophoresis, 25, 187-202 (2004). https://doi.org/10.1002/elps.200305754
» https://doi.org/10.1002/elps.200305754 - Kucheyeva, S. O., Biener, J., Wang, Y. M., Baumann, T. F., Wu, K. J., van Buuren, T., Hamza, A. V., Satcher Jr., J. H. Atomic layer deposition of ZnO on ultralow-density nanoporous silica aerogel monoliths. Appl. Phys. Lett., 86, 083108 (2005). https://doi.org/10.1063/1.1870122
» https://doi.org/10.1063/1.1870122 - Levy, A., Andelman, D. Dielectric Constant of Ionic Solutions: A Field-Theory Approach. Phys. Rev. Lett., 108, 227801, 2012. https://doi.org/10.1103/PhysRevLett.108.227801
» https://doi.org/10.1103/PhysRevLett.108.227801 - Macfayden, A. J., Jennings, B. R. Fibre-optic systems for dynamic light scattering-a review. Opt. Laser Technol., 22, 175-187 (1990). https://doi.org/10.1016/0030-3992(90)90105-D
» https://doi.org/10.1016/0030-3992(90)90105-D - Mondragon, R., Julia, J. E., Barba, A., Jarque, J. C. Characterization of silica-water nanofluids dispersed with an ultrasound probe: a study of their physical properties and stability. Powder Technol., 224, 138-146 (2012). https://doi.org/10.1016/j.powtec.2012.02.043
» https://doi.org/10.1016/j.powtec.2012.02.043 - Nakamura, S., Sato, Y., Ishii, K. High-sensitivity low-coherence dynamic light scattering and particle sizing for nanoparticles (II): SM-fiber probe system applied to dense particle suspensions. Proc. SPIE, v.9232 (2014). https://doi.org/10.1117/12.2063641
» https://doi.org/10.1117/12.2063641 - Overbeek, J. T. G. Recent Developments in the Understanding of Colloid Stability. J. Colloid Interface Sci., 58, 408-422 (1977). https://doi.org/10.1016/0021-9797(77)90151-5
» https://doi.org/10.1016/0021-9797(77)90151-5 - Pope, E. J. A., Mackenzie, J. D. Sol-gel processing of silica: II. The role of the catalyst. J. Non-Cryst. Solids, 87, 185-198 (1986). https://doi.org/10.1016/S0022-3093(86)80078-3
» https://doi.org/10.1016/S0022-3093(86)80078-3 - Quercia, G., Lazaro, A., Geus, J. W., Brouwers, H. J. H. Characterization of morphology and texture of several amorphous nano-silica particles used in concrete. Cem. Concr. Compos., 44, 77-92 (2013). https://doi.org/10.1016/j.cemconcomp.2013.05.006
» https://doi.org/10.1016/j.cemconcomp.2013.05.006 - Raimer, L. Scannig Electron Microscopy. Physics of Image Formation and Microanalysis. Second Edition (Springer, 1998).
- Rička, J. Dynamic light scattering with single-mode and multimode receivers. Appl. Opt., 32, 2860-2875 (1993). https://doi.org/10.1364/AO.32.002860
» https://doi.org/10.1364/AO.32.002860 - Santos, J. S., Ono, E., Fujiwara, E., Manfrim, T. P., Suzuki, C. K. Control of optical properties of silica glass synthesized by VAD method for photonic components. Opt. Mater., 33, 1879-1883 (2011). https://doi.org/10.1016/j.optmat.2011.03.007
» https://doi.org/10.1016/j.optmat.2011.03.007 - Saleh, B. E. A., Teich, M. C. Fundamentals of Photonics, 1st Edition (John Wiley and Sons, 1991). https://doi.org/10.1002/0471213748
» https://doi.org/10.1002/0471213748 - Schmalz, R. F. Flint and the Patination of Flint Artifacts. Proc. Prehist. Soc., 26, 44-49 (1960). https://doi.org/10.1017/S0079497X00016236
» https://doi.org/10.1017/S0079497X00016236 - Shin, D., Banerjee, D. Enhancement of specific heat capacity of high-temperature silica-nanofluids synthesized in alkali chloride salt eutectics for solar thermal-energy storage applications. Int. J. Heat Mass Transf. , 54, 1064-1070 (2011). https://doi.org/10.1016/j.ijheatmasstransfer.2010.11.017
» https://doi.org/10.1016/j.ijheatmasstransfer.2010.11.017 - Skoog, D., West, D., Holler, F. J., Crouch, S. Fundamentals of Analytical Chemistry, Ninth Edition (Cengage Learning, 2014).
- Smith, J. M., Van Ness, H. C., Abbott, M. M. Introduction to Chemical Engineering Thermodynamics (McGraw-Hill, 2004).
- Soares, M. C. P., Mendes, B. F., Schenkel, E. A., Santos, M. F., Fujiwara, E., Suzuki, C. K. Kinetic and thermodynamic study in pozzolanic chemical systems as an alternative for Chapelle test. Mat. Res., 21, e20180131, 2018. https://doi.org/10.1590/1980-5373-mr-2018-0131
» https://doi.org/10.1590/1980-5373-mr-2018-0131 - Soares, M. C. P., Vit, F. F., Suzuki, C. K., de la Torre, L. G., Fujiwara, E. Perfusion Microfermentor Integrated into a Fiber Optic Quasi-Elastic Light Scattering Sensor for Fast Screening of Microbial Growth Parameters. Sensors, 19, 2493 (2019). https://doi.org/10.3390/s19112493
» https://doi.org/10.3390/s19112493 - Taylor, R. A., Coulombe, S., Otanicar, T., Phelan, P., Gunawan, A., Lv, W., Rosengarten, G., Prasher, R., Tyagi, H. Small particles, big impacts: a review of the diverse applications of nanofluids. J. Appl. Phys., 113, 011301 (2013). https://doi.org/10.1063/1.4754271
» https://doi.org/10.1063/1.4754271 - Tomaszewska, E., Soliwoda, K., Kadziola, L., Tkacz-szczesna, B., Celichowski, G., Cichomski, M., Szmaja, W., Grobelny, J. Detection limits of DLS and UV-vis spectroscopy in characterization of polydispersive nanoparticles colloids. J. Nanomat., 60, 1-10 (2013). https://doi.org/10.1155/2013/313081
» https://doi.org/10.1155/2013/313081 - Welty, J. R., Wicks, C. E., Wilson, R. E., Rorrer, G. L. Fundamentals of Momentum, Heat and Mass Transfer, 5th Edition (John Wiley and Sons, 2008).
- Wiese, G. R., Healy, T. W. Effect of Particle Size on Colloid Stability. Trans. Faraday Soc., 66, 490-499 (1970). https://doi.org/10.1039/tf9706600490
» https://doi.org/10.1039/tf9706600490 - Wolfbeis, O. S. Fiber-optic chemical sensors and biosensors. Anal. Chem., 80, 4269-4283 (2008). https://doi.org/10.1021/ac800473b
» https://doi.org/10.1021/ac800473b - Zhou, C., Gong, Y., Chen, Q., Rao, Y.-J., Peng, G.-D., Fan, X. Reproducible fiber optofluidic laser for disposable and array applications. Lab Chip, 17, 3431-3436 (2017). https://doi.org/10.1039/C7LC00708F
» https://doi.org/10.1039/C7LC00708F - Zhou, J., Ralston, J., Sedev, R., Beattie, D. A. Functionalized gold nanoparticles: synthesis, structure and colloid stability. J. Colloid Interface Sci. , 331, 251-262 (2009). https://doi.org/10.1016/j.jcis.2008.12.002
» https://doi.org/10.1016/j.jcis.2008.12.002
APPENDIX
Appendix 1. Silica characterizationFigure A.1 shows Silica S1 under lower magnification than shown in Figure 1. It is not possible to observe the gold bordering and the particles are very homogeneous, proving that the images selected for the particles’ analysis (Figure 1) are representative of the general aspect of the obtained materials. Since it is difficult to observe and to evaluate diameters differences between silica S1 and S2 when observing the materials under this low magnification, only the image of silica S1 is shown here.

Silica S1 particles observed under lower magnification, showing the very homogeneous morphology. The image obtained for Silica S2 under this magnification was very similar, and so was omitted.
The material was also characterized by XRD, and the corresponding diffractogram is shown in Figure A.2, in counts per second (cps). There is no crystalline peak, showing that the material is completely amorphous. The pattern observed for both silica materials is quite similar, so only the image obtained for Silica S1 is shown.

X-Ray Diffractogram obtained for Silica S1, showing that the material is completely amorphous, with no crystalline peak. The pattern obtained for Silica S2 is quite similar and so was omitted.
The conventional laboratory glassware used for the tests of specific weight under 25 ºC detected no statistically significant difference regarding the diameter for particles S1 and S2. The mean value and the 95% CI calculated with Minitab 17 for the 4 experiments were then took as the soot specific weight and its uncertainty, respectively, resulting in ρsoot (25 ºC) = 1.94 ± 0.09 g.cm-3.
It is important to notice that this value is quite inferior to that obtained for α-quartz, one of the silica crystalline structures. The value commonly accepted in the literature for this material is 2.65 g.cm-3 (Schmalz, 1960), and this difference in the specific weights can be partially attributed to the more compact and organized atomic structure present in crystalline quartz (Iler, 1978; Cotton and Wilkinson, 1980).
The values calculated at 25 ºC for the kinematic viscosities of the colloidal suspensions (silica mass fractions ranging from 0.12 to 2.00%) also showed no detectable differences in relation to the diameters for the results obtained with S1 and S2. This is probably consequence of the very low concentrations of silica used and of the sensitivity limitations of the Cannon-Fenske instruments, which rely on the visual observation of the flow. The four suspensions with the same SiO2 concentration were then treated as replicates and the results were analyzed with the ANOVA test of Minitab 17. The results obtained for the 95% CI for the mean values of the tests obtained for each concentration are shown in Figure A.3.

Mean value and 95% CI calculated for the mean kinematic viscosity of each silica colloidal suspension concentration. The dashed blue line (kinematic viscosity of 0.008937 cm²/s) represents the value commonly accepted for pure water at 25 oC (Çengel and Cimbala, 2006). The other lines are guides for the eye.
The dashed blue line shown in Figure A.3 (kinematic viscosity of 0.008937 cm²/s) represents the viscosity of pure water at 25 ºC (Çengel and Cimbala, 2006). Four of the results (including the one corresponding to the solution with the highest concentration, 2% (m/m) of silica) present no statistically significant difference from the value of the water viscosity, and all of the 9 tests resulted in quite similar mean values. Only one experiment was anomalous, resulting in a value statistically superior, but this result is only 4.5% higher than the viscosity calculated for the concentration of 2% (m/m).
Since all of the suspensions analyzed are very dilute and the particles are spherical, and also considering the studies of Hunter (2004) and Mondragon et al. (2012), it is feasible to assume that the suspensions’ kinematic viscosities do not vary significantly from the experimental values when the shear rate is increased, and so they can be considered constant for a given temperature. The average value obtained for all of the tested concentrations was then took as the kinematic viscosity of the silica colloidal suspensions under 25 ºC, νB = 0.009157 cm².s-1.
Mondragon et al. (2012) presented rheograms for silica nanoparticles colloidal suspensions in water with nine different concentrations. According to this research, the Newtonian behavior is always verified for the suspensions, except when very high shear rates on the order of 100 s-1 are applied to the colloids. In these cases of high shear rates, the viscosities of the suspensions containing the highest concentrations of silica showed a small increase but, for low silica concentrations such as the ones applied in the present study, the Newtonian behavior was verified for all of the tested range of shear rates, resulting in viscosity values similar to that obtained for water.
Hunter (2004), in turn, claims that the elastic component of the colloidal flows is reduced for most of the colloidal suspensions, except for sols and for coagulated colloids with a high degree of viscoelasticity. He also affirms that stable and dilute colloidal suspensions of spherical particles (such as the silica nanoparticle suspensions used in this work) commonly show Newtonian behavior, i.e., the viscosity can be considered constant for a given temperature.
The same hypotheses and considerations lead to the conclusion that the colloidal systems’ specific weights are essentially constant and approximately equal. Thus, it was considered that the value of the solution specific weight was equal to the one estimated for the weighted average of the solution with 2% (m/m) of silica, with no volumetric contraction effects, and the mass fractions were considered to be the weights for the average calculation (Smith et al., 2004). This resulted in ρB = 0.98ρw + 0.02ρsoot, where ρw is the water density at 25 ºC (Çengel and Cimbala, 2006). It is a feasible estimation, since one phase is an incompressible solid (silica) and the other is a liquid (Hunter, 2004; Smith et al., 2004).
With the values of νB and ρB, it was possible to obtain the suspension dynamic viscosity as μB = νB.ρB. Finally, the silica nanoparticles diffusivities in the colloidal suspensions at 25 ºC were estimated by applying the abovementioned results to the Stokes-Einstein equation (Equation 5), leading to DAB, S1 (25 ºC) = 3.75 x 10⁻⁸ cm².s-1 for the particles of silica S1 (diameter of 125 nm) and DAB, S2 (25 ºC) = 2.95 x 10⁻⁸ cm².s-1 for the particles of silica S2 (diameter of 159 nm).
Publication Dates
-
Publication in this collection
13 Jan 2020 -
Date of issue
Oct-Dec 2019
History
-
Received
28 Jan 2019 -
Reviewed
30 Mar 2019 -
Accepted
26 Apr 2019