Abstract
Introduction
The Internet has seen rapid growth in the number of websites focusing on mental health content. Considering the increased need for access to accurate information about mental health treatment, it is important to understand the promotion of this information online.
Objective
To analyze BuzzFeed’s Mental Health Week (BFMHW) interactions on its own website and in related social media platforms (Facebook, Twitter and YouTube) using metrics of information delivery in mental health topics.
Methods
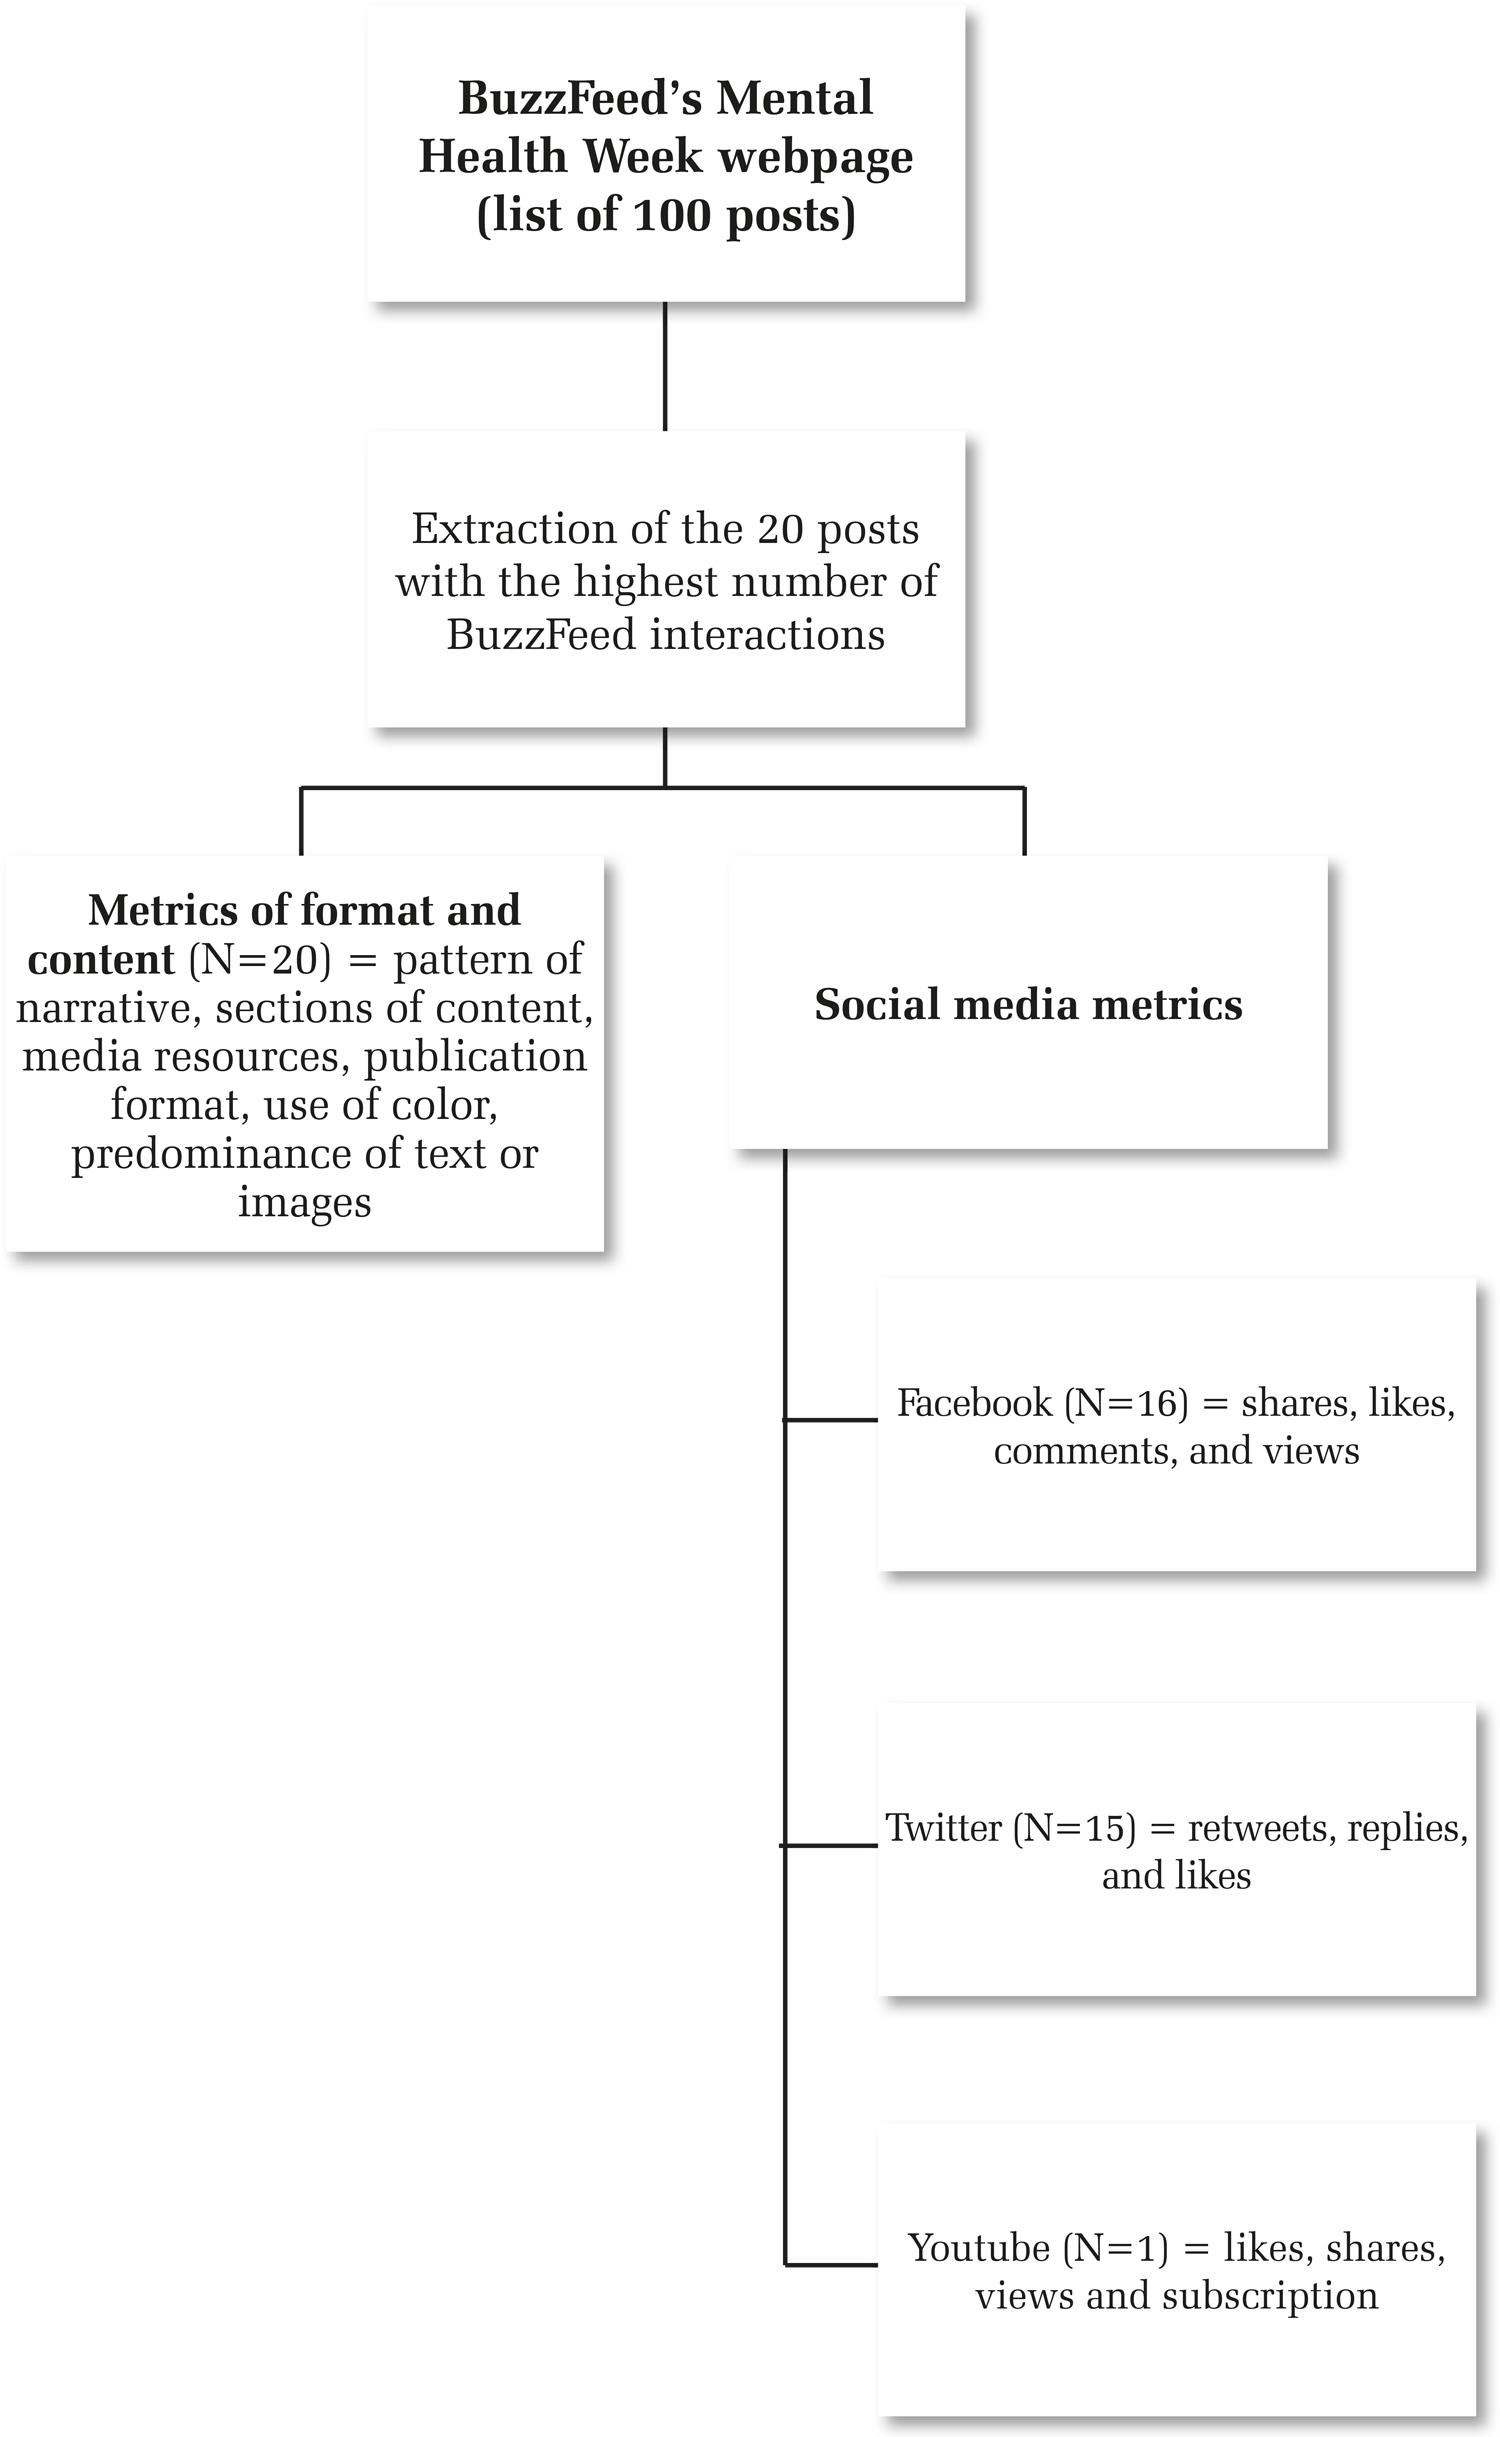
We extracted social media metrics from the 20 posts with the highest number of BuzzFeed interactions on the BFMHW website and from 41 videos available on the BFMHW playlist created by the BuzzFeed Video profile on YouTube. We analyzed the format and content used in BuzzFeed’s publishing methods as well as the following social media metrics: exposure (presence online, views and time online), influence (likes) and engagement (comments, shares, replies and BuzzFeed interactions).
Results
Analysis of the variables revealed that audience engagement is associated with the number of medias in which the content is published: views on YouTube and shares on Facebook (0.71, p<0.001), total interactions on Facebook (0.66, p<0.001) and BuzzFeed number of total interactions (0.56, p<0.001).
Conclusions
Our results suggest that videos on YouTube may be an important information channel, including activity and engagement on other medias such as Facebook. Information may be more effective in reaching the audience if it is delivered in more than one media and includes personal experiences, some humor in content and detailed information about treatment.
Mental health online; social media metrics; engagement; BuzzFeed; Mental Health Week; psychiatry
Resumo
Introdução
O número de sites com foco em conteúdo de saúde mental vem crescendo rapidamente. Considerando a necessidade crescente de acesso a informações precisas sobre tratamento em saúde mental, é importante entender a promoção dessas informações on-line.
Objetivo
Analisar as interações da Semana de Saúde Mental do BuzzFeed (BuzzFeed’s Mental Health Week – BFMHW) em seu próprio site e em plataformas de mídia social relacionadas (Facebook, Twitter e YouTube) usando métricas de entrega de informações em tópicos de saúde mental.
Métodos
Extraímos métricas de mídias sociais das 20 postagens com o maior número de interações no site da BFMHW e de 41 vídeos disponíveis na playlist da BFMHW criada pelo perfil BuzzFeed Video no YouTube. Analisamos o formato e o conteúdo usados nos métodos de publicação do BuzzFeed, bem como as seguintes métricas de mídias sociais: exposição (presença on-line, visualizações e tempo on-line), influência (curtidas) e engajamento (comentários, compartilhamentos, respostas e interações do BuzzFeed).
Resultados
A análise das variáveis revelou que o envolvimento do público está associado ao número de mídias em que o conteúdo é publicado: visualizações no YouTube e compartilhamentos no Facebook (0,71, p <0,001), interações totais no Facebook (0,66, p <0,001) e número de interações totais no BuzzFeed (0,56, p <0,001).
Conclusões
Nossos resultados sugerem que o YouTube pode ser um importante canal de informações, incluindo atividades e envolvimento em outras mídias, como o Facebook. As informações podem alcançar o público de forma mais eficaz se forem exibidas em mais de uma mídia e incluírem experiências pessoais, algum humor no conteúdo e informações detalhadas sobre o tratamento.
Saúde mental on-line; métricas de mídia social; engajamento; BuzzFeed; Semana de Saúde Mental; psiquiatria
Introduction
Technology has had a great impact on our daily lives, particularly on information distribution and communication processes.11. Pew Research Center. Internet seen as positive influence on education but negative influence on morality in emerging and developing nations. Washington: Pew Research Center; 2015. [cited 2017 September 13]. http://www.pewglobal.org/files/2015/03/Pew-Research-Center-Technology-Report-FINAL-March-19-20151.pdf
http://www.pewglobal.org/files/2015/03/P...
The current mode of information distribution has redesigned the way how people search for health information, and it has become an important aspect of treatment and care in mental health. Access to information may aid treatment, as many health problems and mental health disorders benefit from psychoeducational strategies.22. Colom F, Vieta E, Sánchez-Moreno J, Palomino-Otiniano R, Reinares M, Goikolea JM, et al. Group psychoeducation for stabilised bipolar disorders: 5-year outcome of a randomised clinical trial. Br J Psychiatry. 2009;194:260-5.,33. Reinares M, Colom F, Rosa AR, Bonnín CM, Franco C, Solé B, et al. The impact of staging bipolar disorder on treatment outcome of family psychoeducation. J Affect Disord. 2010;123:81-6. Granting broad access to mental health content online has made it possible for people to access information and support 24/7.
While there is a vast amount of accurate mental health information available online and a growing number of websites focused on mental health content,44. Reavley NJ, Jorm AF. Recognition of mental disorders and beliefs about treatment and outcome: findings from an Australian national survey of mental health literacy and stigma. Aust N Z J Psychiatry. 2011;45:947-56. stigma is still common and is aggravated by false, inaccurate data that spreads over social networks.55. Mackey TK, Schoenfeld VJ. Going “social” to access experimental and potentially life-saving treatment: an assessment of the policy and online patient advocacy environment for expanded access. BMC Med. 2016;14:17. Therefore, the pattern of online information distribution may either influence treatment positively, or it may delay adequate treatment and adherence by fostering stigma and suggesting ineffective or inaccurate treatment options.
By taking advantage of the most effective online strategies used to disseminate adequate knowledge, we may be able to reduce stigma and enhance social inclusion of people with mental illness.66. Yamaguchi S, Mino Y, Uddin S. Strategies and future attempts to reduce stigmatization and increase awareness of mental health problems among young people: a narrative review of educational interventions. Psychiatry Clin Neurosci. 2011;65:405-15. Furthermore, patients with difficulties such as social anxiety, depression and introversion seem to provide an insight into their mental health status on social media.77. Cox-George C. The changing face(book) of psychiatry: can we justify “following” patients’ social media activity? BJPsych Bull. 2015;39:283-4. Thus, social media could be a useful strategy to promote engagement in treatment interventions and research,88. Crutzen R, Ruiter RA, de Vries NK. Can interest and enjoyment help to increase use of Internet-delivered interventions? Psychol Health. 2014;29:1227-44.,99. Betton V, Borschmann R, Docherty M, Coleman S, Brown M, Henderson C. The role of social media in reducing stigma and discrimination. Br J Psychiatry. 2015;206:443-4. especially when a large number of studies currently face difficulties recruiting participants.1010. Christensen H, Griffiths KM, Farrer L. Adherence in internet interventions for anxiety and depression. J Med Internet Res. 2009;11:e13.
Access to accurate information could be a starting point for patients to wish to seek and receive treatment,1111. Ziebland S, Wyke S. Health and illness in a connected world: how might sharing experiences on the Internet affect people’s health? Milbank Q. 2012;90:219-49. therefore it may be useful to study the case of a website that has received thousands of visitors talking about mental health, using content marketing and social media strategies. We chose to study BuzzFeed’s Mental Health Week (BFMHW) because it was a mental health-focused event (week) promoted by a website that has a global audience and is a pioneer in the field of social news and entertainment. BuzzFeed publishes posts across many social media platforms and covers a wide range of topics using diverse, creative posts, which often “go viral.” One of its core components is the association between informational content and marketing strategies, with a secondary focus on entertainment.1212. Tandoc Jr EC, Jenkins J. The Buzzfeedication of journalism? How traditional news organizations are talking about a new entrant to the journalistic field will surprise you! Journalism. 2015;18:482-500. In December 2015, BuzzFeed promoted the Mental Health Week.1313. BuzzFeed. Mental Health Week [website]. [cited 14 June 2017]. https://www.buzzfeed.com/mentalhealthweek
https://www.buzzfeed.com/mentalhealthwee...
Several posts were published on their website, with consistent approaches discussing mental health problems and disorders.
Marketing companies specialize in analyzing metrics and planning strategies to increase the popularity of brands and services online. Two processes focused on creating and distributing content to attract and retain audience/customers are Inbound Marketing and Content Marketing, which consist of creating and sharing content with the objective of engaging the audience, thereby building confidence.1414. Hubspot Academy. Understanding content marketing (content marketing certification – class transcript). [cited 2017 September 13]. https://cdn2.hubspot.net/hub/202647/file-43774095-pdf/docs/scribewisewhitepaper.beginnersguide.pdf
https://cdn2.hubspot.net/hub/202647/file...
The main idea behind these processes is to create viral content by sharing it via social media, managing to combine people’s needs to socialize, be informed and be entertained.1212. Tandoc Jr EC, Jenkins J. The Buzzfeedication of journalism? How traditional news organizations are talking about a new entrant to the journalistic field will surprise you! Journalism. 2015;18:482-500.
Social media metrics measure online activities in three stages: exposure, influence and engagement.1515. Kelly N. Measuring social media for brand awareness. HootSuite – Social Media Dashboard. 2011. [cited 2017 September 13]. http://static.hootsuite.com/White_Paper/WhitePaper_03_HS_FullFrontalROI_Brand_Awareness.pdf
http://static.hootsuite.com/White_Paper/...
,1616. Neiger BL, Thackeray R, Van Wagenen SA, Hanson CL, West JH, Barnes MD, et al. Use of social media in health promotion: purposes, key performance indicators, and evaluation metrics. Health Promot Pract. 2012;13:159-64. Exposure measures the reach that the media has achieved with its current efforts, using metrics such as impressions, fans, followers, visits, views, mentions and subscribers. Influence is a look at whether the metrics are positive, neutral, or negative in sentiment; commonly the variables are “likes” and its variations. Engagement, in turn, measures how many people actually did something with the message, e.g., clicks, retweets, shares, replies, direct messages, wall posts and comments.
This paper analyzes BFMHW on the BuzzFeed website and related social media platforms (Facebook, Twitter and YouTube) using metrics of information delivery in mental health topics. We also intended to identify social media marketing strategies that may reveal important factors in effective online engagement, potentially paving the road for future online mental health interventions.
Methods
Ethics
This study was approved by the Research Ethics Committee of Hospital de Clínicas de Porto Alegre and Universidade Federal do Rio Grande do Sul.
BFMHW on the BuzzFeed website
Based on the strategies most commonly used by content media to verify the impact of publications, we extracted social media metrics from the BFMHW website1313. BuzzFeed. Mental Health Week [website]. [cited 14 June 2017]. https://www.buzzfeed.com/mentalhealthweek
https://www.buzzfeed.com/mentalhealthwee...
on February 15th, 2017. On that date, the website had 100 updated publications related to the topic, ordered by number of BuzzFeed interactions (total number of likes, comments and shares on the BuzzFeed website), from highest to lowest. We extracted the title and total number of BuzzFeed interactions of each of the 100 posts. Then, the 20 publications with the highest number of BuzzFeed interactions were selected for a more detailed evaluation.1717. BuzzFeed. Mental Health Week [website]. [cited 14 June 2017]. http://bzfd.it/2saaReg
http://bzfd.it/2saaReg...
These 20 posts were manually extracted from the BuzzFeed website, descriptive metrics were collected and we searched for the posts on Facebook, Twitter and YouTube to identify which ones had been shared.
The following metrics were extracted from the 20 selected posts in each social media platform: a) Facebook: shares, likes, comments and views; b) Twitter: retweets, replies and likes; c) YouTube: likes, shares, views and subscriptions (number of new subscribers gained from a particular video). We chose three social media metrics to explore, namely, exposure (presence online, views and time online), influence (likes) and engagement (comments, shares, replies and BuzzFeed interactions) (Figure 1).
BFMHW videos on YouTube
Videos are a powerful source of information. In order to check how an entertainment video delivers mental health information, we extracted data from the 41 videos available on the BFMHW playlist created by the BuzzFeed Video profile1818. YouTube. Mental Health Week [playlist]. [cited 14 June 2017]. http://bit.ly/2rrbBi8
http://bit.ly/2rrbBi8...
(there were a total of 43, but 2 were excluded because they did not have mental health as the main topic). This part of the data collection was performed between January and April 2017. The following objective metrics were extracted from the posts on YouTube: likes, shares, views and subscription.
To check the spread of the same video through different social media platforms, we also searched Facebook and Twitter for those specific 41 posts, also between January and April 2017. The following metrics were extracted from Facebook: shares, likes, comments and views; and from Twitter: retweets, replies and likes (Figure 2).
Frequency and number of views of mental health topics in posts and videos
To assess the frequency and number of views of topics in posts and videos, we searched for 41 videos on the BFMHW YouTube page and 3 posts on the BuzzFeed website (N=44). We excluded 17 posts for the reason that there were no available numbers of views on the website.
Metrics of format and content
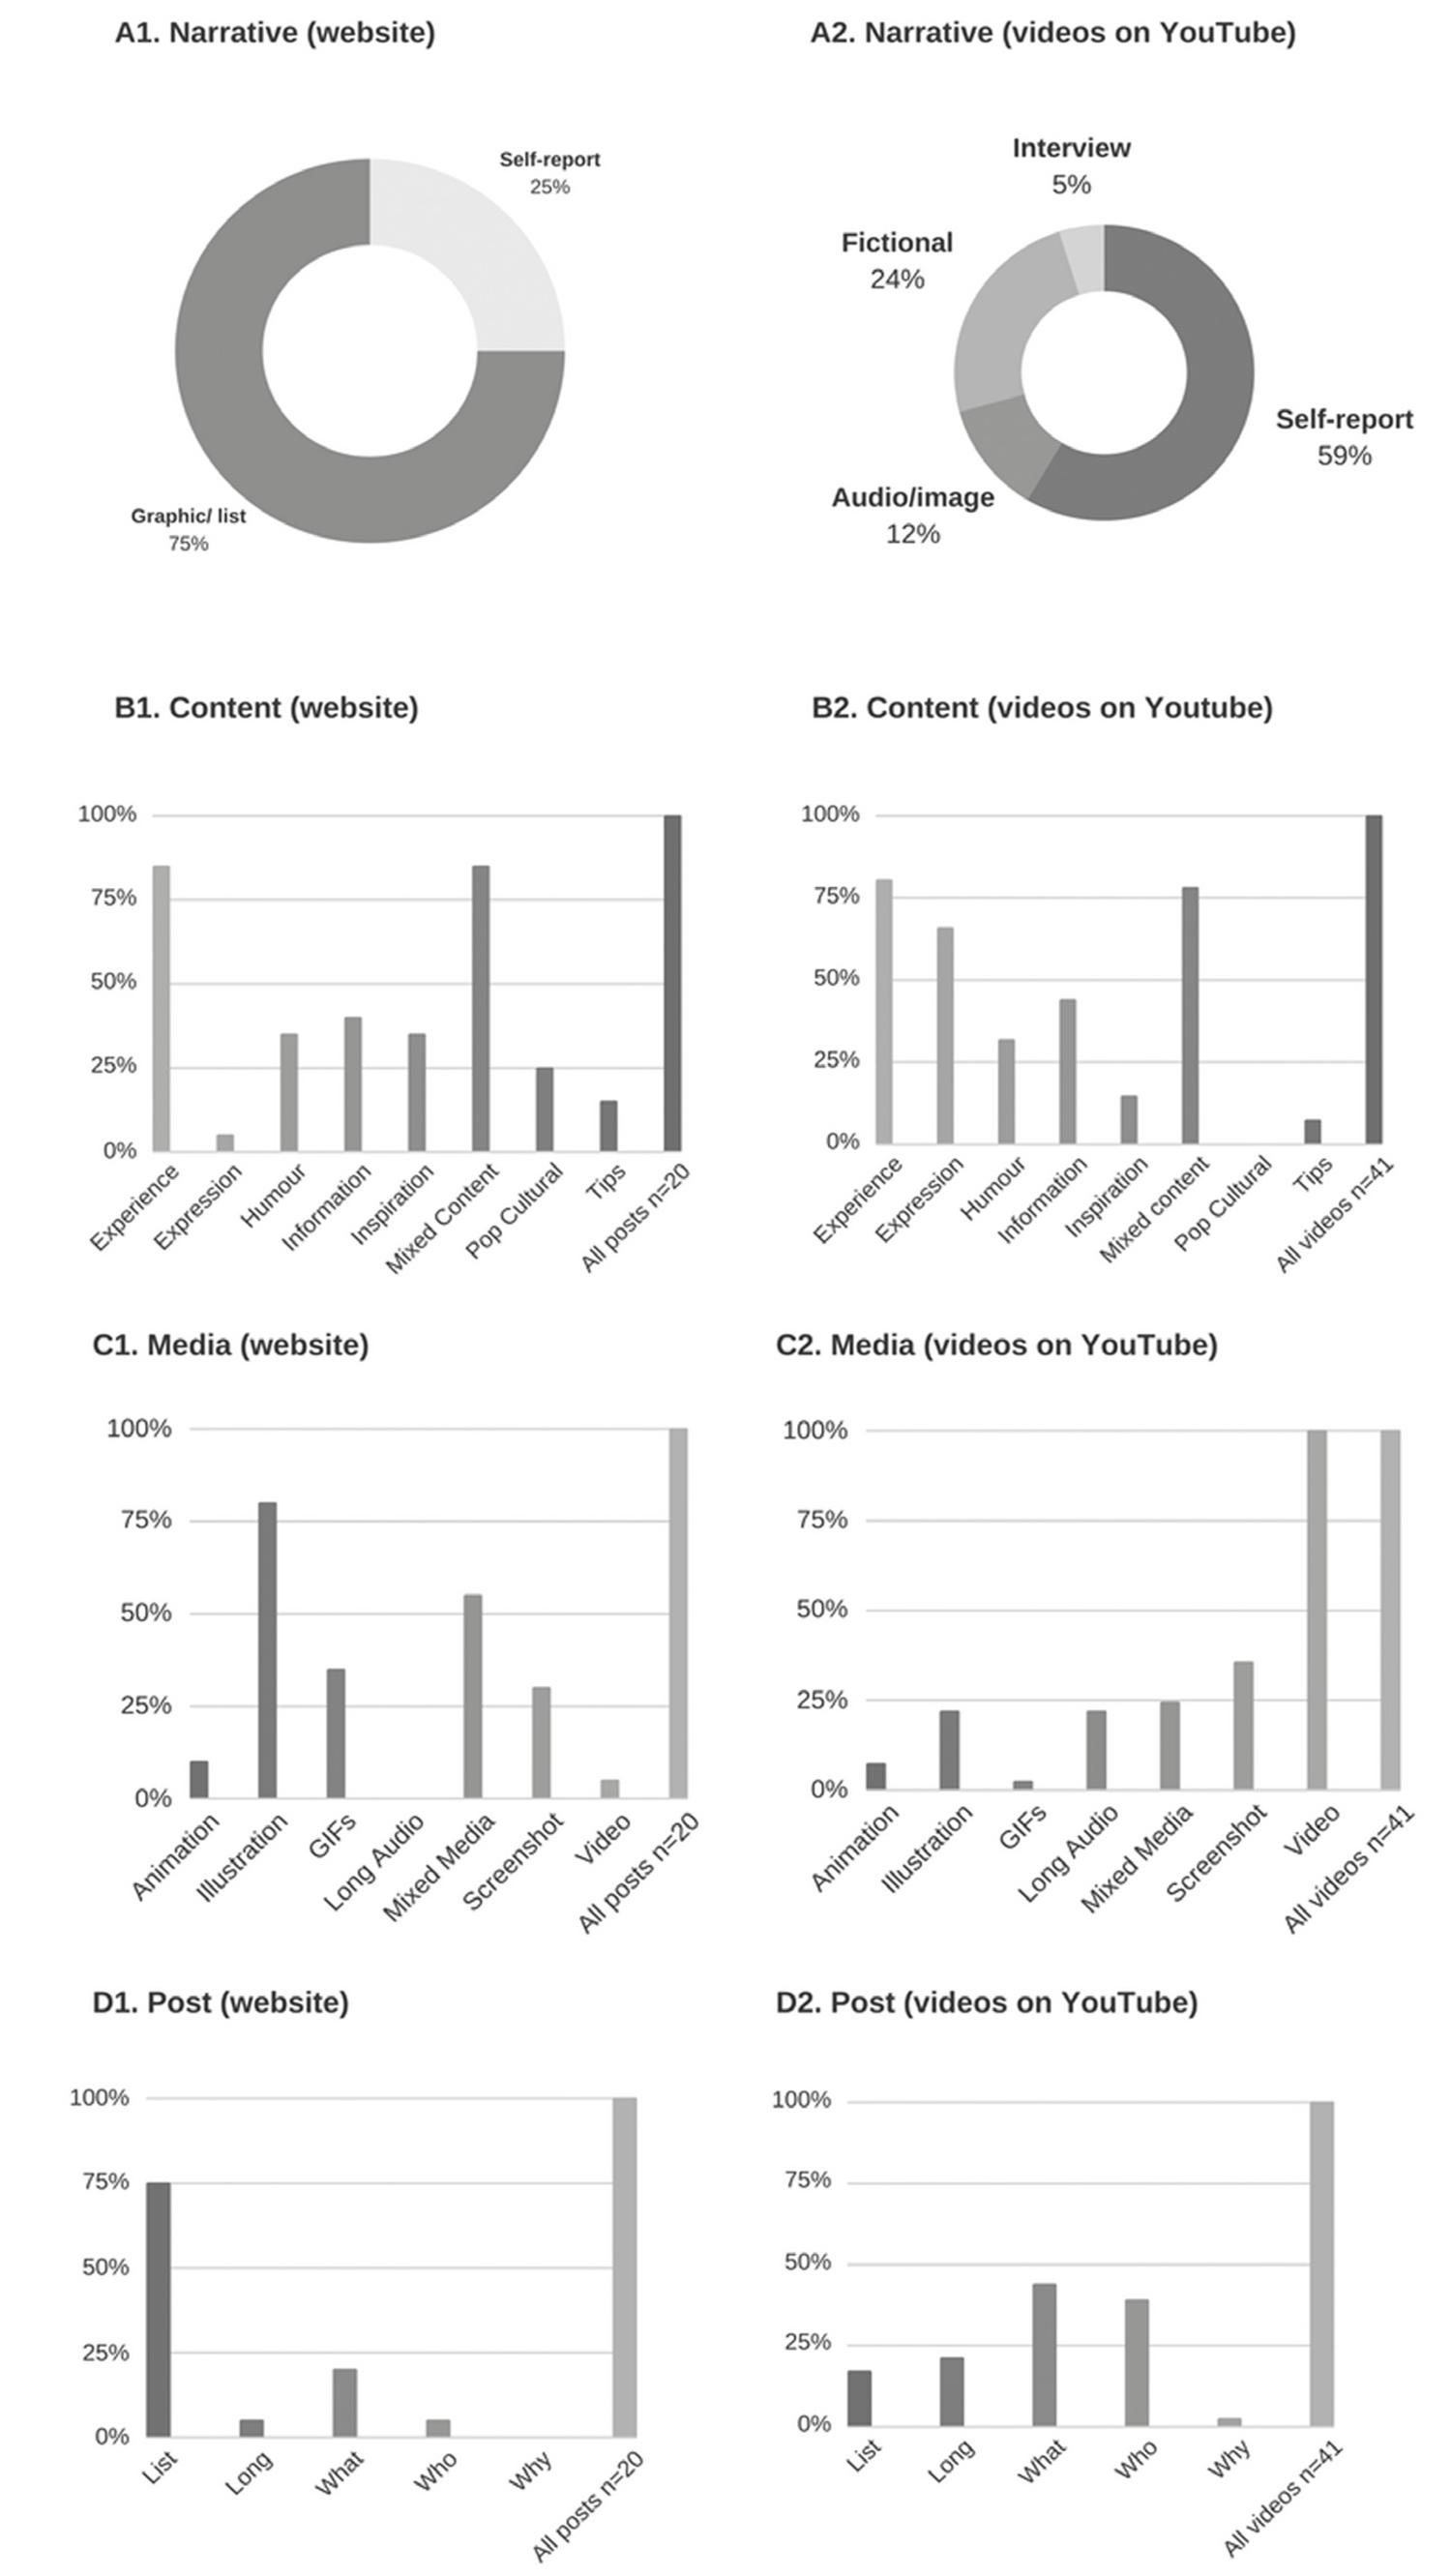
In addition to social media metrics, we considered it equally important to assess extradescriptive metrics by analyzing the format and content used in BuzzFeed’s publications. All descriptive data were extracted as follows: a single author read or watched each post or video and arbitrarily classified their content or format considering four major groups for further examination: pattern of narrative, content, media format and publication format. Within these categories, we grouped the most frequent features as follows: pattern of narrative – self-report, graph/list, fictional, audio/image and interview; content – mixed, experience, information, humor, inspiration, pop cultural elements, tips and expression; media format – illustration, mixed media, GIFs, screenshots, animations, video and long audios; publication format – what, who, long, list and why. Given the diverse nature of contents in posts and videos, we decided to examine separately BFMHW posts on its own website and videos available on the BFMHW playlist on YouTube. Therefore, we will present the results obtained for videos and posts independently, considering the relevant categories in each case.
To assess pattern of narrative, we checked if the main story was a self-report or a graph/list. Videos were classified as either self-report/own experience or fiction (produced as a series). We further checked if the videos used only audio and self-image or if they had an interview format with a third person. To evaluate a variety of components of content, we examined the content of website posts and of YouTube videos based on the features described above. Media format was classified as animations, illustrations, GIFs, screenshots (images of self-reports online, comments and posts) or all mixed; in videos, we examined all the above plus long speeches (audio) on the topic. Finally, we assessed publication format and classified it as a list (a series of short statements generally numbered and/or written in list format), “what” (if the main idea was something being explained descriptively), “who” (if there was a main character/persona), “why” (something being explained and justified – i.e., more analytic text with reasons included) and length (long texts or only a few images with short statements). The use of color was also rated (colored, white, or dark), as was whether it was a text or an image post.
Data analysis
The variables were analyzed using the Shapiro-Wilk normality test. All non-parametric data were expressed as medians (interquartile range) and parametric data as means (standard deviation). Subsequently, exploratory analysis of the relationship between variables was examined using Pearson and Spearman correlation coefficients. Analyses were performed using the Statistical Package for the Social Sciences (SPSS) version 19.0 for Windows, Microsoft Excel and R. All variables studied were free to access on the respective websites. Significance was set at p<0.05. We used Bonferroni correction for multiple comparisons.
Results
General metrics
We analyzed the content, format and social media metrics of 20 posts and 41 videos related to BFMHW. By analyzing the materials on the BuzzFeed website, we found that the single video shared on YouTube reached 1,399 subscribers. In contrast, analysis of the 41 videos collected directly from YouTube revealed a median number of subscriptions as low as 61 (Table 1).
The 20 posts were shared on the BuzzFeed website as well as on Facebook (16), Twitter (15) and YouTube (1) (Table 1, item a). The 41 videos on the YouTube playlist were shared on Facebook (40), the BuzzFeed website (39) and Twitter (23) (Table 1, item b).
Analyzing the materials from the BuzzFeed website, we found that the single video shared on YouTube reached 1,399 subscribers. In contrast, analysis of the 41 videos collected directly from YouTube revealed a median number of subscriptions as low as 61.
Median time online (posts’ exposure online) was 461 days on BuzzFeed’s website and 458 days on YouTube; Facebook and Twitter showed 459.5 and 459 days, respectively. Similarly, the playlist on YouTube showed a median time online of 476 days on Twitter, followed by 474.5 on Facebook, 463 on BuzzFeed and 461 days on YouTube. Videos from the playlist on YouTube had a mean duration of 198 seconds (Table 1, item b).
Frequency and number of views of mental health topics in posts and videos
At first, we checked the frequency of topics, and treatment was the one most frequently found, accounting for 31.82% of the items (14 posts and videos – 7 about therapy and 7 about coping). The number of views of treatment-related posts corresponded to 35.59% of the total of views of 14 videos/posts.
Two groups came second in rank for topic frequency, namely anxiety disorder and suicide (15.91% of the topics each); anxiety disorder included 4 videos about anxiety and 3 about post-traumatic stress disorder (PTSD); suicide had a total of 7 videos and posts. However, differently from frequency, the number of views of posts/videos on anxiety disorder (16.46%) and suicide (23.14%) revealed different interests of the audience. Depression (frequency of 11.37% of videos available and 7.57% of number of views) had a total of 5 videos, including depression (4 videos) and self-harm (1 video). Also with 11.37% of topic frequency, stigma had a total of 5 videos, while its number of views corresponded to 4.94% of the total number of accesses. Topics focusing on attention-deficit/hyperactivity disorder (ADHD) accounted for 9.1% of the frequency, with 4 videos. Likewise, the number of views in this group accounted for 9.74% of accesses. Finally, 2 videos (frequency of 4.55% of videos available and 2.56% of total number of views) were included in the addiction category: 1 about addiction and 1 about eating disorder (Figure 3).
Comparison of frequency and views of posts from BuzzFeed’s Mental Health Week (BFMHW) website and videos from the BFMHW YouTube webpage. A. Topic frequency in 3 posts from the BFMHW website and 41 videos from the BFMHW YouTube webpage: a. Treatment 31.82%, total of 14 videos/posts, grouped as therapy (2 posts and 5 videos) and coping (7 videos); b. Anxiety disorder 15.91%, total of 7 videos, grouped as anxiety (3 videos) and post-traumatic stress disorder (PTSD) (4 videos); c. Suicide 15.91%, total of 7 videos/posts (6 videos and 1 post); d. Depression 11.37%, total of 5 videos, grouped as depression (4 videos) and self-harm (1 video); e. Stigma 11.37%, total of 5 videos; f. ADHD 9.1%, total of 4 videos; g. Addiction 4.55%, total of 2 videos, grouped as eating disorder (1 video) and addiction (1 video). B. Views of 3 posts from the BFMHW website and 41 videos from the BFMHW YouTube page: a. Treatment 35.59% (15’237’333 views), total views of 14 videos/posts, grouped as 5 videos about therapy (8’506’635), 1 post also about therapy (1’969’572) and 7 videos about coping (4’761’126); b. Anxiety disorder 16.46% (7’042’139 views), total views of 7 videos, grouped as 3 about anxiety (2’043’339) and 4 about PTSD (4’998’800); c. Suicide 23.14% (9’900’950 views), total views of 6 videos (8’827’307) and 1 post (1’073’643); d. Depression 7.57% (3’238’649 views), total views of 5 videos, grouped as 4 about depression (2’029’168) and 1 about self-harm (1’209’481); e. Stigma 4.94% (2’111’542 views), total views of 5 videos (4’168’390); f. ADHD 9.74% (4’168’390 views), total views of 4 videos; g. Addiction 2.56% (1’094’963 views), total views of 2 videos, grouped as eating disorder (711’287) and addiction (383’676).
Metrics of format and content
Format and content were evaluated with descriptive elements and are expressed here as percentages considering the 20 posts extracted from the BFMHW website and the 41 videos available at the BFMHW playlist on YouTube.
Pattern of narrative
Of the website posts, 75% used graphs/lists as the pattern of narrative and only 25% used self-reports/experience as main stories. Among the videos, an array of different narrative elements were found, with the majority featuring self-reports/experience (58%). Of these, 75% were real-life self-reports and the remaining 25% were interpreted by actors from the BuzzFeed team. Fictional stories accounted for 24% of the videos; of these, 60% were short interpretations and 40% were web series. We also found that 12% of the videos used audio/images; only 5% were interviews (graphs A1 and A2 in Figure 4).
Metrics of format and content in BuzzFeed’s Mental Health Week (BFMHW) posts and videos. 1) Analysis of 20 posts from the BFMHW website: A1. Patterns of narrative: self-report/experience (25%), graph/list (75%); B1. Content: mixed (85%), experience (85%), information (40%), humor (35%), inspiration (35%), pop cultural elements (25%), tips (15%), expression (5%); C1. Media format: illustration (80%), mixed media (55%), GIFs (35%), screenshots (30%), animations (10%), video (5%); D1. Publication format: list (75%), what (20%), long (5%), who (5%). 2) Analysis of 41 videos from the BFMHW playlist on YouTube: A2. Patterns of narrative: self-report/experience (58.53%), fictional (24.39%), audio/image (12.19%), interview (4.88%); B2. Content: experience (80.49%), mixed (78.05%), expression (65.85%), information (43.9%), humor (31.7%), inspiration (14.63%), tips (7.32); C2. Media format: screenshots (35.61%), mixed media (24.39%), long audios (21.95%), illustrations (21.95%), animations (7.32%), GIF (2.44%); D2. Publication format: what (43.9%), who (39.02%), long (21.20%), list (17.07%), why (2.44%).
Content
In the analysis of content, experience and mixed content were the most common categories, accounting for 85% of the website posts. Among the YouTube videos, the experience category was identified in 81% and mixed content in 78% (graphs B1 and B2 in Figure 4). BuzzFeed’s website posts also had information as content in 40%, humor and inspiration in 35% and pop cultural elements in 25%. Tips and expression were the least common types of content found, accounting for only 15% of the videos and 5% of the posts, respectively. We observed that information, humor and tips showed similar trends in both posts and videos, as opposed to expression and inspiration, which demonstrated contrary trends.
Media format
Media resource evaluation revealed that most website posts used illustrations (80%), whereas most YouTube videos used screenshots (75%), i.e., images of self-reports online. These trends tended to be opposite in website posts vs. YouTube videos, i.e., while illustrations ranked first among website posts, they were 4th among YouTube videos (21%) and while screenshots ranked first among videos, they appeared in 4th for posts (30%). Mixed media (use of more than one kind of media resource in the same post/video), in turn, ranked second in both posts (55%) and videos (24%). We found that website posts used GIFs in 35% of cases; among the videos, long audios accounted for a slightly smaller number (22%). Also, there was no contrasted presence of color in 59% of the videos from BuzzFeed’s playlist on YouTube. The least common media resources were animations (10%) and videos (5%) among BuzzFeed’s website posts and again animations (7%) and GIFs (2%) in the YouTube videos (graphs C1 and C2 in Figure 4).
Publication format
In this analysis, we found that 75% of the website posts used lists as their main element, in contrast with YouTube videos, where lists accounted for a much lower percentage (17%). Videos also tended to show the “what” format, with 44%, compared to 20% of the posts. The “who” approach ranked second in videos (39%) and last in website posts (5%). Long text format was found in only 5% of the posts and long audios in 21% of the videos. Finally, the “why” format was present in only 2% of the videos (graphs D1 and D2 in Figure 4). According to these data, 73% of the YouTube videos used a persona/character.
Social media metrics
Exposure
Some exposure variables were presented above (time online and objective metrics of format and content).
Views. When we looked at posts from the BFMHW website, only 3 had publicly available data, with a median of 1,073,643 views (posts); the single post that was shared on YouTube had 3,892,643 views (Table 2). The Facebook sample of videos available on the BFMHW playlist on YouTube was slightly smaller (Facebook had 36 videos and YouTube 40) than the original full sample of 41 videos on YouTube. Despite this difference, the median rates of views for the videos were slightly larger on Facebook (36 videos), with 780,945, vs. 634,038 on YouTube (41 videos) (Table 3).
Presence. We determined which posts and videos extracted from both the BFMHW website and the BFMHW playlist on YouTube were also found in other social media platforms. Videos were more likely to be found in different social media sites (54%, 22 of 41 videos were found at all social media sites studied), while website posts had only 5% of the sample with this broad distribution (1 of 20 posts). Further, 42% of the videos (17 of 41) were present on two social media sites, compared to 65% of website posts (13 of 20). Finally, 15% (3/20) of website posts were not distributed to any social media sites.
Influence
Likes. The single video available among the posts on BuzzFeed’s website that was also shared on YouTube had the highest median of 139,580 likes and favorites on YouTube, compared to 848 and 276 interactions found on Facebook and Twitter, respectively, despite the greater sample size in the two latter platforms (16 and 15 posts, respectively) (Table 2). The material extracted from the YouTube playlist showed a higher median of likes and favorites (17,786) than the items shared on Facebook (8,463) and Twitter (226) (Table 3).
Engagement
Total interactions. The posts on the BFMHW website showed a median of 229 total interactions. The single post shared on YouTube showed a much higher median, of 170,237 interactions. In addition, Facebook and Twitter showed 1,203 and 392 median interactions, respectively (Table 2). The videos extracted from YouTube, in turn, revealed a median of 20,161 total interactions and 12,773 on Facebook. However, these videos showed a much smaller median number of total interactions on Twitter and BuzzFeed, with 349 and 45, respectively (Table 3).
Shares and retweets. When we looked at posts shared on social media from the sample taken from the BFMHW website, the median number of shares and retweets was much higher on YouTube (19,178) than on Facebook (285) and Twitter (112) (Table 2). However, when we looked at the sample of videos from the BFMHW playlist on YouTube, the median of shares and retweets was higher on Facebook (4,510) than on YouTube (1,203). Finally, Twitter showed the lowest number of interactions (92) (Table 3).
Comments, replies and BuzzFeed interactions. Regarding comments, replies and BuzzFeed interactions in the sample of posts on the BFMHW website, a median of 9,687 actions was found on YouTube, vs. 40.5 on Facebook and only 2 on Twitter (Table 2). Once again, YouTube had a much higher median number of comments and replies on the BFMHW YouTube playlist (1,536). Facebook had a median of 449.5 actions, and Twitter, only 2 replies (Table 3).
Pearson and Spearman correlations
Analysis of the relationship between variables revealed a correlation between views on YouTube and total interactions on Facebook (0.66, p<0.001), shares on Facebook (0.71, p<0.001), BuzzFeed interactions (0.56, p<0.001) and total interactions on YouTube (0.75, p<0.001). There was no correlation between views on YouTube and time online on YouTube (0.09, p=0.568). Also, there were no significant correlations among any of the following variables on Facebook: time online, likes, comments, views; on YouTube: views, shares, likes and total number of likes, comments, subscriptions; on BuzzFeed: time online; or on Twitter: time online, shares, likes, replies, retweets, total number of interactions. We used Bonferroni correction for multiple comparisons; therefore we used a significance level of 0.002.
Discussion
This study was conducted to analyze online interactions on the BFMHW website and related social media platforms (Facebook, Twitter and YouTube) using metrics of information delivery in mental health topics. The analysis revealed important data about the promotion of mental health online.
In this study, Twitter showed lower engagement rates when compared to Facebook, YouTube and website, which would be expected if we consider the global lower activity rates on Twitter in general.1919. Statista. Worldwide revenue of Twitter from 2010 to 2017 (in million U.S. dollars) [website]. [cited 14 June 2017]. https://www.statista.com/statistics/204211/worldwide-twitter-revenue/
https://www.statista.com/statistics/2042...
Also, our results suggest that videos on YouTube may be an important information channel, as they showed the strongest association with engagement variables (shares, interactions, BuzzFeed interactions), including activity and engagement on other medias such as Facebook and website. The results also showed that audience engagement is associated with the number of medias in which the content is published, rather than with time available online. Indeed, videos shared also on Facebook were viewed more frequently than those distributed via YouTube only. This finding supports the authors’ hypothesis that videos are an important information channel, particularly when associated with broad content distribution.
We could explore, in future studies, if a greater amount of detailed information available online about types of treatment and their availability would enhance earlier help-seeking and reduce stigma about the treatment itself, instead of focusing only on diagnosis and symptoms. We could hypothesize that patients may recognize that they are not well, even though they may not be able to name their condition. However, if they are not afraid of treatment and if they know what to expect and how treatment works in detail, they may be more likely to seek help. In agreement with that, our results showed that the most popular video was a comedy about fear of treatment.2020. YouTube. The Try Guys try therapy [Internet]. The Try Guys S05 E03. BuzzFeed Video. [cited 2015 Dec 13]. https://www.youtube.com/watch?v=ystGdduzG64&list=PL5vtqDuUM1DltRct7SkzxdQa2ZQC0EEFh&index=1
https://www.youtube.com/watch?v=ystGdduz...
Of 44 posts and videos, the majority addressed treatment, followed by anxiety disorder and suicide. When analyzed according to number of views, the 44 posts and videos were about treatment, suicide and anxiety. The content of the 44 videos and posts was similar to the distribution of the audience’s interest, assessed by number of views. In this sense, the high rates of interest in suicide and treatment are noteworthy. Among the contents examined, it seems that suicide information may be slightly falling behind audience demand.
Given the link between the use of technology and the accessibility of information, the case study examined in this article may contribute to future development of online mental health interventions and initiatives. We chose the case of BFMHW based on its characteristics as a well-known, successful, highly accessed online initiative. From the metrics analyzed in the BFMHW website, our results suggest that the higher the number of social media websites in which a post is shared, the higher the rates of visualization. The present results should be interpreted in light of the fact that we chose a website with adequate content about mental health. In this sense, it is important to highlight that evaluating how intrinsic content quality influences metrics was not within the scope of this study – rather, our aim was to analyze the pattern of information distribution online. We can say that, in this specific case of appropriate content, exposure was correlated with engagement; whether the same would occur with posts with low-quality content remains unknown. Nevertheless, among social media metrics, engagement rates could be used as a measure of the effective delivery of key messages, as it takes into account the person’s actions as a measure of actual contact with the online content.2121. Kelly L, Jenkinson C, Ziebland S. Measuring the effects of online health information for patients: item generation for an e-health impact questionnaire. Patient Educ Couns. 2013;93:433-8. In this sense, we suggest that mental health initiatives online should consider video format and publication in more than one media channel.
Despite the comprehensive quantitative data collected on social media metrics, we could not qualitatively examine the format and content of the posts and videos related to BFMHW. Rather, we created a categorical analysis with descriptive data of format and content metrics. We conducted this exploratory categorical analysis of the content of posts and videos in order to describe the sample rather than draw conclusions about the posts’ contents. Despite sample size limitations (20 posts and 41 videos), format and content analysis revealed some interesting trends. Of the posts collected from BuzzFeed’s website, it is interesting to note that there were specific materials for each media, i.e., lists in 75% and illustrations in 80% of the website posts and screenshots in 76% of the videos. Videos included most frequently a sequence of screenshots of people’s opinions and self-report narrative. In content analysis, a similar trend was observed in using people’s own experience (81% of videos and 85% of posts) and mixed types of content (85% of posts and 78% of videos) – these were the most prevalent content elements. Being aware of these characteristics of format and content could help mental health professionals produce better content focused on larger online audiences. Karasouli & Adams,2222. Karasouli E, Adams A. Assessing the evidence for e-resources for mental health self-management: a systematic literature review. JMIR Ment Health. 2014;1:e3. for example, suggest that the development of effective mental health self-management e-resources have the potential to become a widely effective intervention in mental health.
This study has sample limitations (size and singular nature) and therefore should be considered exploratory with regard to format and content findings. However, with a larger sample of social media metrics, analyses with two groups could be run to check which metrics of format and content are more likely to influence engagement metrics, for example. Further studies are necessary to check if the parameters we used for ‘engagement’ online (activity associated with content) will ultimately translate into attitudes offline, such as effective help-seeking and treatment adherence.
This paper identified social media marketing strategies that could be used to promote mental health and reduce the stigma in future online interventions. The case study of the successful BFMHW initiative suggests that information may be more effective in reaching the audience if delivered in video format, if shared in more than one media, if it includes personal experience and some humor in content and more detailed information about types and format of treatment. To the best of our knowledge, this is the first article to analyze BFMHW content collecting material from its own webpage and also from social media. The study of this case can shed some light on successful strategies when using online methods to engage people in online interventions and help expand the literature on the promotion of mental health online.
Acknowledgements
This work was supported by Fundo de Incentivo a Pesquisa e Eventos – Hospital de Clínicas de Porto Alegre (FIPE-HCPA) and by the National Science and Technology Institute for Translational Medicine, with the financial support of Coordenação de Aperfeiçoamento de Pessoal de Nível Superior (CAPES) and Conselho Nacional de Desenvolvimento Científico e Tecnológico (CNPq). The funders had no role in study design, data collection and analysis, decision to publish, or in manuscript preparation.
Michael Berk has received grants from the Stanley Medical Research Foundation, MBF, National Health and Medical Research Council (NHMRC; Senior Principal Research Fellowship grant no. 1059660), Cooperative Research Centre, Cancer Council of Victoria, Simons Autism Foundation, Rotary Health, Meat and Livestock Board, Woolworths, BeyondBlue, and Geelong Medical Research Foundation. Marcia Kauer-Sant’Anna has received grants and/or personal fees from Stanley Medical Research Institute, CNPq (Produtividade em Pesquisa), CAPES, and FIPE-HCPA.
References
-
1Pew Research Center. Internet seen as positive influence on education but negative influence on morality in emerging and developing nations. Washington: Pew Research Center; 2015. [cited 2017 September 13]. http://www.pewglobal.org/files/2015/03/Pew-Research-Center-Technology-Report-FINAL-March-19-20151.pdf
» http://www.pewglobal.org/files/2015/03/Pew-Research-Center-Technology-Report-FINAL-March-19-20151.pdf -
2Colom F, Vieta E, Sánchez-Moreno J, Palomino-Otiniano R, Reinares M, Goikolea JM, et al. Group psychoeducation for stabilised bipolar disorders: 5-year outcome of a randomised clinical trial. Br J Psychiatry. 2009;194:260-5.
-
3Reinares M, Colom F, Rosa AR, Bonnín CM, Franco C, Solé B, et al. The impact of staging bipolar disorder on treatment outcome of family psychoeducation. J Affect Disord. 2010;123:81-6.
-
4Reavley NJ, Jorm AF. Recognition of mental disorders and beliefs about treatment and outcome: findings from an Australian national survey of mental health literacy and stigma. Aust N Z J Psychiatry. 2011;45:947-56.
-
5Mackey TK, Schoenfeld VJ. Going “social” to access experimental and potentially life-saving treatment: an assessment of the policy and online patient advocacy environment for expanded access. BMC Med. 2016;14:17.
-
6Yamaguchi S, Mino Y, Uddin S. Strategies and future attempts to reduce stigmatization and increase awareness of mental health problems among young people: a narrative review of educational interventions. Psychiatry Clin Neurosci. 2011;65:405-15.
-
7Cox-George C. The changing face(book) of psychiatry: can we justify “following” patients’ social media activity? BJPsych Bull. 2015;39:283-4.
-
8Crutzen R, Ruiter RA, de Vries NK. Can interest and enjoyment help to increase use of Internet-delivered interventions? Psychol Health. 2014;29:1227-44.
-
9Betton V, Borschmann R, Docherty M, Coleman S, Brown M, Henderson C. The role of social media in reducing stigma and discrimination. Br J Psychiatry. 2015;206:443-4.
-
10Christensen H, Griffiths KM, Farrer L. Adherence in internet interventions for anxiety and depression. J Med Internet Res. 2009;11:e13.
-
11Ziebland S, Wyke S. Health and illness in a connected world: how might sharing experiences on the Internet affect people’s health? Milbank Q. 2012;90:219-49.
-
12Tandoc Jr EC, Jenkins J. The Buzzfeedication of journalism? How traditional news organizations are talking about a new entrant to the journalistic field will surprise you! Journalism. 2015;18:482-500.
-
13BuzzFeed. Mental Health Week [website]. [cited 14 June 2017]. https://www.buzzfeed.com/mentalhealthweek
» https://www.buzzfeed.com/mentalhealthweek -
14Hubspot Academy. Understanding content marketing (content marketing certification – class transcript). [cited 2017 September 13]. https://cdn2.hubspot.net/hub/202647/file-43774095-pdf/docs/scribewisewhitepaper.beginnersguide.pdf
» https://cdn2.hubspot.net/hub/202647/file-43774095-pdf/docs/scribewisewhitepaper.beginnersguide.pdf -
15Kelly N. Measuring social media for brand awareness. HootSuite – Social Media Dashboard. 2011. [cited 2017 September 13]. http://static.hootsuite.com/White_Paper/WhitePaper_03_HS_FullFrontalROI_Brand_Awareness.pdf
» http://static.hootsuite.com/White_Paper/WhitePaper_03_HS_FullFrontalROI_Brand_Awareness.pdf -
16Neiger BL, Thackeray R, Van Wagenen SA, Hanson CL, West JH, Barnes MD, et al. Use of social media in health promotion: purposes, key performance indicators, and evaluation metrics. Health Promot Pract. 2012;13:159-64.
-
17BuzzFeed. Mental Health Week [website]. [cited 14 June 2017]. http://bzfd.it/2saaReg
» http://bzfd.it/2saaReg -
18YouTube. Mental Health Week [playlist]. [cited 14 June 2017]. http://bit.ly/2rrbBi8
» http://bit.ly/2rrbBi8 -
19Statista. Worldwide revenue of Twitter from 2010 to 2017 (in million U.S. dollars) [website]. [cited 14 June 2017]. https://www.statista.com/statistics/204211/worldwide-twitter-revenue/
» https://www.statista.com/statistics/204211/worldwide-twitter-revenue/ -
20YouTube. The Try Guys try therapy [Internet]. The Try Guys S05 E03. BuzzFeed Video. [cited 2015 Dec 13]. https://www.youtube.com/watch?v=ystGdduzG64&list=PL5vtqDuUM1DltRct7SkzxdQa2ZQC0EEFh&index=1
» https://www.youtube.com/watch?v=ystGdduzG64&list=PL5vtqDuUM1DltRct7SkzxdQa2ZQC0EEFh&index=1 -
21Kelly L, Jenkinson C, Ziebland S. Measuring the effects of online health information for patients: item generation for an e-health impact questionnaire. Patient Educ Couns. 2013;93:433-8.
-
22Karasouli E, Adams A. Assessing the evidence for e-resources for mental health self-management: a systematic literature review. JMIR Ment Health. 2014;1:e3.
Publication Dates
-
Publication in this collection
23 Aug 2018 -
Date of issue
Oct-Dec 2018
History
-
Received
14 Mar 2018 -
Accepted
12 Apr 2018