
Abstract
This paper presents the results of an interlaboratory study of the rheological properties of cement paste and ultrasound gel as reference substance. The goal was to quantify the comparability and reproducibility of measurements of the Bingham parameters yield stress and plastic viscosity when measured on one specific paste composition and one particular ultrasound gel in different laboratories using different rheometers and measurement geometries. The procedures for both in preparing the cement paste and carrying out the rheological measurements on cement paste and ultrasound gel were carefully defined for all of the study’s participants. Different conversion schemes for comparing the results obtained with the different measurement setups are presented here and critically discussed. The procedure proposed in this paper ensured a reasonable comparability of the results with a coefficient of variation for the yield stress of 27% and for the plastic viscosity of 24%, despite the individual measurement series’ having been performed in different labs with different rheometers and measurement geometries.
1 Introduction
Control of the rheological properties of cement-based materials is important in modern concrete technology, especially with regard to ensuring trouble-free processing of concrete at various stages of construction and, eventually, the high quality of concrete structures. Thus, it should be given the same priority as that observed in the attaining of hardened material properties according to established specifications [1]. In the last decades, several studies have focused on the quantification of the fresh material properties of flowable concrete using highly sophisticated tools based on scientific, rheological approaches [2,3,4,5,6]. However, measuring and interpreting the flow behaviour of cementitious systems is subject to a variety of pitfalls, for example, due to sedimentation and particle migration [6]. In addition, the particle size used in industrial concrete requires powerful rheometers (i.e. tools with high torque capacity) and large setups that deviate from established measurement geometries, often violating approved geometrically boundary conditions such as gap width [7,8,9]. Commonly used measurement geometries are cylinder containers, often with serrated walls, and cylinder-, paddle- or vane-shaped rotors [10]. In nearly all cases the shear plane remains undefined and the shear gradient is unknown with respect to the gap width. Therefore, the derivation of specific shear stress or shear rate is not straightforward [4].
In addition to the rheometer setup, concrete materials themselves come with a variety of challenges due to the high geometrical and chemical complexity of the system [11]. Additionally, the rheological properties of cementitious systems depend pronouncedly on their shear history, i.e. on reversible and irreversible changes in their microstructure and liquid phase distribution [12]. Furthermore, only seconds after the addition of water, the instantaneous chemical reactivity of hydraulic mineral binders leads to changes in the particle morphology, in the partial dissolution of cement particles, in the formation of new nanoscale particles, and to severe alterations in the chemistry of the liquid phase [10, 13]. Moreover, the presence of polymers such as superplasticizers and stabilising agents, which interact with the early hydration products, adds to the complexity [14].
The phenomena mentioned are only a few important aspects which cause erroneous measurements and misinterpretations in rheological experiments. An extended overview of the available techniques, their capabilities and limitations can be found in [5, 15]. This multitude of challenges has led to the development of a large number of different measurement setups in the following named geometries, some of which are employed in current interdisciplinary research within the Priority Programme SPP 2005 “Opus Fluidum Futurum—Rheology of reactive, multiscale, multiphase construction materials”, funded by the German Research Foundation (Deutsche Forschungsgemeinschaft, DFG).
It is well known that different rheometers and measurement geometries can deliver device-specific results. This was previously demonstrated by testing campaigns held in 2000 [16] and 2018 [17]. The goal of the present interlaboratory study was to investigate possibilities of harmonising such results. For this purpose, measurements with well defined, Newtonian and non-Newtonian reference substances were carried out using various rheometers and measurement geometries in different laboratories. The investigated materials consisted of three Newtonian liquids (silicon oils) and two non-Newtonian liquids (ultrasound gel and a cement paste of specified composition). This articles reports the results obtained for the non-Newtonian liquids only. To investigate reproducibility, each substance was tested four times. For the reasons previously mentioned, the measurements performed on the cement paste were mainly conducted with relative measurement devices, accompanied by selected experiments with absolute measuring devices. Here, a relative device or measurement geometry is meant when a direct conversion of torque and rotational speed to shear stress \(\tau\) and shear rate \(\dot{\gamma }\) are not readily possible, as the geometry lacks either a defined shear plane and/or the shear rate distribution in the material is unknown. In contrast, measurements on the ultrasound gel were carried out using both the measurement devices used for cement paste measurements as well as a cone-plate measurement device in order to derive their rheological properties as accurately as possible. The cone-plate measurement geometry, in the following termed absolute measurement, exhibits a well defined shear plane and shear rate distribution in the gap. Each relative measurement result could thus be referenced to an absolute measurement result, i.e., cone-plate measurement, of the same substance, so allowing the derivation of conversion schemes and thus making a statistic comparison of the individual results possible.
2 Materials and methods
2.1 Investigated substances and sample preparation
The substances investigated are two non-Newtonian fluids—a cement paste and an ultrasound gel. The ultrasound gel, trade name: “Ultraschallgel”; Gello GmbH, Germany, is a product used in medical investigations. The cement paste consisted of ordinary Portland cement CEM I 42.5 R, OPC; HeidelbergCement, Ennigerloh; see [18], and de-mineralized water.
Both substances were provided by their respective producers. The ultrasound gel was delivered to the participants in the interlaboratory test in sealed containers. The cement pastes were mixed in situ by the participating laboratories. All laboratories received cement from the same batch; the storage temperature for all materials was set at 20 °C. A detailed characterisation of the cement by the different laboratories can be found in [18]. Here only the most important characteristic values are reported. The density of the dry cement powder was determined to be 3.12 g/cm3, and the specific surface area is 3600 cm2/g in accordance with the Blaine method. The particle size distribution, analysed using the laser scattering method, indicates an average d50-value of 14.8 µm and a d90-value of 44.6 µm. Table 1 presents the chemical composition of the cement.
Sample preparation and measurement were carried out according to a predefined scheme. The temperature of the samples during the measurements was kept at 20 °C in case active cooling systems were available in the measuring device; for details see Table 2. Otherwise, the tests were performed in air-conditioned rooms. All rheological measurements were repeated four times at least. The ultrasound gel samples were measured as delivered, no prior mixing was required.
In preparing the cement paste, the quantities of 1698 g CEM I 42.5 R and 754 g of demineralized water were mixed, resulting in 1.3 dm3 of suspension with a volumetric solid fraction of 0.42 and a water-to-cement ratio of 0.44. The demineralized water and the cement were tempered to a temperature of 10 °C and 20 °C, respectively, prior to mixing to reach a final suspension temperature of 20 °C after mixing. The mixing was performed in a mixer according to DIN EN 196-1 [19]. The mixing procedure is detailed in the “Appendix”, Table 4.
The cement suspensions’ temperatures were recorded and a sedimentation stability test according to DIN EN ISO 10426-2 was carried out [20]. The free fluid accumulating on top of the suspension column was measured. Additionally, the fresh density of the cement suspension was determined to be 1.92 ± 0.03 g/cm3 for all participating labs. On completion of these quality checks, the sample was re-mixed at speed level 1 for 30 s. 15 min after the addition of water to the dry cement the spread flow of the cement paste was measured using a Haegermann cone according to DIN EN 1015-3 [21]. The rheometer measurement was started exactly 15.5 min after water addition; see Sect. 2.2.2.
The preparation scheme described above was limited to rheometers with a sample volume smaller than 1.3 dm3. For the measuring geometry V-3, the preparation was adjusted by using a Hobart A200N mixer preparing 5 dm3 of cement suspension; see Table 2. Hence, 6531 g of cement were mixed with 2900 g of demineralized water. No significant differences in spread flow were observed among the cement pastes prepared according to these two different schemes.
2.2 Rheological measurements
2.2.1 Overview of rheometers and measurement geometries
In this study two types of rheometer systems, i.e., Couette and Searle systems, were employed. In the first case, the container and sample rotate while the measuring unit, i.e., the torque sensor, is static. A key advantage of this setup is that the typically occurring Taylor vortices in the immediate vicinity of the inner cylinder/sensor during rotation can be avoided [22, 23]. Couette systems can be used to determine the rheological properties of cementitious suspensions and mortars at high shear rates. At low shear rates or oscillation measurements the system can have disadvantages arising from inertia of the sample and the container [24]. The effect is aggravated when an additional water bath, e.g. for temperature control, contributes to inertia as well. In contrast, for the Searle system the sample is static whereas the measuring unit rotates, which may result in Taylor vortices at high shear rates [22, 23]. However, inertial effects, strongly reduced in comparison to Couette-type systems, and measurements at very low shear rates are possible.
Table 2 provides an overview of the rheometers and the corresponding geometries used by the individual laboratories. The geometries here are grouped into six classes: parallel-plate geometries (PP), cone-plate geometries (CP), coaxial cylinder geometries (CC), vane geometries (V), paddle geometries (P), and other geometries (O). Each test is referenced by the label of the geometry and a consecutive number. Further details are summarised in “Appendix”, Sect. 1.3.
As can be seen from Table 2, not all rheometers in this study were equipped with a temperature control unit. The lack of a thermostat possibly resulted in some slight temperature drift and correspondingly, possibly in some little change in rheological properties. However, these deviations were considered negligible, as the temperature of the cement paste was carefully controlled during the mixing process; see Sect. 2.1. Note that the rheological measurements were nearly always carried out in climatized rooms and the measurement duration was kept very short; compare Fig. 1.

Rotational controlled rheometer profile defined by relative rotational speed; (1) increase in rotational speed; (2) maximum rotational speed, (3) stepwise decrease in rotational speed
2.2.2 Shear profile
A key challenge in this research was ensuring that the rheometer measurement profile, i.e. the sequence of defined steps in rotational speed in the rheometer, could be realized by all participating laboratories, taking into consideration the pronounced differences in rheometers, geometries and control interfaces used. To obtain a suitable testing regime, a rotational controlled rheometer profile provided by a sequence of rotational speeds, i.e. rotations per minute, was used; see Fig. 1 and “Appendix”, Table 5.
The start of the measuring job at time t = 0 s corresponds to a suspension age, the time after water addition, of 15.5 min. The profile consists of a 30 s rest period, followed by a steep increase in rotational speed (1), a steady state phase with constant rotational speed (2), and a stepwise decrease of rotational speed (3); see Fig. 1. It is important to note that it would have been highly desirable to define the measurement profile by a defined sequence of shear rates instead of rotational speeds. However, due to the different geometries employed in this research, all with their own unknown conversion parameters, a direct comparison or conversion of shear rates to rotational speeds was not possible. In this research the challenge layed in explaining this.
2.3 Data selection
Data acquisition during the rheological measurements was performed according to the specified procedures and technical possibilities of each laboratory; for details see “Appendix”, Tables 6, 7, 8, 9, 10 and 11. For the evaluation of the rheological properties of the investigated substances, the data of the downward ramp (step 3) was selected for the purpose of performing a Bingham evaluation; see (3) in Fig. 1. As the non-Newtonian substances under investigation exhibited a shear-thinning behaviour, only the steady state phase of each rotational speed step could be evaluated. In order to identify in each step the data points that correspond to the steady state phase, a sensitivity analysis was performed to determine the selection range. The duration of one step was 15 s. Four different approaches were analysed: (i) the data points of the last second of each step, (ii) the data points of the last 2 s of each step, (iii) the data points of the last 3 s of each step and (iv) all data points of each step lasting 15 s as mentioned above. Using the corresponding data points, a linear regression of the torque T (Nm) over rotational speed \(\varOmega\) (min−1) in the range of 20–80 min−1 was performed, providing yield torques T0, i.e., the ordinate-intersect, for the four approaches. Figure 2 shows the yield torque of the scenario considered normalized by the yield torque determined using scenario (i). Both for cement paste and ultrasound gel, the data showed no significant differences, whether the steady state phase was considered to be in the last 1 s, 2 s or 3 s of each step. However, a difference of up to 40% deviation could be found when considering the entire length of a step. Therefore, in the following data evaluation, the yield torque and plastic viscosity were calculated using the last 1 s of each rotational speed step, i.e. case (i).

Yield torque T0 for considering the data of the last 1 s (i), the last 2 s (ii), the last 3 s (iii) and the entire data set (iv) for each steady rotational speed (steps in Fig. 1) normalized by T0 determined for case (i)
2.4 Data conversion from relative to absolute rheological values
The existence of a defined shear plane and known shear gradient over the measurement gap strongly facilitates the conversion of torque/rotational speed measurements into absolute measurement results, such as dynamic viscosity or yield stress [25]. Conversion schemes for cone-plate, parallel-plate and coaxial cylinder geometries are briefly outlined below. Due to the complicated geometrical and fluid mechanical boundary conditions in geometries different from those previously mentioned, a direct conversion is either not possible or requires various assumptions, and in some cases, a reference to a known model substance. For this reason, the so-called Affine-Translation approach for arbitrary geometries was introduced.
2.4.1 Parallel-plate (PP) approach
In general, a parallel-plate geometry consists of a rotating upper plate and a static bottom plate with the same axis of symmetry and equal radius R, displaced by the gap width H; see “Appendix”, Fig. 9. In order to obtain simple shear conditions the relationship between R and H is usually chosen within 2R/H = 10 to 50 [23]. With increasing gap width, there is a higher risk of turbulent flow conditions or loss of substance at the edge due to higher rotational velocities at the same shear rates. Simple shear is achieved at any radius r ≤ R, but due to inhomogeneous flow conditions the shear rate increases towards the outer rim [25]. The shear rate \(\dot{\gamma }\)(r) at radius r can directly be calculated from the rotational speed whereas the local shear stress τ(r) depends on the local shear rate \(\dot{\gamma }\)(r) and therefore the radius r; see Eqs. (1) and (2).
where \(\dot{\gamma }\) is the shear rate (s−1), ω is the angular velocity (rad/s), H is the gap width (m), n = Ω/60 is the rotational speed (s−1), τ is the shear stress (Pa), T is the torque (Nm), A is the contact area of the plate (m2), R is the outer radius of the plate (m).
To convert rotational speed and torque into the representative bulk, i.e. non-positional, r-dependent, rheological parameters, i.e. shear rate and shear stress, there are different approaches to solve the issue of radius-dependent shear conditions in a parallel-plate geometry. An exact solution for shear rate and shear stress is obtained for a Newtonian flow law τ(r) = η \(\cdot \space \dot{\gamma }\)(r) while using the shear rate instead of the radius r = \(\dot{\gamma } \space \cdot\)H/ω [25]; see Eq. (3).
Since both shear rate and shear stress are known at the edge of the plate, the radius r = R can be chosen for the evaluation [26]; see Eq. (4).
where η is the dynamic viscosity (Pa·s).
In principle this is possible for other substances and flow laws as well, but in the case of unknown, non-Newtonian fluids, inhomogeneous flow conditions must be considered. According to [25, 26], this can be done by correcting the shear stress at the edge of the plates using the Weissenberg-Rabinowitsch equation (Eq. 5).
This equation can be adjusted with respect to dT/dω, allowing to insert data from a plot of T(ω) from multiple measurement curves [25]. Finally, for every angular velocity ω a corrected shear rate \(\dot{\gamma }\)(r) and shear stress τ(r) can be computed.
A more convenient approach is the use of the Newtonian flow law (τ(r) = η \(\cdot \space \dot{\gamma}\)(r)) in combination with a representative shear rate for the parallel-plate geometry. The method generalizes a measurement for a distinct radius so that a pair of shear rate and shear stress values can be calculated at this position without further correction [27]. Mezger proposes a radius of r = 2/3·R as appropriate in order to obtain an effective average shear rate \(\dot{\gamma }\), since it is the radius-dependent, volume-weighted average of the parallel-plate geometry [23]. Nevertheless, in the case of non-Newtonian materials it was shown that a more suitable representative radius is r = 3/4·R; see Eq. (6).
The reason is that the error made for fluids following the Ostwald-/de Waele Power Law τ < \(\dot{\gamma}^n\) with n < 1.4 is minimized to approximately 2% [15, 26]. Nevertheless, this approach is based on empirical correlations and is not applicable for every fluid.
Wall slip of a non-Newtonian fluid can be corrected by quantification of the slip velocity measured at a minimum of two different gap widths H [28]. In the case of cement-based suspensions, the rheological properties scatter in successive experiments due to the aforementioned factors [29], which makes it very difficult to quantify the slip velocity. Hence, parallel-plates with a rough surface (sandblasted or serrated) are applied to minimize wall slip [30]. However, with increasing roughness, the discrepancy between the true gap and the gap calibrated at the zero gap determination increases [31, 32]. Hence, an effective gap (Heff) can be determined by calibrating the gap with a Newtonian fluid [33].
2.4.2 Cone-plate (CP) approach
In a cone-plate geometry, one plate is exchanged for a cone with a flattened tip and an angle \(\alpha < 4^\circ\); see “Appendix”, Sect. 1.3, Fig. 10 [23]. Since the radial velocity and the gap width both change with the radius r, the shear rate is constant over r and so has to be the shear stress; see Eq. (7) and (8). The only assumptions necessary are \(\tan \alpha \approx \alpha\) and a constant contact area A. Both assumptions are valid for small values of \(\alpha\).
with h(r) as gap width (m).
Because of the fixed, narrow gap size, particles can mechanically block the system, which renders the application of the cone-plate system as very restricted for cementitious suspensions.
2.4.3 Reiner–Riwlin (RR) approach for wide gap coaxial measurement geometries
The non-Newtonian flow behaviour of cement paste is commonly approximated by the Bingham constitutive model; see Eq. (9).
where \(\tau_{0}\) is the yield stress.
The Reiner–Riwlin equation has been used to calculate the Bingham model parameters, plastic viscosity and yield stress, in wide gap coaxial cylinder geometries [34, 35]. The Reiner-Riwlin equation is valid for both Couette and Searle rheometer setups. Two different sorts of material flow within the gap are possible [8, 36]:
-
(a)
When the entire material in the annulus flows, the Reiner–Riwlin equation can be expressed by Eq. (10) [8, 35].
$$\omega = \frac{T}{4\pi h\mu }\left( {\frac{1}{{R_{1}^{2} }} - \frac{1}{{R_{2}^{2} }}} \right) - \frac{{\tau_{0} }}{\mu }{ \ln }\left( {\frac{{R_{2} }}{{R_{1} }}} \right)$$(10) -
(b)
When the material exhibits a yield stress, the shear stress in the annulus may not be sufficient to shear the entire material, resulting in plug flow near the outer cylinders walls; compare Fig. 3. The plug flow radius is a function of torque, yield stress, and height of the inner cylinder or vane probe. In order to use the Reiner-Riwlin equation in the case of partially sheared flow, the plug flow radius must be calculated by Eq. (11) [8, 9, 35].
$$R_{\text{plug}} = \sqrt {\frac{T}{{2\pi h\tau_{0} }}}$$(11)Fig. 3 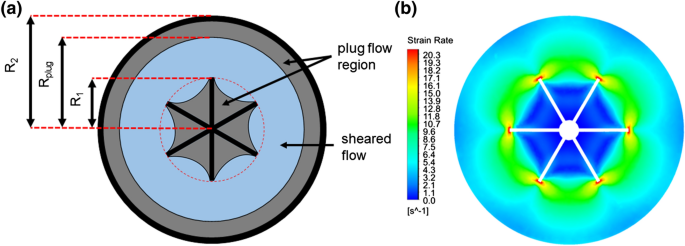
a Top view of a coaxial vane-in-cup system in the case of plug flow; b CFD simulation of material flow at the middle heigt of vane geometry (horizontal section) for a Newtonian fluid (silicone oil AK 5000); taken from [37]

Finally, the Reiner-Riwlin equation is reformulated, taking into account the plug flow radius [8, 34, 35]; see Eq. (12).
As presented in Fig. 3a, the rheologically tested material can show inhomogeneous flow behaviour, especially near the edges of vane blades [36, 37]. Moreover, the case of partially sheared flow, i.e., plug flow, in a wide-gap coaxial rheometer and material flow behaviour near the vane geometry from magnetic resonance imaging (MRI) technique are both demonstrated in [36]. However, the inner radius is usually approximated as a full cylinder radius, and a correction factor is introduced with respect to the different material flow behaviour [36].
According to [37] about 95% of total torque is applied to the lateral surface in the case of the vane-in-cup setup. However, the non-linear torque contribution of different vertical segments of the vane probe has to be respected in addition [37].
In order to calculate the Bingham model parameters (yield stress and plastic viscosity) by means of the Reiner-Riwlin equation in the case of plug flow, an iterative nonlinear optimisation technique was used with the help of a solver software [35, 38].
2.4.4 Affine-translation (AT) approach for arbitrary geometries
The previously specified conversion schemes are limited to measurement geometries with very specific geometric boundary conditions, which are only fulfilled by a small number of test setups in this study. In order to enable a comparison of all the investigated measuring geometries, a geometry-independent, assumption-free method is needed. Therefore the so-called Affine-Translation approach is proposed, which consists of referencing torque T (Nm) over rotational speed Ω (min−1) values determined for a yield stress fluid, here ultrasound gel, using any arbitrary measurement geometry for measurements on the same substance using a cone-plate geometry, thus providing absolute rheological properties.
In this approach, both the measurement results T(Ω) using the arbitrary geometry and \(\tau \left( {\dot{\gamma }} \right)\) using the cone-plate geometry are subjected to a linear fit in the rotational speed range of Ω between 20 to 80 min−1 and 21 to 84 s−1, respectively. This delivers a yield torque T0U and slope SU of the substance ultrasound gel (U) in the arbitrary geometry and the corresponding yield stress τ0,U and plastic viscosity µU in the cone-plate geometry. The approach now is reduced to finding conversion factors with which to scale the absolute axes torque T and rotational speed Ω of the arbitrary geometry as to yield a line with identical yield stress τ0 and plastic viscosity µ as determined in the cone-plate setup.
The relations between these parameters are summarised according to [24]; see Eqss. (13) and (14).
The conversion factors Arheo and Mrheo, determined using ultrasound gel, were calculated on this basis for every single measurement geometry and are given in Table 3. As can be seen, the values differ significantly from geometry to geometry, reflecting the pronounced differences in absolute torque values measured with the arbitrary geometries despite identical substances.
In the next step, the Arheo and Mrheo factors are applied to the Bingham parameters, yield torque \(T_{0,C}\) and slope \(S_{C}\), obtained on cement paste with the corresponding measurement geometry using Eq. (15) and (16) to obtain the absolute yield stress τ0,AT,C and plastic viscosity µAT,C of the cement paste. Here the index AT indicates that the data conversion was carried out using the Affine-Translation approach.
The authors are well aware that the procedure presented lacks physical background and is highly dependent on the rheological similarity between the cement paste used and the reference substance, ultrasound gel. Thus, caution must be given when applying the factors A and M to cement paste measurements with significantly deviating rheological properties. Further research is currently being carried out on the extended applicability of this approach.
3 Results and discussion
The key goal of this research was the investigation of the comparability of rheological measurements using different kinds of rheometers and measurement geometries performed at different institutions. In order to ensure that the rheological properties of the reference substance, ultrasound gel, were identical for all participating institutions—despite prior homogenisation—small amounts of the sample were extracted from the batch of each participating institution and measured in one lab with one defined instrument and geometry, the cone-plate setup CP-1; see Table 2. In total 12 samples were investigated with the shear profile depicted in Fig. 1 in order to obtain reference values. The data handling was performed as described in Sect. 2.3.
The resulting flow curve is detailed in Fig. 4 in a boxplot layout, showing the mean value and confidence intervals of the shear stress for each shear rate step. A Bingham-fit in the range between 21 and 84 s−1 correlating to rotational speeds of between 20 and 80 min−1 was applied, yielding the reference yield stress of ultrasound gel \(\tau_{0,U}\) = 141.33 Pa ± 3.93 Pa and a reference plastic viscosity of \(\mu_{U}\)= 1.46 Pa·s ± 0.08 Pa·s. These values served as a basis for calculating the Arheo- and Mrheo-factors; see Sect. 2.4.4.

Flow curve shown as boxplot layout of the reference measurements on ultrasound gel using a cone-plate measurement device (CP-1, see Tab. 2). All samples are evaluated using a Bingham-fit in the indicated range to obtain reference yield stress \(\tau_{0,U}\) and reference plastic viscosity \(\mu_{U}\)
In contrast to the cone-plate measurements performed on ultrasound gel, the results obtained using other setups are highly dependent on the measurement geometry employed. Hence, all devices detailed in Table 2 were used for investigations of ultrasound gel. The results depicted in Fig. 5 show a high spread with respect of their torque values, despite quasi-identical properties of the substance investigated; compare Fig. 4. Thus, a direct comparison between these relative values is not possible. Identical to the data of the cone-plate measurement in Fig. 4, the flow curves obtained in Fig. 5 were evaluated by linear regression in determining the yield torque (T0,U) and slope (SU). The respective results are listed in Table 3.

Torque T over rotational speed Ω values determined in investigations on ultrasound gel for the different measuring setups. Standard deviations for all measurements are given
The values of torque over rotational speed in the cement paste measurements are shown in Fig. 6 and confirm a strong dependency of the torque on the measurement geometry. The standard deviations vary as well, in dependence on the geometry. Analogous to the ultrasound gel measurements, a linear fit of the curves was performed in order to determine the yield torque (T0,C) and slope (SC) for each setup; see Table 3.

Torque T over rotational speed Ω values determined in investigations on cement paste for the different measuring setups. Standard deviations for all measurements are given
Deviations in T(Ω) curves are not only caused by employing different measurement geometries but also by deviations in the properties of the paste resulting from slight differences in the pastes’ preparation. These differences were quantified using the spread flow test; see Sect. 2.1. The results are detailed in Table 3 and show a coefficient of variation of approx. 4.5%, however with various outliers as defined by a deviation from the spread flow mean value of 20 mm, corresponding to values below 180 mm and above 220 mm of spread flow without shock.
As can be seen from the results shown in Fig. 7, using the conversion schemes introduced in Sect. 2.4, reasonable comparability between the rheological data obtained with different measurement geometries can be obtained. Using the Affine-Translation approach (AT), a mean yield stress \(\tau_{{0,{\text{AT}},C,{\text{mean}}}}\) = 40.00 Pa ± 10.97 Pa and a plastic viscosity µAT,C,mean = 0.50 Pa·s ± 0.12 Pa·s were determined. The cement paste investigated thus shows significantly lower yield stress and plastic viscosity than the reference ultrasound gel. Thus, it can be expected that the AT-conversion performed with this ultrasound gel gives a rather good representation of very stiff pastes.

Comparison of calculated yield stress \(\tau_{0}\) and plastic viscosities µ for measurements on cement paste using different measurement geometries and rheometers in different labs after data conversion using the different conversion schemes outlined in Sect. 2.4. Conversion results calculated using the Affine-Translation approach are designated with AT, Reiner-Riwlin approach results with RR and parallel-plate results with PP. The variations in the results are caused by the different geometries, devices, calculation approaches, and cement paste properties used. The horizontal lines and the coloured areas indicate mean value and standard deviation determined by the Affine-Translation results only
Lower values for the yield stress are obtained for the same paste when using the Reiner–Riwlin (RR) conversion scheme (\(\tau_{{0,{\text{RR}},C,{\text{mean}}}}\) = 34.76 Pa ± 8.28 Pa). The parallel-plate measurements yield similar results as the RR-conversion (\(\tau_{0,PP,C,mean}\) = 31.27 Pa ± 1.86 Pa). As can be seen from Table 3 and Fig. 7, these schemes however are limited to a small number of measurement geometries.
The parallel-plate (PP) and all coaxial cylinder (CC) geometries show similar results for yield stress, regardless of the conversion scheme. This indicates strongly that the Affine-Translation approach—despite its lack of physical background—is suitable for carrying out such conversions. When further comparing the PP- and CC-results with the data of tests using paddles or other geometries, a significantly lower yield stress can be detected for the PP- and CC-results. It is yet unclear which of the two groups gives a more accurate representation of material behaviour. However, light is shed on this question when comparing the obtained yield stress data, with the yield stress calculated from the paste spread flow \(\tau_{{0,{\text{SL}}}}\) following an approach first proposed by Murata et al. [40] and revised by Roussel et al. [39]; see Eq. (17).
with \(\rho\) as the specific weight of the paste (kg/m3), g as the acceleration of gravity (m/s2), V as the volume of the paste (here: 0.000344 m3) (m3) and R as the radius of the spread flow without shock (m).
The results of this calculation are also given in Table 3 and show a mean yield stress of \(\tau_{{0 , {\text{SL,}}C , {\text{mean}}}}\) = 41.51 Pa ± 9.05 Pa, which compares very well to the mean results of the AT-scheme. Figure 8 shows a direct comparison of the yield stresses measured and converted from rheometer measurements normalized by the spread flow yield stresses.

Yield stress determined in rheometer measurements and converted using the AT-, RR- and PP-schemes normalized by the yield stress calculated using Eq. (17) from corresponding spread flow data
Whereas the mean value of the rheometer measurements converted using the AT-scheme and the spread flow yield stresses compare very well, the data is still subject to pronounced scatter. Here it must be kept in mind that in the rheometer measurements, the downward ramp—and thus a highly sheared paste—is evaluated for the yield stress; see Fig. 1, step 3. Consequently, the yield stresses of rheometer measurements should lead to lower values than for the spread flow yield stresses, as in the latter a less sheared paste is tested. Assuming that Eq. (17) provides an accurate estimate of the yield stress for less sheared paste, due to a low applied shear stress by gravitational force and less structural breakdown, it would be reasonable to assume that the yield stress of the highly sheared paste is lower than the mean value for \(\tau_{{{\text{SL}},C}}\) given above. This comparison, however, neglects the fact that the conversion shown in Eq. (17) is subject to various limitations. First, during the spread flow test, not the entire volume of the cone is discharged, but significant amounts stick to the metal cone, eventually leading to lower spread flow values. Second, and even more telling, neither cement paste nor ultrasound gel exhibits ideal Bingham flow behaviour. Whereas the Bingham model assumes no deformation whatsoever for τ < τ0, Figs. 4 and 5 clearly indicate that this simplification is not true. The behaviour for low shear rates, however, in the opinion of the authors, is highly relevant to the spread flow test. From Fig. 4 it can be seen that flow already starts for stresses as low as a factor of 2.5 of the Bingham yield stress. This indicates that the Bingham yield stress measured in the rheometer should be significantly higher than the yield stress determined in the spread flow measurements. With this background, rheometer measurements shown in Fig. 7 (left), which underestimate the yield stress extracted from the spread flow data, must be viewed with caution. Further, the shear rates in the different rheometers differ significantly depending on the applied geometry, which is currently not considered. This aspect will be investigated in a future paper. Finally it must be considered that the model proposed by Roussel (Eq. 17) is valid only for spread flow values of > 200 mm, whereas all results considered in this research are partially lower in the range between 180 and 220 mm [39, 41].
In this context the results of the plastic viscosity µ need also be considered. The mean plastic viscosity converted using the AT-scheme was µAT,C,mean = 0.50 Pa·s ± 0.12 Pa·s, compared to the values of 0.66 Pa·s ± 0.26 Pa·s for the RR-scheme. No clear distinction between the groups mentioned previously can be made. The variance over the entire dataset of plastic viscosities is strongly influenced by the results measured with geometries V-1.RR, P-1.AT and O-3.AT. The increased value of P-1.AT (both yield stress and plastic viscosity) can be explained by the low spread flow of the investigated cement paste. No conclusive explanation could be found for the other two values. The assumptions for PP-5 are caused by an insufficient steady state condition and thus, further estimations of minimum T0,C and maximum SC are performed.
4 Summary and conclusions
Measuring the rheological properties of fresh cement suspensions is highly complex, primarily due to the broad particle-size distribution, high solid phase content, formation of slippage layers, sedimentation, and shear-induced particle migration. Therefore, instead of the usual measuring geometries employed in modern rheometers such as cone-plate, parallel-plate or coaxial cylinder geometries, often geometries with profiled or serrated shear plane, but also and even more common, without defined a shear plane are used, such as vane rotors or paddles. The goal of the interlaboratory study presented was to give insight into whether measurements performed on quasi-identical substances, using different rheometers, geometries and operators can yield comparable results. Special focus was hereby given to conversion schemes, which allow for calculating rheological values such as Bingham yield stress and plastic viscosity from rheometer torque and rotational speed values. Based on the obtained results the following conclusions can be drawn:
-
The preparation scheme for cement paste employed in this research demonstrated very good reproducibility with a coefficient of variation of 4.5%, as determined using the spread flow test without shock, over all 12 participating laboratories.
-
The flow curves obtained on cement paste for high shear rates or rotational speeds indicated, independent of the applied measuring geometry, Bingham-like material behaviour characterised by a yield stress and plastic viscosity. For low shear rates, however, a pronounced non-linearity in the results was observed, which clearly shows that the true yield stress of the paste is expected to be significantly below the corresponding value provided by the Bingham extrapolation.
-
Due to the great variety of measurement geometries, a direct comparison of measurement results expressed in torque over rotational speed is not possible. Conversion of the data to absolute rheological units is possible using conversion schemes, which either require certain geometrical boundary conditions to be fulfilled and assumption on the flow behaviour to be made, as in the parallel-plate and Reiner-Riwlin approaches, or involve a comparison of the measurement results to a reference substance, here ultrasound gel, with similar rheological properties by the Affine-Translation approach. It could be shown that all three conversion schemes yield close results when applied to the identical dataset. In this context ultrasound gel has proved to be a valuable reference substance, as the flow behaviour is very similar to that of the cement paste under examination, also showing pronounced non-linearities in the flow curve for low shear rates.
-
With regard to the various measurement geometries, significant differences were observed, with a coefficient of variation over all measurements and conversion schemes of 27% for Bingham yield stress and 24% for plastic viscosity.
-
Comparison to yield stress calculated based on spread flow data using an analytical approach shows that in general, rheological measurement using a rheometer seems to underestimate the yield stress from spread flow data by approx. 6%, however, with results ranging from 50% underestimation to approx. 60% overestimation. Here it must be kept in mind that the spread flow conversion to yield stress is likely to underestimate yield stress gained by rheometer measurements at very low shear rates.
Summarizing the results, it can be stated that by the application of conversion schemes, rheological measurement results on cement paste performed with different measurement geometries and rheometers can be compared with each other in a quantitative manner. Despite this conversion, deviations in the results could be observed, which amount to deviations of approx. ± 27% for Bingham yield stress and ± 24% for Bingham plastic viscosity. The comparison with yield stress values calculated from spread flow measurements using an analytical approach indicates that rheometer measurements either under- or overestimate the yield stress depending on the measurement geometry. This must be considered when performing rheological measurements. In contrast, the reproducibility of the rheological measurement for each measurement geometry is much higher, with a mean coefficient of variation of 4.2% ± 3.5% for determination of Bingham yield stress and 8.7% ± 6.7% for determination of Bingham viscosity.
The above-given values for the reproducibility of rheological measurements and the underlying definition of reproducibility deviates from the definition of repeatability r and reproducibility R given by ISO 5725-2 [45]. The main reason for that is in this research, a large number of different measurement devices was employed. According to ISO 5725-2 every single device would qualify as a standard method. By including different devices and measurement geometries in the study and employing a mathematical/analytical scheme to convert measurement data to rheological units such as yield stress and viscosity, an additional component of bias resulting from this conversion process must be included. As was shown in this paper, the quantification of such additional source of bias—and thus the specification of repeatability and reproducibility values in accordance with ISO 5725—remains a challenging task.
References
Aïtcin P-C, Mindess S (2011) Sustainability of concrete. Modern Concrete Technol 17, Spon Press, London
Tattersall GH, Banfill PFG (1983) The rheology of fresh concrete. Pitman Books Ltd, London
Wallevik JE (2003) Rheology of particle suspensions: fresh concrete, mortar and cement paste with various types of lignosulfonates. PhD thesis, Norwegian University of Science and Technology
Coussot P (2005) Rheometry of pastes, suspensions, and granular materials. Applications in industry and environment. Wiley, Hoboken
Ferraris CF, Martys NS (2012) Concrete rheometers. In: Roussel N (ed) Understanding the rheology of concrete. Woodhead publishing series in civil and structural engineering. Woodhead Publishing, Sawston, pp 63–82
Feys D, Cepuritis R, Jacobsen S et al. (2017) Measuring rheological properties of cement pastes: most common Techniques, Procedures and Challenges. RILEM Tech Lett 2. https://doi.org/10.21809/rilemtechlett.2017.43
Heirman G, Hendrickx R, Vandewalle L et al (2009) Integration approach of the Couette inverse problem of powder type self-compacting concrete in a wide-gap concentric cylinder rheometer: Part II Influence of mineral additions and chemical admixtures on the shear thickening flow behaviour. Cem Concr Res 39(3):171–181
Feys D, Wallevik JE, Yahia A et al (2013) Extension of the Reiner-Riwlin equation to determine modified Bingham parameters measured in coaxial cylinders rheometers. Mater Struct 46(1–2):289–311
Wallevik OH, Feys D, Wallevik JE, Khayat KH (2015) Avoiding inaccurate interpretations of rheological measurements for cement-based materials. Cem Concr Res 78:100–109
Wallevik JE (2008) Minimizing end-effects in the coaxial cylinders viscometer: Viscoplastic flow inside the ConTec BML Viscometer 3. J of Non-Newtonian Fluid Mech 155(3):116–123
Scrivener KL, Juilland P, Monteiro PJM (2015) Advances in understanding hydration of Portland cement. Cem Concr Res 78:38–56
Mewis J, Wagner NJ (2009) Thixotropy. Adv Colloid Interface Sci 147–148:214–227
Taylor HFW (1997) Cement chemistry, 2nd edn. Thomas Telford Ltd, London
Stroh J, Schlegel M-C, Schmidt W et al (2016) Time-resolved in situ investigation of Portland cement hydration influenced by chemical admixtures. Constr Build Mater 106:18–26
Ovarlez G (2012) Introduction to the rheometry of complex suspensions. In: Roussel N (ed) Understanding the rheology of concrete. Woodhead Publishing series in civil and structural engineering. Woodhead Publishing, Sawston, pp 23–62
Brower LE, Ferraris CF (2003) Comparison of concrete rheometers. Concr Int 25(8):41–47
Feys D, Sonebi M, Amziane S et al. (2019) An overview of RILEM TC MRP Round–Robin testing of concrete and mortar rheology in bethune, France, May 2018. In: 2nd international RILEM conference rheology and processing of construction materials (RheoCon2), 2019, Dresden
Lu Z, Haist M, Ivanov D et al. (2019) Characterization data of reference cement CEM I 42.5 R used for priority program DFG SPP 2005 Opus Fluidum Futurum-Rheology of reactive, multiscale, multiphase construction materials. Data in Brief Vol. 27
DIN EN 196-1:2016-11, Methods of testing cement—Part 1: determination of strength, German version EN 196-1:2016
DIN EN ISO 10426-2:2006-02, Petroleum and natural gas industries—cement and materials for well cementing—part 2: Testing of well cements (ISO 10426-2:2003 + Amd. 1:2005); English version EN ISO 10426-2:2003 + A1:2005
DIN EN 1015-3:2007-05, Methods of test for mortar for masonry—Part 3: determination of consistence of fresh mortar (by Flow Table), German version EN 1015-3:1999 + A1:2004 + A2:2006
Taylor GI (1923) Stability of a viscous liquid contained between two rotating cylinders. Phil Trans Royal Society A223(605–615):289–343
Mezger T (2012) Das Rheologie-Handbuch. Für Anwender von Rotations- und Oszillations-Rheometern, 4. Aufl., Farbe und Lack Edition, Vincentz Network, Hannover
Haist M (2010) Zur Rheologie und den physikalischen Wechselwirkungen bei Zementsuspensionen. PhD thesis, Karlsruhe Institute of Technology, KIT Scientific Publishing, Karlsruhe
Coussot P (2014) Rheophysics Matter in all its states Soft and Biological Matter. Springer International Publishing
de Souza Mendes P, Alicke A, Thompson R (2014) Parallel-plate geometry correction for transient rheometric experiments. Appl Rheol 24:52721
Giesekus H, Langer G (1977) Die Bestimmung der wahren Fließkurven nicht-newtonscher Flüssigkeiten und plastischer Stoffe mit der Methode der repräsentativen Viskosität. Rheol Acta 16(1):1–22
Yoshimura A, Prud’homme RK (1988) Wall slip corrections for couette and parallel disk viscometers. J of Rheol 32(1):53–67
Papo A, Piani L (2004) Effect of various superplasticizers on the rheological properties of Portland cement pastes. Cem Concr Res 34(11):2097–2101
Nehdi M, Rahman M-A (2004) Estimating rheological properties of cement pastes using various rheological models for different test geometry, gap and surface friction. Cem Concr Res 34(11):1993–2007
Connelly RW, Greener J (1985) High-Shear viscometry with a rotational parallel-disk device. J Rheol 29(2):209–226
Ley-Hernández AM, Feys D (2020) Challenges in Rheological Characterization of Cement Pastes Using a Parallel-Plates Geometry. In: Mechtcherine V, Khayat KH, Secrieru E (eds) Rheology and processing of construction materials, rheocon 2019/SCC9, RILEM Bookseries 23. Springer, Cham, pp 228–236
Ferraris CF, Geiker M, Martys NS et al (2007) Parallel-plate rheometer calibration using oil and computer simulation. J Adv Concr Techn 5(3):363–371
Estellé P, Lanos C, Perrot A, Amziane S (2008) Processing the vane shear flow data from Couette analogy. Appl Rheol 18(3):34037
Koehler EP, Fowler DW (2004) Development of a portable rheometer for fresh portland cement conceret. Research report ICAR -105-3F
Ovarlez G, Mahaut F, Bertrand F et al (2011) Flows and heterogeneities with a vane tool: magnetic resonance imaging measurements. J Rheol 55(2):197–223
Eslami Pirharati M, Ivanov D, Krauss H-W et al (2020) Numerical simulation of the flow behavior of newtonian fluids in a wide gap rheometer by CFD. In: Mechtcherine V, Khayat KH, Secrieru E (eds) Rheology and processing of construction materials, RheoCon 2019/SCC9, RILEM Bookseries 23. Springer, Cham, pp 588–595
Feys D, De Schutter G, Verhoeven R (2010) The rheological behaviour of fresh self-compacting concrete in the high shear rate range. RILEM Bookseries 2:491–501
Roussel N, Coussot P (2005) “Fifty-cent rheometer” for yield stress measurements: from slump to spreading flow. J Rheol 49:705–718
Murata J (1984) Flow and deformation of fresh concrete. Mater Constr 17(2):117–129
Roussel N, Stefani C, Leroy R (2005) From mini-cone test to Abrams cone test: measurement of cement-based materials yield stress using slump test. Cem Concr Res 35:817–822
DIN EN 53019-1:2008-09, Viscometry—measurement of viscosities and flow curves by means of rotational viscometers –Part 1: Principles and measuring geometry, German version EN 53019-1:2008-09
DIN EN ISO 3219:1994-08, Plastics—polymers/resins in the liquid state or as emulsions or dispersions—determination of viscosity using a rotational viscometer with defined shear rate, German version EN ISO 3219:1994
Olivas A, Helsel MA, Martys NS, Ferraris CF, George WL, Ferron R (2016) NIST Technical Note 1946—rheological measurement of suspensions without slippage: experiment and model
ISO 5725-2:2002-12: Accuracy (trueness and precision) of measurement methods and results, Part 2, Basic method for the determination of repeatability and reproducibility of a standard measurement method
Acknowledgements
Open Access funding provided by Projekt DEAL. The authors thank the Deutsche Forschungsgemeinschaft (DFG) for funding this research within the DFG Priority Programme 2005 “Opus Fluidum Futurum” under the grants 387096404 (HA 7917/3-1), 387118319 (LO 1393/3-1), 387092747 (SCHM 3365/1-1), 387065685 (GA 519/10-1), 411375374 (LO 751/26-1), 387066140 (KR 4948/1-1), 387095311 (ME 2938/19-1), 387152958 (ME 2938/20-1), 387153567 (ME 2938/21-1), 403524381 (SCHM 1429/16-1), 386871659 (WI 1911/25-1), 386869775 (STE 1086/18-1), 387065993 (GE 1973/28-1). For more details please visit https://www.spp2005.de. Furthermore, the authors thank HeidelbergCement AG for providing the cement for this research.
Author information
Authors and Affiliations
Corresponding author
Ethics declarations
Conflict of interest
The authors declare that they have no conflict of interest.
Additional information
Publisher's Note
Springer Nature remains neutral with regard to jurisdictional claims in published maps and institutional affiliations.
Appendix
Appendix
1.1 1.1 Cement paste mixing procedure
All cement pastes were prepared at every participating institution using a mixer according to DIN EN 196-1 (Table 4).
1.2 1.2 Measurement profile
The measuring profile consisted of 16 elements with either constant rotational speed (elements 3 to 16) or linearly increasing rotational speed (element 2) (Table 5).
1.2.1 1.3 Details of measuring devices and geometries
See Tables 6, 7, 8, 9, 10, and 11.
1.3 1.4 Geometrical dimensions of measuring devices employed
1.3.1 Parallel-plate geometries (PP-1 to PP-5)
The PP geometry consists of two parallel plates aligned on the same axis of symmetry. The flow field is known and therefore absolute; comparable measurements even with different geometries are possible. In this research only plates with diameters of 25 mm and 50 mm were used. To avoid wall-slip the plates can be roughened, e.g. with sandpaper or serrated. Both proved to work, but absolute measurements are accordingly no longer possible because of the disturbed flow field. Typically, these systems are only used with rotational rheometers. The geometries used in this paper followed the definitions of DIN 53019-1 [42] (Fig. 9).

Parallel-plate geometry [PP-1 to PP-5]
1.3.2 Cone-plate geometry (CP-1)
The CP geometry is similar to the PP geometry, but the upper plate is replaced with a cone. The angle α is commonly below 2° for analytical reasons. The angle facilitates the data evaluation because of a homogeneous shear rate in the gap. On the other hand, it is not possible to prevent or correct wall slip due to the fixed, very small gap. In addition, only suspensions with particle sizes up to approximately one micron can be investigated. Typically, these systems are only used with rotational rheometers. The geometries used in this paper followed the definitions of DIN 53019-1 [42] (Fig. 10).

Cone-plate geometry [CP-1]
1.3.3 Coaxial cylinder geometry (CC-1 to CC-3)
Coaxial cylinder or concentric cylinder cells consist of an outer and an inner cylinder with the same symmetry axis (Fig. 11) and are described in the standards DIN EN ISO 3219 [43] and DIN 53019-1 [42]. CC geometries can be divided into small gap and wide gap. Small gap CC geometries show a simpler flow field, comparable to a PP-system. Both systems can be described analytically and thus provide absolute values so long as some assumptions such as a completely sheared gap are met. For wide-gap systems, it is possible to correct wall slip or prevent it using serrated or rough walls. CC geometries are used with rheometers and concrete viscosimeters. The geometries used in this paper followed the definitions of the DIN 53019-1 [42].

Coaxial cylinder geometry [CC-1 to CC-3]
1.3.4 Vane geometry (V-1 to V-3)
Vane geometries are very similar to the CC geometry, but the inner cylinder is replaced by a vane (Fig. 12). This is extremely useful for heterogeneous materials that yield or slip, thus disturbing the material to a lesser degree while lowering the measurement system, i.e. the rotor, into the substance. Unfortunately, the shear field in such geometries is undefined and no absolute measurement is possible. Information on shear rate and shear stress can be obtained using different analogies and corrections. To prevent slippage at the outer cylinder, it is often equipped with lamellas (Figs. 13 and 14). The number of blades on a vane geometry is not defined. In this paper, vane geometries with 4 and 6 straight blades were used.

Vane geometry [V-1; units in (mm)]

Vane geometry [V-2; units in (mm)]

Vane geometry [V-3; units in (mm)]
1.3.5 Paddle geometries (P-1 to P-9)
Paddle geometries are very similar to the vane geometries, but the blades are replaced by arbitrarily shaped paddles. The paddles were developed to meet special requirements, i.e. prevention of sedimentation, wall slippage and bleeding, while investigating cementitious suspensions and can be used with classical rotational rheometers. Since the flow field is very complex, the evaluation in respect of shear rate and shear stress is only possible using reference substances, as in the AT-approach. In this paper three different paddle geometries were used. The building materials cell (Fig. 15) is essentially a two-blade vane without the middle part and with slightly bent edges to tackle slip more efficiently. The second geometry, as in Fig. 16, is similar, but the edges are closer to the outer wall generating a different flow field without the necessity of slip inhibition at the wall. The third geometry consists of 4 curved rods symmetrically arranged (Fig. 17). It is designed to investigate cementitious suspensions in the mortar range.

Vane geometries [P-1 to P-5; units in (mm)]

Paddle geometry [P-6 to P-8; units in (mm)]

Paddle geometry [P-9; units in (mm)]
1.3.6 Other measurement geometries (O-1)
The sphere probe is similar to a paddle geometry where the paddle is replaced by a sphere. The biggest difference is the missing middle axis since the sphere is mounted on an arm above the material and then rotated around the “imaginary” middle axis. Such systems are only used with concrete viscometers (Fig. 18).

Other geometry [O-1; units in (mm)]
1.3.7 Other measurements geometries (O-2 and O-3)
The basket cell is a coaxial, double-gap measuring system with a defined shear area. The measuring system consists of a beaker with an annular gap and a scaffolding structure of the measuring cell. Therefore, there is no adhesion problem in the shear area. The system is typically used with concrete viscometers (Fig. 19).

Other geometries [O-2 and O-3; units in (mm)]
1.3.8 Other measurements geometries (O-4 and O-5)
The double helical spiral was used in NIST Technical Note 1946 [44]. The geometry was produced by laser sintering and is made of stainless steel. The great advantage of this configuration is the mixing of the suspension due to the complex flow field (Fig. 20).

Other geometries [O-4 and O-5; units in (mm)]
Rights and permissions
Open Access This article is licensed under a Creative Commons Attribution 4.0 International License, which permits use, sharing, adaptation, distribution and reproduction in any medium or format, as long as you give appropriate credit to the original author(s) and the source, provide a link to the Creative Commons licence, and indicate if changes were made. The images or other third party material in this article are included in the article's Creative Commons licence, unless indicated otherwise in a credit line to the material. If material is not included in the article's Creative Commons licence and your intended use is not permitted by statutory regulation or exceeds the permitted use, you will need to obtain permission directly from the copyright holder. To view a copy of this licence, visit http://creativecommons.org/licenses/by/4.0/.
About this article

Cite this article
Haist, M., Link, J., Nicia, D. et al. Interlaboratory study on rheological properties of cement pastes and reference substances: comparability of measurements performed with different rheometers and measurement geometries. Mater Struct 53, 92 (2020). https://doi.org/10.1617/s11527-020-01477-w
Received:
Accepted:
Published:
DOI: https://doi.org/10.1617/s11527-020-01477-w