Abstract
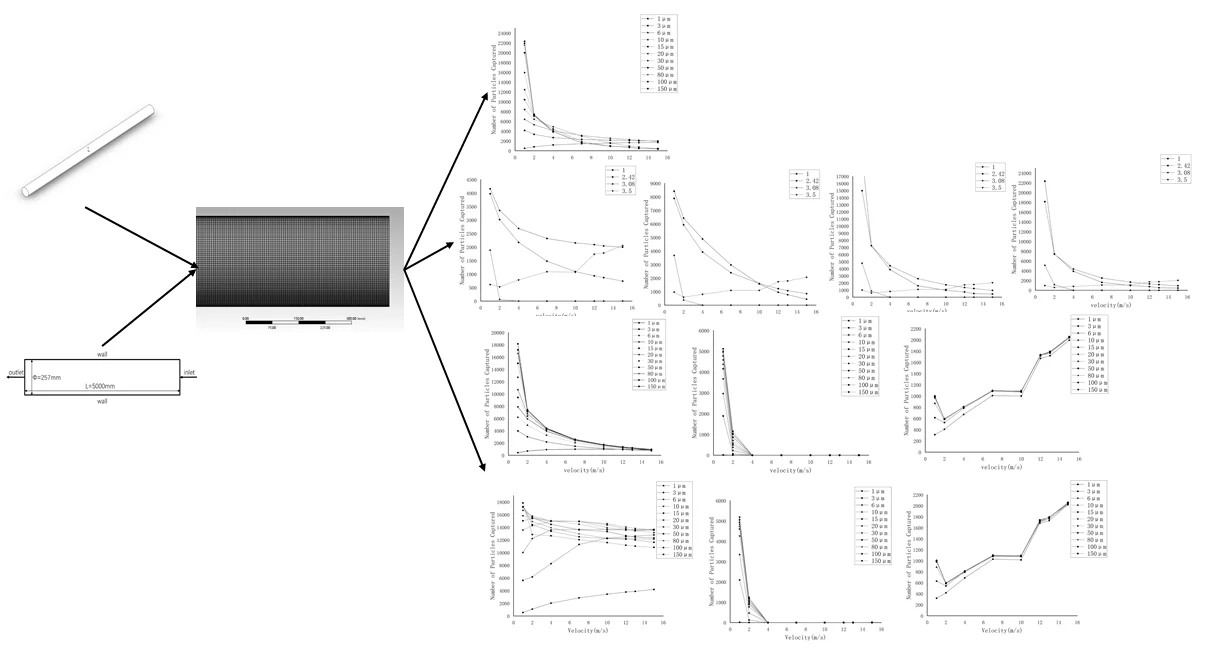
In this paper, a mathematical model for the pneumatic transport of micron silica particles in the dust removal pipeline is established, and the gas-solid two-phase flow in the pipeline is numerically simulated. This paper is mainly based on the FLUENT fluid simulation module in ANSYS WORKBENCH to simulate the motion behavior of particles in the pipeline, and obtained the penetration rate (particle deposition rate in pneumatic conveying) of silica particles in the horizontal straight pipe under different gas flow rates. In the numerical simulation, the influence of particle diameter, shape, lift and other factors on silica particles was considered. Under a large number of simulation conditions, the movement laws of micron silica particles in horizontal pipe pneumatic transport were obtained, and the influence of the above factors on the movement laws of the particles were determined.
Highlights
- Use Fluent to simulate the motion behavior of micron particles in a horizontal straight pipe.
- The movement law of micron-sized particles in horizontal straight pipes at different flow rates is obtained.
- The movement laws of particles of different shapes in the horizontal straight pipe are obtained.
- It is determined that the lift force on the motion state of micron-sized particles cannot be ignored.
1. Introduction
Pneumatic conveying refers to a conveying method of conveying particles or powders in a pipe by a gas (air or other gases) with pressure and initial velocity [1]. In addition to being used on large industrial assembly line equipment, this technology is increasingly being used in equipment dust removal systems to remove impurities from the system. Computational Fluid Dynamics provides a more convenient and efficient method for complex models [2]. At the same time, the results of simulation can represent the target data intuitively, which can save a lot of time for large engineering projects. The discrete particle model (DPM) is used to simulate the particle load flow with a volume fraction below 10 %-12 %. In this paper, the pipeline where the flow is fully developed in the pneumatic transportation is taken as the analysis object. In the analysis, the DPM was used to simulate the pipe, considering the gas-solid two-way coupling, and the deposition phenomenon of particles during transportation was analyzed.
2. Models and simulation methods
2.1. Model and meshing
The research object of this paper is a pneumatic conveying pipeline in a large-scale purging system, with a total length of 50 m and 8 inlets. The outer diameter of the pipeline is 273 mm, the inner diameter is 257 mm, and the wall thickness is 8mm. The pipe section with a length of 5 m at the fully developed section is taken for research. The fluid domain is shown in Fig. 1, and the plane schematic diagram of the fluid domain is shown in Fig. 2.
Import the fluid domain into the MESH module of ANSYS to divide the mesh, and the mesh type is Hexahedral. After grid independence verification and consideration of the number of incident particles, the mesh size was selected as 6mm. In order to calculate the fluid flow state at the boundary layer better, the wall mesh is refined, and the setting parameters of the boundary layer were shown in Table 1. After grid division, the number of cells is 12966156, and the number of nodes is 3200058. The mesh model is shown in Fig. 3. and Fig. 4.
Fig. 1The model of fluid domain
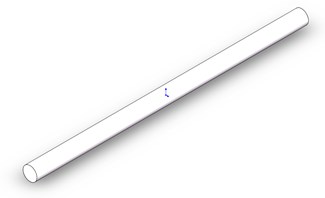
Fig. 2Schematic diagram of fluid domain
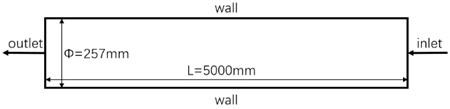
Fig. 3Mesh of inlet and outlet
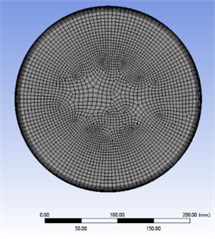
Fig. 4Mesh of the wall
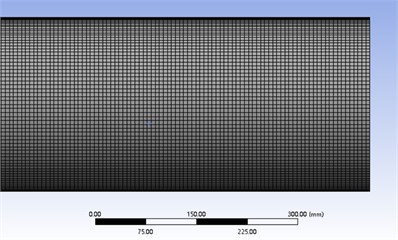
Table 1Boundary layer parameters
Boundary layer position | Growth rate | Number of boundary layer layers | Transition mode |
Pipe wall | 1.2 | 8 | 1:1 |
2.2. Model hypothesis and boundary condition settings
The research object of this paper is the gas-solid two-phase flow in a horizontal pipe with micron particles. Considering the particle diameter and mass flow rate is small, the following assumptions are made for the research process: (1) Taking silica particles ( as the research object, ignore the effects of other forces on the particles, and only consider the effects of gravity and lift [3]; (2) The gas phase in the pipeline is Newtonian fluid, and the two phases of gas and solid are continuous in flow and coexist in space; (3) Ignoring the velocity difference between the gas phase and the solid phase; (4) The diameter of the particles are equal within the same inlet jet.
Boundary condition settings: (1) Inlet boundary: In the simulation, the velocity inlet is used as the boundary condition. Specification Method: Intensity and Hydraulic Diameter. (2) Outlet boundary: Outlet boundary use outflow, the normal gradient of any physical quantity at the exit of the flow field along the exit surface is zero. (3) Wall boundary: The pipe wall adopts wall boundary, which means that the airflow velocity at this wall is always zero. (4) Calculation model: The turbulence - model includes Standard - model, RNG - model and Realizable - model [4]. This paper adopts the RNG - turbulence model. The DPM model is selected as the two-phase coupling, and particles of the same diameter are injected through the inlet surface. The random walk model is selected as the turbulent diffusion model [5]. Select Reflect model at the inlet, and the particles bounce back to the calculation domain without energy loss after collision; select Escaped model for the outlet, and the particle will leave the calculation domain once it reaches this point and no longer be calculated; Trap model is selected on the pipe wall, particles will adhere to the wall immediately after collision and will not enter the fluid domain for calculation.
The equations of the RNG - model [6]:
where, is the dynamic viscosity coefficient; is the viscosity coefficient; is the effective viscosity coefficient; is the sub-velocity of the fluid in three directions; is the average stress term; is the physical force term; and are and Turbulence Parndtl number respectively. The standard values of the coefficients in the RNG - model are shown in Table 2 [7].
Transport equation of solid phase [8]:
where, is the void fraction; ρ is the density; is the volume fraction of the solid phase; the subscripts , are respectively the gas and the solid phases; is the drag coefficient between the gas and solid phases; is the turbulent kinetic energy generation term of the gas phase; is the solid turbulent kinetic energy production term; is the average velocity; and are turbulent dynamic viscosities in gas and solid phases.
Table 2Standard values of various coefficients of RNG k-ε model
0.085 | 0.719 | 0.719 | 1.42 | 1.68 | 0.0/1.42 | –0.387 | 4.38 | 0.012 |
3. Simulation results and result analysis
3.1. Evaluation criteria for results
Due to the small concentration of transported, the concentration difference between the inlet and outlet can only reach the magnitude of 10-22. Therefore, the pneumatic conveying characteristics of particles are described by the penetration rate. According to the definition of the penetration rate of the elbow:
where, is the number of particles passing through the outlet of the elbow in the time of (0.1-0.3 s), and is the number of particles passing through the inlet of the elbow in the time of [9]. Similarly, the penetration rate of the straight pipe is defined as:
where, is the number of particles passing through the outlet of the straight pipe in the time of (0.1-0.3 s), and is the number of particles passing through the inlet of the straight pipe in the time of .
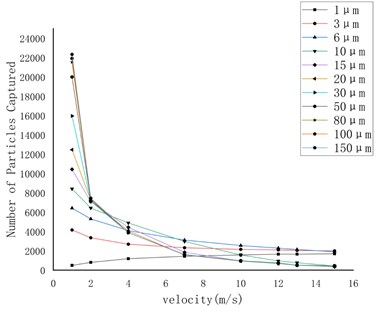
In order to explore the transport characters of micron particles under different gas flow rates, while considering the influence of shape factors and lift factors, 11 kinds of particles were selected with diameters of 1, 3, 6, 10, 15, 20, 30, 50, 80, 100, 150 (unit: μm). The flow velocities were selected as follows: 1, 2, 4, 7, 10, 12, 13, 15 (unit: m/s), a total of 8 gas flow velocities. The shapes were selected as: spherical particles, spherical particles with rough surface, elliptical particles and irregular particles, and the particle shape was realized by the correction coefficient [10].
3.2. The effect of gas flow rate on particle transport characteristics
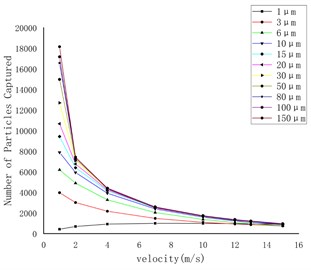
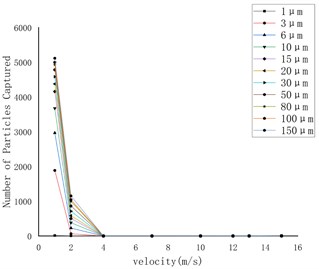
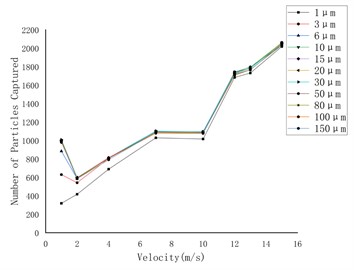
The data of particles with different diameters were plotted in the same chart, as shown in Fig. 5. To some extent, the number of particles captured on the wall is the degree of deposition during particle transport (the number of particles injected each time is the same, 38370).
In Fig. 5, as the flow rate increased, the number of particles captured on the wall increased for particles with 1 μm diameter, while the number of particles captured on the wall decreased for particles with other diameters. This phenomenon becomes more obvious with the increase of particle diameter.
Fig. 5The relationship between the number of particles of different sizes captured on the wall and the flow velocity under the action of gravity
3.3. Influence of shape on particle conveying characteristics
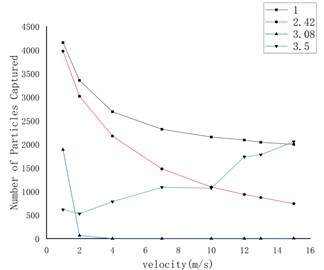
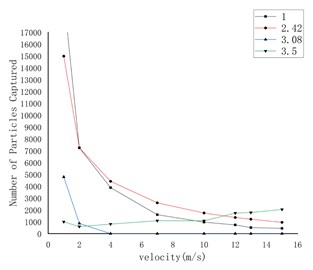
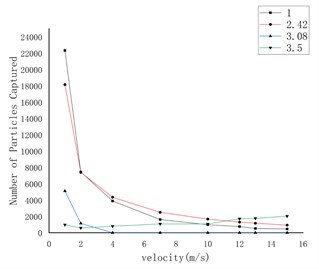
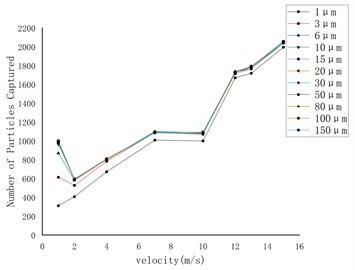
Different particle shapes are plotted in the same chart, as shown in Fig. 6. Since there are too many working conditions to analyze one by one, the particles with diameters of 3, 10, 50 and 150 (unit: μm) that are only affected by gravity are selected as the research objects.
By comparing the figures, it can be found that particles with different diameters all show the same motion characteristics under the four shapes: with the increase of the flow rate, the number of the spherical (smooth, rough) particles caught on the wall decreases gradually, and the particle deposition phenomenon decreases gradually, and finally stabilizes around a certain value. The number of captured elliptical particles on the wall shows a good downward trend when the gas flow rate is very small. When the flow rate reaches 4 m/s, it can be considered that the particles are no longer captured and the particles are no longer deposited. The number of captured irregular particles on the wall decreases first and then increases with the increase of the flow velocity.
3.4. Influence of lift force on particle conveying characteristics
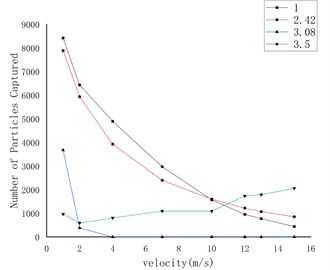
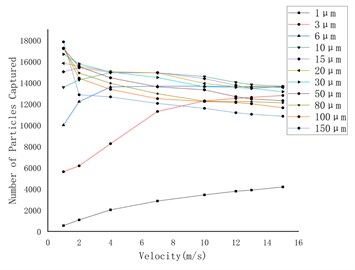
Compared with Fig. 5, in Fig. 7, due to the influence of lift, the number of particles captured on the wall has increased a lot compared to when only gravity is considered. The number of particles captured on the wall with a diameter of 15 μm and below increases with the flow velocity. For the particles diameter larger than 15 μm, the number of particles captured on the wall decreases with the increase of flow velocity, but the rate of decrease is slower.
Fig. 6The relationship between the number of particles captured on the wall and the flow velocity under different shape factors
a) 3 μm
b) 10 μm
c) 50 μm
d) 150 μm
Fig. 7The relationship between the number of particles captured on the wall and the flow velocity under gravity and lift force
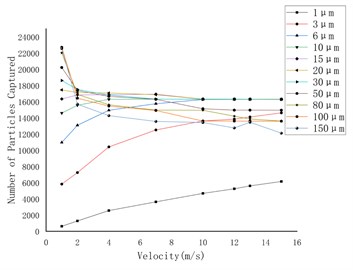
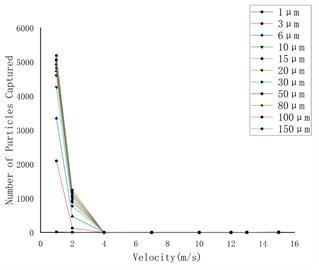
Fig. 8 shows the curve of the number of particles captured on the wall under the conditions of gravity and gravity lift. The first three pictures are only under the action of gravity, and the last three pictures are under the combined action of gravity and lift. Through comparison, it can be found that lift has the greatest effect on rough spherical particles, while it has almost no effect on round particles and irregular particles.
Fig. 8Capture data of different shapes of particles with or without lifting force on the wall
a) Rough spherical particles
b) Oval particles
c) Irregular particles
d) Rough spherical particles
e) Oval particles
f) Irregular particles
4. Conclusions
According to the result of the analysis, there are four conclusions as follows:
1) In this paper, the motion law of pneumatic conveying of micron particles in horizontal pipe is determined, which provides a theoretical basis for determining the optimal conveying speed.
2) Particles of different shapes have the same law of motion under different particle diameters, and the amount of particles deposited only changes in a small range.
3) Lift has a greater impact on the deposition of spherical particles (smooth, rough), and has less impact on elliptical and irregular-shaped particles.
4) Lift force is an important factor in the process of pneumatic conveying of micron particles.
References
-
Alkassar Yassin, et al. Analysis of dense phase pneumatic conveying of fly ash using CFD including particle size distribution. Particulate Science and Technology, Vol. 39, Issue 3, 2021, p. 322-337.
-
Faris A. F. A., et al. Propeller design and performance evaluation by using computational fluid dynamics (CFD): a review. Journal of Aeronautics, Astronautics and Aviation, Vol. 53, Issue 2, 2021, p. 263-274.
-
Tashiro H., Peng X. J., Tomita Y. J. Numerical simulation for prediction of saltation velocity for gas-solid two-phase flow in a horizontal pipe. Transactions of the Japan Society of Mechanical Engineers Series B, Vol. 61, Issue 589, 1995, p. 3210-3214.
-
Koca A. I., Khalaji M. N., Kotcioglu I. S. Investigation of numerical analysis velocity contours k-ε model of RNG, standard and realizable turbulence for different geometries. International Journal of Innovative Research and Reviews, Vol. 3, Issue 2, 2019, p. 29-34.
-
Bourret R. C. Turbulent diffusion in two and three dimensions by the random-walk model with memory. Canadian Journal of Physics, Vol. 39, Issue 1, 1961, p. 133-140.
-
Jeong U. Y., Koh H. M., Lee H. S. Finite element formulation for the analysis of turbulent wind flow passing bluff structures using the RNG k-ε model. Journal of Wind Engineering and Industrial Aerodynamics, Vol. 90, Issue 3, 2002, p. 151-169.
-
Koutsourakis N., Bartzis J. G., Markatos N. C. Evaluation of Reynolds stress, k-ε and RNG k-ε turbulence models in street canyon flows using various experimental datasets. Environmental Fluid Mechanics, Vol. 12, Issue 4, 2012, p. 379-403.
-
Srivastava A., Sundaresan S. Analysis of a frictional-kinetic model for gas-particle flow. Powder Technology, Vol. 129, Issue 3, 2003, p. 72-85.
-
Sippola M. R., Nazaroff W. W. Particle deposition in ventilation ducts: connectors, bends and developing turbulent flow. Aerosol Science and Technology, Vol. 39, Issue 2, 2005, p. 139-150.
-
Cheng K. Q. Performance of powder and granular material and their pneumatic conveying characteristics (to be continued). Sulphur Phosphorus and Bulk Materials Handling Related Engineering, Vol. 6, Issue 1, 2004, p. 13-25, (in Chinese).
Cited by
About this article

