Efficient Generation of Tyrosine Hydroxylase-Expressing Dopamine- Producing Neurons from Rat Peripheral Blood Progenitors Using a Combination of Growth Factors and Biomimetic Matrix
Article Information
Prabha Prakash1, Rahul Rajan1, Ayswaria Deepti1, Ajith Vengellur1, Unnikrishnan Sivan1, Baby Chakrapani PS1*
1Centre for Neuroscience, Department of Biotechnology, Cochin University of Science and Technology, Cochin, Kerala, India
*Corresponding author: Baby Chakrapani PS, Centre for Neuroscience, Department of Biotechnology, Cochin University of Science and Technology, Cochin, Kerala, India.
Received: 07 December 2022; Accepted: 15 December 2022; Published: 16 March 2023
Citation: Prabha Prakash, Rahul Rajan, Ayswaria Deepti, Ajith Vengellur, Unnikrishnan Sivan, Baby Chakrapani PS. Efficient Generation of Tyrosine Hydroxylase-Expressing Dopamine-Producing Neurons from Rat Peripheral Blood Progenitors Using a Combination of Growth Factors and Biomimetic Matrix. Archives of Clinical and Biomedical Research 7 (2023): 191-206.
View / Download Pdf Share at FacebookAbstract
Parkinson's disease (PD) is a neurodegenerative disorder that affects dopaminergic neurons of the substantia nigra, with a prevalence of 1 in 500 individuals. Current pharmacological therapies targeting PD are shown to be ineffective in the long run, and cell therapy is contemplated as an effective therapy for PD. Allogenic cell therapies have their drawbacks as the patient depends on life-long immunosuppressants. Here, we developed a protocol for trans-differentiating the adult rat blood progenitor cells into Tyrosine Hydroxylase (TH) expressing dopamine-producing neurons using specific culture conditions for PD therapy. We identified that bFGF and CDNF, combined with a fibrin matrix, played a crucial role in the trans-differentiation process. Our results demonstrate that during trans-differentiation, the cells expressed markers for cell proliferation (Ki67), neuronal stem cell marker (Nestin), dopaminergic precursor marker (Nurr1), a dopaminergic neuronal marker (TH) and synaptophysin (Syn); a synapse formation marker in a timedependent manner. The production of Dopamine confirmed the functionality of differentiated cells by ELISA. Synaptophysin expression validates their potential to form new synapses, and TH expression confirmed by western blotting ascertains the dopaminergic neuronal lineage. This study proposed a translatable methodology for personalized cell therapy for PD patients.
Keywords
Parkinson's disease; neurodegenerative disorder; substantia nigra; Tyrosine Hydroxylase; fibrin matrix; trans-differentiation
Parkinson's disease articles; neurodegenerative disorder articles; substantia nigra articles; Tyrosine Hydroxylase articles; fibrin matrix articles; trans-differentiation articles
Article Details
1. Introduction
Parkinson's Disease (PD) is a chronic neurodegenerative condition marked by the progressive loss of dopaminergic neurons in the brain's substantia nigra pars compacta (SNpc). This, in turn, results in dopamine deficiency leading to motor and non-motor clinical manifestations. The typical Parkinsonian symptoms include motor [1] and non-motor dysfunction, affecting the patient's quality of life [2]. The Global Burden of Disease (GBD) reports that the incidents of PD were 6.1 million in 2016 and are estimated to increase to 8.1 million by 2030 [3]. In this scenario, formulating an effective treatment for PD is vital for society. Various pharmacological and non-pharmacological treatment strategies were developed for PD. Among pharmacological approaches, Levodopa remains a "gold standard" for providing symptomatic relief to PD patients. The advantage of pharmacologic therapy is that it is less invasive and effective for a shorter duration. But the major drawback of Levodopa is that the more prolonged treatment leads to dyskinesia, which is characterized by adverse involuntary movements [4]. Deep brain stimulation and thermocoagulation have also been used as treatment strategies for PD [5]. However, the symptoms get exacerbated over time [6]. To overcome the drawbacks of existing pharmacological approaches, scientists focused on regenerative or cell therapy, ensuring the restoration of damaged tissues in the desired manner. Different kinds of allogeneic cells ranging from fetal cells to stem cells are used for regenerative therapy for PD [7,8]. But Allogeneic cell therapy has certain disadvantages, such as the patient's dependence on lifelong immunosuppression [9]. In this scenario, the importance of autologous stem cells came into play. The convenience of collecting blood with minimal invasiveness, the same genetic constitution, the presence of distinct stem cell populations and the possibility for extended storage periods. These characteristics make blood a suitable candidate for isolating stem cells. Another exciting feature of blood-derived stem cells is their reprogramming ability to generate induced Pluripotent stem cells (iPSCs). But the use of retrovirus for generating iPSCs restricts their application in transplantation [11]. The generation of neurons from peripheral blood progenitors remains challenging. The limited yield of blood progenitors from peripheral blood makes the trans-differentiation process difficult [11]. Further, the trans-differentiation process should yield homogenous dopamine-producing neuronal cells for transplantation. Here, we report the efficient generation of TH-positive dopaminergic neurons from adult rat Peripheral Blood Mononuclear Cells (rPBMNCs) using growth factor combinations and a biomimetic matrix. This approach can be easily translated to clinics where blood can be taken with minimal invasiveness, and differentiation can be induced to generate dopamine-producing neurons for transplantation.
2. Materials and Methods
2.1 Animals
Forty male Sprague Dawley rats (SD) (Age: 5 months; weight: 326±10.2 g (Mean±SD) ) were used in the study after getting approval from Institutional Animal Ethics Committee CUSAT. The animals were purchased from Small Animal Breeding Station, Mannuthy, and they were acclimatized for a minimum of 5 days at the Small Animal Facility, Department of Biotechnology, CUSAT. All the experiments were carried out as per the CPCSEA India guidelines and regulations.
2.2 Isolation of Peripheral Blood Mononuclear Cells (PBMNCs) from Rat Blood
Rats were anaesthetized by carbon dioxide exposure, and the peripheral blood was taken by cardiac puncture and collected into EDTA-coated vacutainers. The blood was then double diluted using Phosphate Buffered Saline (PBS, pH 7) and layered onto Histopaque 10831 (Cat. No. 10831-100 ml, Sigma) [for 6 ml diluted blood, 3 ml of Histopaque 10831 was used]. It was centrifuged at 400g for 30 minutes at room temperature using a bucket centrifuge. After centrifugation, the buffy coat layer above the Histopaque layer was taken and washed with 9 ml of PBS (for 1 ml of buffy coat layer) at 1500 rpm for 5 minutes at room temperature using a bucket centrifuge. The cell pellet obtained was then resuspended in 1 ml of culture media and seeded onto culture plates accordingly.
2.3 The proliferation of Adult rat PBMNCs in Complete Neurobasal a Medium
To determine the proliferation potential of rPBMNCs in Neurobasal A medium, different cell numbers (500, 1000, 2000, 4000, 8000, and 16,000 cells) in 100 µl volume were seeded into 96 well plates and incubated at 37°C and 5% CO2 in a carbon dioxide incubator. The complete Neurobasal A (Cat. No. 10888022, Thermo Scientific) medium comprising 1% B27 (Cat. no. 17504044, Thermo Scientific), 20mM Glutamine (Cat. No. 25030081, Sigma), 20 ng/ml basic Fibroblast growth factor (bFGF) (Cat. No.100-18B, Peprotech), 20 ng/ml epidermal growth factor (EGF) (Cat. No. 315-09, Peprotech), 1X Glutamax (Cat. No. 35050061, Thermo Scientific) and 1X Pen/Strep (Cat. No. 15140122, Thermo Scientific) was used for the study. The cell morphology was analyzed systematically using a phase-contrast microscope (Nikon Ti2A, Japan). The proliferation of PBMNCs at 0, 4, 8, and 12 days was determined by MTT assay. On respective days, 20 µl of MTT reagent (Cat. No. TC191, Himedia) was added to each well and incubated for 4 h under standard culture conditions. After 4 h, 100 µl of 10 % Sodium dodecyl Sulphate (Cat. No. L3771, Sigma) was added and incubated overnight in a CO2 incubator, and the readings were taken at 570 nm using a multimode plate reader (Tecan, Germany). The complete Neurobasal A medium was kept blank. The intensity of colour correlates with the proliferation of rPBMNCs.
2.4 Effect of Matrix Components in the Proliferation of rPBMNCs
To determine the effect of matrix components on rPBMNC survival and proliferation, rPBMNCs (1000 cells/ml) were seeded onto various concentrations of Fibrinogen (10 mg/ml, 20 mg/ml), Thrombin (20 IU, 80 IU), and the fibrin matrix was formed by mixing fibrinogen and thrombin at 1:2 and 1:4 ratios respectively. The cell morphology was analyzed periodically using a phase-contrast microscope (Nikon Ti2A, Japan). The proliferation of rPBMNCs at 0, 4, 8, and 12 days was determined by MTT assay. On respective days, 20 µl of MTT reagent (Cat. No. TC191, Himedia) was added to each well and incubated for 4 h under standard culture conditions. After 4 h, 100 µl of 10 % Sodium dodecyl Sulphate was added and incubated overnight in a CO2 incubator, and the readings were taken at 570 nm using a multimode plate reader (Tecan, Germany). The uncoated TCPS was kept in control, and the complete Neurobasal A medium was blank.
2.5 Growth Factor-induced Differentiation Screening
Differentiation of rPBMNCs to neuronal lineage was performed in Neurobasal A medium containing different growth factor combinations. 106 rPBMNCs were seeded onto fibrin-coated 24-well plates and cultured under standard culture conditions. Based on the literature, ten growth factors were selected and screened for their potential for inducing TH-positive neuronal differentiation. The growth factors included in the study are 20 ng/ml Brain-Derived Neurotropic Factor (BDNF) (Cat. No. 450-02, Peprotech), 20 ng/ml Cerebral Dopamine Neurotropic factor (CDNF) (Cat. No. 450-05, Peprotech), 20 ng/ml Ciliary Neurotropic Factor (CNTF) (Cat. No. 450-50, Peprotech), 20 ng/ml Epidermal Growth Factor (EGF) (Cat. No. 315-09, Peprotech), 20 ng/ml basic Fibroblast Growth Factor (bFGF) (Cat. No. 100-18B, Peprotech), 20 ng/ml Glial Derived Neurotropic Factor (GDNF) (Cat. No. 450-10, Peprotech), 20 ng/ml Leukemia Inhibitory Factor (LIF) (Cat. No. 250-02, Peprotech), 20 ng/ml Mesencephalic astrocyte-derived neurotropic Factor (MANF) (Cat. No. 450-06, Peprotech), 20 ng/ml Nerve Growth Factor (NGF) (Cat. No. 450-01, Peprotech) and 100 ng/ml Sonic Hedgehog (SHH) (Cat. No. 100-45, Peprotech). Neurobasal A medium containing 1% B27 (Cat. no. 17504044, Thermo Scientific), 20mM Glutamine (Cat. No. 25030081, Sigma), 1X Glutamax (Cat. No. 35050061, Thermo Scientific), and 1x Pen/Strep (Cat. No. 15140122, Thermo Scientific) was used as the control. Differentiation of rPBMNCs was carried out for 12 days. On the 12th day, the cells were fixed and stained with Anti-Tyrosine Hydroxylase (TH) primary antibody (1:500) (Cat.No. O-AB-33093, Elabscience) followed by Alexa Fluor 594 conjugated Goat anti-rabbit secondary antibody (Cat. No. 111-585-003, Jackson's Immunoresearch) staining. Fluorescent images were taken using Nikon Ti2A fluorescent microscope. Fifteen – twenty images were taken for one coverslip, quantification of TH-positive cells was performed, and a graph was plotted with the percentage of cells on the Y-axis and the growth factors on the X-axis.
2.6 Trans-differentiation of Adult Rat PBMNCs into Dopaminergic Neurons using bFGF (20 ng/ml) and CDNF (20 ng/ml) Combination
106 cells/ml were counted using a haemocytometer and seeded onto fibrin-coated coverslips in a 24-well culture plate and cultured in complete Neurobasal A (1X Glutamax (Stock – 100X) (Cat. No. 35050061), 2mM L-Glutamine (Stock – 200 mM) (Cat. No. 25030081), 1X B27 (Stock – 50X) (Cat. No. 17504044), bFGF (Cat. No. 100-18B, Peprotech), CDNF (Cat. No. 450-05, Peprotech), and 1% Penicillin-Streptomycin solution (Stock - 100X) (Cat. No. 15240096). The culture medium (350 – 500 cu. cm) was changed initially after 24 h and then at a 2-day interval (48 h after the initial medium change). After 12 days, the TH expression was determined by immunocytochemical analysis and quantified by Image J software, NIH.
2.7 RNA Sequencing
rPBMNCs were isolated from five adult SD rats and cultured in a complete neurobasal A medium containing 20 ng/ml bFGF and 20 ng/ml CDNF for 12 days. Undifferentiated rPBMNCs (Day 0) were used as a control. Total RNA was isolated from undifferentiated and differentiated cells and followed by a quality control check by gel electrophoresis, and concentration was analysed by Qubit assay. cDNA library (NEB Ultra RNA Lib Prep kit, Integrated DNA Technologies, USA) was prepared, and the library size was assessed on the Agilent 2100 Bioanalyzer, concentration by Qubit assay. Final quantitation by qPCR and sequencing was performed using the Illumina 2500 platform. The analysis was performed using DAVID online software. The raw sequence data (Day 0 and Day 12) were deposited in NCBI with BioProject accession No. PRJNA862357. RNA sequencing was further validated by Real-Time PCR analysis.
2.8 Immunocytochemical Analysis of Cells at Definite Intervals of Time
Cultured cells at definite periods, 4th day, 8th day, 12th day, and 21st day were fixed with 4 % PFA (Cat. No. TC119, Himedia) for 30 minutes at room temperature, permeabilized with 1% Triton X-100 in PBS (Cat. No. TC286, Himedia) for 1 minute, blocked with 10 % Bovine Serum albumin (BSA) (Cat. No. GRM105, Himedia) in PBS for 20 minutes, and incubated with primary antibody against Anti-Tyrosine hydroxylase (1:500) (Cat.No. O-AB-33093, Elabscience), Anti-Nestin (Cat. No. ab6142, Abcam), Anti-β-III tubulin (Cat.No. MAB1195, R&D Systems), Anti-CD45, Anti-Ki67 (Cat. No. 14-5698-82, Invitrogen), Anti-Nurr1 (Cat. No. N4663, Sigma), Anti-synaptophysin (Cat. No. 611880, BD) at 4°C, overnight. On the next day, the cells were stained with secondary antibody Alexa Flour 488 Anti-Mo IgG (H+L) (Cat. No. 115-545-003, Jackson's Immunoresearch) and Alexa Flour 594 Anti-Rabbit IgG (H+L) (Cat. No. 111-585-003, Jackson's Immunoresearch) accordingly. Finally, the cells were counterstained with DAPI for staining the nucleus (Cat. No. D9542, Sigma) for 30 minutes, and the images were captured using Nikon Ti2A fluorescent microscope. 15-20 images were captured from different areas of an immunostained coverslip for a single marker and were then quantified using ImageJ software Java 1.8.0_345.
2.9 Western Blotting to Confirm Tyrosine Hydroxylase Expression by cells on Day 12
The trans-differentiated cells were scraped off the culture plate and lysed using an SDS Sample lysis Buffer (62.5 mM Tris-HCl ph 6.8; 2% SDS; 10% Glycerol; 50 mM DTT) to extract protein from the cells. Samples were boiled at 95 °C for 5 minutes and loaded in the 8% polyacrylamide gel, and proteins were blotted on a nitrocellulose membrane (Cat. No. SF 108A, Himedia) employing the Semi dry Trans-Blot Turbo apparatus (BioRad, USA). Primary antibody against TH (1:500) (Cat.No. O-AB-33093, Elabscience) was incubated overnight at 4°C in agitation, and Peroxidase AffiniPure Goat Anti-Rabbit IgG (H+L) secondary antibody (1:1000) (Cat. No. 111-035-003, Jackson’s Immunoresearch) were for 45 min at RT. The β-actin is used as the control. The blot was incubated with primary antibody for β-actin (1:1000) (Cat. No. MA1-744, Invitrogen) for 2 h at room temperature and was incubated with Peroxidase AffiniPure Goat Anti-Mouse IgG (H+L) secondary antibody (1:5000) (Cat. No. 115-035-003, Jackson’s Immunoresearch) for 1 h at room temperature. Signal was detected with the ECL Clarity system (BioRad) using the Biorad UV gel documentation system, and the ImageLab software was used to acquire and analyze the data.
2.10 Quantification of Dopamine Production of TH-positive Cells by ELISA
On day 21 of differentiation, the cultured cells were collected and lysed by sonication for 5 minutes and centrifuged at 3000 g for 15 minutes. The cell pellet was removed, and the supernatant was collected and taken for dopamine quantification using Dopamine ELISA Kit (Cat. No. E-EL-0046, Elabscience) according to the manufacturer's instructions.
2.11 Response of differentiated Cells to Excess Dopamine
Growth factor-treated and untreated cells on Day 12 were incubated with 8 mM Dopamine (cat. No. TC281, Himedia) for 3 hours under standard culture conditions. Respective images were taken using a Phase contrast microscope, the number of cells responsive to excess dopamine was counted, and a graph was plotted accordingly.
2.12 Statistical Analysis
All statistical analyses were performed using GraphPad Prism software. An unpaired t-test was used for the analysis of two groups. One-way ANOVA with Tukey's post hoc was used for more than two groups. In all cases, p < 0.05 was considered to be statistically significant.
3. Results
3.1 Screening identified the Role of bFGF and CDNF as Key Players in rPBMNC Trans-differentiation
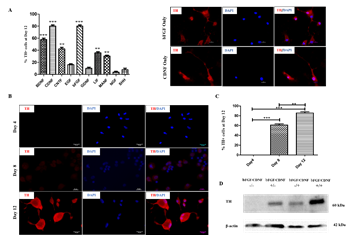
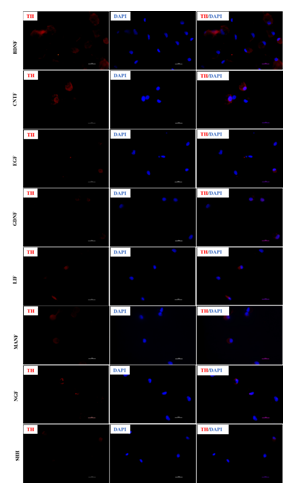
Several studies have shown the effect of different growth factors and their combinations, yielding TH-positive cell populations [11,12,13]. In this regard, we evaluated the trans-differentiation potential of 10 selected growth factors, which specify dopaminergic neuron fate determination (Table 1). After culturing for 12 days in the presence of various growth factors, the cells were fixed and immunostained for analyzing TH marker expression. Day 12 was the optimum time point because Day 8 cultures yielded fewer TH+ cells, and Day 21 did not produce an appreciable increase. rPBMNCs cultured individually using bFGF and CDNF induced 80% TH expression (Figure 1A, B), while the other growth factors showed less than 60% TH positive cells (Supplementary Figure 1). Hence, we analysed whether the combination of bFGF and CDNF enhanced the conversion of rPBMNCs to TH-positive cells. Immunocytochemical analysis on Day 12 indicated that 90% of attached rPBMNCs exhibited a TH+ population (Figure 1C). We further confirmed the TH expression of trans-differentiated cells by Western blotting (Figure 1D). These results suggest that we can generate TH-positive neuronal cells in vitro from rPBMNCs within 12 days under defined culture conditions. Twelve days proved optimal since we observed a decrease in TH expression on 21 days of culture.
|
Sl.No. |
Growth Factor |
The yield of TH-positive cells (from the published literature) |
References |
|
1 |
BDNF |
59.28%, 18.7%, 12.5%, 70%, |
[14, 15, 16, 17] |
|
2 |
bFGF |
22.3%, 28.18% |
[14, 15, 16, 17, 18] |
|
3 |
GDNF |
48%, 3% |
[19,20] |
|
4 |
SHH |
18.6%, 60% |
[18, 19, 20, 21] |
|
5 |
MANF |
Most selective for dopaminergic neurons at low and middle doses (Protection and survival) |
[22] |
|
6 |
CDNF |
Promotes NSC proliferation and differentiation in hypoxic environments |
[23] |
|
7 |
CNTF |
Enhances dopaminergic neurogenesis |
[24] |
|
8 |
LIF |
16 -18% |
[25] |
|
9 |
NGF |
34 – 40% |
[26] |
|
10 |
EGF |
42% |
[27] |
Table 1: Literature review of ten selected growth factors which have a role in dopaminergic neuronal fate determination.
Figure 1: Effect of growth factors on TH neuronal fate determination of rPBMNCs.
(A) Screening of growth factors yielding TH positive cells by Day 12 (n=9) (Scale bar – 50 µm). Data represented as mean ± SD, ** p>0.01, and *** p>0.001. (B) Trans-differentiated rPBMNCs by immunocytochemical analysis identified increased TH protein expression by Day 12 compared to Day 8 and Day 4 (n=9) (Scale bar – 50 µm). (C) Quantification by Image J software revealed that 90 % of the trans-differentiated population expressed TH protein by Day 12 (n=9). Data represented as mean ± SD, ** p>0.01, *** p >0.001. (D) TH protein expression by trans-differentiated cells (using bFGF alone, CDNF alone, and bFGF+CDNF combination) confirmed by Western blot analysis showing 60 kDa band of TH protein (n=2, 10 animals pooled in one sample)). Supplementary Figure 2 represents the complete western blot image developed by the chemiluminescence method.
3.2 Cultural Conditions elevate the Proliferation of rPBMNCs
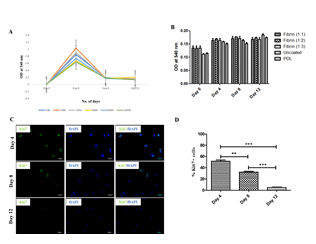
Next, we evaluated the proliferation potential of rPBMNC in vitro under Neural Stem Cell culture conditions. Several groups have reported the conversion of PBMNCs into neurons by involving a proliferative neural stem cell state by using various induced pluripotent stem cell (iPSC) factors [29,30]. To address whether rPBMNCs undergo a proliferation state during trans-differentiation, we assessed the proliferation using an MTT assay under various growth conditions like the seeding density of rPBMNC (Figure 2A) and the effect of different matrix materials (Fibrinogen, Thrombin, Fibrin, PDL) (Figure 2B). To check the proliferation at other time points (day 4, day 8 to day 12), cells were fixed and stained with the proliferation marker Ki67 (Figure 2C). We observed a higher expression of Ki67-positive cells on day 4, and the Ki67-positive cell number decreased after 8 days of culture with growth factors suggesting the differentiation of Ki67 cells into those of neuronal lineage (Figure 2D). Thus, it is confirmed that during the lineage conversion of rPBMNCs, neural progenitor cells existed as transient intermediates which differentiate into postmitotic dopaminergic neurons.
Figure 2: rPBMNCs were capable of survival and proliferation when cultured using a fibrin matrix.
(A) Proliferation of rPBMNCs cultured using bFGF and CDNF showed increased proliferation on Day 4 of culture (n=9). Different coloured lines indicate different seeding densities of cells. (B) Compared the effect of different ratios of fibrin on rPBMNC proliferation, and it does not show a significant difference in rPBMNC proliferation compared with commercially available PDL (n=9). (C) Immunocytochemical analysis using Ki67 confirms increased rPBMNC proliferation on Day 4 compared to Day 8 and Day 12 (n=9) (Scale bar – 50 µm). (D) Quantification of Ki67 identified 52% Ki67 positive cells by Day 4, which decreased by Day 8 (36%) and Day 12 (5%). (n=9) Data represented as mean ± SD, ** p>0.01, and *** p>0.001.
3.3 Transcriptome Analysis of trans-differentiated TH-positive Cells
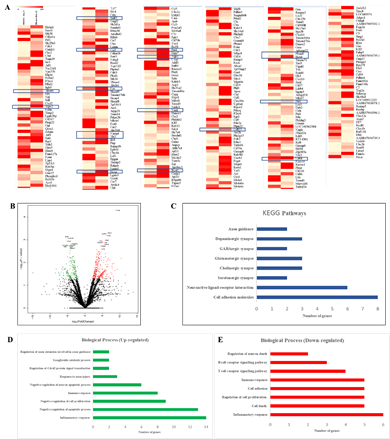
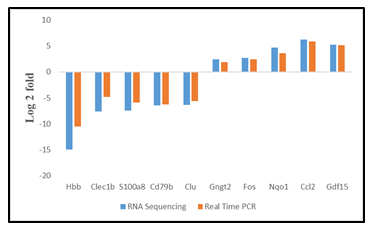
The TH-positivity of cells obtained from rPBMNCs could be due to the changes at the transcriptional level brought about by the activity of bFGF and CDNF. We compared the transcriptome of cultured cells in the presence of bFGF and CDNF (Day 12) with those of rPBMNCs (Day 0) using RNA sequencing (RNA Seq). The differentially expressed genes (DEGs) were identified between TH-positive cells and rPBMNCs, and the expression level changes are depicted as heatmap and volcano plots (Figure 3A, B). Upregulated genes are shown in red, and downregulated genes are shown in green in the volcano plot (Figure 3B). The DEGs accounting for 13% (27 genes) of the genes expressed in differentiated cells (cells after 12 days) correspond to neuron/nervous system development (Supplementary Table 1). 122 genes down-regulated in differentiated cells out of 327 differentially expressed genes. The most down-regulated genes include the Clec1b, a gene expressed in immune cells. Biological pathway analysis with the down-regulated genes revealed depletion of blood-derived cells (Figure 3E). Gene enrichment with Gene Ontology and Molecular pathway analysis with upregulated genes revealed the expression of Gng12, Gngt 2, and c-Fos genes, which signifies dopaminergic lineage conversion of trans-differentiated TH+ cells (Figure 3C, D). Supplementary Table 2 provides the list of genes (17 genes) involved in dopaminergic neuronal differentiation. It signifies that the growth factors, namely, bFGF and CDNF, and the biomimetic matrix helped in the initial selection process of NPCs from rPBMNCs which subsequently proliferated and differentiated into TH-expressing dopaminergic neurons. RNA sequencing (Supplementary Figure 3) was validated using 5 genes (up and downregulated) from the differentially expressed gene list, confirming the expression trend. The sequence of primers used for the RNA seq validation experiment is given in Supplementary Table 3.
(A) Differentially expressed genes in trans-differentiated cells (Day 12) Vs Control (Day 0) represented in the form of a heat map. Five SD rats (for each group) were taken for blood isolation). Rectangle boxes in the heat map highlight the genes associated with dopaminergic neuronal lineage. (B) The volcano plot showing mRNA differential expression between Day 12 trans-differentiated cells and Day 0 control cells. The red (upregulated) and green (downregulated) sites indicate the differentially expressed RNAs with fold threshold ≥1.5 and p-value >0.05. Genes differentially expressed above 2.5 fold with a p-value of >0.05 has been annotated with gene names. (C) KEGG pathway analysis of upregulated genes representing various pathways involved in the differentiated cells. (D) Graph representing the biological processes of upregulated genes by Day 12 of the trans-differentiation process indicating a lineage transition. (E) Graph representing the biological processes of down regulated genes by Day 12 of the trans-differentiation process indicating neuronal lineage commitment of rPBMNCs.
|
Sl. No. |
Gene Name |
GO: BP |
|
1. |
Interleukin 18(Il18) |
Nervous system development |
|
2. |
Palmitoyl-protein thioesterase 1 (Ppt1) |
Nervous system development |
|
3. |
purinergic receptor P2X 4 (P2rx4) |
Sensory perception, Nerve development |
|
4. |
C-C motif chemokine ligand 3(Ccl3) |
Nerve development |
|
5. |
Activated leukocyte cell adhesion molecule (Alcam) |
Axon extension involved in axon guidance, motor neuron axon guidance, neuron projection extension |
|
6. |
ST14 transmembrane serine protease matriptase (St14) |
Neural tube closure |
|
7. |
NAD(P)H quinone dehydrogenase 1(Nqo1) |
Synaptic transmission, cholinergic |
|
8. |
Axl receptor tyrosine kinase (Axl) |
Forebrain cell migration, nervous system development, neuron migration |
|
9. |
Cathepsin Z (Ctsz) |
Regulation of neuron death |
|
10. |
Complement C3(C3) |
Neuron remodelling |
|
11. |
Fos proto-oncogene AP1 transcription factor subunit (FOS) |
Neuron remodelling |
|
12. |
Sulfatase 2 (Sulf2) |
Glial cell-derived neurotrophic factor receptor signalling pathway |
|
13. |
Granulin precursor (Grn) |
Positive regulation of axon regeneration |
|
14. |
Complement C1q A chain (C1qa) |
Neuron remodelling |
|
15. |
Scavenger receptor class F member 1 (Scarf1) |
Neuron remodelling |
|
16. |
Oncostatin M (Osm) |
Peripheral nervous system development |
|
17. |
Peripheral myelin protein 22 (Pmp22) |
Axon development, neuronal action potential |
|
18. |
Growth differentiation factor 15 (Gdf15) |
Glial cell-derived neurotrophic factor receptor signalling pathway |
|
19. |
Apolipoprotein E (Apoe) |
Neuron projection development |
|
20. |
Early growth response 1 (Egr1) |
Regulation of long-term neuronal synaptic plasticity |
|
21. |
Plexin A1 (Plxna1) |
Neuron projection extension, positive regulation of axonogenesis |
|
22. |
Growth arrest-specific 6 (Gas6) |
Neuron migration, Neuron survival |
|
23. |
Syndecan 4 (Sdc4) |
Neural tube closure |
|
24. |
Arylsulfatase B (Arsb) |
Central nervous system development |
|
25. |
Member RAS oncogene family (Rab13) |
Neuron projection development |
|
26. |
Colony stimulating factor 1 (Csf1) |
Axon guidance |
|
27. |
Capping actin protein gelsolin like (Capg) |
Axon guidance |
Supplementary Table 1: List of genes involved in Nervous system development identified by RNA Seq.
|
Sl. No. |
Gene ID |
Gene Name |
Function |
|
1 |
ENSRNOG00000001989 |
Alcam |
A transmembrane protein expressed on ventral midbrain DA neurons and precursors |
|
2 |
ENSRNOG00000003104 |
Trpv2 |
Expressed in dopaminergic neurons |
|
3 |
ENSRNOG00000006052 |
Sulf2 |
Assign specific neural identities to Shh-responding progenitors |
|
4 |
ENSRNOG00000007159 |
Ccl2 |
Promotes differentiation of mDA precursors and neurons |
|
5 |
ENSRNOG00000007650 |
Cd63 |
Tetraspanin (In Protein transport), Uptaken by DA neurons involved in astrocyte-to-neuron shuttle |
|
6 |
ENSRNOG00000008015 |
Fos |
Marker of neuronal activity Expressed by D1 dopaminergic neurons in substantia nigra |
|
7 |
ENSRNOG00000009754 |
Nampt |
Protects DA neurons from oxidative stress |
|
8 |
ENSRNOG00000009822 |
Tlr2 |
Neuroprotective effect in MPTP mouse model of PD |
|
9 |
ENSRNOG00000010252 |
Hexa |
Rescues DA neurons from oxidative stress |
|
10 |
ENSRNOG00000012616 |
Ppt1 |
regulation of Exo/endocytosis, synaptic vesicle recycling and neurotransmission |
|
11 |
ENSRNOG00000012772 |
Nqo1 |
Protects DA neurons from oxidative stress |
|
12 |
ENSRNOG00000013911 |
Nagk |
Dendritic growth and/or branching of neurons |
|
13 |
ENSRNOG00000015514 |
Bcat1 |
For motor neuron function and dopaminergic neuron survival |
|
14 |
ENSRNOG00000019661 |
Gdf15 |
Survival of DA neurons |
|
15 |
ENSRNOG00000025209 |
Plxnd1 |
Synapse formation in striatum |
|
16 |
ENSRNOG00000025274 |
Hexb |
Prevents DA degeneration from the alpha-synuclein formation |
|
17 |
ENSRNOG00000028156 |
Pld1 |
Differentiation of NSCs into neurons |
Supplementary Table 2: Genes involved in dopaminergic neuronal differentiation identified by RNA Seq.
|
Sl.No. |
Genes |
Primer Sequences (5’-3’) |
|
1 |
Gng2 |
FP – GGCCTTGAACACTGACCAGA RP- TCCATCTTCAGCTGCTCGAC |
|
2 |
c-Fos |
FP- TACTACCATTCCCCAGCCGA RP- CTTCCCTGACAGTCACACCC |
|
3 |
Ccl2 |
FP- ACTGGACCAGAACCAAGTGAG RP- AGTGGATGCATTAGCTTCAGA |
|
4 |
Trpv2 |
FP- CGCACTTCCTCTCTCAGTCC RP- TACAGCTGAAACCTCCCGC |
|
5 |
Nqo1 |
FP- GCGAGCGGGGAAAATACTC RP- AATAGCAACAAGTGGGTGGA |
|
6 |
Hbb |
FP- CCATGGTGCACCTGACTGAT RP- AAGGGTAGACAACCAGCAGC |
|
7 |
Clec1b |
FP- CTTCTTGGTGGCGTTTGACG RP- TGTTGCAGAGTGGCTGAGAG |
|
8 |
S100a8 |
FP- AGGCCTTGAGCAACGTCATT RP- TTCTGCACAAACTGAGGGCA |
|
9 |
Cd79b |
FP- TCCTTGGGCTCAGAGACAGA RP- AAAATCGGTGGCTGGTCACT |
|
10 |
Clu |
FP- TCTCAGCAATCGGGTGAAGT RP- CATGGTGTGGCCTCTTTGGA |
Supplementary Table 3: List of primers used for the validation of RNA Sequencing.
3.4 rPBMNC trans-differentiation in Neuronal Culture Conditions using bFGF and CDNF Generates Cells that Express Markers for Progenitors, and Dopaminergic Neurons
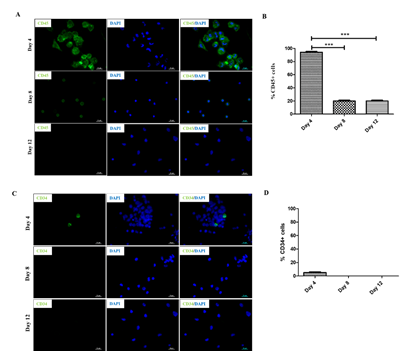
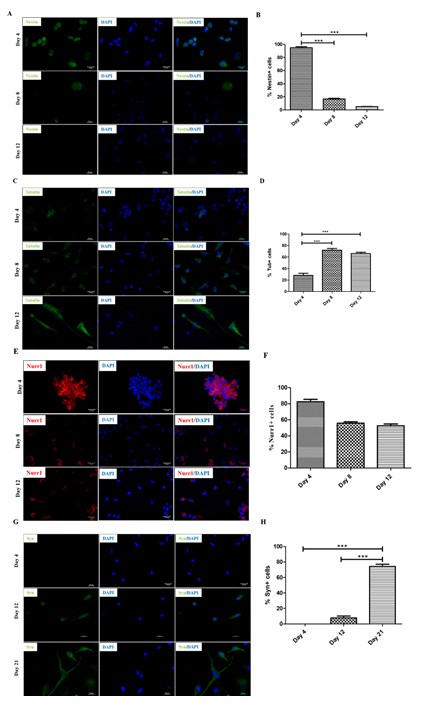
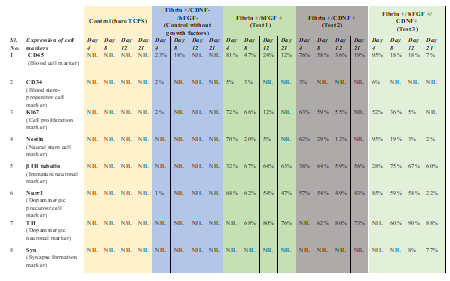
Previous studies have shown that human PBMNCs could be differentiated into neuronal lineage under different in vitro microenvironments. Because culturing rPBMNC under the influence of bFGF and CDNF yielded Ki67-positive proliferating cells, we evaluated whether rPBMNC differentiates into dopaminergic phenotype in vitro through a transient neuronal progenitor cell stage. By day four, cultured rPBMNCs showed expression of blood cell marker CD45 (95%), which reduced to (18%) by day 12 (Figure 4A, B), and CD34 hematopoietic stem cell marker expression was also observed to be higher on day 4 (6%) compared to day 8 and 12 (Figure 4C, D). In addition, the neural progenitor marker Nestin was observed to be higher on day 4 (95%), which then decreased significantly by day 8 (19%) and day 12 (3%) (Figure 6A, B). The expression of immature neuronal marker β-III tubulin was observed to be expressed by day 4 (28%) (Fig.ure 5C, D) in culture, which increased by day 8 (75%) and maintained its expression by day 12 (67%). Also, an increase in dopaminergic progenitor marker, Nurr1 (85%) (Figure 5E, F) was observed by day 4 where the expression persisted until day 12 (58%) with a slight decrease. In contrast to the above observations, an increase in expression of the synapse formation marker, synaptophysin (Figure 5G, H), was observed by day 21 (77%), confirming the cells' ability to form synapses. Our goal was to trans-differentiate rPBMNCs into the dopaminergic lineage precursor cells because these cells have shown excellent integration into the PD brain and thus restore motor functions in PD rat models [31]. Compared with previous protocols [32,33], we could observe a 15-20-fold increase in TH+ cells derived from rPBMNCs within 12 days post-trans-differentiation.
Figure 4: Trans-differentiation of rPBMNCs into dopaminergic lineage involves a stem cell and dopaminergic precursor state.
(A) Blood progenitor cells expressing CD45 were stained by a majority of cells by Day 4, which gradually reduced by days 8 and 12 (n=9). (B) Quantification revealed that 95% of rPBMNCs on day 4 and 20% expressed CD45 by Days 8 and 12, respectively (n=9) (Data represented as mean ± SD, *** p>0.001). (C) CD34, hematopoietic stem cell marker stained relatively few cells by Day 4 and subsequently decreased by Day 8 and Day 12, indicating the blood progenitor differentiation (n=9). (D) Quantification of CD34 positive cells represented as a graph indicates that only 1-2 % of blood progenitors were present in rPBMNCs by Day 4, which became 0 % by Day A8 and 12 (n=9).
Figure 5: Differentiation of rPBMNCs resulted in the expression of neuronal lineage proteins.
(A) Progenitor cell marker (Nestin) expression is found to be more on Day 4, and it gradually decreased by Day 8 and Day 12, which denotes the exit from the progenitor cell state (n=9) (Scale bar – 50 µm). (B) Quantification of Nestin-positive cells depicts that 95% of cells in culture expressed Nestin by Day 4, decreasing to 20% and 5 % by Day 8 and 12, respectively. (n=9) (Data represented as mean ± SD, ***p>0.001). (C) Immature neuronal marker (β-III tubulin) was found to be expressed by Day 4, which increased by Day 8 and maintained its expression by Day 12, which signifies the transition into neuronal lineage (n=9) (Scale bar – 50 µm). (D) Quantification of β-III tubulin positive cell population revealed that 28% of cells in culture expressed the marker by Day 4, increasing to 75% and 67% by Day 8 and 12, respectively. (n=9) (Data represented as mean ±SD, ***p<0.001). (E) Analysis of Nurr1 expression showed an enhancement by Day 4, which then decreased by Day 8, and the expression level was maintained until Day 12 (n=9) (Scale bar – 50 µm). (F) Quantification of Nurr1 positive population indicated ~85% cells were positive by Day 4, which reduced to 60% by Day 8 and continued till Day 12 (n=9). Data represented as mean ± SD. (G) Synaptophysin expression was evident from Day 12, which showed increased expression on Day 21, signifies the cell's ability to make synapses (n=9) (Scale bar – 50 µm). (H) Quantification of Synaptophysin expression revealed a significant increase by Day 21 (n=9) (mean ± SD, ***p>0.001).
3.5 Dopamine production by the differentiated cells confirms the functionality of trans-differentiated cells and excitotoxicity towards dopamine
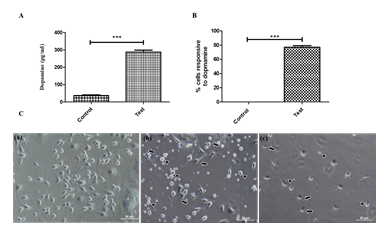
In addition to TH-immunoreactivity, dopamine production and response to excess dopamine (8 mM) are the hallmarks of dopaminergic neurons [34]. The ability of trans-differentiated cells to produce dopamine was analyzed and quantified by ELISA. Quantifying dopamine production by ELISA shows that, on average, 300 picograms of dopamine are made per millilitre of lysate or for 4 mg total protein (Figure 6A), which confirms that TH-positive cells are functionally active. Response of TH-positive dopaminergic neurons to excess dopamine was also performed for 1 hour and 3 hours to determine the functionality of TH-positive neurons. Neurite retraction (denoted by arrows) (Figure 6B) and neuronal death (marked by arrowheads) were observed at time periods of 1 hour and 3 hours, indicating the functionality of trans-differentiated cells. The number of cells showing the retraction was counted and represented in the graph (Figure 6C).
ELISA quantified dopamine production by the trans-differentiated cells indicates the production of dopamine (n=10) (Data represented as mean ± SD, ***p>0.001). (B) Graph representing the number of cells responding to dopamine excitotoxicity (at 3 h), indicating an increased response by the trans-differentiated TH positive cells (n=10) (Data represented as mean ± SD, *** p>0.001). (C) Response of trans-differentiated TH positive cells revealing the functional behaviour to excess dopamine (0 h) Before treatment with 8mM dopamine (1 h) after 1 h of dopamine exposure (3 h) after 3 h of dopamine exposure. (n=10) (Scale bar – 50 µm).
4. Discussion
Currently, the "gold standard" for transplantation therapy in PD is the use of embryonic stem cells (ESCs), where the patient has to be given lifelong immunosuppressants to reduce the risk of immune rejection [35, 36, 37]. Moreover, human fetal tissue procurement is subject to ethical and scientific concerns [38]. Such issues restrict the use of ESCs, thereby limiting possible treatment strategies for PD [36]. Blood is the most convenient source to obtain stem cells from PD patients, which can be stored frozen for later use. Several studies have shown that PBMNCs trans-differentiate in vitro and in vivo into various lineages, specifically from the endo, meso, and ectodermal origins [10]. However, few studies have exploited PBMNCs differentiation into the neuronal lineage [12,13]. In addition, studies have demonstrated that the transplantation of rodent-specific stem cells differentiated into dopaminergic neurons in the PD rat model alleviated the symptoms and enhanced functional restoration [39, 40, 41]. Hence, we explored the possibility of trans-differentiating rPBMNCs into dopaminergic neurons as a strategy for cell replacement therapy for PD. This approach is more feasible since enough PBMNCs can be collected from PD patients, which can be trans-differentiated in vitro, and autologously transplanted into the brain with no risk of immune rejection. During the differentiation process, we observed increased proliferation of cells by Day 4. In addition, the number of TH positive cells increased in a time-dependent manner, with the highest numbers observed by day 12 of differentiation. In accordance with the increase in TH positive cells, we observed an increase in Ki67, NURR1, and Nestin positive cells by day 4, indicating the proliferation of dopaminergic progenitor cells. The expression of hematopoietic stem cell marker CD45 persists after differentiation (~20%), indicating the presence of immature cells that could be differentiated into dopaminergic lineage upon transplantation. CD34, another hematopoietic stem cell marker, expression decreased during differentiation. Thus, the overall sequence of marker expression corresponds to the transition of cells from a "blood lineage" to a "neuronal lineage". The marker expression profile during the differentiation process is summarized in Table 2. The growth factor cocktail could thus yield dopaminergic neurons and protect the neurons upon transplantation into PD patients. Further, mRNA sequencing analysis also supported our hypothesis of conversion of blood progenitor cells into the dopaminergic lineage, where we observed a downregulation of various genes implicated in immune responses (T-cell and B-cell receptor signalling) and an enhancement of biological processes involved in neuronal development (negative regulation of neuron apoptosis and pathways of axon guidance, dopaminergic synapse, neuroactive ligand receptor-ligand interaction, cholinergic synapse, Glutamatergic synapse, Serotonergic synapse and GABAergic synapse). Synaptophysin, the synaptic protein expression indicative of complete differentiation of rPBMNCs were evident by Day 21, which correspond to maximum dopaminergic excitation (revealed by excitotoxicity) and cellular concentration of dopamine. Thus, the differentiation method presented here may contribute to the overall objective of using patient-specific TH-positive dopaminergic neurons capable of restoring lost functions in PD patients.
5. Conclusion
The study demonstrates the trans-differentiation of nestin-positive blood progenitors into TH-positive dopaminergic neurons. The defined fibrin matrix with bFGF and CDNF induced the proliferation of nestin progenitors and produced 90% of dopaminergic neurons in 12 days. Also, the trans-differentiated cells expressed neural-specific proteins such as β III tubulin, TH and synaptophysin. This study gives insights into the hypothesis that a defined matrix material can act as a suitable in vivo matrix for supporting the trans differentiation of patient-specific blood progenitors into the neuronal lineage, thereby supporting the proliferation and differentiation of the transplanted cells in the injured site. However, harvesting premature cells from the blood of PD patients remains a challenge for translating the protocol into clinics.
Declarations
Funding
This work was supported by funding agencies such as KSCSTE, CUSAT seed grant, Department of Health Research, India-HRD grant (NRI/PIO/2020/000007), DST-PURSE and RUSA.
Conflict of Interest
The authors declare no competing interests.
Ethics Approval
This study was carried out following the guidelines and recommendations of the Committee to control and supervise experiments on animals (CPSCEA), New Delhi, India. The protocol was approved by the Institutional Animal Ethics Committee (IAEC) of the Department of Biotechnology, Cochin University of Science and Technology, Cochin (IAEC No. 363/GO/Re/S/01/CPCSEA/03).
Consent to Participate
Not applicable.
Consent for Publication
Authors declare permission for publishing the manuscript entitled “Efficient generation of Tyrosine Hydroxylase-expressing dopamine-producing neurons from Rat peripheral Blood Progenitors using a combination of growth factors and biomimetic matrix” in the journal Archives of Clinical and Biomedical Research.
Availability of Data and Material
All the data generated in this study are included in the main article and supplementary information.
Code Availability
Not applicable.
Author's Contributions
B.C.P.S. and P.P. conceptualized the research work. P.P., R.R., and A.D. performed experiments. P.P., R.R., and A.D. analyzed the data. P.P., B.C.P.S. and U.K.S. wrote the first draft. P.P., B.C.P.S., U.K.S., A.V., and A.D. edited and revised the manuscript draft. B.C.P.S. acquired funding for this research. B.C.P.S., A.V., and U.K.S. supervised the study. All authors reviewed the manuscript.
Acknowledgements
This work was supported by the KSCSTE fellowship (awarded to Prabha Prakash), CUSAT Seed Start-up grant (awarded to Baby Chakrapani P.S.), Department of Health Research, India-HRD (NRI/PIO/2020/000007) grant awarded to Unnikrishnan Sivan, DST-PURSE and RUSA funding.
References
- Jankovic J, Tan EK. Parkinson's disease: etiopathogenesis and treatment. J Neurol Neurosurg Psychiatry. 91 (2020): 795-808.
- Church FC. Treatment Options for Motor and Non-Motor Symptoms of Parkinson's disease. Biomolecules. 11 (2021): 612
- Ou Z, Pan J, Tang S, et al. Global Trends in the Incidence, Prevalence, and Years Lived With Disability of Parkinson's Disease in 204 Countries/Territories From 1990 to 2019. Front Public Health 9 (2021): 776847
- Sethi KD. The impact of levodopa on quality of life in patients with Parkinson disease. Neurologist 16 (2010): 76-83.
- Benabid AL, Krack PP, Benazzouz A, et al. Deep brain stimulation of the subthalamic nucleus for Parkinson's disease: methodologic aspects and clinical criteria. Neurology 55 (2000): S40-44.
- Vitek JL, Bakay RA, Freeman A, et al. Randomized trial of pallidotomy versus medical therapy for Parkinson's disease. Ann Neurol 53 (2003): 558-569.
- Madrazo I, León V, Torres C, et al. Transplantation of fetal substantia nigra and adrenal medulla to the caudate nucleus in two patients with Parkinson's disease. N Engl J Med 318 (1988): 51.
- Han F, Hu B. Stem Cell Therapy for Parkinson's Disease. Adv Exp Med Biol 1266 (2020): 21-38.
- Osborn TM, Hallett PJ, Schumacher JM, et al. Advantages and Recent Developments of Autologous Cell Therapy for Parkinson's Disease Patients. Front Cell Neurosci 14 (2020): 58.
- Zhang M, Huang B. The multi-differentiation potential of peripheral blood mononuclear cells. Stem Cell Res Ther 3 (2012): 48.
- Tara S, Krishnan LK. Bioengineered fibrin-based niche to direct outgrowth of circulating progenitors into neuron-like cells for potential use in cellular therapy. J Neural Eng 12 (2015): 036011.
- Kim S, Honmou O, Kato K, et al. Neural differentiation potential of peripheral blood- and bone-marrow-derived precursor cells. Brain Res 1123 (2006): 27-33.
- Horschitz S, Meyer-Lindenberg A, Schloss P. Generation of neuronal cells from human peripheral blood mononuclear cells. Neuroreport 21 (2010): 185-190.
- Liu Q, Guan L, Huang B, et al. Adult peripheral blood mononuclear cells transdifferentiate in vitro and integrate into the retina in vivo. Cell Biol Int 35 (2011): 631-638.
- Singh M, Kakkar A, Sharma R, et al. Synergistic Effect of BDNF and FGF2 in Efficient Generation of Functional Dopaminergic Neurons from human Mesenchymal Stem Cells. Sci Rep 7 (2017): 10378.
- Park S, Lee KS, Lee YJ, et al. Generation of dopaminergic neurons in vitro from human embryonic stem cells treated with neurotrophic factors. Neurosci Lett 359 (2004): 99-103.
- Borkowska P, Zielinska A, Paul-Samojedny M, et al. Synergistic Effect of the Long-Term Overexpression of Bcl-2 and BDNF Lentiviral in Cell Protecting against Death and Generating TH Positive and CHAT Positive Cells from MSC. Int J Mol Sci 22 (2021): 7086.
- Trzaska KA, King CC, Li KY, et al. Brain-derived neurotrophic factor facilitates maturation of mesenchymal stem cell-derived dopamine progenitors to functional neurons. J Neurochem 110 (2009): 1058-1069.
- Nandy SB, Mohanty S, Singh M, et al. Fibroblast Growth Factor-2 alone as an efficient inducer for differentiation of human bone marrow mesenchymal stem cells into dopaminergic neurons. J Biomed Sci 21 (2014): 83.
- Lara-Rodarte R, Cortés D, Soriano K, et al. Mouse Embryonic Stem Cells Expressing GDNF Show Enhanced Dopaminergic Differentiation and Promote Behavioral Recovery After Grafting in Parkinsonian Rats. Front Cell Dev Biol 9 (2021): 661656.
- Roussa E, Krieglstein K. GDNF promotes neuronal differentiation and dopaminergic development of mouse mesencephalic neurospheres. Neurosci Lett 361 (2004): 52-55.
- Vazin T, Ashton RS, Conway A, et al. The effect of multivalent Sonic hedgehog on differentiation of human embryonic stem cells into dopaminergic and GABAergic neurons. Biomaterials 35 (2014): 941-948.
- Petrova P, Raibekas A, Pevsner J, et al. MANF: a new mesencephalic, astrocyte-derived neurotrophic factor with selectivity for dopaminergic neurons. J Mol Neurosci 2 (2003): 173-188.
- Lin CQ, Chen LK. Cerebral dopamine neurotrophic factor promotes the proliferation and differentiation of neural stem cells in hypoxic environments. Neural Regen Res 15 (2020): 2057-2062.
- Mori M, Jefferson JJ, Hummel M, et al. CNTF: a putative link between dopamine D2 receptors and neurogenesis. J Neurosci 28 (2008): 5867-5869.
- Daadi MM, Grueter BA, Malenka RC, et al. Dopaminergic neurons from midbrain-specified human embryonic stem cell-derived neural stem cells engrafted in a monkey model of Parkinson's disease. PLoS One 7 (2012): e41120.
- Guo L, Yin F, Meng HQ, et al. Differentiation of mesenchymal stem cells into dopaminergic neuron-like cells in vitro. Biomed Environ Sci 18 (2005): 36-42.
- Rolletschek A, Chang H, Guan K, et al. Differentiation of embryonic stem cell-derived dopaminergic neurons is enhanced by survival-promoting factors. Mech Dev 105 (2001): 93-104.
- Martino MM, Briquez PS, Ranga A, et al. Heparin-binding domain of fibrin(ogen) binds growth factors and promotes tissue repair when incorporated within a synthetic matrix. Proc Natl Acad Sci U S A 110 (2013): 4563-4568.
- Matsui T, Takano M, Yoshida K, et al. Neural stem cells directly differentiated from partially reprogrammed fibroblasts rapidly acquire gliogenic competency. Stem Cells 30 (2012): 1109-1119.
- Kim J, Efe JA, Zhu S, et al. Direct reprogramming of mouse fibroblasts to neural progenitors. Proc Natl Acad Sci U S A 108 (2011): 7838-7843.
- Song B, Cha Y, Ko S, et al. Human autologous iPSC-derived dopaminergic progenitors restore motor function in Parkinson's disease models. J Clin Invest 130 (2020): 904-920.
- Cho MS, Lee YE, Kim JY, et al. Highly efficient and large-scale generation of functional dopamine neurons from human embryonic stem cells. Proc Natl Acad Sci U S A 105 (2008): 3392-3397.
- Yang H, Hao D, Liu C, et al. Generation of functional dopaminergic neurons from human spermatogonial stem cells to rescue parkinsonian phenotypes. Stem Cell Res Ther 10 (2019): 195.
- Bellon A, Wegener A, Lescallette AR, et al. Transdifferentiation of Human Circulating Monocytes Into Neuronal-Like Cells in 20 Days and Without Reprograming. Front Mol Neurosci 11 (2018): 323.
- Dunnett SB, Björklund A. Prospects for new restorative and neuroprotective treatments in Parkinson's disease. Nature 399 (1999): A32-9.
- Kordower JH, Goetz CG, Freeman TB, et al. Dopaminergic transplants in patients with Parkinson's disease: neuroanatomical correlates of clinical recovery. Exp Neurol 144 (1997): 41-46.
- Lindvall O, Brundin P, Widner H, et al. Grafts of fetal dopamine neurons survive and improve motor function in Parkinson's disease. Science 247 (1990): 574-577.
- Turner DA, Kearney W. Scientific and ethical concerns in neural fetal tissue transplantation. Neurosurgery 33 (1993): 1031-1037.
- Carvey PM, Ling ZD, Sortwell CE, et al. A clonal line of mesencephalic progenitor cells converted to dopamine neurons by hematopoietic cytokines: a source of cells for transplantation in Parkinson's disease. Exp Neurol 171 (2001): 98-108.
- Sánchez-Pernaute R, Studer L, Bankiewicz KS, et al. In vitro generation and transplantation of precursor-derived human dopamine neurons. J Neurosci Res 65 (2001): 284-288.



 Impact Factor: * 3.1
 CiteScore: 2.9
  Acceptance Rate: 11.01%
  Time to first decision: 10.4 days
  Time from article received to acceptance: 2-3 weeks