The Relations Between Electrocardiographic QRS Duration and Echocardiographic Left Ventricular Dimensions
Article Information
Md. Emran Hossain1, Roksana Islam2, Durul Hoda3, Nuruddin Jahangir4, Mohammad Moinuddin Chowdhury5, Hamidullah Mehedi6*
1Assistant Professor, Department of Cardiology, Chattogram Medical College & Hospital, Chattogram, Bangladesh
2M. Phil, Thesis Part, Department of Physiology, Chattogram Medical College & Hospital, Chattogram, Bangladesh
3Assistant Professor, Department of Cardiology, Shaheed Tazuddin Ahmed Medical College & Hospital, Dhaka, Bangladesh
4Assistant Professor, Department of Cardiology, Chattogram Medical College & Hospital, Chattogram, Bangladesh
5Assistant Professor, Department of Medicine, Chattogram Medical College & Hospital, Chattogram, Bangladesh
6Junior Consultant, Department of Medicine, 250 Bedded General Hospital, Chattogram, Bangladesh
*Corresponding Author: Emran Hossain, Assistant Professor, Department of Cardiology, Chattogram Medical College & Hospital, Chattogram, Bangladesh
Received: 10 August 2021; Accepted: 19 August 2021; Published: 25 August 2021
Citation: Md. Emran Hossain, Roksana Islam, Durul Hoda, Nuruddin Jahangir, Mohammad Moinuddin Chowdhury, Hamidullah Mehedi. The Relations Between Electrocardiographic QRS Duration and Echocardiographic Left Ventricular Dimensions. Cardiology and Cardiovascular Medicine 4 (2021): 435-445.
View / Download Pdf Share at FacebookAbstract
Background: The QRS duration denotes the time for ventricular depolarization. Normally, the QRS duration is 0.06 to 0.10 seconds. The measurement of left ventricular dimensions and the changes of left ventricular function are important to assess cardiac as well as the cardiovascular conditions of patients. We have very limited research-based information regarding the relation between electrocardiographic QRS duration and echocardiographic left ventricular measurements in individuals without heart failure (HF) or myocardial infarction (MI).
Aim of the study: The aim of this study was to assess the correlations between electrocardiographic QRS duration and echocardiographic left ventricular measurements in individuals without heart failure (HF) or myocardial infarction (MI).
Methods: This cross-sectional study was conducted in the Department of Cardiology, University Cardiac Centre, Bangabandhu Sheikh Mujib Medical University, Dhaka over a period of 2 years from July 2008 to June 2010. In total 92 apparently healthy people without heart failure (HF) or myocardial infarction (MI) were included as the study population. Among them, 22 were in Referent (QRS duration <100 ms), 40 in Incomplete BBB (QRS duration 100 - 119), and 30 in Complete BBB (≥120 ms) groups. A pre-designed questioner was used for data collection. Properly written consent was taken from all the participants and this study was approved by the ethical committee of the mentioned university. All data were processed, analyzed, and disseminated by MS Office and SPSS version as per need.
Results: In this study the QRS duration was observed to be linearly correlated with LV mass, LV diastolic dimension, septal wall thickness, posterior wall thickness and left atrial size (r=0.577, p< 0.001; r= 0.480, p< 0.001; r=0.583, p< 0.001; r=0.521, p<0.001 and r=0.418, p<0.001 res
Keywords
Electrocardiographic QRS duration; Echocardiographic left ventricular dimensions; HF; MI
Article Details
1. Introduction
The QRS duration denotes the time for ventricular depolarization. Normally, the QRS duration is 0.06 to 0.10 seconds. The measurement of left ventricular dimensions and the changes of left ventricular dimensions are important to assess cardiac as well as the cardiovascular conditions of patients. We have very limited research-based information regarding the relation between electrocardiographic QRS duration and echocardiographic left ventricular measurements in individuals without heart failure (HF) or myocardial infarction (MI). With the advent of ECG, a revolutionary change in the diagnosis and management of heart diseases was made with a consequent decrease in mortality and morbidity. The broad application of ECG as a screening tool and its easy access has made it one of the most common diagnostic tests performed in routine clinical practice.1 The 12-lead electrocardiogram (ECG) is the most readily available non-invasive test for the detection of cardiac disease.2 Recent advances have extended the importance of ECG in determining the extent and severity of myocardial ischemia, localizing sites of origin and pathways of tachyarrythmias, assessing therapeutic options for patients with heart failure, and identifying and evaluating patients with the genetic disease who are prone to arrhythmias.3 In ECG the P wave is generated by activation of the atria. The PR segments represent the duration of atrioventricular conduction, The QRS complex is produced by activation of both ventricles, and the ST-T wave reflects ventricular recovery.3 Normal ventricular activations is a complex event that is dependent on interactions between the physiology and anatomy of the specialized ventricular conducting system and the ventricular myocardium. The net result is the multiphasic QRS complex. The overall QRS complex may be described as qRS if it consists of an initial small negative wave (the q wave) followed by a tall upright one (The R wave) and a deeply negative one (an S wave).3 The upper normal value for QRS duration is traditionally given as shorter than 120 milliseconds measured in the lead with the widest QRS duration. Women, on average, have a somewhat smaller QRS duration than men (by about 5 to 8 milliseconds).3 A prolonged electrocardiographic QRS duration (≥120 ms) may be a marker of inter or intraventricular mechanical dyssynchrony and has been associated with adverse prognosis in systolic heart failure.4 A wide QRS may be helpful in identifying the presence of interventricular dyssynchrony but it may not be related to intraventricular dyssynchrony.5 Experimental investigations suggest that asynchronous LV contraction (indicated by prolonged electrocardiographic QRS duration) may promote LV remodeling, manifested by increases in wall thickness of late-activated LV segments.4 Prolongation of QRS duration may be the result of LV dilatation, with a concomitant increase in conduction time of the cardiac impulse.4 It is possible that prolongation of the QRS complex is a marker of dyssynchronous LV contraction. Such non-coordinated mechanical contraction of the ventricle results in a redistribution of mechanical load & differential hypertrophy of the late activated LV segments.6 Patients with a prolonged QRS duration (> 0.10s) had lower left ventricular ejection fraction (LVEF) compared to patients with a normal QRS duration. In patients with QRS duration >0.10s, there is a high likelihood that the resting LVEF will be abnormal.7 Prolongation of electrocardiographic QRS interval is found to be associated with increased echocardiographic left-ventricular (LV) mass cross-sectional in individuals without prior history of congestive heart failure (CHF) or myocardial infarction (MI). This observation raises the possibility that prolongation of the QRS duration may be a marker of adverse ventricular remodeling.4 The present study was conducted to find out the correlations between electrocardiographic QRS duration and different echocardiographic measurements (LV mass and diastolic dimensions, septal and posterior wall thicknesses, left atrial size, fractional shortening, and left ventricular ejection fraction) in our population free from heart failure (HF) and myocardial infarction (MI).
2. Objective
General objective:
To observe the correlations between electrocardiographic QRS duration and echocardiographic left ventricular measurements in individuals without heart failure (HF) or myocardial infarction (MI).
Specific objective:
- To find out the correlation between QRS duration and left ventricular mass.
- To study the correlation between QRS duration and left ventricular fractional shortening (LVFS).
- To find out the correlations of QRS duration with left ventricular internal dimensions in diastole (LVIDD) and systole (LVIDS), the thickness of posterior wall and interventricular septum (IVS) at end diastole and left atrial (LA) size at end-systole.
- To determine the association between QRS duration and left ventricular ejection fraction (EF).
3. Methodology and Materials
This cross-sectional study was conducted in the Department of Cardiology, University Cardiac Centre, Bangabandhu Sheikh Mujib Medical University, Dhaka over a period of 2 years from July 2008 to June 2010. In total 92 apparently healthy people without heart failure (HF) or myocardial infarction (MI) were included as the study population. Among them, 22 were in Referent (QRS duration <100 ms), 40 in Incomplete BBB (QRS duration 100 -119), and 30 in Complete BBB (≥120 ms) groups. According to the inclusion criteria of this study healthy people, age between 25 and 80 years are free from heart failure (HF) and myocardial infarction (MI) with proper documents of computerized electrocardiogram (ECG) and 2-D & M-mode echocardiographic variables available were included. On the other hand, according to the exclusion criteria of this study patients with prevalent heart failure, myocardial infarction (MI), digoxin or quinidine use, and history of permanent pacemaker (PPM) implantation were excluded. The demographic variables included in the study were age, sex, BMI, and smoking habit. The clinical variables were systolic BP, diastolic BP, diabetes mellitus (DM), and the use of antihypertensive medications. Data were collected by interview, observation, and clinical examination. Complete medical history, clinical examination, and assessment of cardiovascular risk factors like hypertension and diabetes mellitus, clinical examination, and relevant investigations reports like ECG and echocardiography of all patients were recorded in a pre-designed data collection sheet. All the participants underwent electrocardiographic (ECG) and 2D and M-mode echocardiographic examination. Hypertension was considered if the patient was on oral antihypertensive medication and/or systolic blood pressure >140 mmHg and diastolic blood pressure >90 mmHg. Left ventricular fractional shortening and LVEF were considered as indicators of LV systolic function. Diabetes mellitus (DM) was considered if the patient was on oral antidiabetic medications or had fasting blood glucose >7 mmol/L or two hours after postprandial plasma glucose >11.1 mrnol/L or >200 mg/dl. Cigarette (any amount within first three years), significant smoking history were defined as >10 Pack years of cigarette use. Overweight and obesity were defined according to NIH 1998 Guidelines. All data were processed and analyzed and disseminated by using SPSS version 11.5 and MS Office as per need.
4. Results
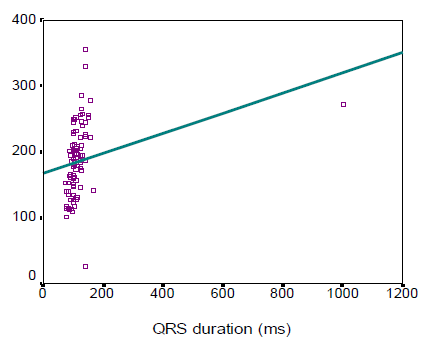
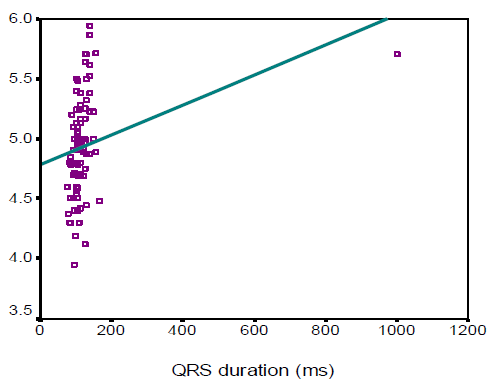
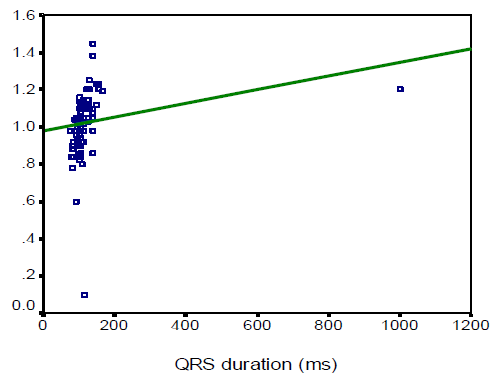
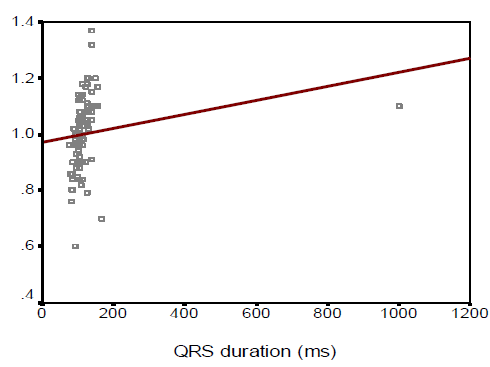
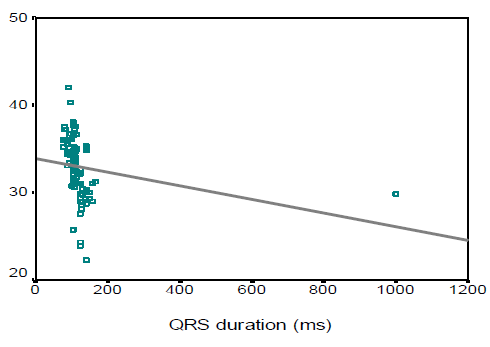
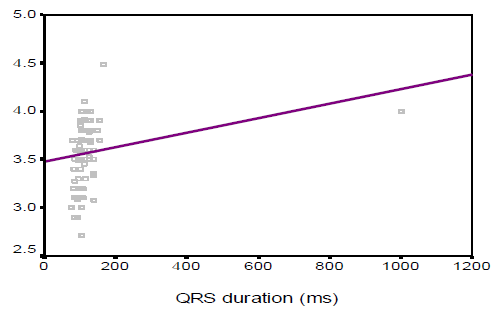
In this study we observed, the ages were almost identically distributed among the three categories of patients based on QRS duration (53.2±11.6, 52.1±7.4, and 55.8 ± 9.4 years respectively, p=0.242). Male patients comprised the main bulk in complete BBB (76.7%), while females were predominant in the referent group (59.1%). The mean (±SD) QRS duration of Referent, Incomplete BBB, and Complete BBB group participants were found 88.3±7.1, 106.9 ± 4, and 162.4±15.8 ms respectively. On the other hand, the mean (±SD) QRS voltages were 1195.4±359.2, 1312.5±390.4 and 1587.7± 942.9 µv respectively. In this study the left ventricular (LV) mass, left ventricular diastolic dimension, septal wall thickness, posterior wall thickness and left atrial size were significantly higher in complete BBB group than those in referent and incomplete BBB group (143.0±30.2 vs. 182.6±37.9 vs. 222.0±61.0, p< 0.001; 4.6±0.3 vs. 4.9±0.3 vs. 5.2± 0.4, p < 0.001; 0.9±0.1 vs. 1.0±0.1 vs. 1.1±0.1, p<0.001; 0.9±0.1 vs. 1.0±0.1 vs. 1.1±0.1, p<0.001; and 3.3 ± 0.3 vs. 3.6 ± 0.3 vs. 3.7 ± 0.3, p<0.001 respectively). However, fractional shortening and left ventricular ejection fraction were found to decrease significantly with the increase in QRS duration (p<0.001 and p< 0.001 respectively). In this study the QRS duration was observed to be linearly correlated with LV mass, LV diastolic dimension, septal wall thickness, posterior wall thickness and left atrial size (r=0.577, p< 0.001; r=0.480, p<0.001; r=0.583, p<0.001; r=0.521, p<0.001 and r=0.418, p<0.001 respectively). However, QRS duration was found to maintain negative correlation with fractional shortening and LVEF (r =-0.637, p< 0.001 and r=-0.701, p<0.001 respectively)
|
Variables |
Referent (n=22) |
Incomplete BBB (n=40) |
Complete BBB (n=30) |
p- value |
|
QRS duration (ms) |
88.3 ± 7.1 |
106.9 ± 4.5 |
162.4 ± 15.8 |
<0.05s |
|
QRS voltage (µv) |
1195.4 ± 359.2 |
1312.5 ± 390.4 |
1587.7 ± 942.9 |
<0.05s |
Table 1: Electrocardiographic variables among participants (N=92)
|
Variables |
Referent (n=22) |
Incomplete BBB (n=40) |
Complete BBB (n=30) |
p- value |
|
LV mass |
143.0 ± 30.2 |
182.6 ± 37.9 |
222.0 ± 61.0 |
<0.001s |
|
LV diastolic dimension |
4.6 ± 0.3 |
4.9 ± 0.3 |
5.2 ± 0.4 |
<0.001s |
|
Septal wall thickness |
0.9 ± 0.1 |
1.0 ± 0.1 |
1.1 ± 0.1 |
<0.001s |
|
Posterior wall thickness |
0.9 ± 0.1 |
1.0 ± 0.1 |
1.1 ± 0.1 |
<0.001s |
|
Fractional shortening |
36.2 ± 2.1 |
33.4 ± 2.9 |
30.1 ± 2.7 |
<0.001s |
|
Left atrial size |
3.3 ± 0.2 |
3.6 ± 0.3 |
3.7 ± 0.3 |
<0.001s |
|
LVEF |
70.9 ± 3.3 |
65.6 ± 5.5 |
58.3 ± 4.5 |
<0.001s |
Table 2: Echocardiographic variables among participants (N=92)
5. Discussion
The aim of this study was to assess the correlations between electrocardiographic QRS duration and echocardiographic left ventricular measurements in individuals without heart failure (HF) or myocardial infarction (MI). The result of the current study demonstrated that age was almost identically distributed among the three categories of patients based on QRS duration (53.2±11.6 in referent, 52.1±7.4 in incomplete BBB, and 55.8 ± 9.4 years in complete BBB group respectively, p=0.242). The complete BBB was significantly common in male patients (76.7%), while females were predominant in the referent group (59.1%) (p=0.029). Overweight and obese subjects were significantly less in the referent group (31.8%) compared to those in incomplete BBB (45%) and complete BBB (76.7%) indicating that overweight and obesity status increases with the increase in QRS duration. Around one-quarter of the subjects was a smoker. Dhingra and associates (2005)4 conducted an almost similar study where, the age distribution of subjects in referent, incomplete BBB and complete BBB group in man 54±14, 51±14, 61±15 years respectively and in woman 55±15, 58±15 and 68±12 years respectively. However, one year after the same investigators reported higher mean age in three groups (70±7, 70±7, and 72±7 years respectively).8 They observed male predominance in incomplete (60%) and incomplete BBB (58%), while the referent group was preoccupied with females (70%). The BMI was almost similar among the subjects with referent, incomplete and complete BBBs. No significant difference was observed among the three groups in terms of smoking habits. Prolonged QRS duration was predominantly observed in male subjects (76.7%) which was also found in the study of Shenkaman et al. (2002).7 In the present study, mean systolic and diastolic blood pressure were almost identically distributed among the three groups. The prevalence of diabetic patients and use of antihypertensive drugs were found highest incomplete BBB group than those in the referent and incomplete BBB group, although the difference did not turn significant. In 2006 Dhingra associates8 reported that systolic BP was highest incomplete BBB group than those in the referent and incomplete BBB group, though diastolic BP was almost similar among the three groups. The mean QRS duration and mean QRS voltage were significantly highest incomplete BBB group than those in the referent and incomplete BBB group. In this regard, Dhingra’s study (2006)8 was almost consistent with the present study (mean QRS duration was 87 ± 7ms in referent, 106 ± 5ms in incomplete BBB, and 140 ±14 ms in complete BBB group). Echocardiographic variables pertaining to LV function revealed that left ventricular (LV) mass, left ventricular diastolic dimension, septal wall thickness, posterior wall thickness, and left atrial size were significantly higher in the complete BBB group compared to the referent and incomplete BBB group. However, fractional shortening and left ventricular ejection fraction were observed to be decreased significantly with the increase in QRS duration. These findings are consistent with the study done by Dhingra et al., (2005)4 who reported a significant association of increased electrocardiographic QRS duration with decreased LV fractional shortening and LV ejection fraction. QRS duration was observed to be linearly correlated with LV mass, LV diastolic dimension, septal wall thickness, posterior wall thickness and left atrial size with correlation coefficients being r=0.577, r=0.480, r=0.583, r=0.521, and r=0.418 respectively. However, QRS duration was found to bear inverse correlations with fractional shortening and LVEF with correlation coefficients being r = - 0.637 and r = - 0.701 respectively. From the “positive R-values,” it is evident that 57.7%, 48%, 58.3%, 52.1%, and 41.8% of the increase in LV mass, LV diastolic dimension, septal wall thickness, posterior wall thickness and left atrial size could be attributed to increasing in QRS duration, while “negative R-values” indicate that 63.7% and 70.1% of the decrease in fractional shortening and LVEF respectively can be explained by variations in QRS duration. Dhingra and colleagues (2005)4 are of the opinion that increasing electrocardiographic QRS duration was positively related to LV mass, wall thickness, and LV diastolic dimension and inversely associated with fractional shortening. All the correlations between QRS duration and echocardiographic variables discussed so far are indicative of left ventricular systolic dysfunction. So, prediction of left ventricular systolic function in apparently healthy subjects without heart failure or MI could be made with the help of a simple easily accessible tool, ECG.
6. Conclusion and Recommendation
The present study revealed that longer electrocardiographic QRS duration was correlated with the increase in LV mass, LV diastolic dimensions, septal wall thickness, posterior wall thickness, and left atrial size. With complete BBB compared with a normal QRS duration, the association was most striking in individuals. Meanwhile, the presence of prolonged QRS in a patient’s ECG can serve as a bedside clue to the presence of decreased fractional shortening and left ventricular ejection fraction. The findings of the study suggest that ECG can serve as a screening tool to predict left ventricular systolic dysfunction in apparently healthy subjects free from congestive heart failure or MI. ECG can be a cost-effective tool for finding out the subjects with systolic dysfunction from a larger population without signs and symptoms of systolic dysfunction. For getting more reliable information we would like to recommend conducting more studies in several places with large sample sizes.
References
- Francia P, Ballac, Paneni F et al. Left bundle- branch block-pathophysiology, prognosis, and clinical management, Clin. Cardiol 30 (2007): 110-15.
- Murkofsy RL, Danges G, Diamond JA, et al. A prolonged QRS duration on surface electrocardiogram is a specific indicator of left ventricular dysfunction. J Amcoll Cardiol 32 (1998): 476-482.
- David M, Mirvis, Ary L. Gold berger. Electrocardiography. Brawnwald's Heart disease. A text book of cardiovascular Medicine, (8th edition), 2008.
- Dhingra R, Ho Nam B, Benjamin EJ, et al. Cross-sectional relations of electrocardiographic QRS duration to left ventricular dimensions: The Framingham Heart study. J Am Coll Cardiol 45 (2005): 685-689.
- Emkanjoo Z, Esmaeilzadeh M, Hadi NM, et al. Frequency of inter -and intra ventricular dyssynchrony in patient with heart failure according to QRS width. Europace 9 (2007): 1171-1176.
- Prinzen FW, Cheriex delhaas T. Asymmetric thickness of the left ventricular wall resulting from asynchronous electric activation: A study in dogs with ventricular pacing and in patients with left bundle branch block, Am Heart J 130 (1995): 1045-1053.
- Shenkaman HJ, Pampati V, Khandelwal AK. Congestive heart failure and QRS duration: establishing prognosis study. Chest 122 (2002): 528-534.
- Dhingra R, Pencina MJ, Wang TJ, et al. Electrocardiographic QRS Duration and the Risk of Congestive Heart Failure, Hypertension 47 (2006): 861.


 Impact Factor: * 3.5
 CiteScore: 2.9
  Acceptance Rate: 14.80%
  Time to first decision: 10.4 days
  Time from article received to acceptance: 2-3 weeks