Modification of the Diabetes Prevention Program Lifestyle Intervention in Persons with Spinal Cord Injury: Efficacy for Reducing Major Cardiometabolic Risks, Increased Fitness, and Improved Health-Related Quality of Life
Article Information
Gregory E. Bigford1,2*, Doug A. Lehmann3, Luisa F. Betancourt1,2, Jennifer L. Maher4, Armando J. Mendez5, Mark S Nash1,2,6
1Department of Neurological Surgery,
2The Miami Project to Cure Paralysis,
3Department of Professional Practice, University of Miami Herbert Business School, Miami USA
4Department of Health, University of Bath, Bath, UK
5Department of Medicine,
6Department of Physical Medicine and Rehabilitation, University of Miami Miller School of Medicine, Miami, USA
*Corresponding Author: Gregory E. Bigford, Department of Neurological Surgery, the Miami Project to Cure Paralysis, USA.
Received: 23 February 2024; Accepted: 04 March 2024; Published: 12 March 2024
Citation: Gregory E. Bigford, Doug A. Lehmann, Luisa F. Betancourt, Jennifer L. Maher, Armando J. Mendez, Mark S Nash. Modification of the Diabetes Prevention Program Lifestyle Intervention in Persons with Spinal Cord Injury: Efficacy for Reducing Major Cardiometabolic Risks, Increased Fitness, and Improved Health-Related Quality of Life. Journal of Spine Research and Surgery. 6 (2024): 06-25
View / Download Pdf Share at FacebookAbstract
Individuals with chronic spinal cord injury (SCI) face elevated risks of cardiometabolic diseases, including cardiovascular disease and type 2 diabetes, due to factors like physical inactivity, neurogenic obesity, and disrupted glucose and insulin regulation. We conducted a prospective intervention cohort study involving 20 individuals with SCI (aged 28-60) with neurologic injuries at levels C4-T10 and ASIA scale grades A-D, lasting over a year. Our study assessed the impact of a therapeutic lifestyle intervention (TLI) based on the Diabetes Prevention Program (DPP) and its maintenance phase. The TLI comprised circuit resistance training, a Mediterranean-style calorie-restricted diet, and tailored behavioral support. Key outcomes measured included cardiometabolic risks (plasma analytes and disease biomarkers), anthropometrics (body mass, BMI, tissue composition), global metabolism, fitness (aerobic capacity, peak strength), and health-related quality of life (SF36). Results demonstrated a significant reduction in body mass and BMI by 7.5%, a 7% decrease in total fat mass, and substantial improvements in glucose regulation and insulin sensitivity. Lipid profiles improved, with reduced total cholesterol, triglycerides, and LDL-C, and increased HDL-C. Resting energy expenditure and fat oxidation increased by 27.4% and 58.5%, respectively. Aerobic capacity and dynamic strength also improved significantly. The Physical and Mental Composite Scores of the SF36 improved by 22.8% and 30.5%, respectively. Following the maintenance phase, several positive outcomes persisted, indicating a reduction in risk for cardiovascular disease and comorbid disorders. Our findings support the effectiveness of TLI in reducing cardiometabolic risks, enhancing fitness, and improving healthrelated quality of life in individuals with chronic SCI.
Trial Registration:
ClinicalTrials.gov, ID: NCT02853149 Registered August 2, 2016.
Keywords
SCI; cardiometabolic disease; therapeutic lifestyle intervention; exercise and fitness; diet and nutrition; metabolism; health; quality of life
SCI articles; cardiometabolic disease articles; therapeutic lifestyle intervention articles; exercise and fitness articles; diet and nutrition articles; metabolism articles; health articles; quality of life articles
Article Details
Introduction
Traumatic spinal cord injury (SCI) is a debilitating event with enduring consequences, including complex and pathological metabolic changes [1]. These include alterations in both body composition[2-8] and energy metabolism [9,10], which, when combined with reduced mobility/physical activity, contribute to the prevalence of conditions such as obesity[5,8,11,12], dyslipidemia[13-19], and insulin resistance [20-22]. These conditions often cluster as a cardiometabolic syndrome (CMS) elevating the risk of diseases like cardiovascular disease (CVD) and type 2 diabetes mellitus in chronic SCI [23,24]. These disorders constitute leading causes of mortality and morbidity in the population [25].
Studies addressing obesity among persons with SCI report prevalence rates that reflect 55% to 95.7% of the population[26-28], and alarmingly, obesity is a sufficient standalone to accelerate CVD [29]. Obesity poses challenges to mobility, independence, and overall well- being [30-32]. Despite the critical need for evidence-based interventions addressing obesity and CMS risks in SCI [33,34], limited options exist.
Conventional rehabilitation strategies emphasize lifestyle modifications such as exercise [35,36] and nutrition [35,37], which have shown some promise in reducing CMS risks such as obesity[38, 39], BMI[30], dyslipidemia[39], insulin resistance.[40-42], and inflammatory correlates of disease [43]. However, given that these strategies have, at best, shown marginal benefit as monotherapies, the current consensus is that a more comprehensive intervention be used. Therapeutic lifestyle intervention (TLI) emphasizes regular physical activity, healthy nutrition, stress management, and educational interventions as key components for weight management and overall health in the SCI population [33].
A previous randomized controlled trial (RCT) of a 12-week ‘weight management’ program in individuals with SCI found improvements in body mass and body mass index (BMI) [30], however, they reported recidivism at post-intervention follow-up. Despite being multi-pronged, this program was primarily didactic, and without a structured exercise program with targeted CMS risk reduction. Recently, our group adapted the TLI that was the framework for the Diabetes Prevention Program (DPP) – based on established benefits of nutrition, exercise, and behavioral weight control – to address the increased risk of developing type 2 diabetes and other CMD’s in the SCI population. Aligned with previous epidemiological findings linking diabetes risk to elevated body weight and BMI levels [44,45], and the positive outcomes of the DPP [46,47], the intervention sought to achieve and sustain a ≥7% weight loss, a threshold known to prevent the onset of type 2 diabetes. Preliminary results indicated that the TLI led to a significant reduction in body mass, surpassing the intervention target, and effectively mitigated component risks associated with CMS and diabetes.[48] These promising results underscore the need for a larger sample population to validate and refine the TLI, expanding the analysis to comprehensively assess CMS risks and associated health parameters.
The overarching objective of this study was to comprehensively assess the efficacy of a DPP-adapted TLI for SCI on (i). mitigating obesity and related CMS risks ii. Improving health- related fitness measures and (ii). Improving health-related quality of life measures. Here we demonstrate in a cohort with chronic SCI, significant whole-body mass and fat mass reductions after TLI, as well as significant improvements in markers of glucose metabolism, lipids, cardiorespiratory fitness, dynamic strength, and both physical and mental composite self- assessment scores associated with health-related quality of life (HRQoL). These important findings suggest the TLI is effective in reducing CMS risks and co-morbid disorders, and should be considered as a first-line rehabilitation strategy to off-set secondary cardiometabolic health complications in SCI.
2. Materials and Methods
The described methods provide a condensed overview of each intervention. Refer to the original protocol publication [49] for the complete and detailed methodology.
Design, Participants, Statement of Ethics
Following presentation of study privacy practices and the Health Insurance Portability and Accountability Act (HIPAA) protections, written and verbal informed consent was obtained from all participants. The protocol was approved by the Human Subjects Research Office, Miller School of Medicine, University of Miami.
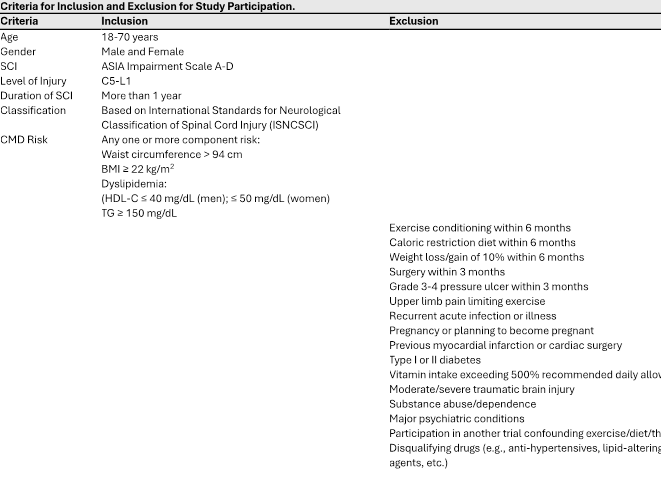
Twenty (20) individuals with chronic SCI were recruited from a rehabilitation and research center at a level 1 trauma center and academic institution between August 2016 and March 2020. We note, the SCI participants represent a subgroup of study participants in the registered trial NCT02853149. We include a range of ASIA Impairment Scale classifications and injury levels enhances the generalizability of the study findings, and a more comprehensive understanding of the impact of the intervention across diverse spinal cord injury profiles. This approach acknowledges the heterogeneity within the spinal cord injury population.
6-Month Lifestyle Intervention
- Supervised exercise intervention: Participants engaged in a circuit resistance training program three times a week on non-consecutive days as previously described.[48-51] Each session lasted approximately 40-45 minutes and included both resistance training (weightlifting) using an Equalizer 7000 multi-station exercise system (Helm; Bozeman, MT, USA), and endurance activities (reciprocal arm exercise, VitaGlide® (VitaGlide, LLC., Rockledge, FL, USA), RehabMed International, or arm crank ergometry, Colorado Cycle) with interposed periods of incomplete recovery (i.e., heart rate not falling to baseline).The training intensity was gradually increased over the weeks based on the 1- Repetition Maximum (1-RM) values calculated during initial strength testing.
- Nutritional intervention: Participants followed an energy-restricted Mediterranean-style diet. Daily energy intake was adjusted to achieve a 500-1000 kcal deficit per day, with a target weekly weight loss of 0.45-0.91 kg or approximately 7% of baseline body mass by the end of the intervention. The diet emphasized fruits, vegetables, whole grains, olive oil, poultry, and fish. The macronutrient composition consisted of 50% carbohydrates, 15% protein, and 35% fat, primarily monounsaturated fats.
- Behavioral intervention: The behavioral intervention involved a 16-session protocol designed specifically for individuals with spinal cord injuries (SCI). The sessions focused on education, problem-solving skills training, and cognitive restructuring. Half of the sessions provided information on nutrition and exercise, while the other half addressed psychological, social, and behavioral challenges to sustaining behavior change. Each participant received a personalized Lifestyle Intervention Manual containing their data, goals, and motivational messages, including a virtual image of themselves at 7% lighter weight.
6-month self-care extension phase:
During the sixth month of the clinical training phase, participants were trained for the extension phase of the intervention. Lifestyle coaches worked closely with participants to explore and choose a training mode that they found engaging and enjoyable. Intensity thresholds were set to replicate those experienced during the clinical phase. Bi-monthly behavioral support sessions were conducted, lasting approximately 1 hour each. These sessions involved data collection, reviewing self-monitoring records, assessing competencies, introducing new topics, creating action plans, and scheduling the next meeting.
Participant Testing
The following data were obtained at baseline, following 6-month supervised TLI, and following a 6-month minimally supervised extension phase:
- Body Mass, BMI, and Body Composition
Body mass was expressed as the average of two measurements on a calibrated wheelchair scale. BMI was measured using an adjusted scale for SCI with the surrogate measure of overweight as ≥22 kg m-2 and obesity as ≥25 kg m-2 [52,53], currently the target recommendations for BMI accompanying SCI [35]. Total body and regional composition analysis including measurements of fat-free mass (FFM), fat mass (FM), percentage of body fat (%FM), lean mass (LM), and bone mineral content (BMC), was conducted by dual-energy X-ray absorptiometry (DXA) using a GE Lunar Prodigy Advance scanner (GE Lunar Inc., Madison, WI, USA), as previously reported. [54] In brief, participants were instructed to remove any metal, void their bladder, and dress in light clothes prior to transfer to the scanner, which was performed either by ceiling lift or self-transfer with or without a sliding board. Using the NHANES scanning method [55], knees were secured together with a large Velcro strap proximal to the knee joint to facilitate neutral leg position with great toes pointed upward. Whole-body posture was monitored for alignment, minimizing pelvic rotation or trunk shifting. In large individuals or in cervical SCI, arms were strapped near the body in the mid-prone position to ensure the total body is within the scanning field. The standard mode scan was used with a radiation dose of 0.4 μGy.
- Plasma Analytes
Levels of plasma analytes were assayed in blood plasma as previously described.[56] Briefly, subjects refrained from caffeine and alcohol intake for 24 h before testing. Antecubital venous blood samples were taken under sterile conditions in the post- absorptive state after an overnight (10-h) fast. Ten milliliters whole blood was drawn into ethylenediaminetetraacetic acid and gel and lysis activator tubes between 8:00 and 10:00 AM. Tubes were centrifuged at 3000 rpm. for 30 min to isolate platelet poor plasma. Fasting glucose was measured by the hexokinase method with intra-assay and inter-assay CVs are 1.9% and 2.7% respectively (Roche Diagnostics USA, Indianapolis, IN, USA; Cat # 05336163 190). Insulin was measured by a sandwich immunoassay method with electrochemiluminescence detection (Roche; Cat # 12017547122). Assays for TC, TG, and HDL-c were assayed by automated methods utilizing commercially available kits according to manufacturer’s instructions and run procedures [51]. Polyanion precipitation was undertaken before HDL-c assay to separate the apoB-containing lipoproteins [57]. LDL-c was computed by the method of Friedewald.[58] For oral glucose tolerance test (OGTT), baseline blood samples were drawn after the overnight fast. Subjects were given TrutolTM glucose solution (Fisher Scientific, Walmath, MA, USA) that contains seventy-five (75) grams of glucose and instructed to complete ingestion within five (5) minutes. Post-ingestion, blood was collected at exactly 30-minute intervals for 2-hours.
- Insulin Resistance and Sensitivity
Hemoglobin A1c (HbA1c) was measured by immunoassay in hemolyzed whole blood utilizing an antibody that detects the glycation of the hemoglobin β-chain, with intra-assay and inter-assay CVs are 2.0% and 2.8% respectively (Roche; Cat # 05336163 190). The Homeostatic Model-2 Assessment (HOMA2-IR) was also computed, calculated as glucose (mg dl-1) x insulin (uIU l-l)/405 [59]. HOMA2-IR is a computer-based model, derived from the original (HOMA) equation, which uses non-linear solutions to account for physiological variations not accounted for in the original equation (available from www.OCDEM.ox.ac.uk). Insulin sensitivity was estimated using the QUICKI formula as previously reported.[60]
- Food Intake
Caloric intake was evaluated by using a 4-day food log[11], including both work week and weekend food consumption. The composition was analyzed using Food Processor II Windows v. 7.6 (ESHA Research, Salem, OR, USA).
- Upper Extremity Dynamic Strength (1-RM)
Dynamic strength was assessed on a Helms Equalizer 7000 multi-station gym (Helms Distributing, Polson, MT, USA), using the same maneuvers adopted for training: horizontal row (HR), butterfly (BF), dip (DP), overhead press (OP), latissimus pulldown (LP), and pulley curls (PC). Participants were instructed to perform eight repetitions of each maneuver with each repetition lasting 6 s (3 s concentric, 3 s eccentric). If eight repetitions are completed in controlled fashion, the weight was increased, and the exercise repeated. Incremental increases in weight (2.5–5kg each) was added until more than three but less than eight controlled repetitions could be completed. The 1-RM was calculated from the submaximal resistance measure (weight in the last set) by the Mayhew regression equation[61] as we have previously reported[50, 51]: 1-RM = Wt/(0.533+0.419e − 0.055 reps), where ‘1-RM’ is the calculated one-repetition maximum strength, ‘Wt” is the resistance used in the last set, where more than three repetitions but less than eight repetitions were completed, and ‘reps’ equals the number of repetitions completed in the last set of testing. We calculated a sum score (SUM) to evaluate overall dynamic strength.
- Peak Oxygen Consumption (VO2peak)
VO2peak was determined via a maximal continuous graded exercise test on an arm crank ergometer (Monark Rehab Trainer 881E, Vansbro, Sweden). Subjects refrained from strenuous exercise 24 h before testing. Testing was conducted as previously described [62] using 10 W incremental workloads and 3-minute work stages. Expired gases were continuously analyzed by an open-circuit indirect calorimetry system (Encore Vmax229 with integrated EKG monitoring, Sensormedics, Inc., Conshohocken, PA, USA).
- Resting Energy (Caloric) Expenditure (REE)
Using the same open-circuit system described above for VO2peak, REE was calculated by indirect calorimetry: kcal min-1 = 4.92(V)/[20.93-FEO2/100], where the conversion factor of 4.92 kcal l−1 of oxygen consumed was corrected for the fractional expired O2 at rest and low- intensity work. Food, ethanol, caffeine, and nicotine were restricted for 8 h before assessment, which was conducted at least 18 h following moderate or intense exercise. Subjects underwent a 20 min rest before testing, sufficient to dissipate effects of low- intensity work. Measurement duration of 30 min with the first 5 min deleted and the remaining 5 min having a coefficient of variation o10% gives accurate readings of REE. REE comprises the majority (~70%) of total (daily) energy expenditure (TEE) and here we report and discuss calculated TEE extrapolated from measured calorimetric REE.
- Health Related Quality of Life (HRQoL)
HRQoL was assessed using the Shortform-36 (SF-36) Health Questionnaire. In brief, the SF-36 is a self-administered questionnaire that generates assessment scores across eight dimensions of health: physical function (PF), role limitations due to physical problems (RP), role limitations due to emotional problems (RE), vitality (VT), mental health (MH), social function (SF), bodily pain (BP), and general health (GH). The SF-36 dimensions are scored in two aggregate categories: Physical Component Summary (PCS) and Mental Component Summary (MCS), which represent the physical functioning and wellbeing, and emotional wellbeing, respectively.
- Data Analysis
Data were analyzed using GraphPad, Prism (v9.3.1) and R Studio (v1.4.1106). Descriptive statistics were calculated to identify measures of central tendency and variability for continuous outcome variables. A one-way repeated measures ANOVA, followed by Tukey’s multiple comparisons test, was performed to compare the effect of TLI over time on CMD risk factors, fitness variables, and health related quality of life.
Correlation analysis was performed to evaluate whether specific outcome measures have significant collinearity, quantified by the Pearson r correlation coefficient. Pairwise correlation coefficients between outcome variables are presented in a correlation matrix, and the value of the correlation range from -1 to +1, where +/-1 describes a perfect positive/negative correlation and 0 describes no correlation. R corrplot function was used to graph the correlation matrix (upper triangular). Positive correlations are displayed in blue and negative correlations in red, and color intensity is proportional to the correlation coefficients.
Linear regression analysis was performed to evaluate whether specific body mass and/or specific sub-scores of the HRQoL are significant predictors of the PCS and MCS scores of the HRQoL. Regression model statistics are summarized in the results and supplemental data.
A P-value of <.05 was used as the criterion for significance. All P-values <.05 are denoted in the figure legends, where number of asterisks indicate level of significance.
3. Results
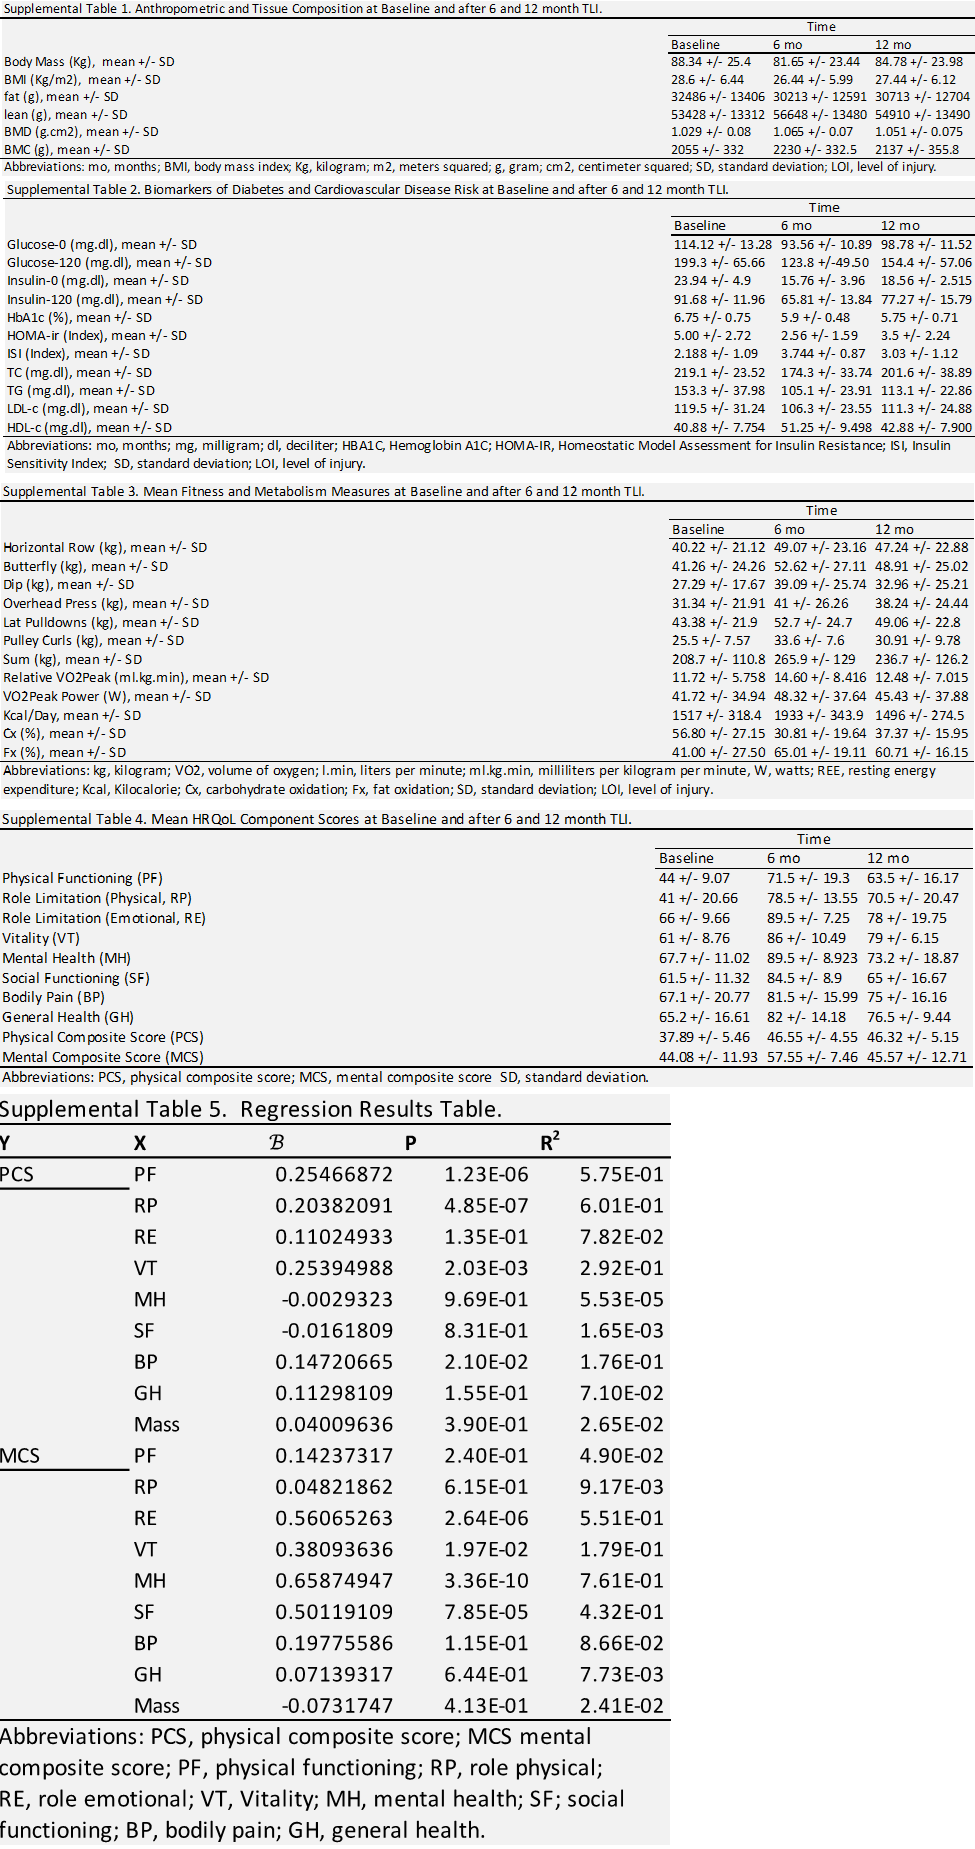
We note that results shown herein are also provided as supplemental tables with additional details for variables and outcome measures.
Anthropometric and Tissue Composition Markers
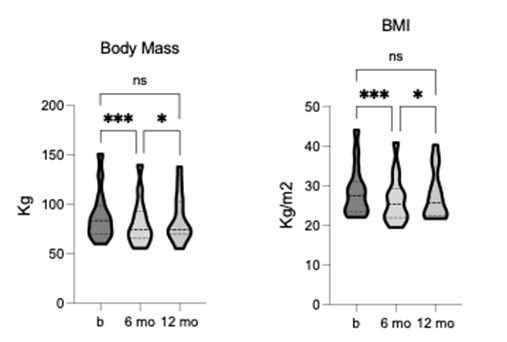
Participant demographic characteristics are summarized in table 1. The TLI demonstrated a statistically significant effect for anthropometric measures including body mass [F = 12.62, p = 0.0033, R2 = 0.493] and BMI [F = 12.42, p = 0.0003, R2 = 0.49]. After 6-months of
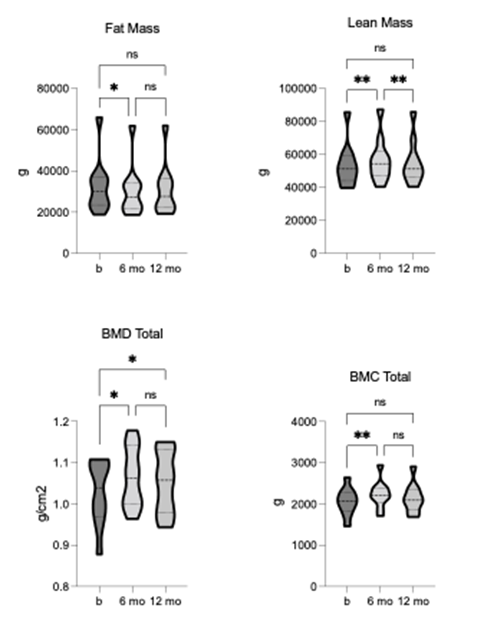
TLI, body mass and BMI showed a significant reduction from baseline, and both measures remained lower than baseline at 12-month follow-up, although to not significant (figure 1). The TLI demonstrated statistically significant changes in tissue composition, including fat [F = 9.577, p = 0.006, R2 = 0.52] and lean mass [F = 13.36, p = 0.001, R2 = 0.6]. Fat mass was significantly reduced, whereas lean mass was significantly increased after 6-months of TLI (figure 2). The increase in lean mass was preserved at 12-month follow-up, although no longer significant compared to pre-intervention. This sustained increase in lean mass may have contributed to the relatively higher body mass and BMI values observed at follow-up. Bone mineral density (BMD) and content (BMC) were also significantly increased after 6-months of TLI and remained non- significantly higher than baseline at 12-month follow-up (figure 2), suggesting that increased bone mass might have contributed to the overall increase in lean mass observed at these time points.

Figure 1. Comparison of body mass and BMI at pre-, 6-, and 12-months post-TLI. Both significantly reduced at 6- months post-TLI vs. pre-intervention. At 12-months post-TLI, both significantly increased from 6-months, no longer differing significantly from pre-intervention. * p ≤ 0.05, *** p ≤ 0.001.
Figure 2. Comparison of fat and lean mass, total bone mineral density (BMD), and bone mineral content (BMC) pre-, 6-, and 12-months post-TLI. Fat mass is significantly reduced, and lean mass is significantly increased at 6-months post-TLI vs. pre-intervention. At 12-months post-TLI, fat mass increases and lean mass decreases from 6-months, no longer significantly different from pre-intervention. BMD and BMC significantly increase at 6-months post-TLI vs. pre-intervention. At 12-months post-TLI, BMD and BMC reduce from 6-months, no longer significantly different from pre-intervention. * p ≤ 0.05, ** p ≤ 0.01.
Diabetes Risk Factors and Glycemic Measures
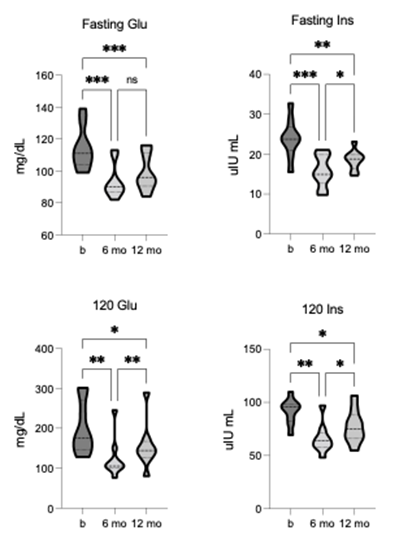
The mean group value at baseline for fasting blood glucose (114.12 +/- 13.28 mg/dL) and glucose at 120 minutes (120-glu) after OGTT (199.3 +/- 65.66 mg/dL) both represent clinical diagnoses for prediabetes. After TLI, significant improvements were observed in fasting glucose [F = 41.93, p = 0.0001, R2 = 0.84] and 120-glu [F = 16.76, p = 0.002, R2 = 0.68]. Significant reductions in fasted glucose and 120-glu were shown after 6-months of TLI and reflect improvement to within normal ranges, and both responses remained significant at 12-month follow-up (figure 3). Similarly, the baseline mean group values for fasting blood insulin (23.94 +/- 4.9 µIU/mL) and insulin at 120 minutes (120-ins) after OGTT (91.68 +/- 11.96 µIU/mL) were at the higher end of generally adopted reference ranges. Again, TLI resulted in statistically significant changes for both fasting insulin [F = 26.73, p = 0.0001, R2 = 0.77] and 120-ins [F = 19.87, p = 0.0001, R2 = 0.71]. Both fasting insulin and 120-ins were significantly lower after 6- months of TLI and 12-month follow-up (figure 3).
Figure 3. Comparison of fasted and 120-minute post-OGTT glucose and insulin pre-, 6-, and 12-months post-TLI. Fasting glucose and insulin significantly reduce at both 6- and 12-months post-TLI vs. pre-intervention. Insulin is significantly greater at 12-months vs. 6-months post-TLI. 120-minute glucose and insulin significantly reduce at both 6- and 12-months post-TLI, with both significantly greater at 12-months vs. 6-month timepoint. * p ≤ 0.05, ** p ≤ 0.01, *** p ≤ 0.001.
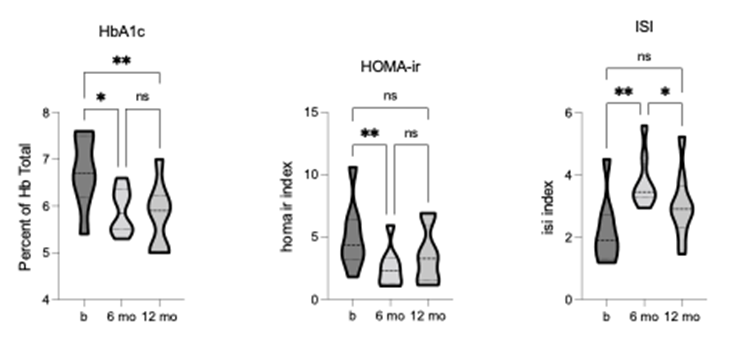
The baseline values for HbA1c (6.75 +/- 0.75) measuring average blood glucose levels, and for HOMA-ir (5.00 +/- 2.72) measuring insulin resistance, were above the normal range, however, insulin sensitivity, as measured by ISI (2.188 +/- 1.09), was within normal range.
Following TLI, significant changes were observed in HbA1c [F = 13.54, p = 0.0014, R2 = 0.66], HOMA-ir [F = 11.12, p = 0.0013, R2 = 0.61], and ISI [F = 16.73, p = 0.0008, R2 = 0.71]. Both HbA1c and HOMA-ir were significantly reduced, and ISI was significantly increased after 6-months of TLI, with HbA1c and ISI changes remaining significant at the 12-month follow-up (figure 4).
Collectively, these findings demonstrate impaired glucose tolerance and insulin resistance at baseline, indicating the risk for developing diabetes. Notably, the TLI led to significant improvements in all glycemic measures, with some measures falling within normal (healthy) ranges.
Figure 4. Comparison of diabetes markers (HbA1c, HOMA-ir, ISI) pre-, 6-, and 12-months post-TLI. HbA1c and HOMA-ir significantly reduce, and ISI significantly increases at 6-months post-TLI vs. pre-intervention. At 12-months post-TLI, HbA1c remains significantly reduced, but HOMA-ir is no longer significantly different from pre- intervention. ISI significantly reduces at 12-months vs. 6-months post-TLI, no longer significantly different from pre- intervention. * p ≤ 0.05, ** p ≤ 0.01.
Cardiovascular Risk Factors and Lipid Measures
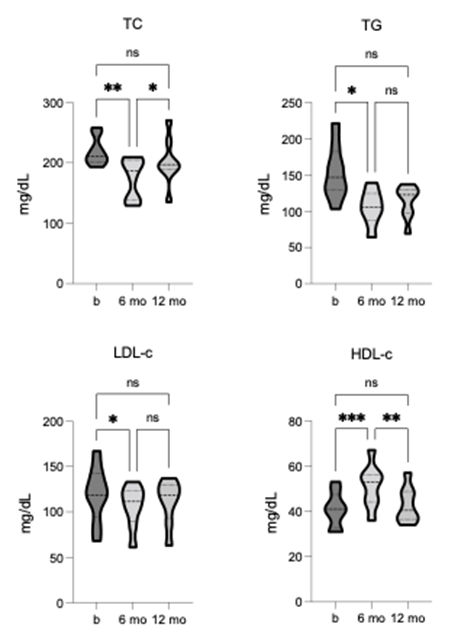
At baseline, the group mean values for TC (219.1 +/- 23.52), TG (153.3 +/- 37.98), and LDL-c (119.5 +/- 31.24) were all above the healthy cut-off levels, indicating higher-than-desirable risk. Conversely, HDL-c (40.88 +/- 7.74) was close to the lower cut-off for elevated risk. Following TLI, significant improvements were observed for TC [F = 9.603, p = 0.0029, R2 = 0.58] and TG [F = 7.84, p = 0.024, R2 = 0.53], where after 6-months, both measures were significantly reduced to values within the normal range. At 12-month follow-up, neither remained significantly improved, however, both measures remained within the healthy cut-off, showing sustained intervention benefits (figure 5). TLI also led to significant improvements in LDL-c [F = 7.755, p = 0.018, R2 = 0.52] and HDL-c [F = 31.25, p = 0.0001, R2 = 0.82]. After 6 months, LDL-c was significantly reduced but remained above reference scores. In contrast, HDL-c was significantly increased and within the optimal range, indicating a positive impact on cardiovascular risk.
Neither change showed sustained statistical improvement at the 12-month follow-up, however, were markedly improved from baseline (figure 5). These findings suggest that the TLI may play a vital role in promoting cardiovascular health and lowering the risk of all-cause cardiovascular diseases.
Figure 5. Comparison of CVD markers (TC, triglycerides, LDL-c, HDL-c) pre-, 6-, and 12-months post-TLI. TC, TG, and LDL-c significantly reduce, and HDL-c significantly increases at 6-months post-TLI vs. pre-intervention. At 12-months post-TLI, TC, TG and LDL-c all increase from the 6-month post-TLI timepoint, no longer significantly different from pre-intervention. HDL-c at 12-months is significantly reduced compared to the 6-month post-TLI timepoint and no longer significantly different from pre-intervention. * p ≤ 0.05, ** p ≤ 0.01, *** p ≤ 0.001.
Fitness and Metabolic Measures
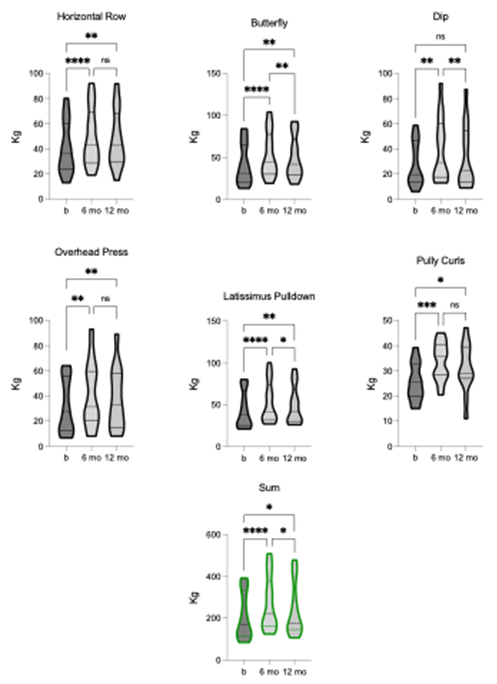
We assessed dynamic strength using the 1-RM for six upper extremity exercises: HR, BF, DP, OP, LP, and PC. TLI had a significant effect on the SUM [F = 20.86, p = 0.0001, R2 = 0.63]. After 6-months of TLI, there were significant improvements in 1-RM for all upper extremity exercises. At 12-month follow-up, HR, BF, OP, LP, and PC still showed statistically significant improvements, whereas DP, did not (figure 6). Nevertheless, the group means for all exercises remained improved from baseline at 12-month follow-up. These findings show that TLI had a positive and lasting effect on upper extremity strength, with most exercises showing sustained improvements over the longer term.
Figure 6. Comparison of dynamic strength (1-RM) for: Horizontal row (HR), butterfly (BF), dip (DP), overhead press (OP), latissimus pulldown (LP), pulley curl (PC), and SUM pre-, 6-, and 12-months post-TLI. 1-RM for all exercises and SUM significantly increases at 6-months post-TLI vs. pre-intervention. At 12-months post-TLI, BF, DP, LP, and SUM significantly reduce compared to the 6-month timepoint. BF, LP, and SUM remain statistically different from pre-intervention, whereas DP does not. HR, OP, and PC are statistically unchanged at 6- and 12-months post-TLI. * p ≤ 0.05, ** p ≤ 0.01, **** p ≤ 0.0001.
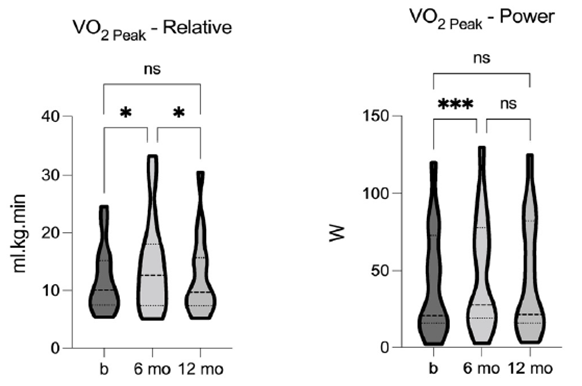
We evaluated cardiorespiratory fitness using relative peak aerobic capacity (VO2peak) both pre- and post-TLI. The analysis revealed a significant effect of TLI on VO2peak [F = 6.97, p = 0.0053, R2 = 0.33], indicating a significant increase after 6-months of TLI. The power generated at VO2peak (VO2power) was also significantly impacted by TLI [F = 11.51, p = 0.0004, R2 = 0.45], showing significant improvement after the 6-months of TLI. Although neither VO2peak nor VO2power remained statistically significant at the 12-month follow-up, both values were increased from baseline (figure 7). These data indicate that TLI had a positive effect on cardiorespiratory fitness, and the sustained effects highlight the importance of TLI on maintaining and improving fitness over time.
Figure 7. Comparison of relative aerobic capacity (VO2 Peak) and power at VO2 Peak (VO2 Peak-P) pre-, 6-, and 12- months post-TLI. VO2 Peak and VO2 Peak-P significantly increase at 6-months post-TLI vs. pre-intervention. Both are reduced at 12-months post-TLI, compared to the 6-month timepoint, and no longer statistically different from pre- intervention. * p ≤ 0.05, *** p ≤ 0.001.
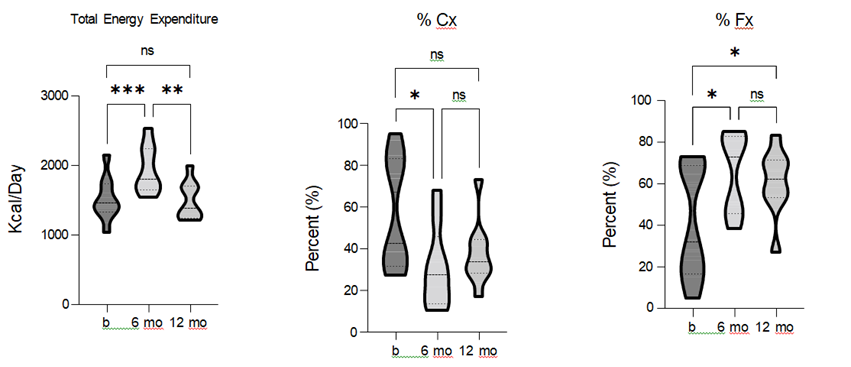
Resting energy expenditure (REE) was used to assess daily metabolism before and after the TLI. The results showed a significant effect of TLI on REE [F = 21.51, p = 0.0001, R2 = 0.73], with REE significantly increasing after 6-months of LI. While REE remained greater than baseline at the 12-month follow-up, this difference was no longer statistically significant. To gain further insights into the underlying metabolic processes, we analyzed substrate utilization as components contributing to REE. TLI had a statistically significant effect on both carbohydrate (Cx) [F = 7.15, p = 0.017, R2 = 0.47] and fat (Fx) [F = 10.96, p = 0.0028, R2 = 0.58] oxidation.
Specifically, carbohydrate oxidation was significantly reduced, while fat oxidation was significantly increased after the 6-months of TLI. Moreover, fat oxidation remained significantly greater than baseline at the 12-month follow-up (figure 8). These data demonstrate that TLI had a positive impact on REE, and a shift in metabolic substrate utilization.
Figure 8. Comparison of total energy expenditure (TEE), carbohydrate (Cx), and fat (Fx) oxidation pre-, 6-, and 12- months post-TLI. TEE and Fx significantly increase, and Cx is significantly reduced, at 6-months post-TLI vs. pre- intervention. At 12-months post-TLI, TEE and Fx are reduce, and Cx increased compared to the 6-month and TEE and Cx are no longer statistically different from pre-intervention. * p ≤ 0.05, ** p ≤ 0.01, *** p ≤ 0.001.
HRQoL Assessment
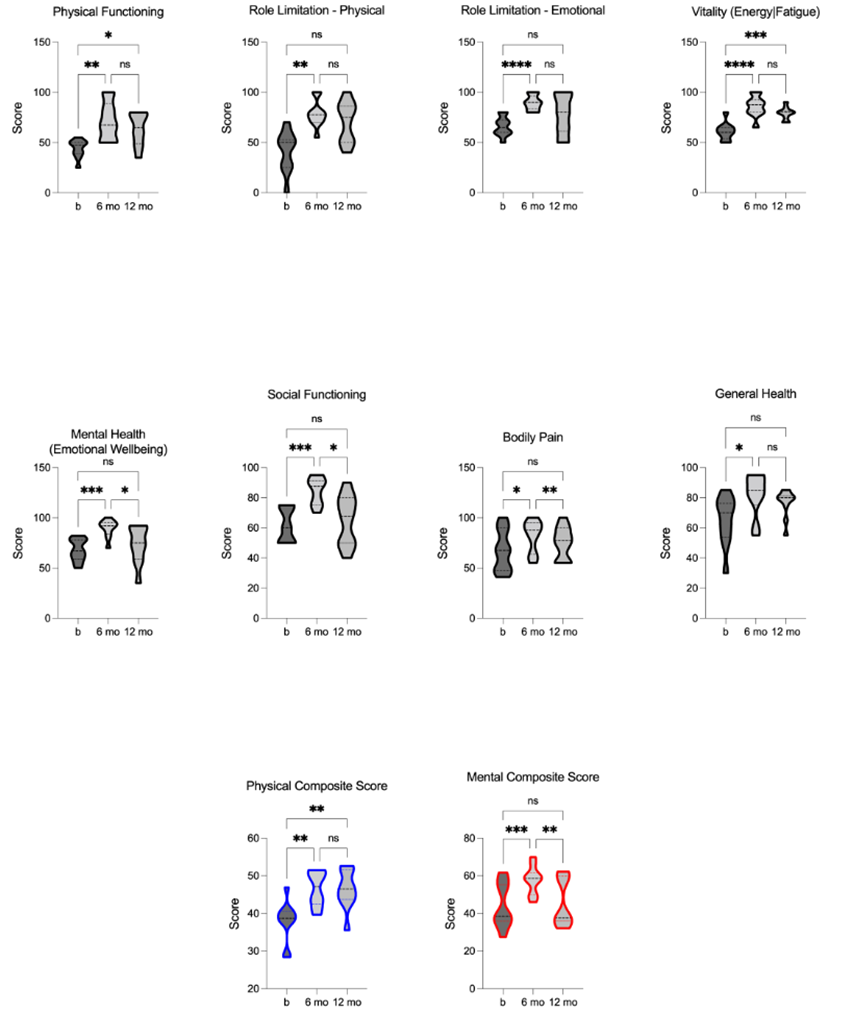
We used the SCI-validated SF-36 health questionnaire, including eight-dimensional assessment scores (PF, RP, RE, VT, MH, SF, BP, and GH), to evaluate health-related quality of life (HRQoL) pre- and post-TLI. The physical (PCS) and mental (MCS) composite scores were calculated from these dimensions to assess overall physical and mental well-being. Notably, the TLI had a statistical effect on both the PCS [F = 14.94, p = 0.0003, R2 = 0.63] and MCS [F = 24.09, p = 0.0005, R2 = 0.73], with a significant impact of TLI on each of the eight-dimensional scores individually. Following 6-months of TLI, significant improvements were shown in all eight dimensions, as well as the PCS and MCS. At the 12-month follow-up, the dimensions of PF and VT, along with the PCS, remained significant improved. However, the dimensions of RP, RE, MH, BP, and GH, as well as the MCS, did not maintain statistical significance. Importantly, the group means for all dimensions and composite scores were still greater than baseline at the 12-month follow-up, with the improvements in dimensions of MH, SF, BP, and the MCS remaining significant (figure 9). These results underscore the value of incorporating comprehensive TLI to enhance overall well-being.
Figure 9. Comparison of Health-Related Quality of Life (HRQoL): physical functioning (PF), role limitation - physical (RP), role limitation - emotional (RE), vitality (energy/fatigue) (VT), mental health (emotional wellbeing) (VT), social functioning (SF), bodily pain (BP), general health (GH), physical composite score (PCS), and mental composite score (MCS) pre, 6-, and 12-months post- TLI. HRQoL sub-scores, PCS, and MCS are significantly increased at 6-months post-TLI compared to the pre-intervention. 12- months post-TLI, MH, SF, BP, and MCS are significantly reduced compared to 6-month post-TLI, no longer different from pre- intervention, whereas PF, VT, and PCS remain significantly increased from pre-intervention. * p £ 0.05, ** p £ 0.01, *** p £ 0.001, **** p £ 0.0001.
Exploratory Analyses
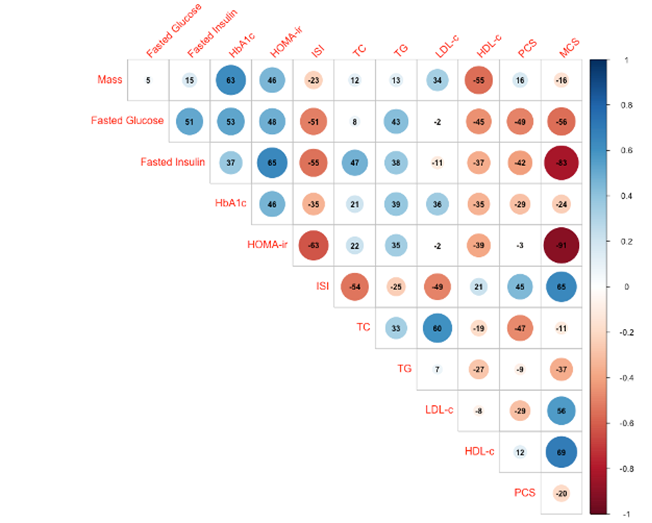
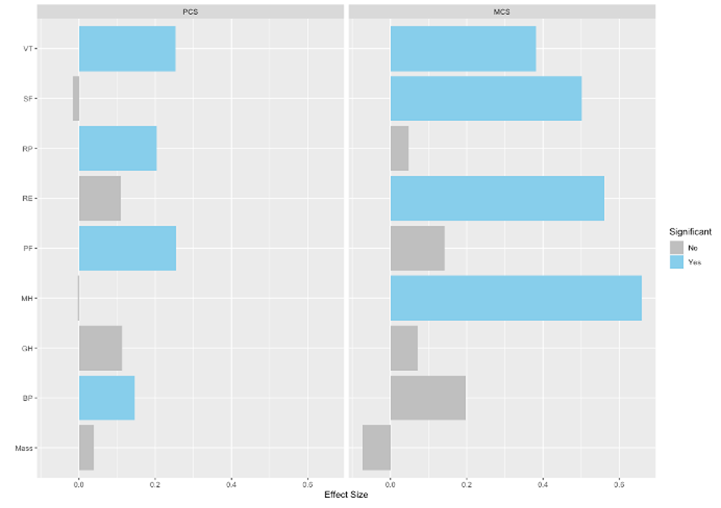
We performed preliminary pairwise correlation analysis to identify relationships among outcomes across all timepoints (figure 10A). Notably, body mass, as our primary outcome, had a statistically significant positive correlation with HbA1c (r = 0.63) and HOMA-ir (r = 0.46), and a statistically significant inverse correlation with HDL-c (r = -0.55). We also performed linear regression analysis to evaluate whether body mass or specific sub-scores of HRQoL could predict PCS or MCS (figure 10B,). Models determined that PF, RP, VT, and BP were significant predictors of PCS, while RE, VT, MH, and SF were significant predictors of MCS. Although body mass did not have a significant relationship with either PCS or MCS, there was a notable inverse relationship with MCS, suggesting body mass as a negative predictor of MCS.
Figure 10. Exploratory analysis: Correlation between major outcome variables and regression of HRQoL sub-scores and body mass on HRQoL composite scores. A. Upper triangular correlation matrix showing pairwise Pearson’s r correlation coefficients between variables. Statistically significant positive correlations are shown in blue and statistically significant negative correlations in red. Color intensity and size are proportional to Pearson’s r correlation coefficients, shown inset. The legend color spectrum shows the Pearson’s r correlation and the corresponding colors. B. Regression analysis graphs illustrate the effect size (ES) for each X (predictor) variable: physical functioning (PF), role limitation - physical (RP), role limitation - emotional (RE), vitality (energy/fatigue) (VT), mental health (emotional wellbeing) (VT), social functioning (SF), bodily pain (BP), general health (GH), and body mass on Y (outcome) variable: physical composite score (PCS), and mental composite score (MCS). Significant ES are shown in blue. p £ 0.05.
4. Discussion
This intervention study demonstrates effectiveness of a TLI adapted from the DPP on addressing cardiometabolic risks and improving overall health-related outcomes in individuals with chronic SCI. Notably, the intervention had a substantial effect on anthropometric measures, and improvements in body composition. The TLI showcased its effectiveness in addressing diabetes risk factors, cardiovascular risk factors and lipid profiles. The data also support salutary increases in metabolism and fat oxidation, as well as improvements in aerobic capacity and HRQoL. These major findings support the adoption of this or similar comprehensive intervention strategies to mitigate the multifaceted cardiometabolic challenges faced by individuals with SCI.
Several previous studies have emphasized the importance of weight management and body composition improvement in individuals with SCI [3,63-65]. Our main findings show that the TLI was successful in promoting favorable changes in body mass and BMI, reducing fat mass, and increasing lean mass. The TLI was designed to reach a target body mass reduction of 7% - as established by the DPP [44,45]. The significant mean loss in body mass after TLI was ~7.5%, achieving the benchmark of the a priori goal. Notwithstanding, the unique challenges that accompany SCI that can impact the ability to achieve this targeted weight loss goal. For example, with SCI, physical limitations, musculoskeletal complications, and altered metabolic responses to exercise and nutrition, can influence the capacity to lose body mass. Nevertheless, the reductions in mass achieved through the TLI, had accompanying significant impacts on metabolic health, insulin sensitivity, and cardiovascular risk factors. Altogether, the TLI's ability to achieve sustained improvements across a range of health markers, as demonstrated in this study, underscores its effectiveness irrespective of meeting the stringent 7% weight loss criterion.
The intervention's notable reductions in fasting and 120-minute glucose levels, fasting insulin, and insulin resistance (HOMA-ir), alongside improvements in insulin sensitivity (ISI), underscore its potential to modulate glucose metabolism and lower the risk of type 2 diabetes in the SCI population. These findings align with the positive impact of comprehensive lifestyle interventions, exemplified by the TLI, on glycemic outcomes and diabetes risk reduction, consistent with their effects in the general population [66-68]. Furthermore, the observed reductions in total cholesterol, triglycerides, and improvements in HDL-c levels signify a significant reduction in cardiovascular risk post-intervention, crucial given the heightened cardiovascular disease risk associated with dyslipidemia in individuals with SCI [10,13-15,18,69]. These lipid profile improvements are in line with outcomes from lifestyle interventions in diverse non-disabled populations that demonstrated similar positive changes in lipid profiles and cardiovascular risk factors [70-73]. Our initial correlation analysis reveals significant associations between fasting glucose and insulin, HbA1c, HOMA-ir (all positive), and ISI (negative). Notably, a significant inverse relationship between body mass and HDL-c was identified, and as discussed above, HDL-c is a distinct CMD risk factor in SCI. These findings emphasize the importance of targeting body mass as a key intervention focus to address a significant risk factor in the SCI population.
The study’s findings underscore the critical role of exercise in promoting metabolic adaptability and long-term cardiometabolic health in individuals with SCI. The CRT paradigm represents a moderate-to-intense workload sufficient to increase cardiorespiratory endurance and muscular strength, and importantly, relies on glycolytic metabolism and induces post- exercise lipid oxidation[50,51,74,75]. Our results extend these previously reported findings, demonstrating a significant increase in REE and a notable shift toward increased resting fat oxidation post-TLI, underscoring the potential of the exercise component of the TLI to influence metabolic pathways. The sustained elevation of fat oxidation at the 12-month follow-up further suggests a lasting effect of the TLI on metabolic substrate utilization. Notably, the CRT represents a necessary adaption from the DPP physical activity goal of ‘~150 min of moderate physical activities similar in intensity to brisk walking’, and accompanying ‘~700 kcal/week energy expenditure’ [76]. The CRT is ~120-135 min/week, exceeding SCI-specific activity guidelines [77], and nearing the DPP goal. However, meeting the DPP energy expenditure goal would require a substantially greater volume given the reduced rates of energy expenditure during CRT in persons with SCI[74,78]. Nonetheless, the reported energy cost of the CRT [74,78] is sufficient to improve the clinical lipid profile in SCI [51], and our results suggest it is an effective component of disease mitigating TLI.
The relationship between nutrition, metabolism, and human health are defined by a complex balance between energy intake and expenditure which directly affects body composition and metabolic health [79]. Adopting a Mediterranean-style diet, as implemented in this study, promote favorable metabolic profiles and reduce the risk of metabolic disorders [80]. The emphasis on monounsaturated fats, complex carbohydrates from whole grains, and high quality proteins from sources like fish and legumes, promotes a beneficial energy balance that supports efficient macronutrient metabolism [81]. The recommended “healthy fats” correlates with improved lipid profiles, reduced inflammation, contributing to a favorable metabolic milieu and enhanced cardiovascular health [82]. Given that reduced muscle mass and oxidative capacity in SCI may affect metabolic adaptations to exercise, such as energy expenditure and substrate utilization [4,83], we posit that the nutritional component of the TLI played an important role in the positive results we report. The adoption of a Mediterranean-style nutrition plan offers flexibility by allowing the intake of red meats, chicken, and fish alongside a diverse array of user-preferred vegetables.
The improvement in aerobic capacity (VO2peak) and the power generated at VO2peak (VO2power) following 6-months of the TLI, indicate enhanced cardiorespiratory fitness, which is strongly associated with reducing cardiovascular disease risk [84, 85]. Although not sustained at the 12-month follow-up, the initial improvements highlight the potential of the intervention to positively impact aerobic fitness, which is crucial for overall health and functional independence in individuals with SCI. Of consequence are limitations to optimal physiological adaptations in SCI, which are important considerations when targeting aerobic fitness/improvements in the population. For example, autonomic dysfunction, and particularly disrupted cardiovascular regulation, affects heart rate response and cardiac output during exercise [86]. As well, impaired thermoregulation mechanisms can lead to overheating during exercise – especially at higher exercise intensities and ascending neurological injuries[87], which may result in reduced exercise tolerance and premature fatigue [88,89]. However, positive adaptations in these parameters are still observed under various training paradigms [86,87], and our results here support that TLI can result in similar improvements. Overall, the TLI was effective in improving aerobic fitness, and subsequently contributing to independence and health.
The TLI significantly enhances health-related quality of life (HRQoL), as indicated by improved physical and mental composite scores and various SF-36 health questionnaire dimensions, suggesting a comprehensive enhancement of well-being and overall functioning. These findings align with previous results from the DPP, demonstrating that engaging in regular physical activity and adopting healthier eating habits positively influences physical functioning, mental well-being, and overall HRQoL, contributing to participants' perceptions of health status, emotional well-being, and social functioning [66]. We attribute the improvements in HRQoL in this study, in part, to the behavioral component of the TLI, with a focus on education, problem- solving skills, and cognitive restructuring, modified from the DPP to address the specific needs of the SCI population. These strategies are closely tied to a sense of overall health and life satisfaction [90]. While not all dimensions maintain statistical significance at the 12-month follow-up, the sustained enhancements across multiple HRQoL measures highlight the TLI's potential to positively impact both psychosocial and physical aspects of individuals with SCI. The TLI notably impacted MCS, with a substantial increase (D +~13) at 6 months but a clear decline (D -~12) at the 12-month follow-up compared to baseline. Our exploratory analysis identified body mass as a significant predictor of MCS, making the 12-month decline unsurprising due to significant body mass regain between 6- and 12-months post-TLI. This underscores the motivating power of body mass and its significant impact on mental well-being.
Among the important findings of the intervention is the significant correlation between MCS and blood markers of disease, highlighting the interplay between psychological well-being and physiological health outcomes. Extensive research acknowledges the bidirectional relationship between mental and physical health. Higher MCS scores have been linked to increased engagement in physical activity and adherence to dietary recommendations [91,92], impacting metabolic and cardiovascular health by influencing insulin sensitivity, lipid profiles, and inflammation [93,94]. Conversely, psychological distress, anxiety, and depression are associated with dysregulation of the hypothalamic-pituitary-adrenal axis, increased inflammation, and altered autonomic function, all of which can contribute to metabolic and CMS risks [95,96]. Regular physical activity, integral to metabolic and cardiovascular health, positively affects mood, anxiety, and depression through endorphin release and neurotransmitter balance improvements [97,98]. Exercise-induced release of neurotrophic factors also supports neuroplasticity and cognitive function, contributing to a positive mental state [99]. These findings underscore the significant impact of behavioral strategies on enhancing HRQoL in the context of CMD risk management in the SCI population. Given our data indicating specific sub-scores of HRQoL (RE, VT, MH, and SF) as significant positive predictors of MCS, future studies could delve deeper into these sub-scores to better understand the mechanisms underpinning their relationship with mental well-being.
Limitations
During the supervised 6-month TLI, study participants were challenged to maintain strict dietary adherence. This challenge highlights the need for considering the broader dietary context and exploring strategies to enhance dietary adherence beyond the structured intervention. One of the main limitations – as indicated by the recidivism observed in several outcome measures – is adherence to the TLI during the minimally supervised 6-month self-care extension phase. Maintenance of outcomes measures following the unsupervised phase may be unattainable within the scope of our study The study's transition from a controlled research environment to “less structured” community deployment carries inherent challenges. Disparate settings and individualized lifestyles could have influenced participants' adherence to the intervention components. As well, access to community-based exercise resources, social support networks, and environmental factors may have contributed to varying degrees of engagement, potentially affecting the overall outcomes observed. Further research should assess the optimal duration and frequency of the TLI and explore the long-term sustainability of the observed effects. Better understanding these outcomes, will facilitate refined intervention strategies, improved community engagement approaches, and innovative methodologies to enhance adherence and data collection accuracy. Future studies should target larger samples to confirm these findings and provide statistical power to better evaluate significance for all outcome measures. While our study leverages the foundational principles of the DPP, there are some notable contrasts in design and size. The DPP was a multicenter randomized controlled trial with a considerably larger sample size compared to our study, a limitation in drawing conclusions as generalizable as the DPP, although our results are promising given their significance. The adaptation with CRT introduces a distinct component, but our results support its integration into TLI, and efficacy in improving health outcomes.
5. Conclusions
The results of this comprehensive study provide evidence for TLI integration into rehabilitation strategies for chronic SCI. The complex nature of SCI pathophysiology and addressing the adverse metabolic profile and increased CMD risks, requires a multimodal approach to rehabilitation. The TLI in this study targets multiple aspects of health and well- being, emphasizing physical activity, nutrition, stress management, and education. It further aligns with our current understanding of the multifactorial nature of CMDs. The TLI demonstrated significant and clinically relevant improvements across a wide range of health markers, including body composition, glucose metabolism, cardiovascular risk factors, aerobic capacity, and health-related quality of life. Integrating this or similar TLI’s into rehabilitation strategies can provide an effective approach to mitigate the risk of cardiometabolic complications, enhance overall health outcomes, and ultimately improve the quality of life for individuals living with chronic SCI. Our study sets the groundwork for future research, serving as a foundation for more extensive trials to rigorously test the effectiveness of interventions informed by the insights gained in this investigation.
Declarations
Author Contributions:
Conceptualization, MSN and GEB; methodology, MSN and GEB; formal analysis, GEB, and DAL; investigation, GEB, JLM, LFB and AJM; writing—original draft preparation, GEB; writing—review and editing, GEB, JLM, DAL, and MSN; supervision, MSN, project administration, GEB, JLM, and LFB; funding acquisition, MSN. All authors have read and agreed to the published version of the manuscript.
Funding:
This research was funded by Disability Rehabilitation Research Program (DRRP) from the Department of Health and Human Services National Institute for Disability, Independent Living, and Rehabilitation Research (NIDILRR #90DP0074).
Institutional Review Board Statement:
The study was conducted in accordance with the Declaration of Helsinki, and approved by the Human Subjects Research Office, Miller School of Medicine, University of Miami (Institutional Review Board No. 20151065, dated 2 August 2016).
Informed Consent Statement:
Informed consent was obtained from all subjects involved in the study.
References
- Bauman, W.A. and A.M. Spungen, Metabolic changes in persons after spinal cord injury. Phys Med Rehabil Clin N Am 11 (2000): p.109-140.
- Castro, M.J., et al., Influence of complete spinal cord injury on skeletal muscle cross- sectional area within the first 6 months of injury. Eur J Appl Physiol Occup Physiol 80 (1999): p.373-378.
- Giangregorio, L, N. McCartney, Bone loss and muscle atrophy in spinal cord injury: epidemiology, fracture prediction, and rehabilitation strategies. J Spinal Cord Med 29 (2006): p.489-500.
- Gorgey, A.S, G.A. Dudley, Skeletal muscle atrophy and increased intramuscular fat after incomplete spinal cord injury. Spinal Cord 45 (2007): p.304-309.
- Gorgey, A.S, D.R. Gater, A preliminary report on the effects of the level of spinal cord injury on the association between central adiposity and metabolic profile. PM R 3 (2011): p.440-446.
- Maimoun, L., et al., Bone loss in spinal cord-injured patients: from physiopathology to therapy. Spinal Cord 44 (2006): p.203-210.
- Modlesky, C.M., et al., Assessment of skeletal muscle mass in men with spinal cord injury using dual-energy X-ray absorptiometry and magnetic resonance imaging. J Appl Physiol 96 (2004): p.561-565.
- Spungen, A.M., et al., Factors influencing body composition in persons with spinal cord injury: a cross-sectional study. J Appl Physiol 95 (2003): p.2398-2407.
- Bauman, W.A, A.M. Spungen, Disorders of carbohydrate and lipid metabolism in veterans with paraplegia or quadriplegia: a model of premature aging. Metabolism 43 (1994): p.749-756.
- Bauman, W.A. and A.M. Spungen, Carbohydrate and lipid metabolism in chronic spinal cord injury. J Spinal Cord Med 24 (2001): p.266-277.
- Groah, S.L., et al., Nutrient intake and body habitus after spinal cord injury: an analysis by sex and level of injury. J Spinal Cord Med 32 (2009): p.25-33.
- Liang H, C.D., Wang Y, Rimmer JH, et al. Different risk factor patterns for metabolic syndrome in men with spinal cord injury compared to able-bodied men despite similar prevalence rates. Arch Phys Med Rehabil 88 (2007): p.1198-1204.
- Bauman, W.A., et al., Depressed serum high density lipoprotein cholesterol levels in veterans with spinal cord injury. Paraplegia 30 (1992): p.697-703.
- Brenes, G., et al., High density lipoprotein cholesterol concentrations in physically active and sedentary spinal cord injured patients. Arch Phys Med Rehabil 67 (1986): p. 445-450.
- Zlotolow, S.P., E. Levy, W.A. Bauman, The serum lipoprotein profile in veterans with paraplegia: the relationship to nutritional factors and body mass index. J Am Paraplegia Soc 15 (1992): p.158-162.
- Bauman, W.A., et al., Risk factors for atherogenesis and cardiovascular autonomic function in persons with spinal cord injury. Spinal Cord 37 (1999): p.601-616.
- Karlsson, A.K., et al., Influence of the sympathetic nervous system on insulin sensitivity and adipose tissue metabolism: a study in spinal cord-injured subjects. Metabolism 44 (1995): p.52-58.
- Maki, K.C., et al., Associations between serum lipids and indicators of adiposity in men with spinal cord injury. Paraplegia 33 (1995): p.102-109.
- McGlinchey-Berroth, R., et al., Late-life spinal cord injury and aging with a long term injury: characteristics of two emerging populations. J Spinal Cord Med 18 (1995): p.183-193.
- Gordon, P.S., G.J. Farkas, D.R. Gater, Jr., Neurogenic Obesity-Induced Insulin Resistance and Type 2 Diabetes Mellitus in Chronic Spinal Cord Injury. Top Spinal Cord Inj Rehabil 27 (2021): p.36-56.
- Duckworth, W.C., et al., Glucose intolerance due to insulin resistance in patients with spinal cord injuries. Diabetes 29 (1980): p.906-910.
- Karlsson, A.K., Insulin resistance and sympathetic function in high spinal cord injury. Spinal Cord 37 (1999): p.494-500.
- Cragg, J.J., et al., Cardiovascular disease and spinal cord injury: results from a national population health survey. Neurology 81 (2013): p.723-728.
- Myers, J., M. Lee, J. Kiratli, Cardiovascular disease in spinal cord injury: an overview of prevalence, risk, evaluation, and management. Am J Phys Med Rehabil 86 (2007): p.142- 152.
- Chopra, A.S., M. Miyatani, B.C. Craven, Cardiovascular disease risk in individuals with chronic spinal cord injury: Prevalence of untreated risk factors and poor adherence to treatment guidelines. J Spinal Cord Med 41 (2018): p.2-9.
- Gater, D.R., Jr., Obesity after spinal cord injury. Phys Med Rehabil Clin N Am 18 (2007): p.333-351
- Weaver, F.M., et al., Prevalence of obesity and high blood pressure in veterans with spinal cord injuries and disorders: a retrospective review. Am J Phys Med Rehabil 86 (2007): p.22-29.
- Gorgey, A.S. and D.R. Gater, Jr., Prevalence of Obesity After Spinal Cord Injury. Top Spinal Cord Inj Rehabil 12 (2007): p.1-7.
- Nash, M.S.G.D.R., Exercise to Reduce Obesity in SCI. Top Spinal Cord Inj Rehabil 12 (2007): p.76-93.
- Chen, Y., et al., Obesity intervention in persons with spinal cord injury. Spinal Cord 44 (2006): p.82-91.
- Crane, D.A., J.W. Little, S.P. Burns, Weight gain following spinal cord injury: a pilot study. J Spinal Cord Med 34 (2011): p.227-232.
- Gerhart, K.A., et al., Long-term spinal cord injury: functional changes over time. Arch Phys Med Rehabil 74 (1993): p.1030-1034.
- Nash, M.S., et al., Identification and Management of Cardiometabolic Risk after Spinal Cord Injury: Clinical Practice Guideline for Health Care Providers. Top Spinal Cord Inj Rehabil 24 (2018): p.379-423.
- Betts, A.C., et al., Barriers and Facilitators to Lifestyle Intervention Engagement and Weight Loss in People Living With Spinal Cord Injury. Top Spinal Cord Inj Rehabil 27 (2021): p.135-148.
- Kressler, J., et al., Reducing cardiometabolic disease in spinal cord injury. Phys Med Rehabil Clin N Am 25 (2014): p.573-604.
- Nash, M.S., et al., Exercise to mitigate cardiometabolic disorders after spinal cord injury. Curr Opin Pharmacol 62 (2022): p. 4-11.
- Farkas, G.J., et al., Energy expenditure and nutrient intake after spinal cord injury: a comprehensive review and practical recommendations. Br J Nutr 128 (2022): p.863-887.
- Farkas, G.J., et al., Energy Expenditure, Cardiorespiratory Fitness, and Body Composition Following Arm Cycling or Functional Electrical Stimulation Exercises in Spinal Cord Injury: A 16- Week Randomized Controlled Trial. Top Spinal Cord Inj Rehabil 27 (2021): p.121-134.
- Bakkum, A.J., et al., Effects of hybrid cycle and handcycle exercise on cardiovascular disease risk factors in people with spinal cord injury: A randomized controlled trial. J Rehabil Med 47 (2015): p.523-530.
- Graham, K., et al., Effects of High-Intensity Interval Training Versus Moderate-Intensity Training on Cardiometabolic Health Markers in Individuals With Spinal Cord Injury: A Pilot Study. Top Spinal Cord Inj Rehabil 25 (2019): p.248-259.
- Nightingale, T.E., et al., Impact of Exercise on Cardiometabolic Component Risks in Spinal Cord-injured Humans. Med Sci Sports Exerc 49 (2017): p.2469-2477.
- Bresnahan, J.J., et al., Arm crank ergometry improves cardiovascular disease risk factors and community mobility independent of body composition in high motor complete spinal cord injury. J Spinal Cord Med 42 (2019): p.272-280.
- Allison, D.J., et al., Changes in nutrient intake and inflammation following an anti- inflammatory diet in spinal cord injury. J Spinal Cord Med 42 (2019): p.768-777.
- Ford, E.S., Body mass index, diabetes, and C-reactive protein among U.S. adults. Diabetes Care 22 (1999): p.1971-1977.
- Seidell, J.C., Obesity, insulin resistance and diabetes--a worldwide epidemic. Br J Nutr 83 (2000): p.S5-8.
- Diabetes Prevention Program Research, G., et al., 10-year follow-up of diabetes incidence and weight loss in the Diabetes Prevention Program Outcomes Study. Lancet 374 (2009): p.1677-1686.
- Ratner, R.E. Diabetes Prevention Program, An update on the Diabetes Prevention Program. Endocr Pract 12 (2006): p.20-24.
- Bigford, G.E., et al., A lifestyle intervention program for successfully addressing major cardiometabolic risks in persons with SCI: a three-subject case series. Spinal Cord Ser Cases 3 (2017): p.17007.
- Bigford, G.E., et al., Therapeutic Lifestyle Intervention Targeting Enhanced Cardiometabolic Health and Function for Persons with Chronic Spinal Cord Injury in Caregiver/Care-Receiver Co-Treatment: A Study Protocol of a Multisite Randomized Controlled Trial. Int J Environ Res Public Health 20 (2023).
- Jacobs, P.L., M.S. Nash, J.W. Rusinowski, Circuit training provides cardiorespiratory and strength benefits in persons with paraplegia. Med Sci Sports Exerc 33 (2001): p.711-717.
- Nash, M.S., et al., Circuit resistance training improves the atherogenic lipid profiles of persons with chronic paraplegia. J Spinal Cord Med 24 (2001): p.2-9.
- de Groot, S., et al., Trajectories in the course of body mass index after spinal cord injury. Arch Phys Med Rehabil 95 (2014): p.1083-1092.
- Laughton, G.E., et al., Lowering body mass index cutoffs better identifies obese persons with spinal cord injury. Spinal Cord 47 (2009): p.757-762.
- Gorgey, A.S., et al., Estimates of the precision of regional and whole body composition by dual-energy x-ray absorptiometry in persons with chronic spinal cord injury. Spinal Cord 56 (2018): p.987-995.
- Kerr, A., et al., Reliability of 2 Different Positioning Protocols for Dual-Energy X-ray Absorptiometry Measurement of Body Composition in Healthy Adults. J Clin Densitom 19 (2016): p.282-289.
- Nash, M.S, A.J. Mendez, A guideline-driven assessment of need for cardiovascular disease risk intervention in persons with chronic paraplegia. Arch Phys Med Rehabil 88 (2007): p.751-757.
- Bachorik, P.S, J.J. Albers, Precipitation methods for quantification of lipoproteins. Methods Enzymol 129 (1986): p.78-100.
- Friedewald, W.T., R.I. Levy, D.S. Fredrickson, Estimation of the concentration of low- density lipoprotein cholesterol in plasma, without use of the preparative ultracentrifuge. Clin Chem 18 (1972): p.499-502.
- Wallace, T.M., J.C. Levy, D.R. Matthews. Use and abuse of HOMA modeling. Diabetes Care 27 (2004): p. 1487-1495.
- Katz, A., et al., Quantitative insulin sensitivity check index: a simple, accurate method for assessing insulin sensitivity in humans. J Clin Endocrinol Metab 85 (2000): p.2402-2410.
- Mayhew JL., B.T., Arnold MD., Bowen JC. Relative muscular endurance performance as a predictor of bench press strength in college men and women. The Journal of Strength and Conditioning Research 6 (1992): p.200-206.
- Jacobs, K.A., et al., Heavy reliance on carbohydrate across a wide range of exercise intensities during voluntary arm ergometry in persons with paraplegia. J Spinal Cord Med 36 (2013): p.427-435.
- Buchholz, A.C, J.M. Bugaresti. A review of body mass index and waist circumference as markers of obesity and coronary heart disease risk in persons with chronic spinal cord injury. Spinal Cord 43 (2005): p.513-518.
- Buchholz, A.C, P.B. Pencharz, Energy expenditure in chronic spinal cord injury. Curr Opin Clin Nutr Metab Care 7 (2004): p.635-639.
- Kelley, G.A., K.S. Kelley, and Z.V. Tran, Exercise and bone mineral density in men: a meta- analysis. J Appl Physiol 88 (2000): p.1730-1736.
- Knowler, W.C., et al., Reduction in the incidence of type 2 diabetes with lifestyle intervention or metformin. N Engl J Med 346 (2002): p.393-403.
- Pan, X.R., et al., Effects of diet and exercise in preventing NIDDM in people with impaired glucose tolerance. The Da Qing IGT and Diabetes Study. Diabetes Care 20 (1997): p.537-544.
- Ryan, D.H., et al., Look AHEAD (Action for Health in Diabetes): design and methods for a clinical trial of weight loss for the prevention of cardiovascular disease in type 2 diabetes. Control Clin Trials 24 (2003): p.610-628.
- Washburn, R.A. and S.F. Figoni, High density lipoprotein cholesterol in individuals with spinal cord injury: the potential role of physical activity. Spinal Cord 37 (1999): p.685-695.
- Bajer, B., et al., Effect of 8-weeks intensive lifestyle intervention on LDL and HDL subfractions. Obes Res Clin Pract 13 (2019): p.586-593.
- Daubenmier, J.J., et al., The contribution of changes in diet, exercise, and stress management to changes in coronary risk in women and men in the multisite cardiac lifestyle intervention program. Ann Behav Med 33 (2007): p.57-68.
- Khalafi, M., et al., Exercise training, dietary intervention, or combined interventions and their effects on lipid profiles in adults with overweight and obesity: A systematic review and meta-analysis of randomized clinical trials. Nutr Metab Cardiovasc Dis (2023).
- Roussell, M.A. and P. Kris-Etherton, Effects of lifestyle interventions on high-density lipoprotein cholesterol levels. J Clin Lipidol 1 (2007): p.65-73.
- Jacobs, P.L., et al., Circuit resistance training in persons with complete paraplegia. J Rehabil Res Dev 39 (2002): p.21-28.
- McMillan, D.W., et al., Substrate metabolism during recovery from circuit resistance exercise in persons with spinal cord injury. Eur J Appl Physiol 121 (2021): p.1631-1640.
- Diabetes Prevention Program Research, G., The Diabetes Prevention Program (DPP): description of lifestyle intervention. Diabetes Care 25 (2002): p.2165-2171.
- Martin Ginis, K.A., et al., Evidence-based scientific exercise guidelines for adults with spinal cord injury: an update and a new guideline. Spinal Cord 56 (2018): p.308-321.
- Nash, M.S., et al., A comparison of 2 circuit exercise training techniques for eliciting matched metabolic responses in persons with paraplegia. Arch Phys Med Rehabil 83 (2002): p. 201-209.
- Hill, J.O., H.R. Wyatt, and J.C. Peters, Energy balance and obesity. Circulation 126 (2012): p.126-132.
- Hu, F.B., Dietary pattern analysis: a new direction in nutritional epidemiology. Curr Opin Lipidol 13 (2002): p.3-9.
- Trichopoulou, A., et al., Adherence to a Mediterranean diet and survival in a Greek population. N Engl J Med 348 (2003): p.2599-2608.
- Estruch, R., et al., Primary Prevention of Cardiovascular Disease with a Mediterranean Diet Supplemented with Extra-Virgin Olive Oil or Nuts. N Engl J Med 378 (2018): e34.
- Talmadge, R.J. and R.R. Roy, Electrophoretic separation of rat skeletal muscle myosin heavy-chain isoforms. J Appl Physiol 75 (1993): p. 2337-2340.
- Fernstrom, M., et al., Aerobic fitness is associated with low cardiovascular disease risk: the impact of lifestyle on early risk factors for atherosclerosis in young healthy Swedish individuals - the Lifestyle, Biomarker, and Atherosclerosis study. Vasc Health Risk Manag 13 (2017): p.91-99.
- Myers, J., Cardiology patient pages. Exercise and cardiovascular health. Circulation 107 (2003): e2-5.
- Krassioukov, A. and C. West, The role of autonomic function on sport performance in athletes with spinal cord injury. PM R 6 (2014): S58-65.
- Price, M.J., Thermoregulation during exercise in individuals with spinal cord injuries. Sports Med 36 (2006): p.863-879.
- Moore, A., et al., Effects of Pre-Exercise Ice Slurry Ingestion on Physiological and Perceptual Measures in Athletes with Spinal Cord Injuries. Int J Exerc Sci 14 (2021): p.19-32.
- Siegel, R., et al., Ice slurry ingestion increases core temperature capacity and running time in the heat. Med Sci Sports Exerc 42 (2010): p.717-725.
- Ackermann, R.T., et al., Translating the Diabetes Prevention Program into the community. The DEPLOY Pilot Study. Am J Prev Med 35 (2008): p.357-63.
- Lyubomirsky, S., L. King, E. Diener, The benefits of frequent positive affect: does happiness lead to success? Psychol Bull 131 (2005): p.803-855.
- Steptoe, A, M. Kivimaki, Stress and cardiovascular disease. Nat Rev Cardiol 9 (2012): p.360-370.
- Pedersen, B.K. and B. Saltin, Evidence for prescribing exercise as therapy in chronic disease. Scand J Med Sci Sports 16 (2006): p.3-63.
- Eckel, R.H., et al., 2013 AHA/ACC guideline on lifestyle management to reduce cardiovascular risk: a report of the American College of Cardiology/American Heart Association Task Force on Practice Guidelines. Circulation, 2014. 129(25 Suppl 2): p. S76-99.
- Brotman, D.J., S.H. Golden, I.S. Wittstein, The cardiovascular toll of stress. Lancet 370 (2007): p.1089-1000.
- Miller, G.E., E. Chen, E.S. Zhou, If it goes up, must it come down? Chronic stress and the hypothalamic-pituitary-adrenocortical axis in humans. Psychol Bull 133 (2007): p.25-45.
- Dinas, P.C., Y. Koutedakis, A.D. Flouris, Effects of exercise and physical activity on depression. Ir J Med Sci 180 (2011): p.319-25.
- Schuch, F.B., et al., Physical Activity and Incident Depression: A Meta-Analysis of Prospective Cohort Studies. Am J Psychiatry 175 (2018): p.631-648.
- Voss, M.W., et al., Bridging animal and human models of exercise-induced brain plasticity. Trends Cogn Sci 17 (2013): p.525-544.


 Impact Factor: * 3.123
 CiteScore: 2.9
  Acceptance Rate: 14.90%
  Time to first decision: 10.4 days
  Time from article received to acceptance: 2-3 weeks