
Structural Connectivity Alterations Along the Alzheimer’s Disease Continuum: Reproducibility Across Two Independent Samples and Correlation with Cerebrospinal Fluid Amyloid-β and Tau
Abstract
Background:
Gray matter changes associated with the progression of Alzheimer’s disease (AD) have been thoroughly studied. However, alterations in white matter tracts have received less attention, particularly during early or preclinical stages of the disease.
Objective:
To identify the structural connectivity changes across the AD continuum.
Methods:
We performed probabilistic tractography in a total of 183 subjects on two independent samples that include control (n = 68) and preclinical AD individuals (n = 28), patients diagnosed with mild cognitive impairment (MCI) due to AD (n = 44), and AD patients (n = 43). We compared the connectivity between groups, and with CSF Aβ42 and tau biomarkers.
Results:
We observed disconnections in preclinical individuals, mainly located in the temporal lobe. This pattern of disconnection spread to the parietal and frontal lobes at the MCI stage and involved almost all the brain in AD. These findings were not driven by gray matter atrophy.
Discussion:
Using tractography, we were able to identify white matter changes between subsequent disease stages and, notably, also in preclinical AD. Therefore, this method may be useful for detecting early and specific brain structural changes during preclinical AD stage.
INTRODUCTION
Alzheimer’s disease (AD) is a progressive, irreversible neurodegenerative disorder whose etiology is still unknown. The pathological hallmarks of AD are intraneuronal deposits of hyperphosphorylated tau protein and extracellular deposits of fibrillary amyloid-β (Aβ). AD is typically characterized by progressive memory loss with subsequent involvement of other cognitive domains, paralleled by a pattern of cerebral atrophy that starts in the entorhinal cortex, spreads to limbic and paralimbic areas, and finally involves the neocortical association cortex [1].
Reduced levels of Aβ42, as well as increased levels of total (t-tau) and phosphorylated tau (p-tau) in cerebrospinal fluid (CSF) have been shown to serve as in vivo proxy measures of the neuropathological hallmarks of AD [2]. On this basis, a preclinical stage of AD has been defined, which includes positive-biomarker subjects who are either asymptomatic or have experienced subtle cognitive decline but do not meet the criteria for mild cognitive impairment (MCI) [3].
Studying the relationship between CSF biomarkers and regional changes on structural and functional magnetic resonance imaging (MRI) may improve our understanding of the pathological mechanisms of AD [4], and allow us to map the cerebral morphological changes [5] and stage the disease progression across its biological continuum [6]. One possible caveat for these type of studies is the lack of standardization of CSF biomarkers across laboratories; however, the use of a normalized CSF index can overcome this limitation [6].
Diffusion-weighted magnetic resonance imaging (dwMRI) [7] is a relatively recent in vivo, non-invasive, imaging technique that estimates the magnitude and orientation of the diffusion of water molecules, which are constrained by white matter fibers. Previous studies have revealed lower fractional anisotropy (FA) and higher mean diffusivity (MD) in MCI and AD patients compared to controls (for a review, see [8–11]). Although altered DTI measures have been described in most brain regions, common abnormal findings across these studies involve temporal, parietal, frontal, and inter-hemispheric connections.
Quantitative scalar maps (FA and MD) lack of specificity and accuracy as these measures cannot target specific white matter pathways. However, dwMRI data can also be used to generate anatomically plausible estimates of white matter trajectories in the human brain [12]. This estimation is based on the assumption that the orientation of maximum diffusion is parallel to the local white matter fascicles. Then, from a cortical parcellation, tractography algorithms estimate the direction of propagation and the strength of white matter fasciculi between pairs of brain regions. Compared to quantitative scalar maps, tractography studies have received considerably less attention in AD as it is a very recent method and more complex to process and analyze. Compared to normal controls, tractography in AD patients shows abnormalities in the splenium of the corpus callosum, posterior cingulum, and uncinate fasciculi; while in MCI patients, changes are located mostly in the posterior cingulum (for a review, see [9]). White matter alterations have also been found both in amnestic MCI and AD in limbic and cortico-cortical connections involving association cortex [13]. Concerning preclinical subjects, scarce studies have been reported using dwMRI [14–17], and, as far as we are concerned, no analyses have been performed on fiber quantity through tractography at a single connection level [18]. In addition, to our knowledge, only one article has studied the association between dwMRI-based measures and Aβ protein in AD, and found a strong association between CSF Aβ concentration and decreased whole-brain network metrics [19].
With this in mind, we aimed to identify the structural connectivity changes across the AD continuum. To this end, we sought for structural connectivity differences between healthy controls, preclinical AD subjects, MCI due to AD, and AD patients, as well as their association to CSF Aβ42, t-tau, and p-tau. These analyses have been focused at the single-connection level in order to be related to known patterns of alterations associated with AD progression. For the sake of the reproducibility and generalizability of our results, these analyses have been performed and compared in two independent samples: a single center cohort and a subsample of the well-known Alzheimer’s Disease Neuroimaging Initiative (ADNI) cohort.
METHODS
Subjects
For this study, two cohorts were used: a single center one (HCB) with 87 subjects (40 controls, 12 preclinical [Pre-AD], 21 MCI due to AD [MCI], 14 AD) and a subsample of the ADNI cohort comprising 96 subjects (28 controls, 16 Pre-AD, 23 MCI due to AD, 29 AD). In the ADNI cohort, subjects were classified as Pre-AD if they were cognitively normal and had CSF Aβ42 below 192 pg/mL and as controls if else, based on previous literature [20]. MCI and AD classification criteria have been reported elsewhere [21].
The HCB dataset was composed by subjects who had been referred to the Alzheimer’s Disease and Other Cognitive Disorders Unit, Hospital Clinic de Barcelona because of a suspicion of cognitive impairment. The local ethics committee approved the study and all participants gave written informed consent. All subjects underwent clinical and neuropsychological assessment, lumbar puncture, MRI scanning, and CSF analysis at the local laboratory. Levels of AD CSF biomarkers Aβ42, t-tau, and p-tau were determined and used as part of the selection criteria (see below).
Control subjects were defined as cognitively normal with the following criteria: Clinical Dementia Rating (CDR) scale score of 0, Mini Mental State Examination (MMSE) score above 26, Free and Cued Selective Reminding Test (FCSRT) and Functional Activities Questionnaire (FAQ) within 1.5×SD (standard deviations), no significant psychiatric symptoms or previous neurological disease and a CSF biomarker profile inconsistent with AD pathology.
Pre-AD subjects were defined according to the following criteria: CDR = 0, MMSE > 26, FCSRT and FAQ within 1.5×SD, no significant psychiatric symptoms or previous neurological disease, and CSF Aβ42 < 500 pg/mL according to our own published cut-offs [22].
The MCI group was defined according to NIA-AA criteria [23] as having high likelihood of being due to AD. In short, they had an amnestic MCI clinical picture, FCSRT < 1.5×SD according to their age and educational level, FAQ < 6, CSF Aβ42 < 500 pg/mL, and a marker of neurodegeneration: t-tau > 450 pg/mL, p-tau > 75 pg/mL, or medial temporal atrophy [6].
Dementia due to AD was defined according to NIA-AA criteria [24]. All patients had a mild dementia clinical picture compatible with probable AD verified through a full neuropsychological examination and after consensus by a multidisciplinary committee, with MMSE scores equal to or below 24 or abnormal scores in the FCSRT (Immediate Free Recall < 15 or Immediate Total Recall < 30 or Delayed Free Recall < 6 or Delayed Total Recall < 11), altered daily living activities as measured by the FAQ (score≥6) and abnormal amyloid and injury markers.
For the ADNI cohort, data were obtained from the ADNI database (http://adni.loni.usc.edu). ADNI, led by Michael W. Weiner, MD, was launched in 2003 as a public-private partnership. Its primary goal has been to test whether serial MRI, positron emission tomography (PET), other biological markers, and clinical and neuropsychological assessment can be combined to measure the progression of MCI and early AD. For up-to-date information, please refer to http://www.adni-info.org.
Lumbar puncture
In HCB, CSF was collected by lumbar puncture between 9 and 12 am, but subjects were not instructed to fast overnight. Samples were processed within 1 h, centrifuged at 4C for 10 min at 2000×g, stored in polypropylene tubes and frozen at –80C. CSF Aβ42, t-tau, and p-tau levels were determined by using an Enzyme-Linked ImmunoSorbent Assay (ELISA) from Innogenetics (Ghent, Belgium).
MRI acquisition characteristics
HCB participants underwent MRI in the same 3T Siemens TrioTim scanner comprising a 3D T1-weighted image with the following parameters: Repetition Time (TR) = 2300 ms, Echo Time (TE) =2.98 ms, Inversion Time (TI) = 900 ms, Flip Angle =9, voxel resolution of 1×1×1 mm3 on 240 sagittal slices; and two diffusion-weighted sequences: TR = 7600 ms, TE = 89 ms, Flip Angle = 90, 30 non-collinear directions (b = 1000 s/mm2) and 1 non-gradient volume (b = 0 s/mm2), voxel size of 2.05×2.05×2 mm2 on 60 axial slices.
ADNI participants were scanned on the same 3T GE MRI model, on 13 different sites, comprising a 3D T1-weighted image: TR = 7.256 ms, TE = 2.988 ms, TI = 400 ms, Flip Angle = 11, voxels resolution of 1.02×1.02×1.2 mm3 on 196 sagittal slices; and a diffusion-weighted sequence: TR = 13000 ms, TE = 69.1 ms, Flip Angle = 90, 41 non-collinear directions (b = 1000 s/mm2) and 5 non-gradient images, voxel resolution of 1.3672×1.3672×2.7 mm3 on 59 axial slices.
Image processing
Briefly, for every subject separately, diffusion weighted images were corrected for eddy current distortions using FMRIB Software Library (FSL) package [25] and then denoised with the overcomplete local PCA method from [26]. The T1-weighted image was first denoised using a non-local mean filter [27] and then corrected for the bias in intensity using the Advanced Normalization Tools (ANTs) N4 algorithm [28]. Resulted denoised and bias-corrected T1 image was segmented with the Statistical Parametric Mapping (SPM) VBM8 toolbox [29] to obtain CSF, gray matter (GM), and white matter (WM) probabilistic maps. Anatomical denoised and bias-corrected T1 images was then coregistered to the diffusion space and to the MNI space using respectively ANTs’ elastic and symmetric normalization [30]. With the combination of these transformations, the Anatomical Automatic Labeling (AAL) template [31] was resampled from the Montreal Neurological Institute (MNI) standard space to the diffusion space. Moreover, WM and GM maps were also resampled from the T1 space to the diffusion space to create boundaries for the tractography.
GM and WM maps were then thresholded at 0.5, binarized and dilated by one voxel. These binary maps were intersected to obtain a binary mask that overlap GM and WM, and multiplied by the AAL atlas in the diffusion space to create a two-voxel thick parcellation along the GM/WM interface. The cerebellum was not included in the parcellation given the difficulty to robustly segment WM/GM in this region. Finally, we first ran FSL’s Bedpostx step to estimate the distribution on diffusion parameters allowing to model crossing fibers in each voxel of the brain. Next, FSL’s ProbtrackX was used to perform probabilistic tractography from each AAL region to each other one, with 5000 seeds per voxel.
In the end, we calculated connectivity between all pair of regions by dividing the number of fibers by the total intra-cranial volume and averaging it through all subjects. In addition, we computed a set of connectivity matrices using an alternative normalization approach that divides the number of tracts by the GM volume of each respective pair of AAL regions. This second normalization was implemented to evaluate whether GM volume differences could have driven results obtained using our main pipeline. Quality control on motion, noise and coregistrations was performed at each step, blinded to group, age, sex, and other covariates. Moreover, we assessed the comparability of the tractography between the two cohorts by performing a correlation analysis, a Bland Altman plot, and by comparing normalized differences (Supplementary Material section 1).
Statistical analyses
Demographic data differences between diagnostic groups were evaluated with t-test or chi-squared for continuous and categorical variable, as appropriate. Differences in connectivity between groups were assessed by an Analysis of Variance (ANOVA) using the 10% strongest connections as dependent variable, diagnostic group as a categorical independent variable and age, gender, education (number of years in school), and APOE ɛ4 status as confounders. We categorized subjects carrying the APOE ɛ4 allele as “carrier” and otherwise as “non-carrier” independently of the number of alleles.
In a second analysis, we replaced the group variable by CSF t-tau, p-tau, and Aβ values (separately when both database were merged) and reported the connections where t-tau, p-tau, or Aβ can explain the difference (decrease or gain) of connectivity. In order to guarantee the comparability of CSF biomarkers levels, values were normalized for those analyses were both datasets were merged using a previously validated index [6].
We extracted the connections where the group can explain the difference of connectivity between: 1) controls and pre-AD, 2) pre-AD and MCI, and 3) MCI and AD. Moreover, to detect differences that may be not significant enough between consecutive groups but show to be significant between non-consecutive ones, we also extracted the connections between groups: a) control and MCI, b) control and AD, and c) pre-AD and AD.
We ran this model on: 1) ADNI and 2) HCB separately at p < 0.05, 3) on ADNI and HCB separately at p < 0.2236 and then we extracted the common connections between the two databases (p < 0.2236×0.2236 = 0.05); and 4) on ADNI and HCB merged together at p < 0.05. In this latter analysis, the sample origin was also entered as a categorical confounder.
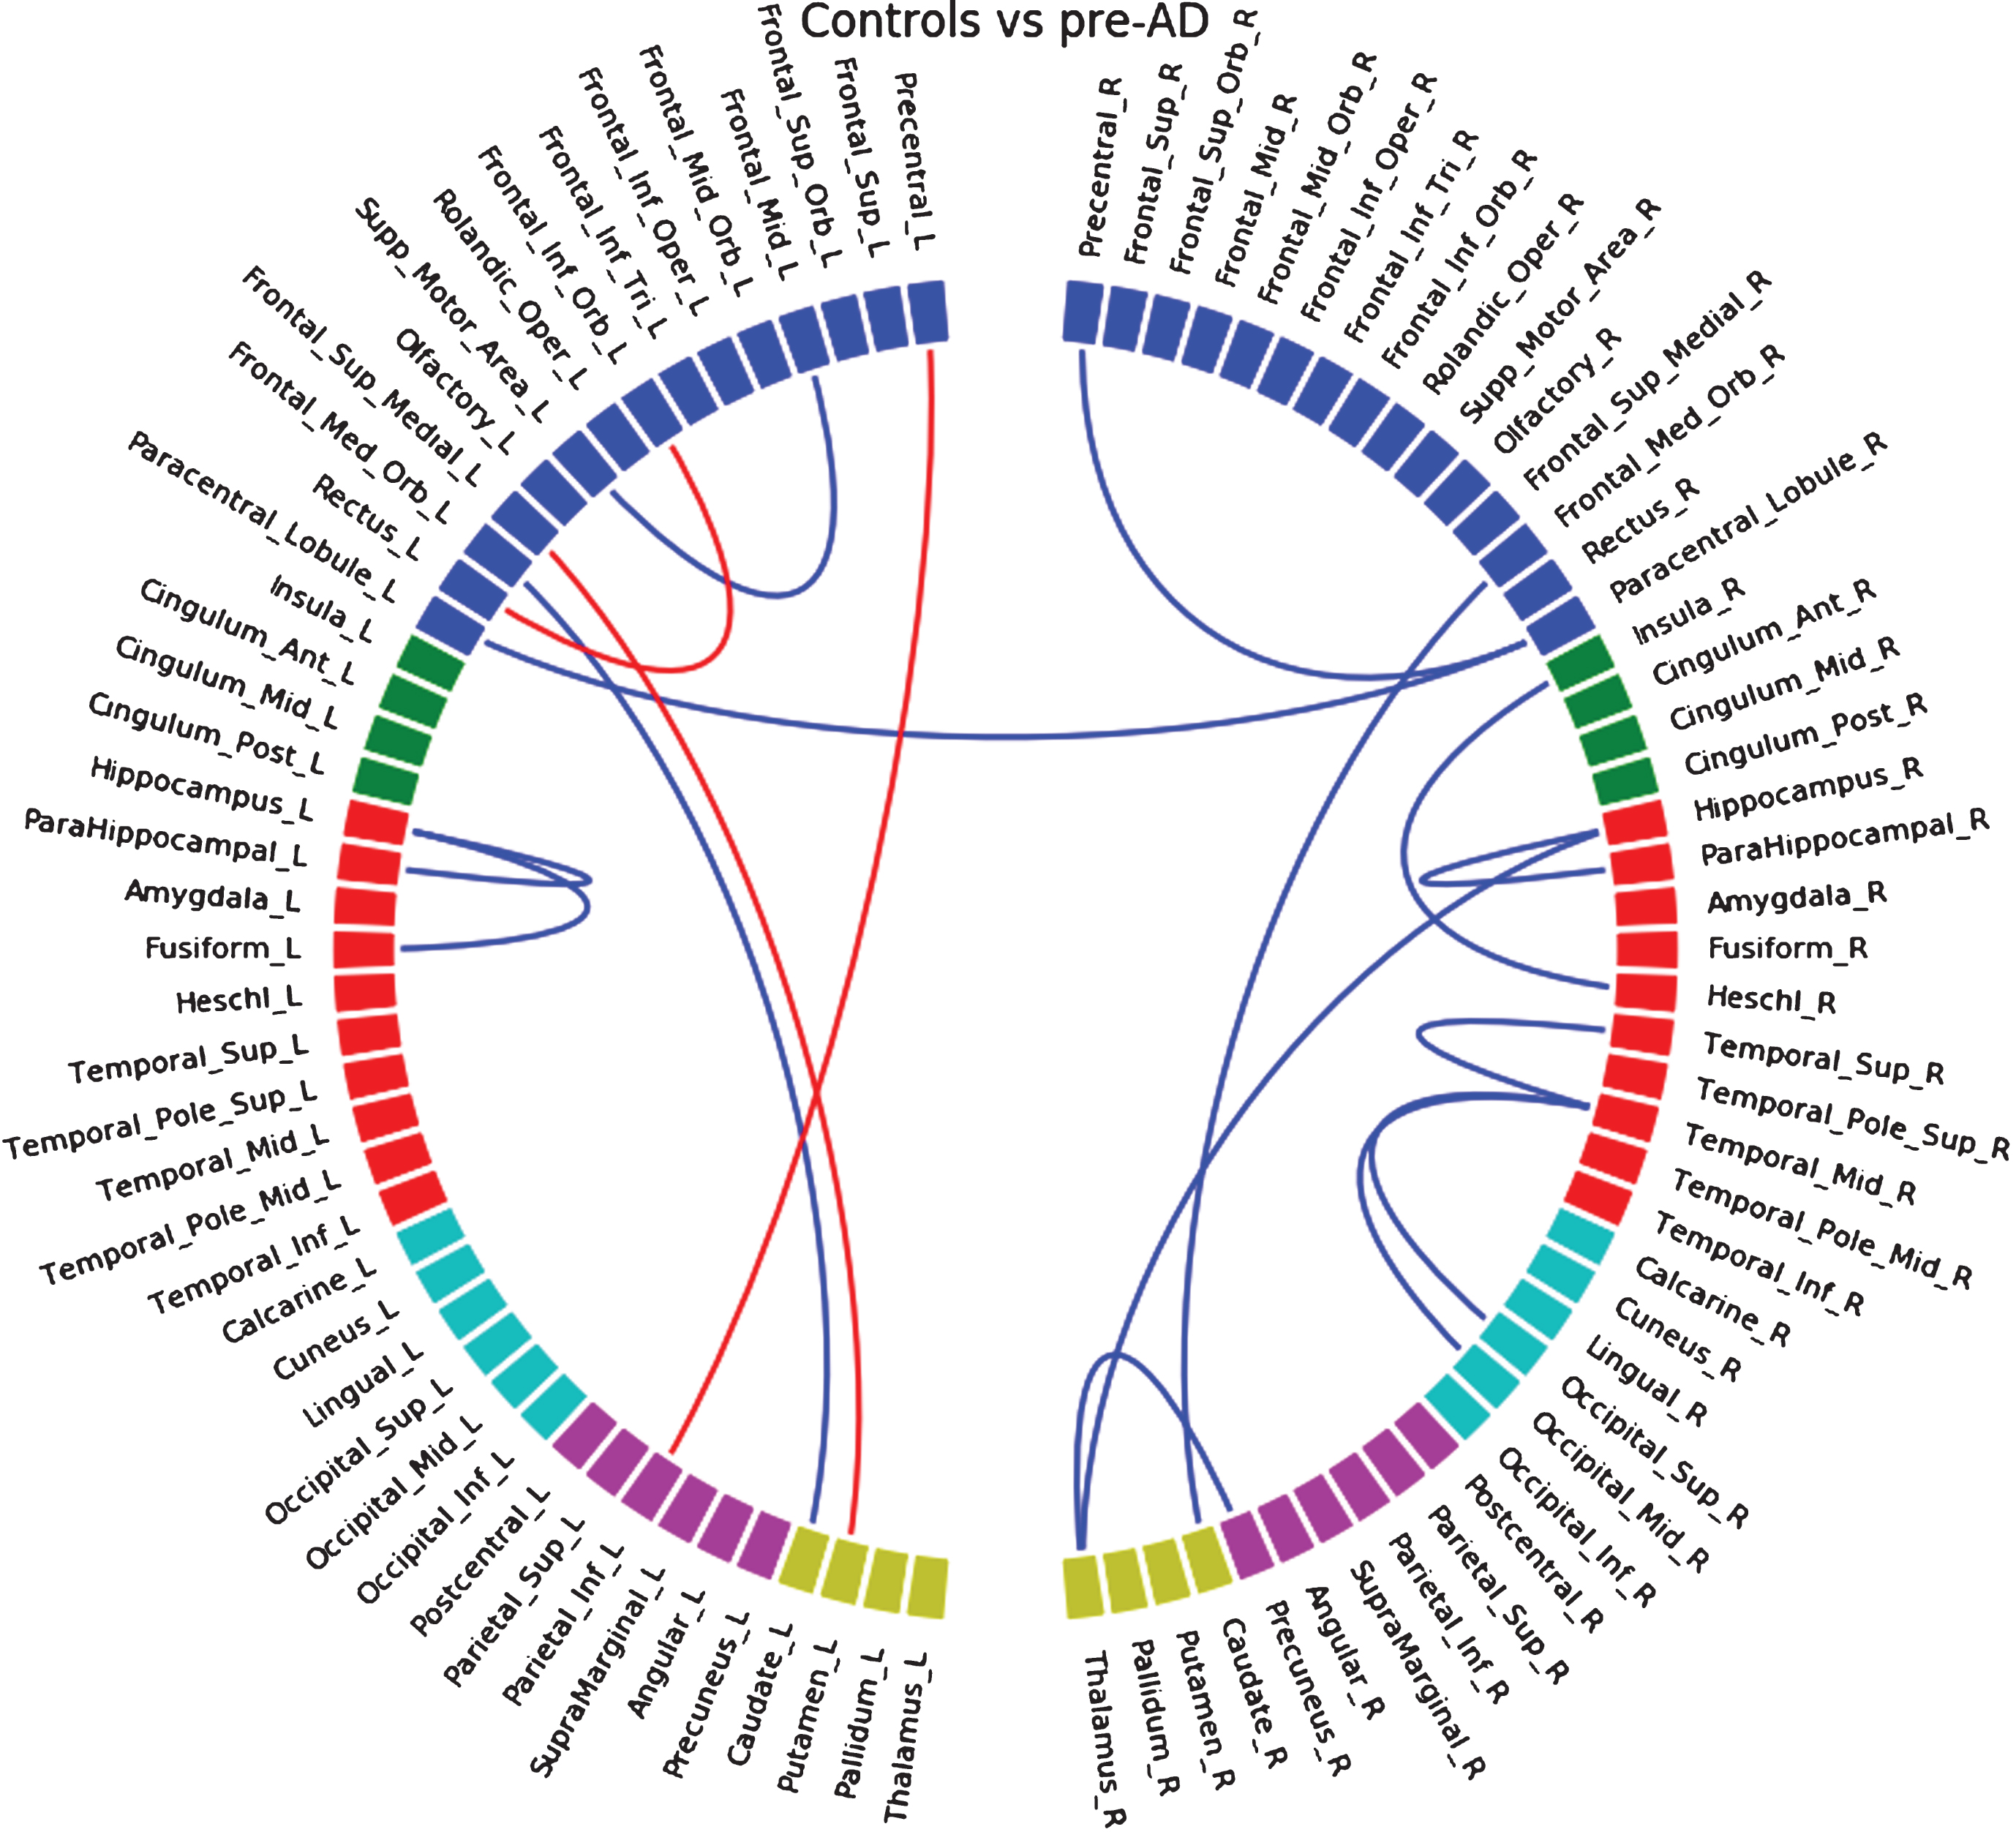
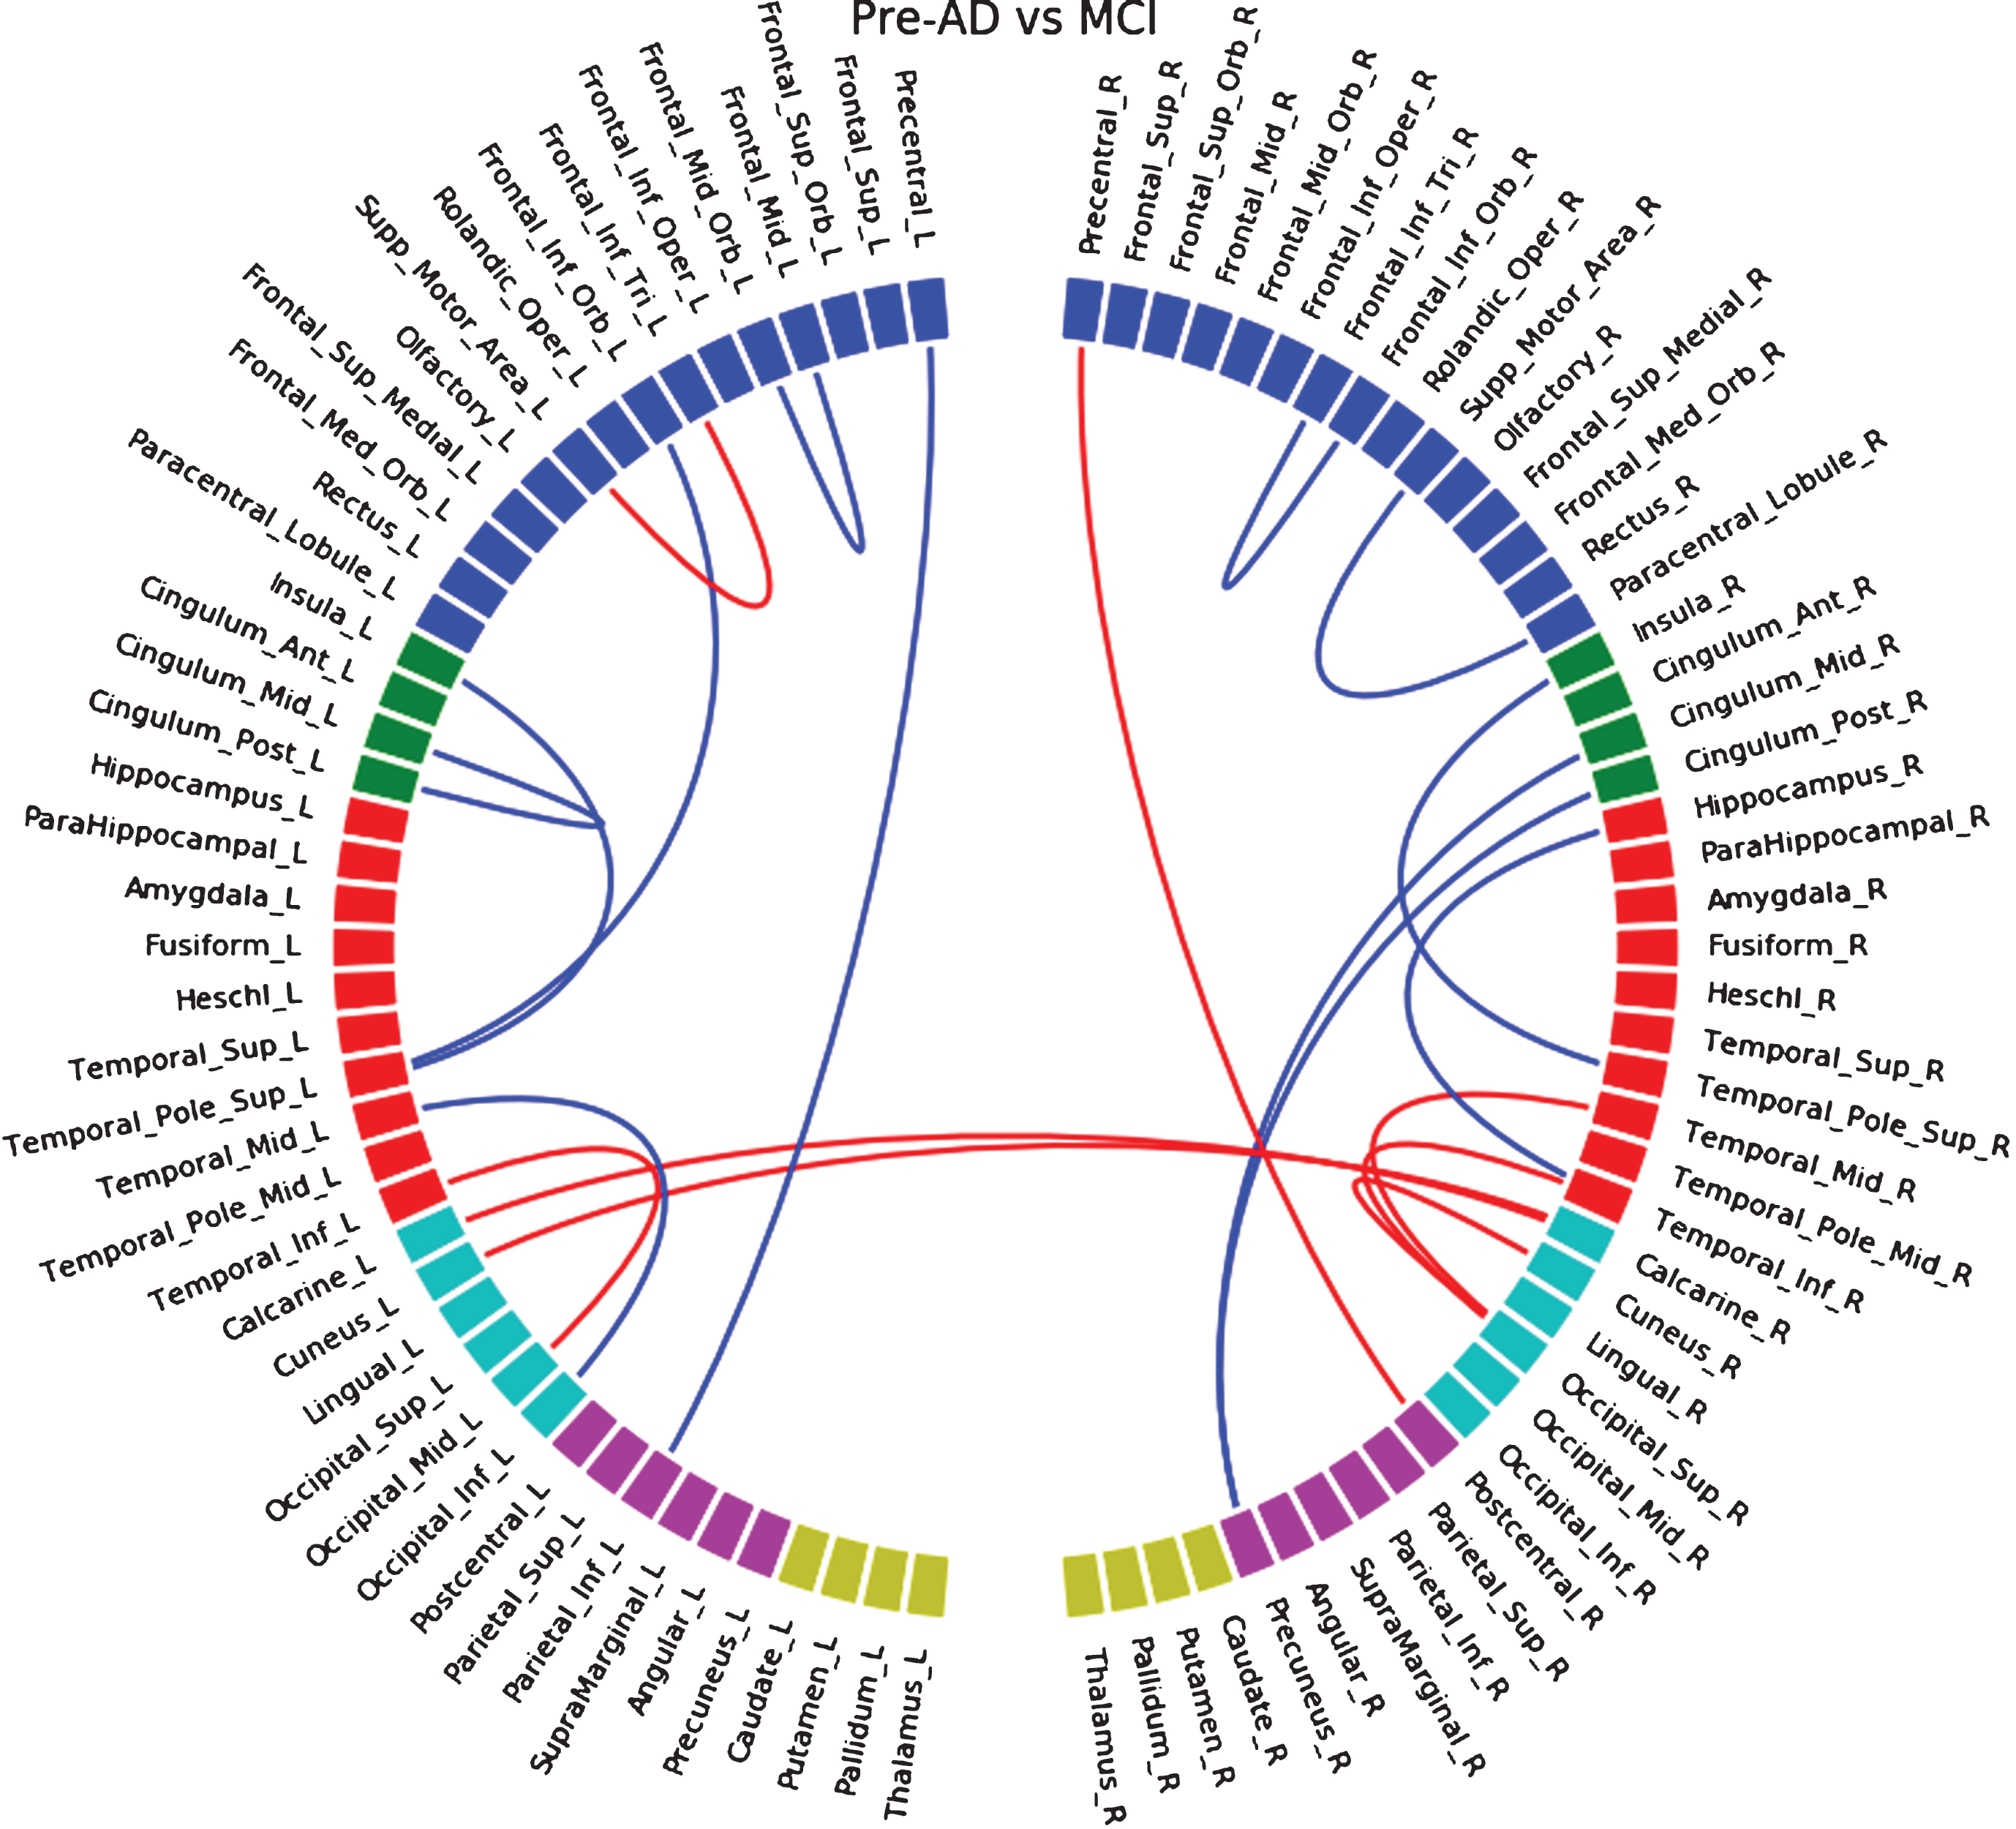
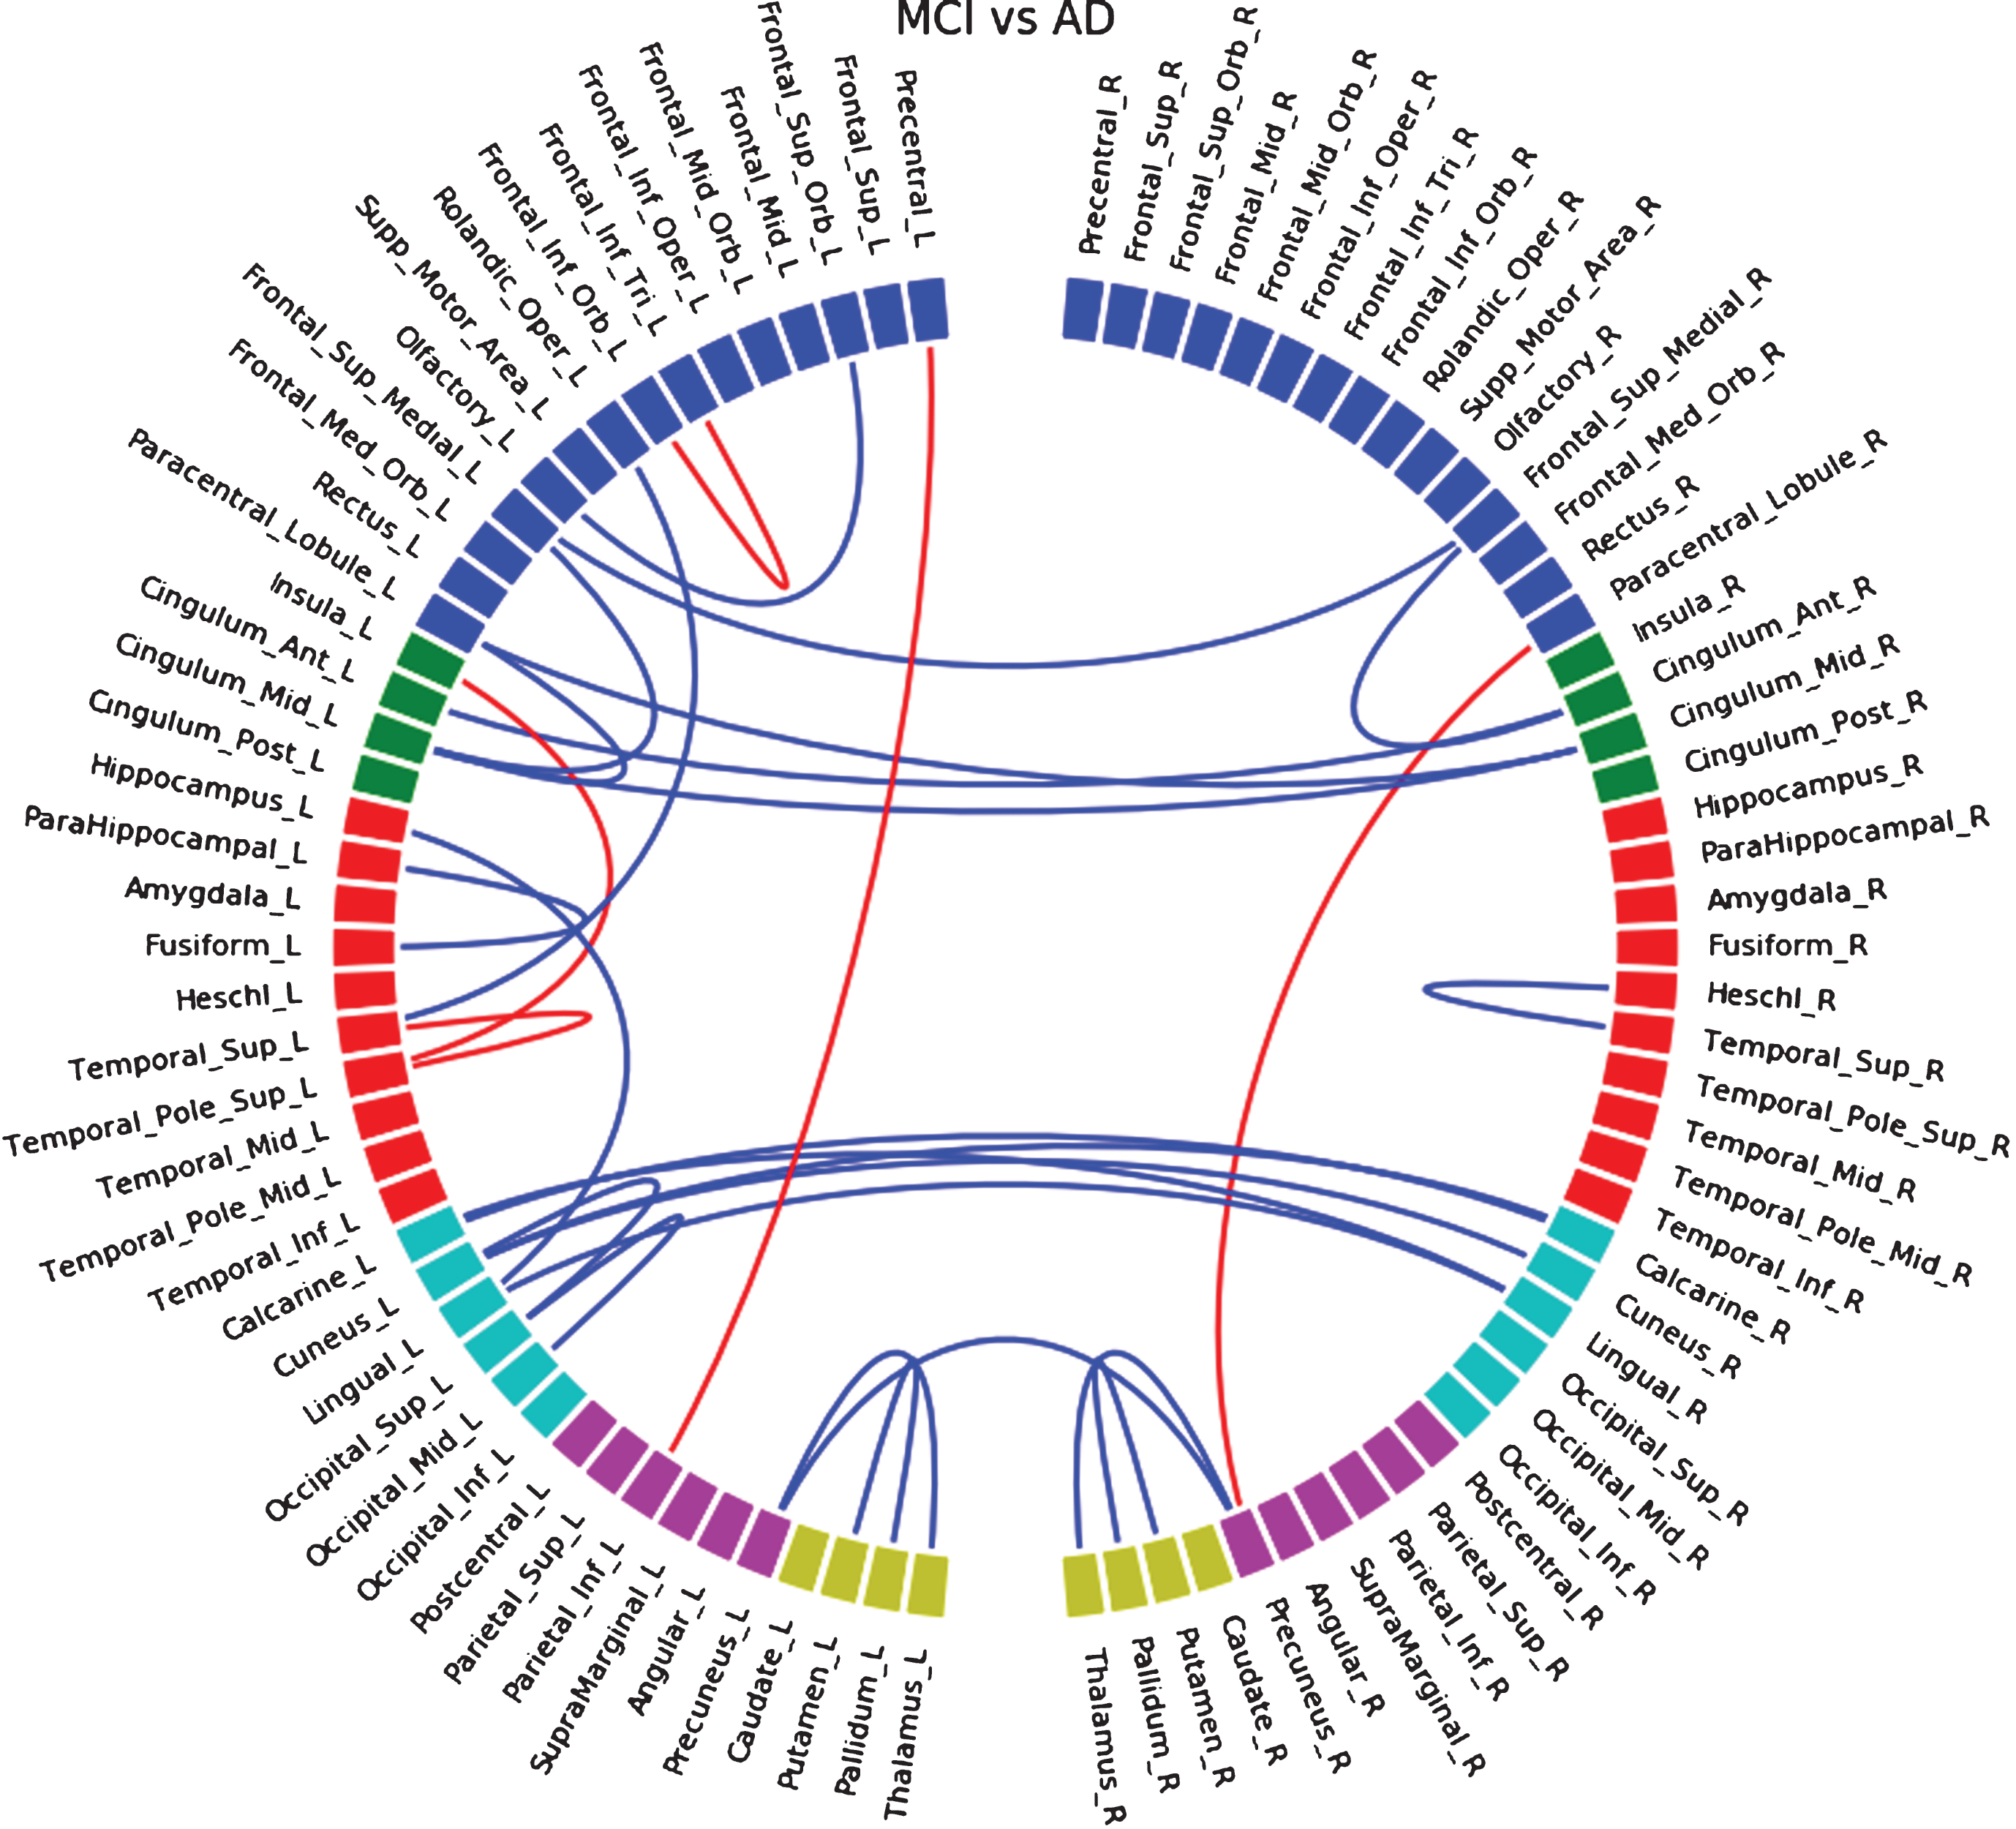
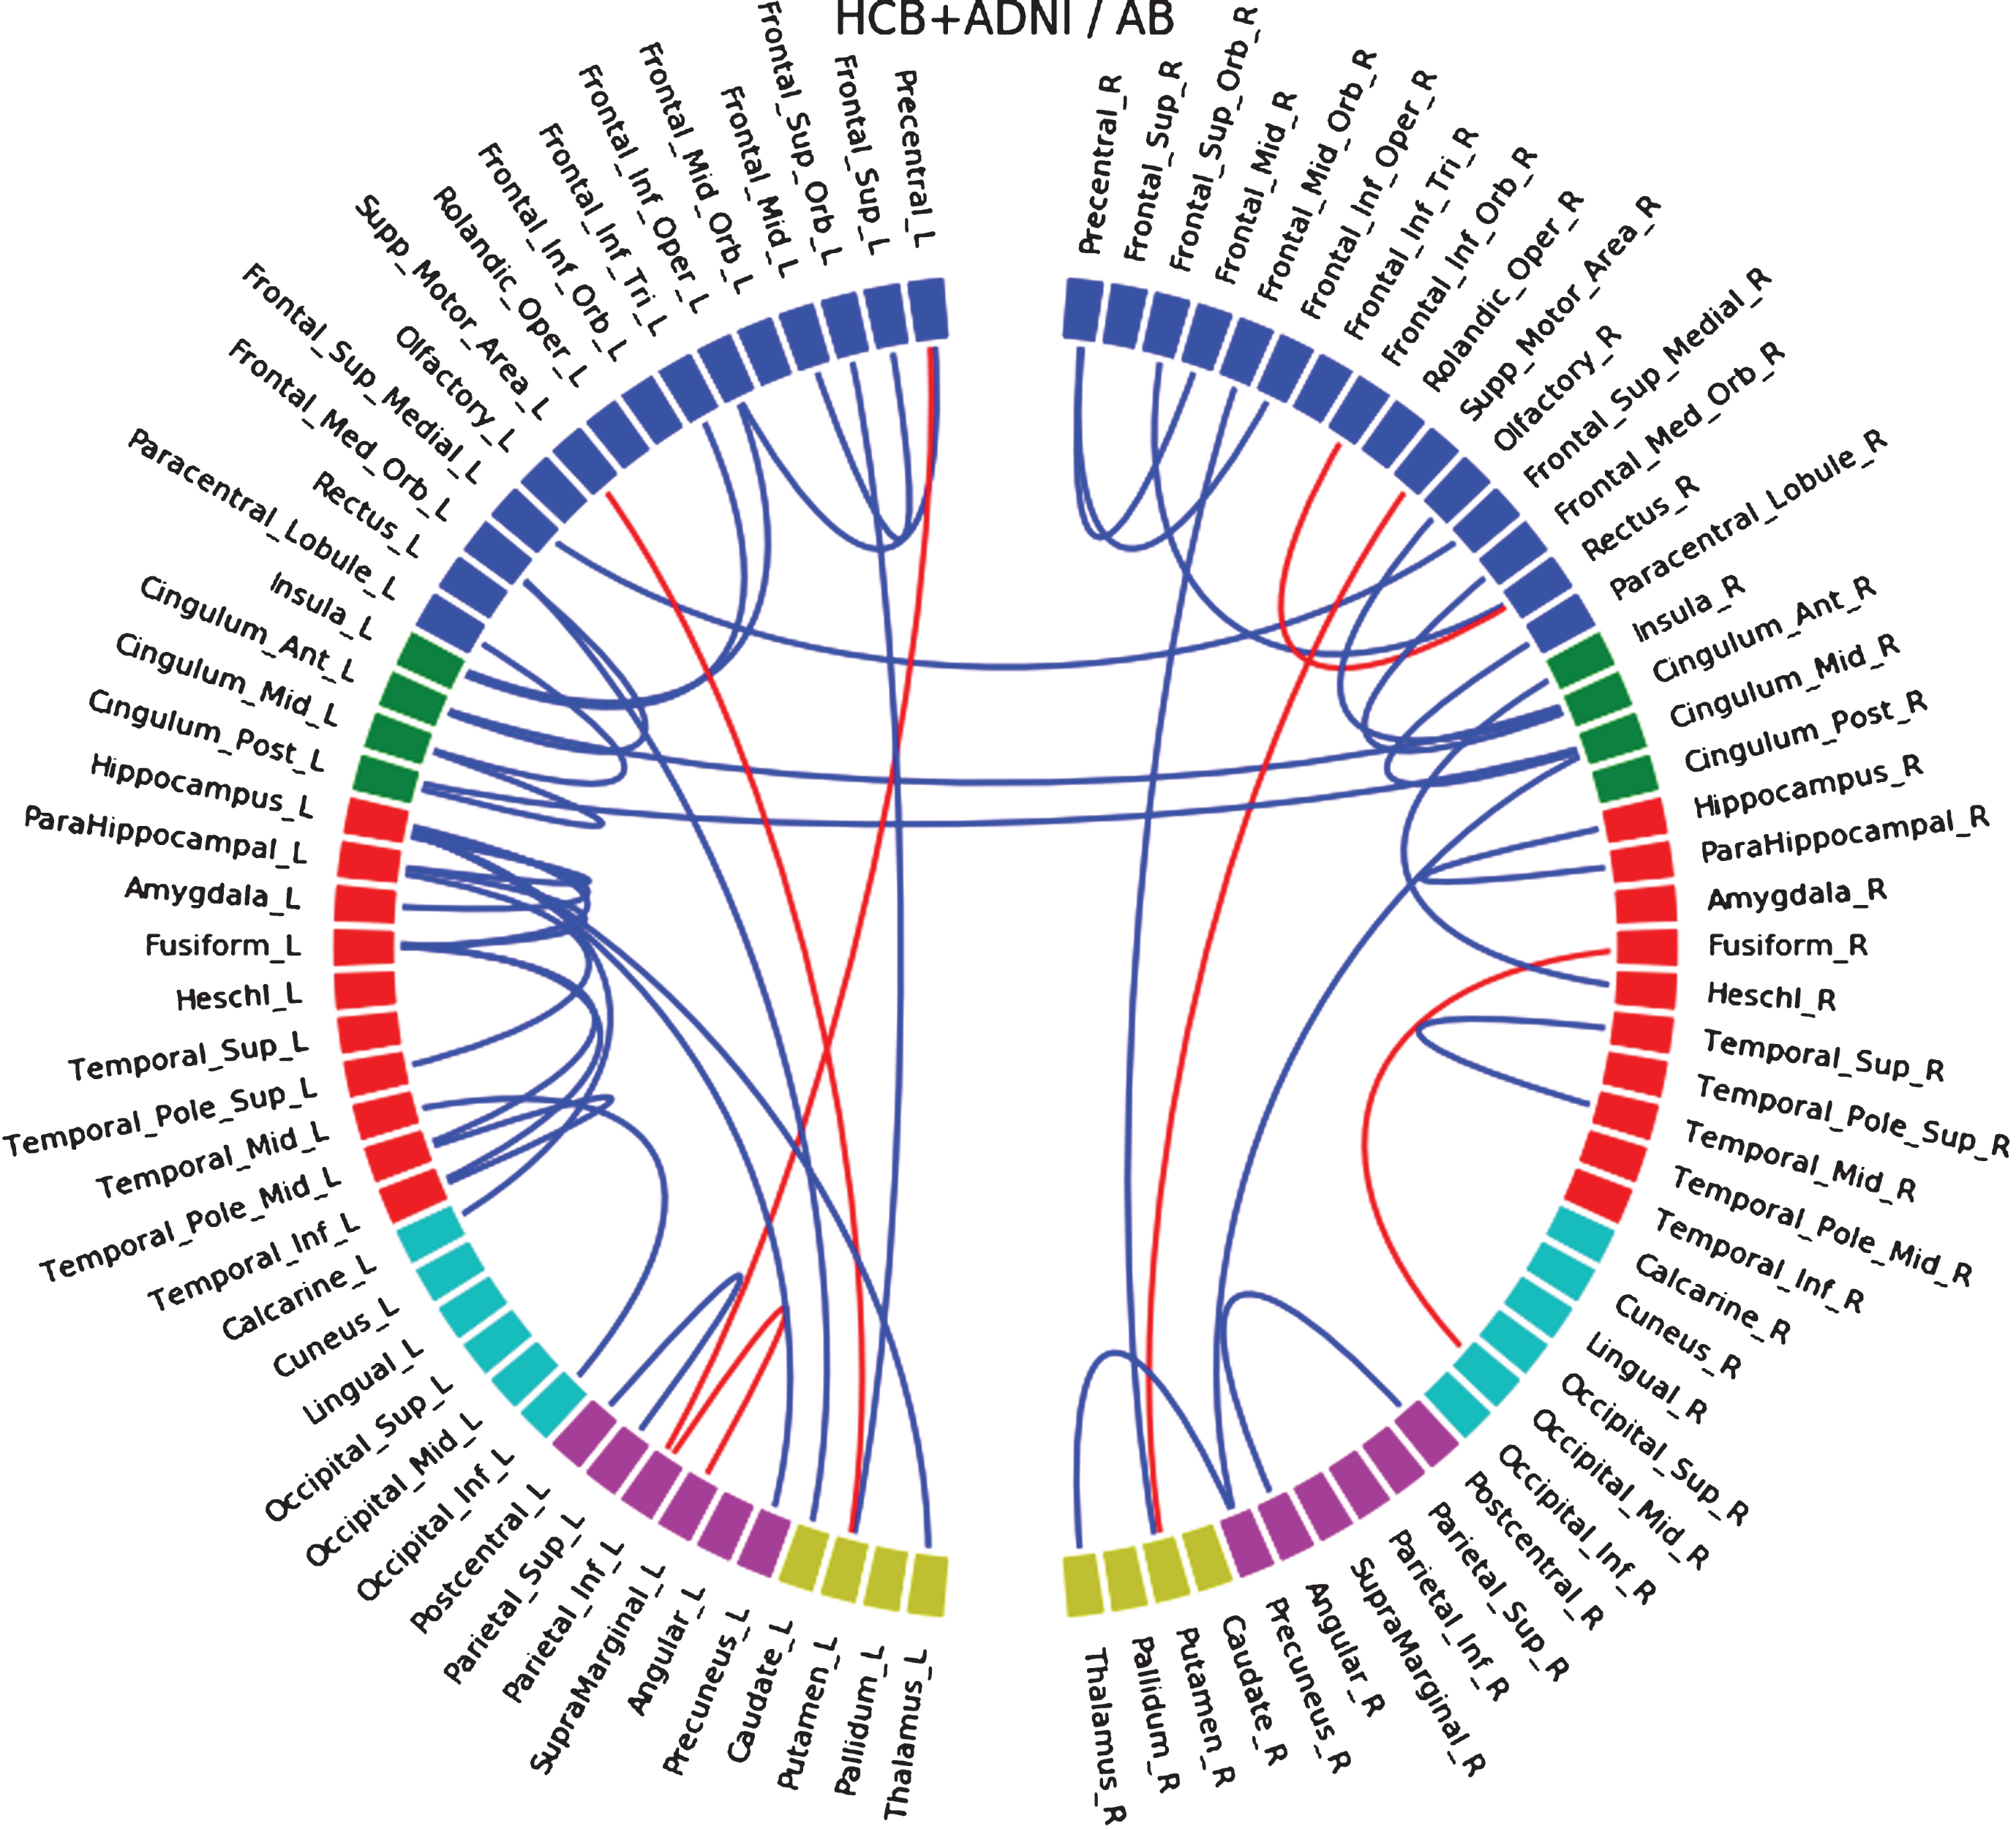
All the results are presented over a round-chart using the MNE toolbox (https://github.com/mne-tools/mne-python). When comparing connectivity between groups, blue lines indicate a gain of connectivity and red lines a loss of connectivity. In correlations with biomarkers, blue lines indicate a positive correlation and red lines a negative one. The round-chart is separated vertically in two hemicycles representing respectively the left/right hemisphere on the left/right side. Regions are regrouped by lobes, blue: frontal, green: insula and cingulate, red: temporal, cyan: occipital, magenta: parietal, and yellow: central structures.
RESULTS
Demographic characteristics and biomarkers comparison
The main characteristics of the study samples are summarized in Table 1. AD participants underwent less years of formal education than controls in both HCB and ADNI (p < 0.05). ADNI participants were in general older, and underwent much more years of formal education than HCB participants. There were more APOE ɛ4 carriers in MCI and AD groups in ADNI and non-carriers in controls in HCB and ADNI. Representation of Aβ and p-tau levels across diagnostic groups in both datasets are available in the Supplementary Material (Supplementary Figure 2).
Table 1
Demographics and biomarkers, HCB and ADNI separately, and for HCB and ADNI merged together
| HCB | ADNI | HCB+ADNI | ||||||||||
| NC | Pre | MCI | AD | NC | Pre | MCI | AD | NC | Pre | MCI | AD | |
| N | 40 | 12 | 21 | 14 | 28 | 16 | 23 | 29 | 68 | 28 | 44 | 43 |
| Women/Men | 26/14 | 7/5 | 10/11 | 8/6 | 15/13 | 10/6 | 7/16 | 11/18 | 41/27 | 17/11 | 17/27 | 19/24 |
| Mean Age | 62.1 | 72.7* | 70* | 65.9† | 71.8‡ | 75.8* | 72.4 | 74.2‡ | 66.1 | 74.5* | 71.3* | 71.5* |
| SD | 8.5 | 6 | 7.5 | 9 | 5.1 | 4.6 | 8 | 7.8 | 8.7 | 5.5 | 7.9 | 9.1 |
| Mean education (y) | 11.9 | 10.6 | 11 | 8.6* | 17.2‡ | 16.2‡ | 16.1‡ | 15.2* | 14.1 | 13.8 | 13.7 | 13 |
| SD | 4.4 | 4 | 4.3 | 4.2 | 2.6 | 2.1 | 2.8 | 2.8 | 4.6 | 4.2 | 4.4 | 4.5 |
| APOE ɛ4 carrier | 9 | 4 | 10 | 8 | 7 | 8 | 21 | 20 | 16 | 12 | 31 | 28 |
| Non-carrier | 31 | 8 | 10 | 6 | 21 | 8 | 2 | 9 | 52 | 16 | 12 | 15 |
| Mean Aβ | 760.8 | 375.8 | 339.1 | 310.7 | 239 | 148.5 | 135.7 | 130 | ||||
| SD | 160.3 | 80.1 | 71.9 | 83.9 | 25.7 | 24.1 | 20.7 | 23.1 | ||||
| Mean p-tau | 56.6 | 76.6 | 112.2 | 105.7 | 31.2 | 51.7 | 52.9 | 66.6 | ||||
| SD | 27.7 | 47.8 | 43.7 | 43 | 12.2 | 32.9 | 18.7 | 43 | ||||
*Significantly different versus Control group (p < 0.05); †Significantly different versus Preclinical group (p < 0.05); ‡Significantly different versus same group in HCB population (p < 0.05). NC, normal controls; Pre, preclinical; MCI, mild cognitive impairment due to AD; AD, Alzheimer’s disease patients.
Structural connectivity between groups
This section roughly summarizes changes in connections (decrease or increase) between groups in 1) HCB and 2) ADNI databases separately, then 3) common connections at a higher threshold between both databases, and finally 4) on HCB and ADNI merged together. In this paper, we included only figures when HCM and ADNI are merged together because we believe they are the most representative findings; figures with only HCM, only ADNI and the intersection between HCM and ADNI can be found in the Supplementary Material.
Between control and pre-AD groups of the HCB cohort (Supplementary Figure 3), we found a decrease in connectivity in left and right temporal lobe (mostly with the hippocampus and parahippocampus) and in left and right occipital lobe, and an increase in connectivity in left and right anterior frontal areas. In the ADNI database (Supplementary Figure 4) we also found decrease in hippocampus/parahippocampus connections but also an increase between caudate and putamen in both hemispheres. Common loss in connectivity between both databases at a higher threshold (Supplementary Figure 5) appeared between frontal medial orbital region and caudate in both hemispheres, also found when merging HCB and ADNI (Fig. 1).
Fig.1
Differences in connectivity between the control group and the pre-ad group, when both HCB and ADNI dataset are merged together. Blue lines indicate a decrease of connectivity and red lines an increase.
Between pre-AD and MCI participants of the HCB database, decreases of connectivity (Supplementary Figure 6) were mostly located in frontal regions. We mainly observed increases of connectivity in occipital regions and occipito-temporal connections. In the ADNI dataset (Supplementary Figure 7), we observed a significant loss of connections in temporal, parietal, and anterior frontal regions, and rare increases of connection in the parietal lobe. Common disconnections between both databases (Supplementary Figure 8) were mostly located in the parietal lobe and with the middle cingulate gyrus. By merging both datasets (Fig. 2) we observed a similar pattern to the ADNI database only, with an additional increase of connections in the occipital lobe.
Fig.2
Differences in connectivity between the pre-ad group and the MCI group, when both HCB and ADNI dataset are merged together. Blue lines indicate a decrease of connectivity and red lines an increase.
Finally, between MCI and AD patients we observed interhemispheric changes. In HCB (Supplementary Figure 9) we detected disconnections between left and right anterior cingulate gyrus, calcarine cortex, lingual gyrus, precuneus, and increased connections between left and right paracentral lobule. In ADNI (Supplementary Figure 10) we observed interhemispheric disconnection between left and right anterior cingulate gyrus, and left and right frontal superior medial regions. We also found bilateral disconnection between the putamen and the pallidum. Similar disconnections between both databases (Supplementary Figure 11) were found to be interhemispheric between anterior cingulate gyrus, and between middle cingulate gyri. When merging both databases (Fig. 3), we found more interhemispheric disconnections located in occipital and parietal lobes.
Fig.3
Differences in connectivity between the MCI group and the AD group, when both HCB and ADNI dataset are merged together. Blue lines indicate a decrease of connectivity and red lines an increase.
Because the main purpose of this study was to evaluate the evolution of white matter connections through the AD continuum, we reported here the altered connections between controls and pre-AD, pre-AD and MCI, and MCI and AD groups. However, differences in connections between controls and MCI patients (Supplementary Figures 12–15), controls and AD patients (Supplementary Figs. 16–19), and pre-AD and ADs (Supplementary Data Figure 20–23) are found in Supplementary Material sections 6–8.
Correlations of connections with biomarkers
In the HCB database, we observed a correlation between the decrease of Aβ and the decrease of connectivity located mostly in temporal regions and insula, but also at a lower level in some frontal occipital and parietal connections (Supplementary Figure 24). Interestingly, we found a negative correlation (increase of connectivity with decrease of Aβ) bilaterally between supplementary motor area and putamen. In the ADNI database, we observed a similar correlation between temporal connections and Aβ; however, we did not find the negative correlation with the putamen (Supplementary Figure 25). When merging both databases (Fig. 4), we found positive correlation in temporal, frontal (mostly inferior), parietal, and interhemispheric anterior cingulate connections, and also the negative correlation with supplementary motor area to putamen connections in both hemispheres.
Fig.4
Connections that correlate with level of Aβ when both HCM and ADNI dataset are merged together. Blue lines indicate a positive correlation and red lines a negative one.
Similarly, we performed a correlation analysis with the level of CSF p-tau. This showed a statistically significant negative correlation in the HCB sample. However, this result could not be reproduced in the ADNI database (Supplementary Material section 10 and Supplementary Figures 26–28).
Regional volume-adjusted analyses
To estimate if gray matter volume of cortical regions may actually alter the connectivity, we normalized the quantity of streamlines between each pair of regions using the sum of gray matter volume of both regions, instead of using total intracranial volume, while still keeping seeding regions 2 voxels thick overlapping gray and white matter. Results (Supplementary Figures 29–31) were altered when comparing Controls and Pre-AD groups, but very similar when comparing MCI and AD groups. This indicates that strong changes in connectivity (the developed in later stages of the disease) are less impacted by the global neuro-degeneration that appear with the disease. On the other hand, connectivity is altered by GM ROIs normalization (compared to total intracranial normalization) in earlier stages where changes in cortical anatomy is actually less visible. This may indicate that actual quantity of gray matter in cortical ROIs is not relevant in tractography, therefore using total intracranial volume seems a better option for normalization. Moreover, there is no consensus for normalization of the number of streamlines in structural connectivity through whole brain white matter tractography; however, the most common method is to use total intracranial volume, therefore this is what we reported in this study.
DISCUSSION
In this article, we studied structural dwMRI-based connectivity following the clinico-biological continuum of AD, from normal, through preclinical, to clinical stages in two independent samples. We observed a gradual disconnection of the whole brain with the progression of the disease, starting in the temporal lobe, spreading toward the lower frontal and parietal areas in MCI, and finally affecting interhemispheric connections in AD. Although most connectivity alterations involved cortico-cortical circuits, noteworthy cortico-subcortical alterations involving the caudate were detected even in preclinical subjects, suggesting possible early involvement of subcortical nuclei in sporadic AD, therefore replicating similar findings that had been previously described in familial AD [33–35]. Similar differences were found in both samples at inter- and intra-lobes level, which correlated well with Aβ42 but not with t-tau and p-tau CSF levels.
The initial amnesic syndrome typically associated to early stages of AD is thought to be associated to neuronal loss and early neurofibrillary tangle pathology in the hippocampus, the medial temporal lobe and other limbic and heteromodal cortical regions. These alterations have been detected through structural MRI and PET imaging in very mild and even prodromal stages of AD. However, converging evidence suggests that episodic memory, executive function, and other cognitive functions affected in AD depend on the integrity and interplay of large-scale networks. In this regard, functional-MRI studies have revealed alterations in a set of distributed, large-scale neural networks detected either during memory tasks or during the resting state. In addition, fronto-parietal cortical networks supporting executive function and attentional processes also likely interact with these memory systems [36], and multiple cognitive domains become impaired as AD progresses. In this regard, our findings suggest that tractography methods could increase the prognostic capability of other neuroimaging methods, although further longitudinal studies are needed to confirm this hypothesis.
One of our main findings is that between-group altered connections in temporal, lower frontal, and parietal regions are found to be similar to the pattern of connections correlating with Aβ42 levels. This suggests that these disconnections may reflect early-stage changes in the brain, and is in line with converging evidence suggesting a direct role of Aβ in white matter alteration [37, 38]. On the other hand, connections associated with t-tau and p-tau protein levels are not as consistent between the two cohorts, even when merging them together. The most plausible explanation for this finding is that our sample is mainly composed by either controls or subjects who are in an early phase of the disease, where the range of changes in CSF levels is known to be wider for Aβ than t-tau or p-tau. Alternative potential explanations include that t-tau and p-tau levels may not be good predictors for changes in white matter tracts, that tractography algorithms may not be sensitive enough to be affected by white-matter tau related changes, or that tau related neurodegeneration might negatively impact the sensitivity of tractography algorithms.
One particular concern when using tractography in neurodegenerative diseases is how its estimations are affected by gray matter atrophy and, also, to what extent the differences observed reflect axonal degeneration secondary to neuronal loss or do really represent primary damage to white matter. In order to minimize the influence of atrophy in our results, we intended the tractography pipeline to be insensitive to changes in cortical thickness. To this end, tractography seeds were only placed in the immediate boundaries along the gray/white matter interface. To assess whether this strategy was successful, we repeated the analyses normalizing the fiber-tracts by the volume of the ROIs used for the tractography instead of total intracranial volume. We obtained similar results using both approaches, thus supporting that our findings mainly reflect primary alterations in white matter rather than secondary alterations due to neurodegeneration. However, some differences arose at the single connection level. In the ROI volume-adjusted analysis, interhemispheric connections almost disappeared in advanced stages, but were preserved when comparing AD patients with controls. This could reflect that connectivity changes are not linear across the AD continuum, or that the tractography algorithms used are not sensitive enough to capture them. Also, regions with increased connectivity were less frequently observed when we adjusted the analyses by regional volume, which suggests that atrophy due to neurodegeneration might affect the quantity of tracks that are estimated with tractography algorithms.
To our knowledge, this is the first study comparing region-to-region connectivity through white-matter tractography with Aβ and tau biomarkers. A previous study, however, did report a correlation between amyloid burden and changes in whole brain network topology in pre-AD participants [40]. Another study reported differences in whole-brain network metrics in preclinical AD subjects, that were not related to alterations in neurodegeneration markers [15]. Conversely, they did not find alterations in DTI surrogates of white matter integrity (i.e., FA and MD). In light of these and our results, we might hypothesize that network analyses, both at a global or regional level, might be more sensitive to subtle early structural AD changes than other putative neuroimaging biomarkers.
Among the main strengths of the present study are the reproducibility of our results across two independent cohorts, at least at a lobar level, and their biological plausibility, as they reproduce the characteristic pattern of spread of AD pathology, which starts in the temporal lobe and extends to frontal and parietal associative cortex. On the other hand, results were not as robust at the individual connection level and we found discrepancies between both databases. In this regard, it is worth noting that these two cohorts display notable demographic differences. ADNI participants are older, underwent more years of formal education, have more men and more APOE ɛ4 carriers. Even if we add those parameters as covariates in the model, we cannot predict for lifestyle habits and other factors that also may impact the course of the disease, and therefore have an impact on single connections. However, it is interesting to see that, when increasing the statistical threshold (being more liberal), connectivity became more similar between both databases at the single connection level. We believe that not correcting for multiple comparisons in this study is sensible given its exploratory nature and in the view of what has been recently reported in similar papers [15].
Unexpectedly, we found some increased connections with advancing clinical stages. The significance of such increments is still under debate. Some previous studies reported that loss of myelination in specific pathways can increase diffusivity in a crossing bundle, and higher axial diffusivity may result in an increase of tracts due to the nature of tractography algorithms [14, 41]. Other authors claim that increased structural connectivity in neurodegenerative diseases might reflect a compensatory remodeling of neural circuits [42]. In our study, we cannot completely rule out that some of these unexpected findings could be caused by the effect of neuronal loss on the estimations obtained by our tractography methods. Further studies are needed to elucidate to what extent these findings reflect real biological changes or are related to a lack of accuracy of the tractotraphy algorithms.
The main limitation of our study lies in its cross-sectional nature. Therefore, we have assumed that division into groups reflects the evolution of the disease. Even though being a sensible assumption, our findings need further confirmation with a longitudinal follow-up of the same subjects (similarly to [43]) that may convert between groups. The limited sample size is another important limitation in terms of assuming a normal distribution of the variables analyzed. However, we decided to use parametric instead of non-parametric tests to control for relevant confounders and to avoid an excessive loss of statistical power. The limited sample size has also precluded a multiple comparisons correction, in order to avoid false negatives in the context of an exploratory study. In order to minimize the risk of accepting false positives, we opted instead for conforming our findings in two independent cohorts of different demographic characteristics. We think that showing converging results in two intendent cohorts provides a strong protection against false positives and speaks loudly for the generalizability of our findings. Another limitation is that anatomical parcellation based on gyri does not reproduce cytoarchitectonic division of the brain and may not perfectly overlap bundles of white matter fibers. Further analysis should be performed to assess if different or thinner parcellation could affect connectivity. We must also acknowledge that our analyses were not corrected for the presence of white matter lesions and cerebral infarcts, which are known to disrupt white matter tracts structure [32, 39]. Unfortunately, not all subjects in our local cohort had scans to assess the presence and severity of white matter lesions. Nevertheless, the vast majority of those that could be assessed had Fazekas scores equal or below one, which therefore may not contribute significantly to white matter disruption. In the ADNI cohort, only 7 out of 96 had WML volumes over 25 mL, according to published ADNI WMH volumes (Version: 2015-10-26), which are typically associated to abnormal Fazekas scores [44]. The low observed prevalence of abnormal levels of WML in both cohorts suggest that our findings are mainly driven by AD related pathology and not by the presence of WML. Finally, it must also be noted that both samples came from memory clinic-based cohorts, and therefore we cannot exclude a selection bias influencing our results.
In conclusion, our study shows common structural connectivity changes along the AD continuum in two independent samples and suggest that structural connectivity can be a reliable biomarker to detect early cerebral alterations in asymptomatic individuals in the preclinical stage of AD.
ACKNOWLEDGMENTS
The research leading to these results has received support from the Innovative Medicines Initiative Joint Undertaking under grant agreement n° 115568, resources of which are composed of financial contribution from the European Union’s Seventh Framework Programme (FP7/2007-2013) and EFPIA companies’ in kind contribution. Part of the data collection were financed by grant number PI14/00282, received by Albert Lladó from the Spanish Ministry of Economy and Competitiveness ISCIII which was co-funded by the European Regional Development Fund (ERDF). Juan D. Gispert holds a ‘Ramón y Cajal’ fellowship (RYC-2013-13054).
ADNI data collection and sharing was funded by the Alzheimer’s Disease Neuroimaging Initiative (ADNI) (National Institutes of Health Grant U01 AG024904) and DOD ADNI (Department of Defense award number W81XWH-12-2-0012). ADNI is funded by the National Institute on Aging, the National Institute of Biomedical Imaging and Bioengineering, and through generous contributions from: AbbVie, Alzheimer’s Association; Alzheimer’s Drug Discovery Foundation; Araclon Biotech; BioClinica, Inc.; Biogen; Bristol-Myers Squibb Company; CereSpir, Inc.; Cogstate; Eisai Inc.; Elan Pharmaceuticals, Inc.; Eli Lilly and Company; EuroImmun; F. Hoffmann-La Roche Ltd and its affiliated company Genentech, Inc.; Fujirebio; GE Healthcare; IXICO Ltd.; Janssen Alzheimer Immunotherapy Research & Development, LLC.; Johnson & Johnson Pharmaceutical Research & Development LLC.; Lumosity; Lundbeck; Merck & Co., Inc.; Meso Scale Diagnostics, LLC.; NeuroRx Research; Neurotrack Technologies; Novartis Pharmaceuticals Corporation; Pfizer Inc.; Piramal Imaging; Servier; Takeda Pharmaceutical Company; and Transition Therapeutics. In Canada, the Canadian Institutes of Health Research is providing funds to support ADNI clinical sites. Private sector contributions are facilitated by the Foundation for the National Institutes of Health (http://www.fnih.org). The grantee organization is the Northern California Institute for Research and Education, and the study is coordinated by the Alzheimer’s Therapeutic Research Institute at the University of Southern California. ADNI data are disseminated by the Laboratory for Neuro Imaging at the University of Southern California.
The present communication reflects the authors’ view and neither IMI nor the European Union, EFPIA, or any Associated Partners are responsible for any use that may be made of the information contained herein.
Authors’ disclosures available online (https://www.j-alz.com/manuscript-disclosures/17-0553r1).
SUPPLEMENTARY MATERIAL
[1] The supplementary material is available in the electronic version of this article: http://dx.doi.org/10.3233/JAD-170553.
REFERENCES
[1] | Frisoni GB , Fox NC , Jack CR Jr , Scheltens P , Thompson PM ((2010) ) The clinical use of structural MRI in Alzheimer disease. Nat Rev 6: , 67–77. |
[2] | Braak H , Zetterberg H , Del Tredici K , Blennow K ((2013) ) Intraneuronal tau aggregation precedes diffuse plaque deposition, but amyloid-β changes occur before increases of tau in cerebrospinal fluid. Acta Neuropathol 126: , 631–641. |
[3] | Sperling RA , Aisen PS , Beckett LA , Bennett DA , Craft S , Fagan AM , Iwatsubo T , Jack CR Jr , Kaye J , Montine TJ , Park DC , Reiman EM , Rowe CC , Siemers E , Stern Y , Yaffe K , Carrillo MC , Thies B , Morrison-Bogorad M , Wagster MV , Phelps CH ((2011) ) Toward defining the preclinical stages of Alzheimer’s disease: Recommendations from the National Institute on Aging- Alzheimer’s Association workgroups on diagnostic guidelines for Alzheimer’s disease. Alzheimers Dement 7: , 280–292. |
[4] | Stricker NH , Dodge HH , Dowling NM , Han SD , Erosheva EA , Jagust WJ ((2012) ) CSF biomarker associations with change in hippocampal volume and precuneus thickness: Implications for the Alzheimer’s pathological cascade. Brain Imaging Behav 6: , 599–609. |
[5] | Gispert JD , Rami L , Sánchez-Benavides G , Falcon C , Tucholka A , Rojas S , Molinuevo JL ((2015) ) Nonlinear cerebral atrophy patterns across the Alzheimer’s disease continuum: Impact of APOE4 genotype. Neurobiol Aging 36: , 2687–2701. |
[6] | Molinuevo JL , Gispert JD , Dubois B , Heneka MT , Lleo A , Engelborghs S , Pujol J , de Souza LC , Alcolea D , Jessen F , Sarazin M , Lamari F , Balasa M , Antonell A , Rami L ((2013) ) The AD-CSF-Index discriminates Alzheimer’s disease patients from healthy controls: A validation study. J Alzheimers Dis 36: , 67–77. |
[7] | Le Bihan D ((2003) ) Looking into the functional architecture of the brain with diffusion MRI. Nat Rev Neurosci 4: , 469–480. |
[8] | Clerx L , Visser PJ , Verhey F , Aalten P ((2012) ) New MRI markers for alzheimer’s disease: A meta-analysis of diffusion tensor imaging and a comparison with medial temporal lobe measurements. J Alzheimers Dis 29: , 405–429. |
[9] | Filippi M , Agosta F ((2011) ) Structural and functional network connectivity breakdown in Alzheimer’s disease studied with magnetic resonance imaging techniques. J Alzheimers Dis 24: , 455–474. |
[10] | Sexton CE , Kalu UG , Filippini N , Mackay CE , Ebmeier KP ((2011) ) A meta-analysis of diffusion tensor imaging in mild cognitive impairment and Alzheimer’s disease. Neurobiol Aging 32: , 2322.e5–2322.e18. |
[11] | Nir TM , Jahanshad N , Villalon-Reina JE , Toga AW , Jack CR , Weiner MW , Thompson PM ((2013) ) Effectiveness of regional DTI measures in distinguishing Alzheimer’s disease, MCI, and normal aging. Neuroimage Clin 3: , 180–195. |
[12] | Alexander AL , Lee JE , Lazar M , Field AS ((2007) ) Diffusion tensor imaging of the brain. Neurotherapeutics 4: , 316–329. |
[13] | Pievani M , Agosta F , Pagani E , Canu E , Sala S , Absinta M , Geroldi C , Ganzola R , Frisoni GB , Filippi M ((2010) ) Assessment of white matter tract damage in mild cognitive impairment and Alzheimer’s disease. Hum Brain Mapp 31: , 1862–1875. |
[14] | Molinuevo JL , Ripolles P , Simó M , Lladó A , Olives J , Balasa M , Antonell A , Rodriguez-Fornells A , Rami L ((2014) ) White matter changes in preclinical Alzheimer’s disease: A magnetic resonance imaging-diffusion tensor imaging study on cognitively normal older people with positive amyloid β protein 42 levels. Neurobiol Aging 35: , 2671–2680. |
[15] | Fischer FU , Wolf D , Scheurich A , Fellgiebel A ((2015) ) Altered whole-brain white matter networks in preclinical Alzheimer’s disease. Neuroimage Clin 8: , 660–666. |
[16] | Ringman JM , O’Neill J , Geschwind D , Medina L , Apostolova LG , Rodriguez Y , Schaffer B , Varpetian A , Tseng B , Ortiz F , Fitten J , Cummings JL , Bartzokis G ((2007) ) Diffusion tensor imaging in preclinical and presymptomatic carriers of familial Alzheimer’s disease mutations. Brain 130: , 1767–1776. |
[17] | Chao LL , DeCarli C , Kriger S , Truran D , Zhang Y , Laxamana J , Villeneuve S , Jagust WJ , Sanossian N , Mack WJ , Chui HC , Weiner MW ((2013) ) Associations between white matter hyperintensities and β amyloid on integrity of projection, association, and limbic fiber tracts measured with diffusion tensor MRI. PLoS One 8: , e65175. |
[18] | Jack CR , Barnes J , Bernstein MA , Borowski BJ , Brewer J , Clegg S , Dale AM , Carmichael O , Ching C , DeCarli C , Desikan RS , Fennema-Notestine C , Fjell AM , Fletcher E , Fox NC , Gunter J , Gutman BA , Holland D , Hua X , Insel P , Kantarci K , Killiany RJ , Krueger G , Leung KK , Mackin S , Maillard P , Malone IB , Mattsson N , McEvoy L , Modat M , Mueller S , Nosheny R , Ourselin S , Schuff N , Senjem ML , Simonson A , Thompson PM , Rettmann D , Vemuri P , Walhovd K , Zhao Y , Zuk S , Weiner M ((2015) ) Magnetic resonance imaging in Alzheimer’s Disease Neuroimaging Initiative 2. Alzheimers Dement 11: , 740–756. |
[19] | Prescott JW , Guidon A , Doraiswamy PM , Roy Choudhury K , Liu C , Petrella JR , Alzheimer’s Disease Neuroimaging Initiative ((2014) ) The Alzheimer structural connectome: Changes in cortical network topology with increased amyloid plaque burden. Radiology 273: , 175–184. |
[20] | Shaw LM , Vanderstichele H , Knapik-Czajka M , Clark CM , Aisen PS , Petersen RC , Blennow K , Soares H , Simon A , Lewczuk P , Dean R , Siemers E , Potter W , Lee VM , Trojanowski JQ ((2009) ) Cerebrospinal fluid biomarker signature in Alzheimer’s Disease Neuroimaging Initiative subjects. Ann Neurol 65: , 403–413. |
[21] | Jack CR Jr , Albert M , Knopman DS , Mckhann GM , Sperling RA , Carillo M , Thies W , Phelps CH ((2011) ) Introduction to revised criteria for the diagnosis of Alzheimer’s disease: National Institute on Aging and the Alzheimer Association Workgroups. Alzheimer Dement 7: , 257–262. |
[22] | Antonell A , Fortea J , Rami L , Bosch B , Balasa M , Sánchez-Valle R , Iranzo A , Molinuevo JL , Lladó A ((2011) ) Different profiles of Alzheimer’s disease cerebrospinal fluid biomarkers in controls and subjects with subjective memory complaints. J Neural Transm 118: , 259–262. |
[23] | Albert MS , DeKosky ST , Dickson D , Dubois B , Feldman HH , Fox NC , Gamst A , Holtzman DM , Jagust WJ , Petersen RC , Snyder PJ , Carrillo MC , Thies B , Phelps CH ((2011) ) The diagnosis of mild cognitive impairment due to Alzheimer’s disease: Recommendations from the National Institute on Aging-Alzheimer’s Association workgroups on diagnostic guidelines for Alzheimer’s disease. Alzheimers Dement 7: , 270–279. |
[24] | McKhann G , Knopman DS , Chertkow H , Hymann B , Jack CR , Kawas C , Klunk W , Koroshetz W , Manly J , Mayeux R , Mohs R , Morris J , Rossor M , Scheltens P , Carrillo M , Weintrub S , Phelphs C ((2011) ) The diagnosis of dementia due to Alzheimer’s disease: Recommendations from the National Institute on Aging- Alzheimer’s Association workgroups on diagnostic guidelines for Alzheimer’s disease. Alzheimers Dement 7: , 263–269. |
[25] | Jenkinson M , Beckmann CF , Behrens TEJ , Woolrich MW , Smith SM ((2012) ) FSL. Neuroimage 62: , 782–790. |
[26] | Manjón JV , Coupé P , Concha L , Buades A , Collins DL , Robles M ((2013) ) Diffusion weighted image denoising using overcomplete local PCA. PLoS One 8: , e73021. |
[27] | Coupe P , Yger P , Prima S , Hellier P , Kervrann C , Barillot C ((2008) ) An optimized blockwise nonlocal means denoising filter for 3-D magnetic resonance images. IEEE Trans Med Imaging 27: , 425–441. |
[28] | Tustison NJ , Avants BB , Cook PA , Zheng Y , Egan A , Yushkevich PA , Gee JC ((2010) ) N4ITK: Improved N3 bias correction. IEEE Trans Med Imaging 29: , 1310–1320. |
[29] | Ashburner J , Friston KJ ((2000) ) Voxel-based morphometry–the methods. Neuroimage 11: , 805–821. |
[30] | Avants BB , Tustison NJ , Song G , Cook PA , Klein A , Gee JC ((2011) ) A reproducible evaluation of ANTs similarity metric performance in brain image registration. Neuroimage 54: , 2033–2044. |
[31] | Tzourio-Mazoyer N , Landeau B , Papathanassiou D , Crivello F , Etard O , Delcroix N , Mazoyer B , Joliot M ((2002) ) Automated anatomical labeling of activations in SPM using a macroscopic anatomical parcellation of the MNI MRI single-subject brain. Neuroimage 15: , 273–289. |
[32] | Fazekas F , Chawluk JB , Alavi A , Hurtig HI , Zimmerman RA ((1987) ) MR signal abnormalities at 1.5 T in Alzheimer’s dementia and normal aging deficiency. AJNR Am J Neuroradiol 149: , 351–356. |
[33] | Ryan NS , Keihaninejad S , Shakespeare TJ , Lehmann M , Crutch SJ , Malone IB , Thornton JS , Mancini L , Hyare H , Yousry T , Ridgway GR , Zhang H , Modat M , Alexander DC , Rossor MN , Ourselin S , Fox NC ((2013) ) Magnetic resonance imaging evidence for presymptomatic change in thalamus and caudate in familial Alzheimer’s disease. Brain 136: , 1399–1414. |
[34] | Fortea J , Sala-Llonch R , Bartrés-Faz D , Bosch B , Lladó A , Bargalló N , Molinuevo JL , Sánchez-Valle R ((2010) ) Increased cortical thickness and caudate volume precede atrophy in psen1 mutation carriers. J Alzheimers Dis 22: , 909–922. |
[35] | Knight WD , Okello AA , Ryan NS , Turkheimer FE , Rodríguez Martinez De Llano S , Edison P , Douglas J , Fox NC , Brooks DJ , Rossor MN ((2011) ) Carbon-11-Pittsburgh compound B positron emission tomography imaging of amyloid deposition in presenilin 1 mutation carriers. Brain 134: , 293–300. |
[36] | Buckner RL ((2004) ) Memory and executive function in aging and ad: Multiple factors that cause decline and reserve factors that compensate. Neuron 44: , 195–208. |
[37] | Racine AM , Adluru N , Alexander AL , Christian BT , Okonkwo OC , Oh J , Cleary CA , Birdsill A , Hillmer AT , Murali D , Barnhart TE , Gallagher CL , Carlsson CM , Rowley HA , Dowling NM , Asthana S , Sager MA , Bendlin BB , Johnson SC ((2014) ) Associations between white matter microstructure and amyloid burden in preclinical Alzheimer’s disease: A multimodal imaging investigation. Neuroimage Clin 4: , 604–614. |
[38] | Sun S-W , Song S-K , Harms MP , Lin S-J , Holtzman DM , Merchant KM , Kotyk JJ ((2005) ) Detection of age-dependent brain injury in a mouse model of brain amyloidosis associated with Alzheimer’s disease using magnetic resonance diffusion tensor imaging. Exp Neurol 191: , 77–85. |
[39] | Schmidt R , Schmidt H , Haybaeck J , Loitfelder M , Weis S , Cavalieri M , Seiler S , Enzinger C , Ropele S , Erkinjuntti T , Pantoni L , Scheltens P , Fazekas F , Jellinger K ((2011) ) Heterogeneity in age-related white matter changes. Acta Neuropathol 122: , 171–185. |
[40] | Prescott JW , Guidon A , Doraiswamy PM , Roy Choudhury K , Liu C , Petrella JR ((2014) ) The Alzheimer structural connectome: Changes in cortical network topology with increased amyloid plaque burden. Radiology 273: , 175–184. |
[41] | Douaud G , Jbabdi S , Behrens TEJ , Menke RA , Gass A , Monsch AU , Rao A , Whitcher B , Kindlmann G , Matthews PM , Smith S ((2011) ) DTI measures in crossing-fibre areas: Increased diffusion anisotropy reveals early white matter alteration in MCI and mild Alzheimer’s disease. Neuroimage 55: , 880–890. |
[42] | Mole JP , Subramanian L , Bracht T , Morris H , Metzler-Baddeley C , Linden DEJ ((2016) ) Increased fractional anisotropy in the motor tracts of Parkinson’s disease suggests compensatory neuroplasticity or selective neurodegeneration. Eur Radiol 26: , 3327–3335. |
[43] | Kitamura S , Kiuchi K , Taoka T , Hashimoto K , Ueda S , Yasuno F , Morikawa M , Kichikawa K , Kishimoto T ((2013) ) Longitudinal white matter changes in Alzheimer’s disease: A tractography-based analysis study. Brain Res 1515: , 12–18. |
[44] | Valdés Hernández Mdel C , Morris Z , Dickie DA , Royle NA , Muñoz Maniega S , Aribisala BS , Bastin ME , Deary IJ , Wardlaw JM ((2013) ) Close correlation between quantitative and qualitative assessments of white matter lesions. Neuroepidemiology 40: , 13–22. |

