
A Randomized Controlled Trial of Adherence to a 24-Month Home-Based Physical Activity Program and the Health Benefits for Older Adults at Risk of Alzheimer’s Disease: The AIBL Active-Study
Abstract
Background:
Previous studies have demonstrated that physical activity (PA) interventions can improve physical and cognitive outcomes in older adults, but most have been relatively short in duration (<1 year) with a few having specifically targeting individuals at risk of developing Alzheimer’s disease.
Objective:
To examine adherence and physical health outcomes in a 24-month home-based PA intervention in older adults at risk of Alzheimer’s disease.
Methods:
Participants 60 years and older with mild cognitive impairment (MCI) or subjective memory complaints (SMC) with at least 1 cerebrovascular risk factor recruited from The Australian Imaging Biomarkers and Lifestyle Flagship Study of Aging (AIBL) were randomized to a PA or control group (n = 106). The control group continued with their usual lifestyle. The PA group received a 24-month home-based program with a target of 150 minutes/week of moderate PA and a behavioral intervention. Retention (participants remaining) and PA adherence (PA group only, percent PA completed to the PA prescribed) were determined at 6, 12, 18, and 24 months. Assessments at baseline, 6, 12, and 24 months included, PA; fitness; body composition and fat distribution. Key outcome measures were PA adherence and PA.
Results:
The 24-month retention rate (97.2%) and the median PA adherence 91.67% (Q1–Q3, 81.96, 100.00) were excellent. In the long-term the intervention group achieved significantly better improvements in PA levels, leg strength, fat mass and fat distribution compared to the control.
Conclusion:
This study demonstrates that in this target group, long-term PA adherence is achievable and has physical health benefits.
INTRODUCTION
Physical activity (PA) interventions resulting in increased PA and/or aerobic fitness have demonstrated an improvement in cognition in individuals with mild cognitive impairment (MCI) or subjective memory complaints (SMC) who are at increased risk of Alzheimer’s disease (AD) [1, 2]. PA interventions have been shown to also provide improvements in fitness, function, mobility, and strength [3–5] in individuals with MCI or AD. Cerebrovascular risk factors (CVR) including physical inactivity, obesity, hypertension, heart disease, type II diabetes, smoking, and hypercholesterolemia, have been associated with increased risk for AD and may be additive [6, 7]. Mid-life adiposity and central obesity have been associated with a greater risk of dementia in older age (≥65 years) [8, 9] with higher obesity being associated with greater dementia risk [10]. Physical inactivity and mid-life obesity have been identified as modifiable risk factors for AD [11]. Increasing PA has the potential to reduce fat mass and increase muscle mass and may be an effective lifestyle modification in preserving cognitive function in older age. Identifying effective PA interventions may have additional advantages of not only reducing the risk of AD from inactivity but also from obesity. The effect of PA on these outcomes depends on adherence to the PA program however there is a lack of evidence as to what strategies are effective in increasing adherence to PA interventions in populations at risk [12].
Few PA intervention studies have been long-term, with most ranging from 9 weeks to 12 months [5]. A recent systematic review concluded that supervised multi-modal exercise for 60 min 2–3 days a week can improve physical function (strength, mobility, walking endurance/cardiovascular fitness) in individuals with various levels of cognitive impairment [5]. However, it is not known if unsupervised or home-based programs can achieve the same results in physical function. We have previously reported good short-term adherence and short and long-term improvements in PA levels with a 6-month home-based PA program in participants with MCI and SMC [1, 13]. Lam et al. [5] reported that functional improvements diminished from 9 weeks to 9 months after the completion of the intervention supporting the view that PA programs need to be continued to maintain improvements. It is unknown if PA programs can be sustained in the long-term to maintain the improvements in function and health initiated in short-term interventions in this target group.
To our knowledge, no other group has investigated in a group at increased risk of AD with CVR factors if they can be motivated to increase their PA, and if this confers fitness, body weight, and body composition benefits in the short and/or long-term. This study addresses the problems of an increase in physical inactivity with age, an increase in obesity, a decline in muscle mass and the increased risk of AD, frailty, and functional fitness. It highlights the challenges of motivating older adults with cognitive concerns or difficulties to maintain beneficial PA levels.
Thus, the aim of the current study was to investigate whether individuals with cognitive problems and additional CVR factors could increase their PA and maintain adherence to a PA program over 24 months. Furthermore, the aim was to evaluate the effects of the PA program on functional fitness, body weight and body composition of individuals at risk of AD.
METHODS
Study design
The methods of this parallel single-blind randomized controlled trial have been previously published in detail [14]. The CONSORT statement was used as the framework for development of the methodology for this trial. The main outcome of the study was the change in white matter hyperintensities on MRI in the brain after the 24-month intervention. To achieve a medium effect size of 0.5, 80% statistical power, and a two-sided alpha error level of 0.05, it was estimated that 65 participants would be needed for each group. With an estimated 15% loss to follow-up the aim was to recruit 78 participants per group.
This paper reports the results for the secondary outcomes of retention, PA adherence, PA, fitness, body mass, and body composition measures. Protocols relevant to this paper are described briefly below.
Participants gave informed written consent and the study was approved by the Melbourne Health Human Research Ethics Committee. The project complies with the Declaration of Helsinki 1975.
Participants
Recruitment and screening
Men and women, aged 60 years and older, with MCI or subjective memory complaints (SMC) and at least 1 CVR factor (physical inactivity, obesity, hypertension, heart disease, type II diabetes, smoking, hypercholesterolemia), were recruited from the Melbourne cohort of the observational study The Australian Imaging Biomarkers and Lifestyle Flagship Study of Ageing (AIBL) [15] to participate in the AIBL Active trial. Potential participants were identified for inclusion and then invited to undertake a telephone-screening interview. The phone screening included the 15-item Geriatric Depression Scale (GDS–15) [16] to establish the presence of clinically relevant symptoms of depression. Those with a score of 6 and higher were excluded. Participants’ general practitioners were asked to consent to their patients’ involvement in the study. In addition to the above criteria participants were included in the study if they were community dwelling, and understood written and spoken English. All participants had a subjective memory complaint, e.g., all answered yes to the question “do you have any problems with your memory?". A standardized procedure was used for classification of MCI, which included use of a neuropsychology measure (the Consortium to Establish a Registry for Alzheimer’s disease (CERAD) battery) and a global clinical measure (the Clinical Dementia Rating (CDR) scale). The CERAD battery has been shown to be one of the more sensitive tests for detecting MCI [17] and was completed as part of the test battery. The CDR was scored by NL an experienced old age psychiatrist, and a total score of 0.5 was required for classification of MCI.
Participants were excluded if they: a diagnosis of dementia or a Standardized Mini-Mental State Examination score (SMMSE) <24 [18]; were unable to have MRI scans; had a self-reported harmful use of alcohol; had an unstable or life-threatening medical condition; had a medical condition that contra-indicated PA; had severe visual or hearing impairment; or were participating in another randomized controlled trial.
Assessments
Physical activity, physical fitness, body weight, body composition, health, lifestyle, and cognitive outcomes were assessed at baseline, 6, 12, and 24 months. PA adherence was measured at 6, 12, 18, and 24 months.
Measurements
Retention
Retention was defined as the number of participants remaining in the study at each time-point, 6, 12, 18, and 24 months.
Adherence
Adherence to the prescribed PA in the PA group only was assessed from self-reported PA diaries that recorded type, frequency, duration, and intensity of the PA. Participants were given diaries in a simplified calendar format with the prescription of individualized PA sessions itemized on the relevant day for completion. The participants marked off the PA session when completed and recorded the perceived intensity on the Borg perceived rate of exertion scale [19]. Any changes to the prescribed PA were also noted and taken into account for the calculation of adherence. The diaries were returned by prepaid mail at the end of each month. Weekly programs sheets were also given to participants to place in a prominent place to remind them of their sessions. Adherence was calculated as the number of minutes of moderate PA completed relative to the prescribed 150 min/week expressed as a percentage. This was determined for 4 stages of the 24-month intervention period and the total 24-month period; Stage 1:0–6 months; Stage 2:6–12 months; Stage 3:12–18 months; Stage 4:18–24 months. Two measures of adherence were calculated; AIBL Active adherence (AIBLADH) calculated from the PA prescribed for the study and total adherence (TotADH) which was the calculated from the PA already being done at baseline plus the amount of PA prescribed for the study. The latter measure was included to minimize and monitor any replacement of study PA for habitual PA.
Physical activity
Pedometer: Participants wore a pedometer (Digi-Walker SW-200, Yamax Inc., Tokyo, Japan) for five weekdays and the weekend and were requested to keep to their usual activities during that week. They were given instructions on how (above the right hip on a belt worn around the waist) and when (all waking hours except when showering or partaking in water-based activity) to wear the pedometer, and to also record step counts in a 7-day pedometer diary. When the pedometer was not worn the time off and all activities done during this time were recorded. The pedometer and diary were returned by mail.
CHAMPS (physical activity questionnaire for older adults): The pedometer provides an objective measure of ambulatory PA but it does not provide any information about the intensity of the PA. As we were also interested in the intensity and duration of different intensities of PA we used the CHAMPS questionnaire in addition to the pedometer. This self-reported PA questionnaire, designed for older adults, collects information on various types of PA, their intensity (low, moderate, high, and very high), frequency, and duration recalled for a typical week over the past 4 weeks [20].
Physical performance battery
6-minute Walk Test: This test assesses cardiovascular fitness with the participant walking as far as possible around a standardized course in 6 min and the distance measured in meters [21]. Heart rate is recorded every minute, peak heart rate determined (Polar FS3c Heart Rate Monitor, Polar Electro Oy, Kempele, Finland), and rate of perceived exertion (RPE) measured at the end of the test [19].
Sit-to-Stand Test: A test of functional lower limb or leg strength. The participant sits in a standard chair and stands up and down 5 times as quickly as possible while being timed [22].
Step Test (balance): A dynamic balance test with the participant steeping one foot on then off a 7.5 cm high step as many times as possible in 15 s without using hand support [23].
Timed Up and Go Test (TUG): The participant is timed in seconds (s) while standing up from a standard chair, walking three meters and then returning to sit again in the chair [24]. The TUG assesses leg strength and agility.
Grip strength: Measured in kilograms (kg) on both dominant and non-dominant hands with a Smedleys hand dynamometer [25].
Injury and musculoskeletal conditions
All participants were asked to self-report any injuries or musculoskeletal conditions, including the type, location of the injury, and if this was caused by PA on the demographic and lifestyle questionnaire.
Body mass, body composition, and body fat distribution
All measures were taken in light clothing and without shoes. Height was measured using a fixed stadiometer. Body mass, fat mass, % fat, fat free mass, and body mass index (BMI) were measured with bio impedance using the Tanita Body Composition Analyzer (Tanita TBF-300, Japan). Body fat distribution was assessed via waist and hip girths. Waist girth was measured at the minimum circumference at waist level and hip girth was the maximum circumference at the level of the greatest posterior protuberance of the buttocks. Girths were measured in centimeters (cm) 3 times using a steel tape (Lufkin, W606PM Cooper industries SC, USA) with the median measure used as the score.
Demographic and lifestyle questionnaire
Participants completed a questionnaire providing information about demographic characteristics, self-reported medical history, current medications, dietary habits (serves/day vegetables, fruit, protein), alcohol consumption, and any injuries or musculoskeletal complaints associated with PA. They were asked to maintain their usual lifestyle except for the change in PA prescribed to the intervention group.
Verification of CVR factors
For the CVR factors and related medications a physician-researcher (ML) adjudicated on the medical records obtained from each participant’s doctor.
Program and content evaluation
At 6 months, participants completed questionnaires designed specifically for this study about aspects of the program as a whole including, enjoyment (e.g., ‘’How enjoyable did you find the physical activity program?”); understanding (e.g., ‘’Did you find it easy to follow the program we set out for you?”); as well as on specific components of the program and the resources (e.g., ‘’How helpful did you find the following items that we provided?”, for example: worksheets; newsletters; phone calls; ‘’Did you enjoy reading the manual and completing the worksheets?”). They answered ‘’yes” or ‘’no” and/or rated the item on a scale 1–5 with 1 being the least and 5 the highest score.
Randomization and blinding
At the completion of baseline assessments participants were randomized to study groups. Randomization was undertaken in blocks of six participants (three in each of the treatment arms). The blocks were generated in STATA 10 (StataCorp, TX, USA). An investigator not directly involved in the recruitment or assessment of participants performed the allocation of participants to a PA program (intervention) or usual care (control), concealed in envelopes. This was a single blind study in which the research staff involved in the collection of the main outcome variables were not made aware of group allocation. In this type of study, it is not practical to blind participants to the intervention and due to logistical difficulties a sham PA program was not employed. Blinding, however, was supported by the allocation of cognitive and physical assessments to different locations and explicit instructions to participants and research staff not to discuss issues related to PA during the assessments.
Physical activity intervention
Intervention
The intervention package comprised three components; the PA program, the behavioral intervention package, and phone monitoring. The 24-month intervention period was divided into 4 stages. Stage 1:0–6 months; Stage 2:6–12 months; Stage 3:12–18 months; Stage 4:18–24 months. The PA prescription and type of activity was reviewed at the end of each stage. Intervention participants attended an individual PA workshop within 2 to 4 weeks of their baseline visit. During this 60-min session, the program manual was given to participants and they received instructions on their PA program, recording and the use of the behavioral intervention material.
Physical activity program
The PA program was individualized for each participant by the addition of minutes of moderate PA to their baseline habitual PA with a final target of at least 150 min/week of moderate intensity PA [26]. Participants not doing any moderate to vigorous intensity PA (MVPA) at baseline (defined as ‘inactive’) were prescribed the standard walking program (SWP); 150 min/week of moderate walking completed predominantly as 3, 50-min sessions/ week (with the option of 5, 30-min sessions/week) [13]. Participants doing some PA but not reaching the target were prescribed two additional sessions/week. Those achieving the target at baseline had one session added to their PA. Sessions and the rating of perceived exertion (RPE) [19] were recorded in diaries returned by mail each month. If walking was not appropriate other moderate intensity activities (RPE 10–12) were prescribed taking into account health problems or other limitations, for example swimming or cycling. The PA started slowly and progressed gradually taking 8 weeks to reach the target amount and intensity.
Behavioral intervention
Educational material and recommendations for a healthy lifestyle (excluding PA information), were given to both groups. Intervention participants received a manual containing the PA program and the behavioral intervention (BI). The BI was based on the Stages of Change model modified for PA [27] which we have used previously [13, 28] and further modified to include the personal regulation of goal directed behavior or performance [29, 30]. Modifications included a greater emphasis on identifying and setting goals, self-monitoring, giving relevant feedback, review of progress, and identifying action steps to enhance self-regulation skills.
These strategies were introduced during the workshop and supported over the 24-month intervention with 17 newsletters containing additional motivating material mailed at regular intervals (4-weekly in Stage 1, 6-weekly Stages 2–4) and reinforced with 18 phone calls (week 2 then 4-weekly in Stage 1, 6-weekly Stages 2–4). The 15-min standardized and structured calls were used to monitor and give feedback on the participant’s progress and encourage their continuing adherence.
Control group
The control group continued with their usual PA for the 24-month study period. In addition to the educational material, the control group (usual care) participants received newsletters containing generic non-PA information and were contacted by phone at the same frequency as the intervention group with conversation limited to everyday topics with no discussion about PA. This was to ensure that the control and intervention group had similar study contact. The control group were offered A PA workshop at the end of the study.
Statistical analysis
All analyses were conducted using Stata 15 (StataCorp. 2017. Stata Statistical Software: Release 15. College Station, TX: StataCorp LLC) and alpha was set at 0.05. Data were summarized using counts and proportions, means and standard deviations (sd), means and 95% confidence intervals (CI), or median and quartiles (Q1-Q3) as appropriate. The distributions of continuous outcomes were investigated for indications of deviation from normality and if found were log transformed when this produced an improvement. Random effects linear regression with maximum likelihood estimation was employed to test for differences in continuous outcomes over time between intervention and control groups using the interaction of time and group. Time was treated as a factor (categorical) variable. All random effects linear regressions were bootstrapped to ensure p values were robust to any remaining departures from normality. In order to investigate potential differences in the frequency of exercise at different intensity levels (from the CHAMPS questionnaire) between groups over time, a negative binomial random effects regression was applied using a three-way interaction of time, group and intensity (low versus moderate, high and very high combined). Differences in the number of minutes (<150 versus ≥150 min) of physical activity between groups over time was investigated in a mixed effects logistic regression model with a three-way interaction of time, group, and intensity. Models were run with and without adjustment for age, sex, and baseline BMI. The selection of co-variates was based on evidence from the literature and previous experience with PA intervention studies. Body composition models were run with and without adjustment for age and sex. As the adjusted models did not change the result the unadjusted models are reported. In the intervention group, only adherence to the intervention was analyzed using quantile regression due to persistent skew in the distribution. Quantile regression generates estimates based on quantiles, by default the median, rather than the mean which will be biased when the distribution is skewed. A per person cluster variance adjustment was applied to account for the lack of independence between observations over time within participant. The effects of being inactive at baseline, cognitive status (MCI/SMC), and sex on PA adherence were also examined in these regressions.
Differences in the change in the number of serves of fruit, vegetables and protein between groups were analyzed using mixed effects ordinal logistic regression after combining the first two or last two categories where numbers were small. The assumption of proportional odds was assessed using the Brant test.
RESULTS
Baseline characteristics
Baseline characteristics in the two groups for the 106 participants who started the study are shown in Tables 1 and 2. The groups were well balanced for baseline characteristics, except that the control group appear to have more retirees, participants on blood pressure medication, and higher alcohol intake. Fifty-seven (53.8%) of the participants were women; 67% (n = 71) were overweight or obese and 28.3% were diagnosed with MCI (n = 30). Mean age was 73.16 (5.84) years; were well educated 14.16 (3.59) years; 45.8% (n = 48) were married or co-habitating; 73.6% (n = 78) were retired from paid employment; 56.5% (n = 61) and 31.5% (n = 34) were classified as ‘low active’ or ‘sedentary’, respectively, based on their pedometer score [31].
Table 1
Baseline demographic and physical activity characteristics of participants in the 2 study groups in the AIBL Active study conducted in Melbourne, Australia 2011–2014
| Control Group (n = 51) | Intervention Group (n = 55) | |
| Age (y) | 70.10 (5.97) | 72.29 (5.64) |
| Sex (n, % female) | 28 (52.8%) | 29 (52.7%) |
| Education (y) | 14.24 (3.58) | 14.09 (3.62) |
| MCI (N, % of group) | 16 (31.4%) | 14 (25.5%) |
| Married/co-habit (n, % of group) | 21 (42%) | 27 (49.1%) |
| Retired (n, % of group) | 41 (80.4%) | 37 (67.3%) |
| SMMSE | 28.78 (1.56) | 28.56 (1.63) |
| Body Mass Index (kg·m–2) | 26.47 (4.31) | 27.46 (4.03) |
| Overweight/Obese (n, % of group) | 31 (60.8%) | 40 (72.7%) |
| Smokers (n, % of group) | 2 (3.9%) | 2 (3.6%) |
| Blood pressure medication (n, % of group) | 21 (41.2%) | 14 (25.5%) |
| Cholesterol medication (n, % of group) | 18 (35.3%) | 26 (47.3%) |
| aVascular risk factors (n) | 2.00 (0, 4) | 1.00 (0, 6) |
| aAlcohol consumed (gms/week ethanol) | 77 (14.90, 121.10) | 12.60 (0, 75.70) |
| Low Active (n, % of group) | 29 (54.7%) | 32 (58.2%) |
| Falls history last 6 months (n (%)) | 21(41.2%) | 14 (25.5%) |
Values are mean and (SD), amedian and (Q1–Q3) unless described otherwise. MCI, mild cognitive impairment; SMMSE, Standardized Mini-Mental State Examination score. Vascular risk factors include: physical inactivity, obesity, hypertension, heart disease, type II diabetes, smoking, and hypercholesterolemia. ‘Low active’ was defined as <7500 steps/day for the pedometer score [37].
Table 2
Adherence to the prescribed and total physical activity program over 24-months for the intervention group in the AIBL Active study conducted in Melbourne, Australia 2011–2014
| Adherence | Stage 1 0–6 Months (n = 48) | Stage 2 6–12 Months (n = 46) | Stage 3 12–18Months (n = 40) | Stage 4 18–24 Months (n = 40) | Total 0–24 Months | Change over time p value |
| AIBLADH | 91.67 | 93.17 | 93.33 | 92.48 | 91.67 | 0.90 |
| (Median, Q1–Q3) | (83.12, 100.00) | (80.83, 100.00) | (82.77, 100.00) | (80.98, 100.00) | (81.96, 100.00) | |
| TotADH | 81.46 | 81.10 | 86.25 | 82.41 | 81.83 | 0.30 |
| (Median, Q1–Q3) | (68.88, 92.56) | (74.02, 92.13) | (71.42, 94.25) | (59.90, 90.08) | (69.38, 92.29) |
AIBLADH denotes (% Prescribed adherence), TotADH denotes, (% Total PA adherence). Values are median scores and (Q1-Q3). The p value reflects the interaction p value that tests for a difference over time within the intervention group with adjustment for sex, MCI status, and baseline ‘inactive’.
Retention
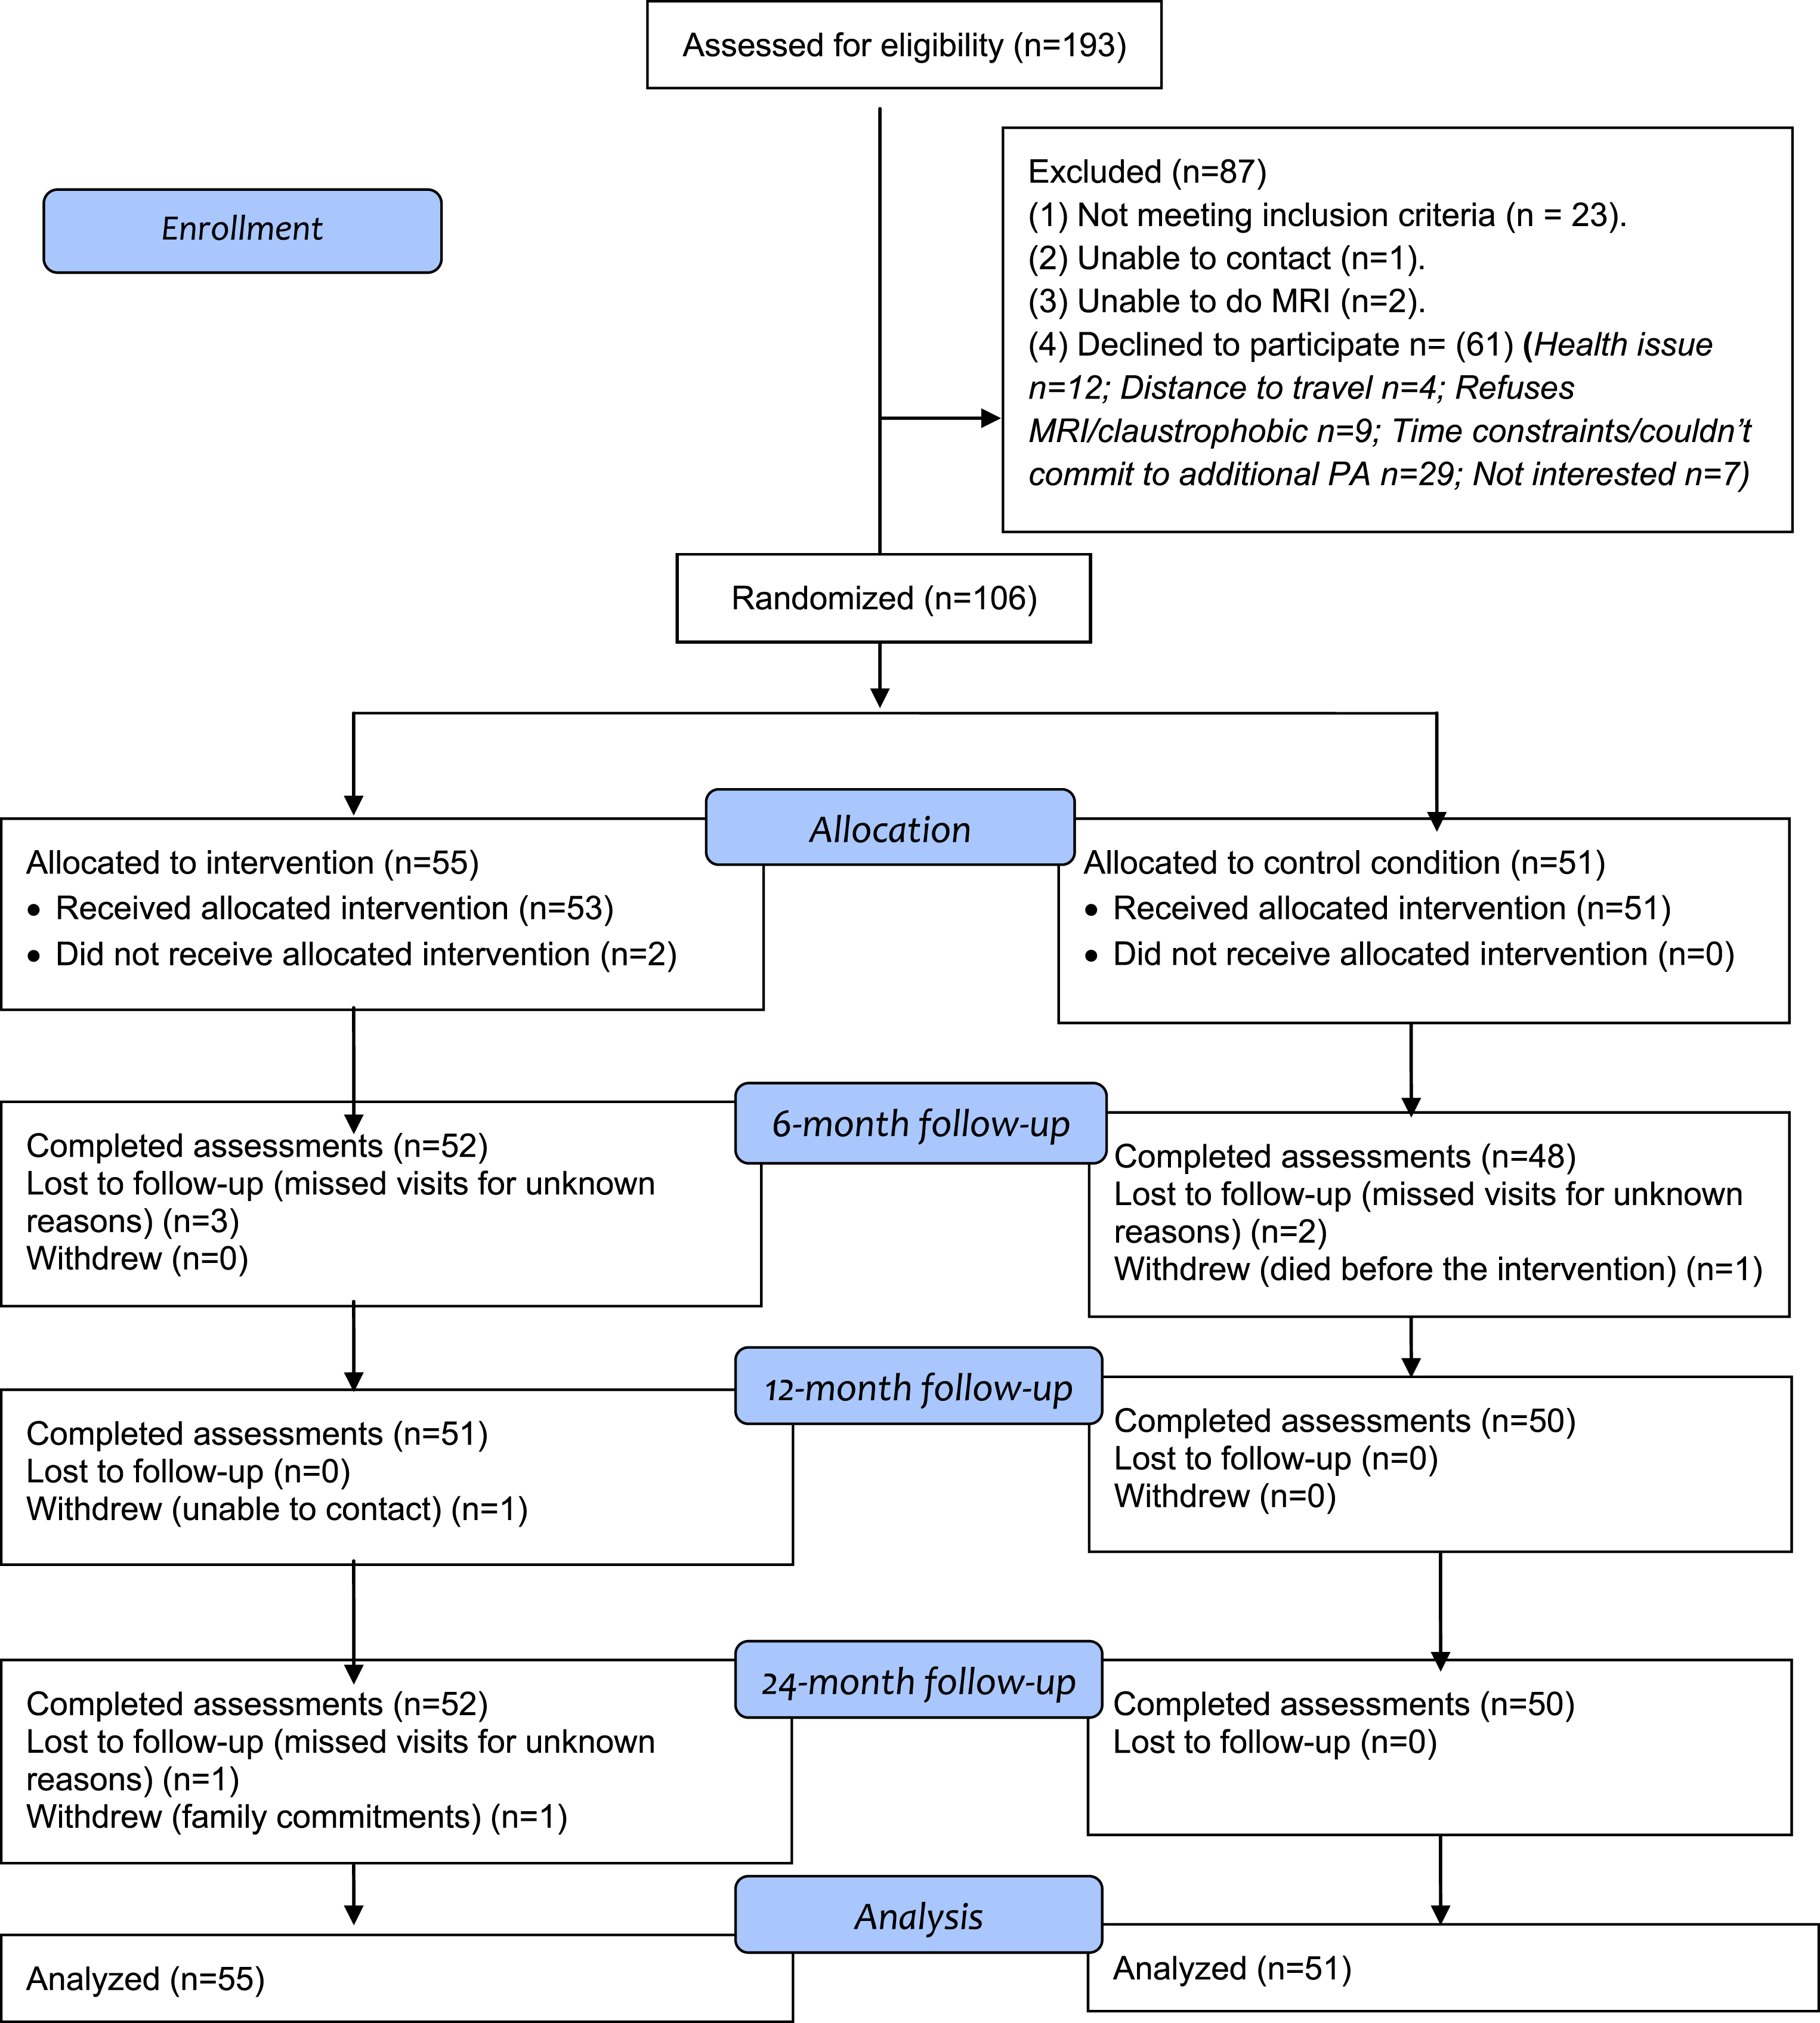
The participant flow over 24 months is shown in Fig. 1. The overall retention rates were 99.1% (6 months), 98.1% (12 months), 98.1% (18 months), and 97.2% (24 months). There was no significant between-group difference in retention rate. The control participant who withdrew did so before the start of the intervention and the two intervention participants withdrew at 46 and 94 weeks into the 96-week intervention. Reasons why participants (n = 3) withdrew from the study are also shown in Fig. 1.
Fig. 1.
AIBL Active study participant flow from recruitment to the end of the 24-month follow-up. Note: Some participants missed visits for unknown reasons at an earlier follow-up but returned for the assessment at a later follow-up.
Physical activity adherence
Two participants declined the intervention after baseline and did not receive a PA program. Fifty-three (96.3%) attended the workshop session; however, a further 5 did not start the intervention but they returned for some follow-up assessments. Of the 7 who did not start the PA intervention, 4 were already active at baseline and 3 were inactive. Forty-eight (87.2%) participants recording at least 1 session are included in the adherence results. Fourteen participants (26.4%) not engaged in PA at baseline were prescribed the standard walking program (SWP). For the 24-month intervention period, the median scores for the prescribed PA (AIBLADH) and the total PA (TotADH) were 91.67% (Q1–Q3, 81.96, 100.00) and 81.83% (69.38, 92.99), respectively. The median adherence scores for the 4 intervention stages and the overall 24-month period are shown on Table 2. There was no evidence of a significant variation in either of these adherence measures over time. Further, sex, MCI status, or baseline inactivity did not change these results. The mean RPE (PA intensity) over the 24 months was 11.39 (11.22, 11.56) with no evidence of a variation in the pattern of change over time (p = 0.36) which was within the target range of 10–12. Walking was the most frequent PA type, with 79.7% (n = 39) with an additional 4.1% (n = 2) for each of swimming/water walking, circuit gym and cycling and an additional 2% for aerobics, social dance, tennis, and croquet.
Physical activity level
Pedometer scores
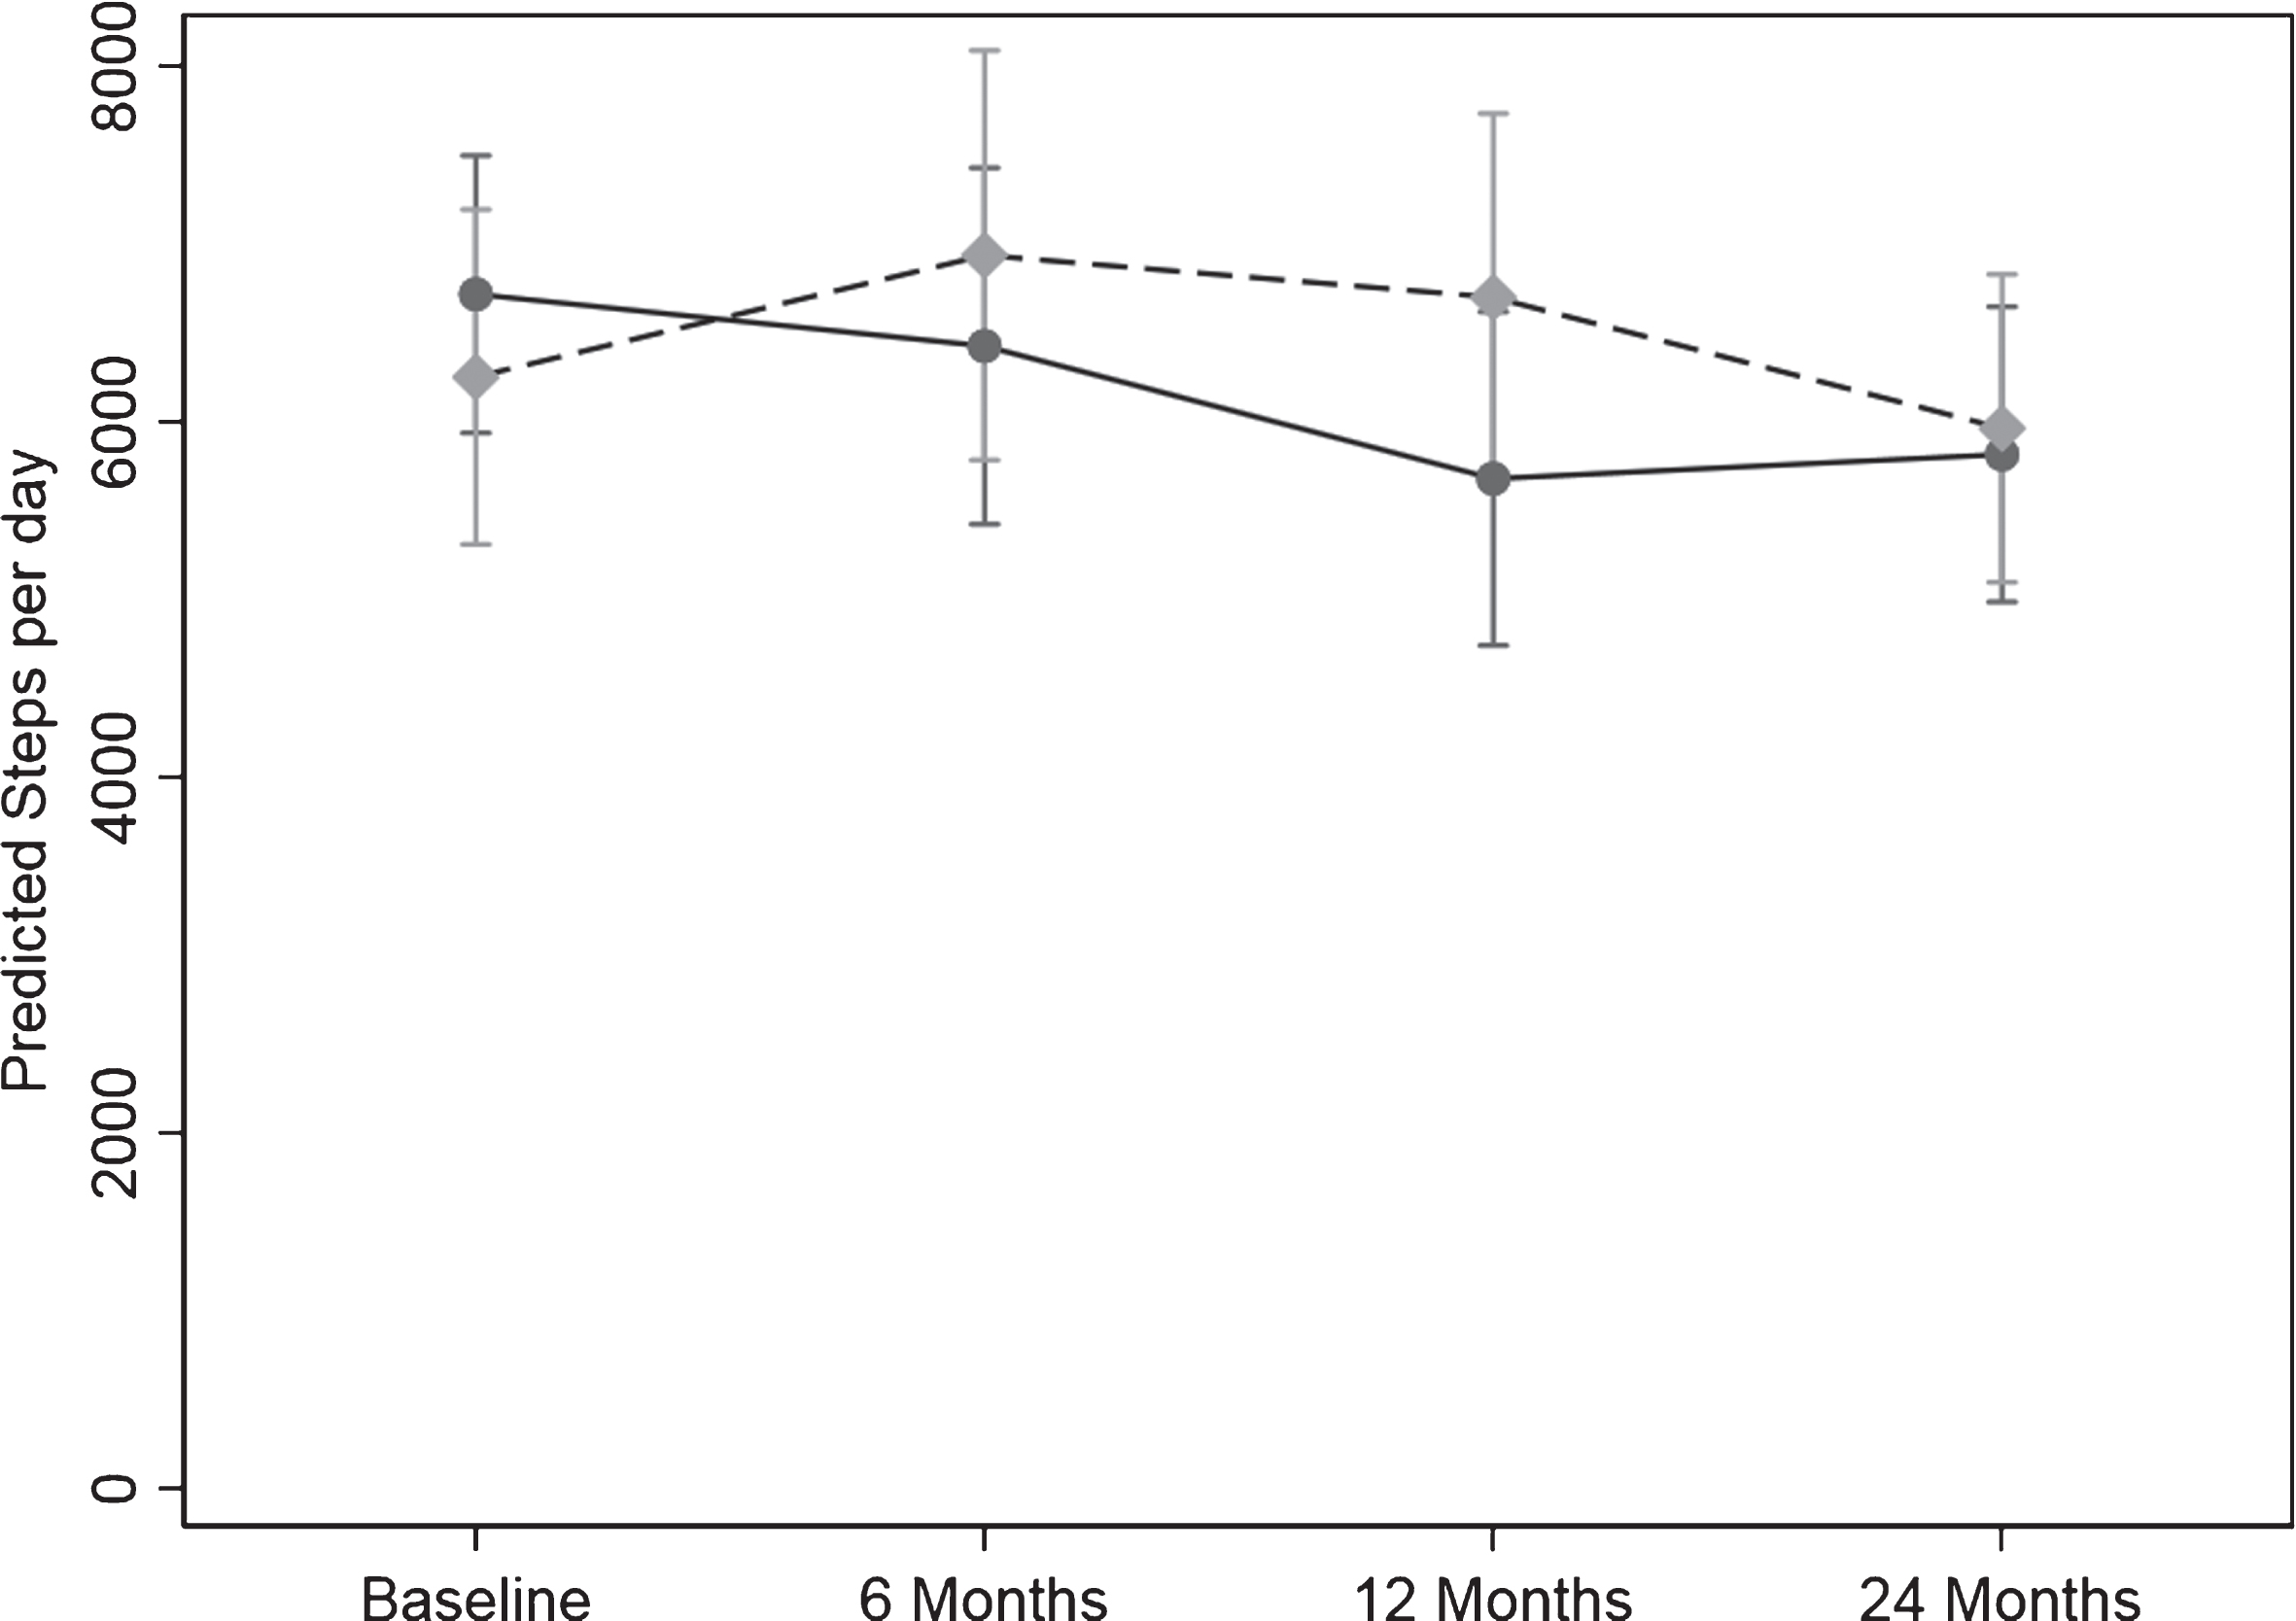
The PA measured by pedometer in steps/day for the 24 months is shown in Table 3a and Fig. 2. The difference in the pattern of change over time between the two groups was significant (p = 0.04). There was a significant 15.4%, 1035.85 steps/day reduction for the control group from baseline to 12 months (p = 0.008) with the decline persisting to 24 months with a 13.4%, 899.70 steps/day reduction from baseline to 24 months (p = 0.004). The intervention group maintained their steps/day over time.
Table 3
(a) Daily pedometer steps over 24 months, (b) Minutes/week of all physical activity over 24-months (c) number of participants self-reporting 150minutes/week of moderate or higher intensity PA (CHAMPS questionnaire) for the control and intervention groups in the AIBL Active study conducted in Melbourne, Australia 2011–2014
| Control Intervention | 0 Months (n = 51) (n = 55) | 6 Months (n = 48) (n = 52) | 12 Months (n = 50) (n = 50) | 24 Months (n = 50) (n = 52) | Change over time p value |
| (a) Pedometer PA (steps/day) | |||||
| Control | 6708.91 | 6318.39 | 5642.61 | 5906.79 | 0.04 |
| (5966.29,7544.12) | (5363.53, 7443.19) | (4774.15, 6692.70) | (5111.04,6826.43) | ||
| Intervention | 6244.20 | 7134.05 | 6729.03 | 6290.61 | |
| (5331.47,7313.20) | (5954.52, 8547.22) | (5708.24,7927.65) | (5397.23,7331.86) | ||
| (b) Self-reported PA (CHAMPS) (min/week) | |||||
| Control | 750 | 705 | 810 | 900 | 0.12 |
| (Median, Q1–Q3) | (540, 1035) | (532.5, 937.5) | (555, 1020) | (660, 1050) | |
| Intervention | 780 | 832.5 | 802.5 | 772.5 | |
| (Median, Q1–Q3) | (495, 1065) | (577.5, 1147.5) | (585, 1050) | (547.5, 1125) | |
| (c) Self-reported >moderate PA | |||||
| ≥150 mins/week | |||||
| Control (n, (%)) | 32 (62.75) | 29 (56.86) | 39 (76.47 | 38 (74.51) | 0.18 |
| Intervention (n, (%)) | 35 (63.64) | 43 (78.18) | 40 (72.73) | 40 (72.73) |
(a) Values are geometric mean (95% CI), (b) Values are median scores and (Q1–Q3), (c) Values are number (n) of participants and % of group. The p value reflects the interaction p value that tests for a difference between groups over time. (b) When adjusted for sex, MCI status, and baseline ’inactive’ the result was similar. (a) and (c) When adjusted for age, sex, and BMI the result was similar.
Fig. 2.
Change in physical activity over the 24-months study measured as steps/day from the pedometer scores. Values are geometric mean and 95% margins. Control Group  ; Intervention Group
  . There was a significant difference in the pattern of change in physical activity (steps/day) over time between the control and intervention group (p = 0.04). The p value reflects the interaction p value that tests for a difference between groups over time.
CHAMPS questionnaire
Table 3b shows the minutes of self-reported ‘all physical activity’ recorded from the CHAMPS questionnaire at each assessment over the 24 months. There was no significant difference in the pattern of minutes over time between the 2 groups (p = 0.12) and after adjustment for age, sex, and BMI the result was unchanged. The number of participants self-reporting more than 150 min/week of moderate intensity or higher PA over the 24 months is shown in Table 3c. Similarly, there was no significant difference in the pattern of change over 24 months. The pattern of change over time between the 2 groups for frequency of activities and the energy expended in PA was not significant (results not shown).
Physical performance
The fitness test battery results are shown on Table 4. When age, sex, and BMI were included in the regression analyses the results were unaltered so the reported results are unadjusted values.
Table 4
Cardiovascular fitness, mobility, leg strength, grip strength and balance results over the 24-month period for the control and intervention groups in the AIBL Active study conducted in Melbourne, Australia 2011–2014
| Control Intervention | 0 Months (n = 51) (n = 55) | 6 Months (n = 48) (n = 49) | 12 Months (n = 49) (n = 47) | 24 Months (n = 48) (n = 44) | Change ver time p value |
| Walk distance (m) | |||||
| Control | 499.56 (468.21, 524.92) | 504.16 (476.92, 531.40) | 509 (481.49, 538.05) | 497.10 (466.48, 527.72) | 0.61 |
| Intervention | 488.0 (465.09, 510.90) | 507.32 (480.80, 533.84) | 511.95 (484.61, 539.31) | 514 54 (488.29, 540.80) | |
| TUG (s) | |||||
| Control | 6.57 (5.92, 7.23) | 6.60 (6.10, 7.11) | 6.82 (6.22, 7.43) | 6.88 (6.31, 7.45) | 0.68 |
| Intervention | 6.39 (6.00, 6.78) | 6.43 (5.95, 6.91) | 6.32 (5.88, 6.76) | 6.49 (5.97, 7.01) | |
| Sit to Stand (s) | |||||
| Control | 11.03 (10.06, 12.00) | 11.04 (10.10, 11.98) | 11.24 (10.25, 12.23) | 11.38 (10.64, 12.13) | 0.02 |
| Intervention | 11.68 (10.80, 12.57) | 11.24 (10.39, 12.10) | 10.25 (9.58, 10.91) | 10.68 (9.90, 11.47) | |
| Grip Strength (kg) (Dominant hand) | |||||
| Control | 30.52 (27.91, 33.14) | 29.96 (26.95, 32.97) | 30.48 (27.74, 33.21) | 29.11 (26.33, 31.89) | 0.83 |
| Intervention | 33.51 (31.13, 35.90) | 32.52 (29.98, 35.07) | 32.86 (30.27, 35.46) | 31.00 (28.48, 33.53) | |
| Grip Strength (kg) (Non-dominant) | |||||
| Control | 28.48 (25.84, 31.11) | 27.86 (25.15, 30.56) | 27.67 (24.82, 30.52) | 26.33 (23.66, 28.99) | 0.94 |
| Intervention | 31.06 (28.85, 33.27) | 29.96 (27.61, 32.30) | 30.02 (27.56, 32.47) | 28.39 (25.97, 30.81) | |
| Step Test (steps) | |||||
| Control | 15.07 (14.07, 16.08) | 14.81 (13.65, 15.96) | 15.28 14.10, 16.45) | 14.96 (13.88, 16.03) | 0.88 |
| Intervention | 15.25 (14.91, 16.31) | 15.41 (14.37, 16.45) | 15.95 (14.72, 17.19) | 15.66 (14.35, 16.97) |
Values are mean and (95% CI). The p value reflects the interaction p value that tests for a difference between groups over time. When adjusted for age, sex, and BMI the result was unchanged.
Cardiovascular fitness
For walk distance (cardiovascular fitness) the difference in the pattern of change over time between the groups was not significant. For the control group the pattern of change over time in walk distance was not significant. In the intervention group the pattern of change over time for walk distance increased from baseline by 17.80 (–1.69, 37.29) m (p = 0.074), 16.80 (–3.78, 37.39) m (p = 0.110), and 18.22 (2.60, 33.84) m (p = 0.022) at 6, 12, and 24 months, respectively. This significant change from baseline to 24 months in the intervention group represents an increase of 3.73% in cardiovascular fitness.
Leg strength
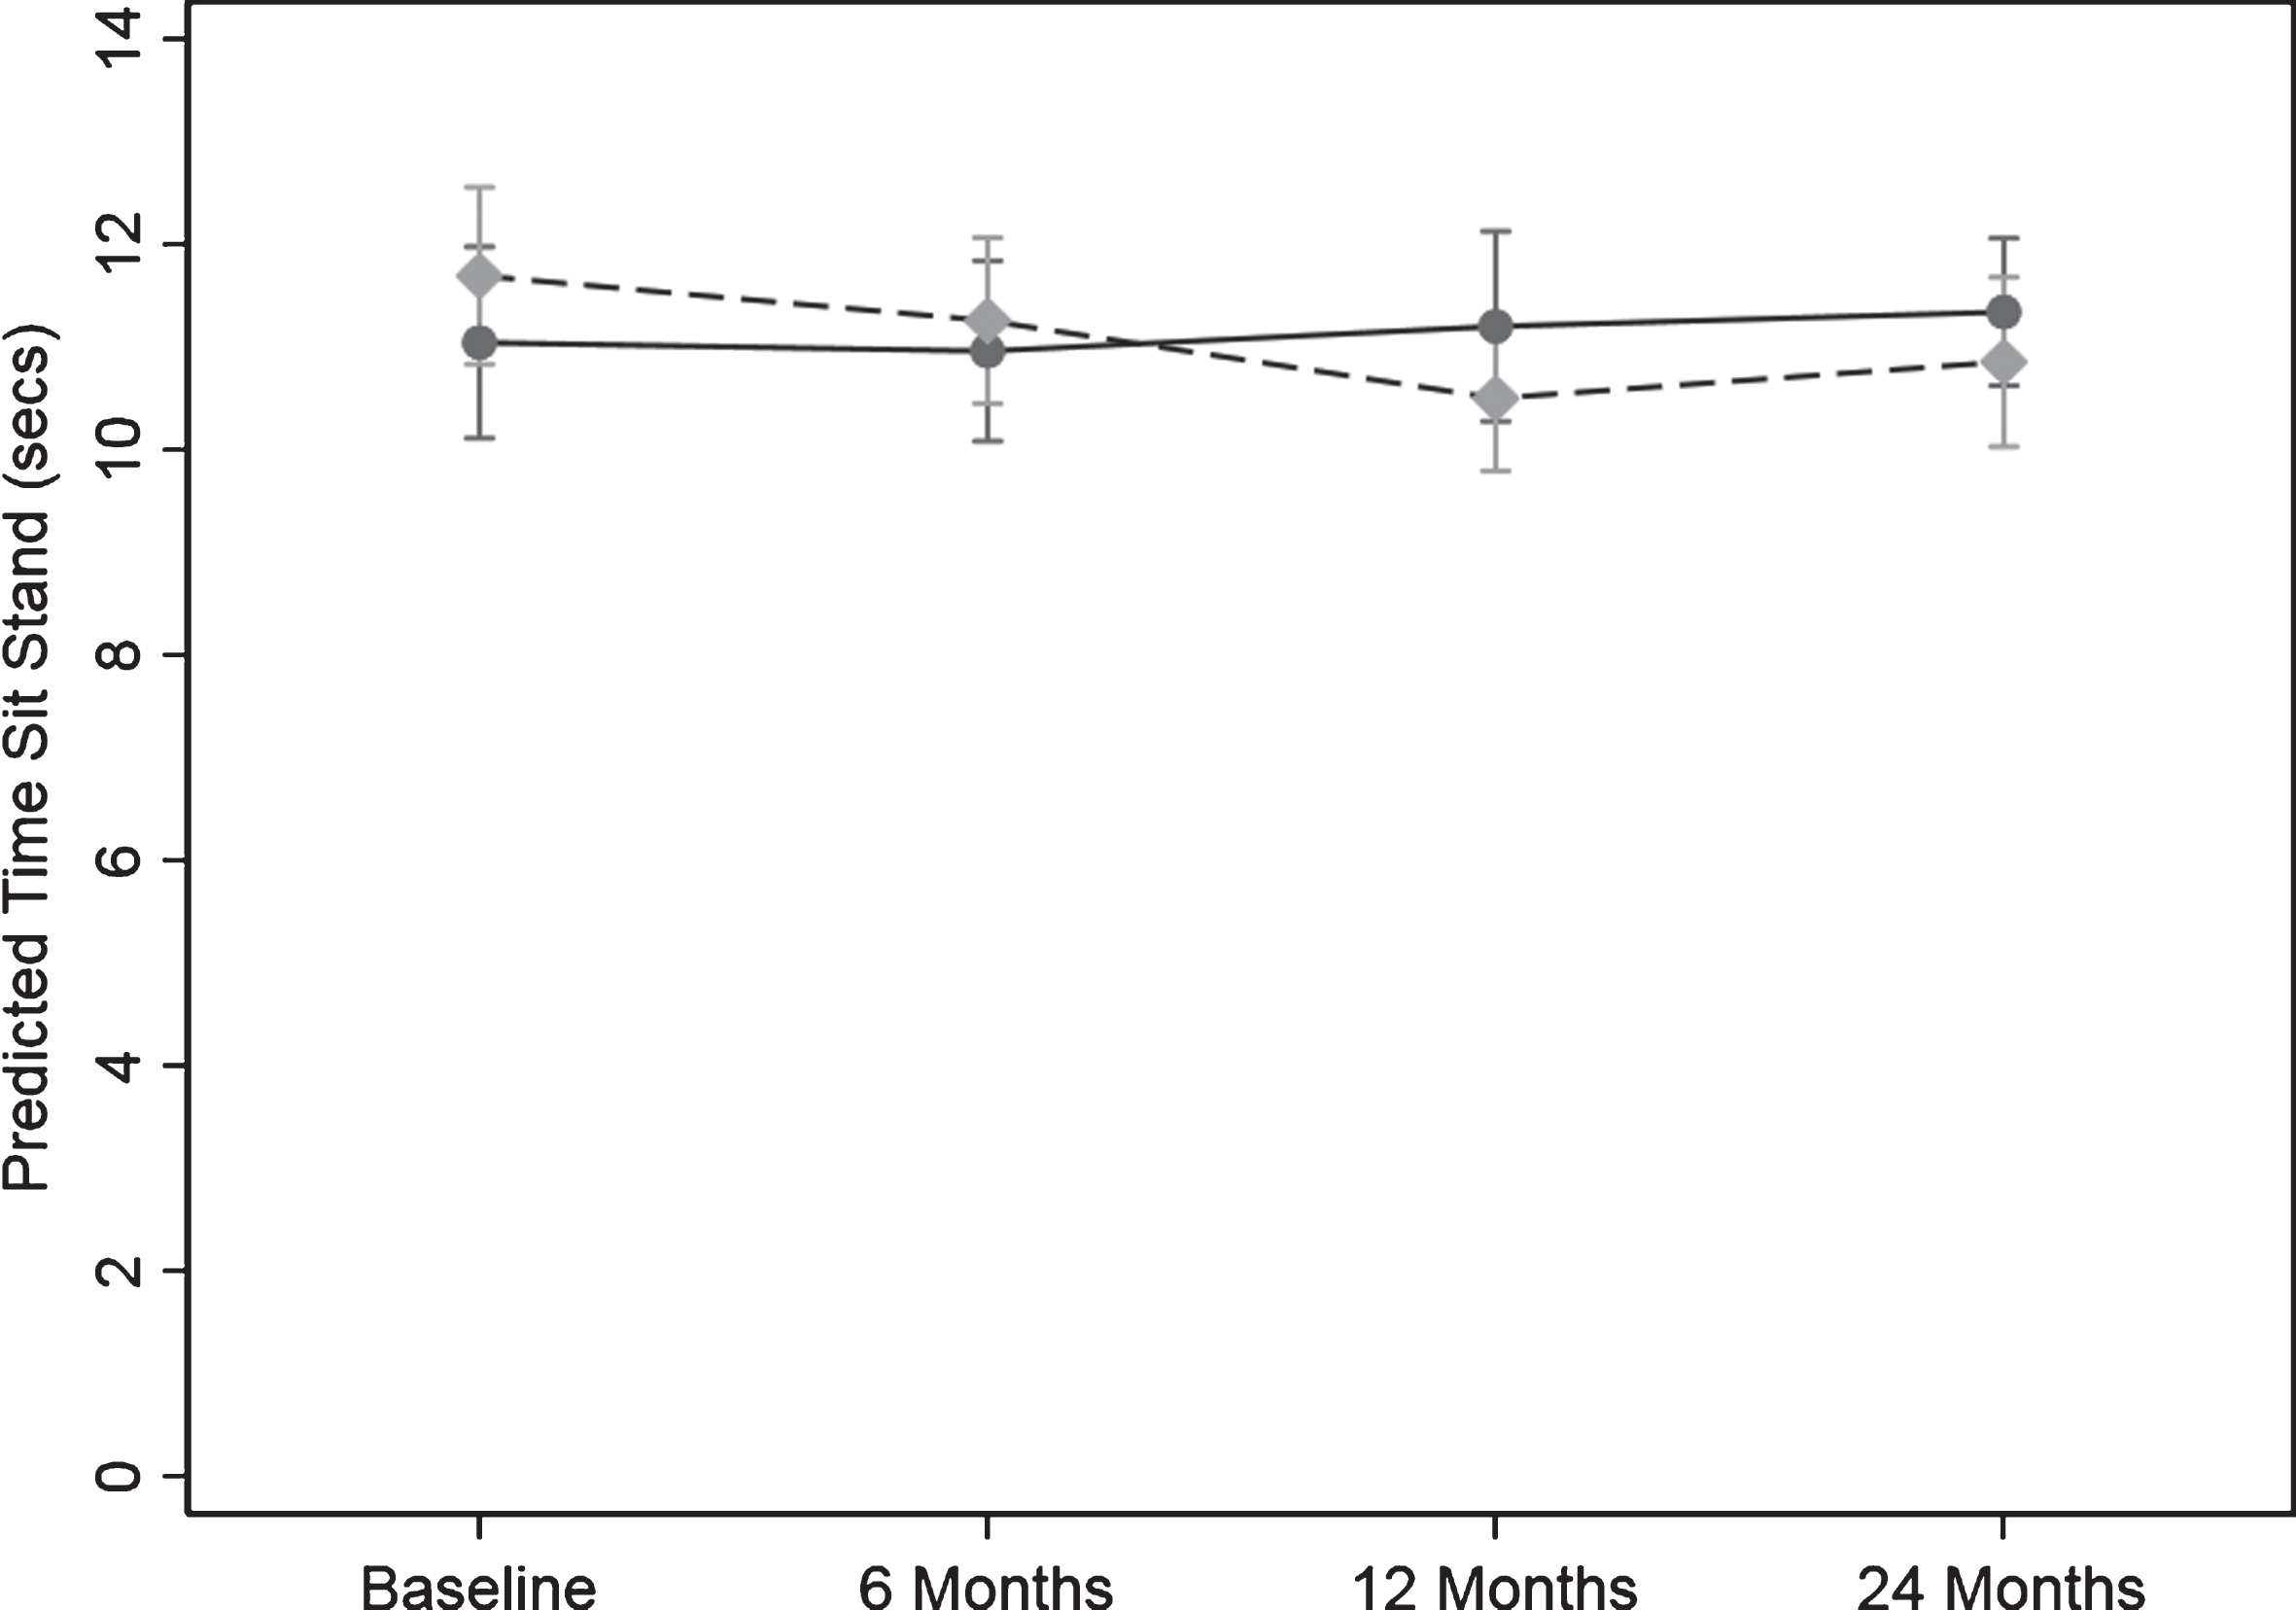
There was a significant difference in the pattern of change over time between the control and intervention group for the sit to stand test (s) the measure of leg strength (p = 0.016) (Fig. 3). There was no evidence for a change over time in sit to stand time in the control group. There were significant changes over time for sit to stand time in the intervention group. Compared to the control group the reduction the test time for the intervention group from baseline to 6, 12 and 24 months was 0.43 (95% CI: (1.11, 0.24) s (p = 0.209), 1.19 (2.01, 0.37) s (p = 0.004), and 0.83 (1.52, 0.14) s (p = 0.017), respectively. This represents a 10.2% and 7.1% improvement in leg strength in the intervention group at 12 and 24 months.
Fig. 3.
Change in timed sit to stand test (leg strength) over the 24-months study. Values are predicted mean (seconds) and 95% margins. A reduction in time indicates an increase in leg strength. Control Group Intervention Group. There was a significant difference in the pattern of change over time for leg strength between the control and intervention group (p = 0.02). The p value reflects the interaction p value that tests for a difference between groups over time. Compared to the control group the reduction the test time for the intervention group from baseline to 6, 12, and 24 months was 0.43 (95% CI: (1.11, 0.24) s (p = 0.209), 1.19 (2.01, 0.37) s (p = 0.004), and 0.83 (1.52, 0.14) s (p = 0.017), respectively.
Balance
There was no significant difference in the pattern of change over time for balance (step test) between the control and intervention group. Further, there was no evidence of any change over time in balance scores for the control or intervention group.
Mobility
There was no evidence of a significant difference in the pattern of change over time for the 2 groups in mobility (TUG). Nor were there any significant changes over time for the TUG score for the control or intervention group.
Grip strength
The difference in the pattern of change over time between the control and intervention group in grip strength for either the dominant or non-dominant hand was not significant (p = 0.83 and p = 0.94), respectively.
Injury and musculoskeletal conditions
Over the 24 months, 8.4% (n = 9) of participants reported an injury or musculoskeletal condition related to PA. The incidence was similar for both groups 8% (n = 4) and 9% (n = 5) for the control and intervention group, respectively. The most reported injury was knee tendonitis or arthritis (n = 4) with 2 out of 3 reports for the intervention group related to exacerbation of pre-existing conditions. Foot fasciitis was reported by 2 participants, although this was attributed to work and household PA as well as recreational PA; hip muscle soreness (n = 2) and calf strain (n = 1) accounted for the other reported conditions.
Body mass and body composition
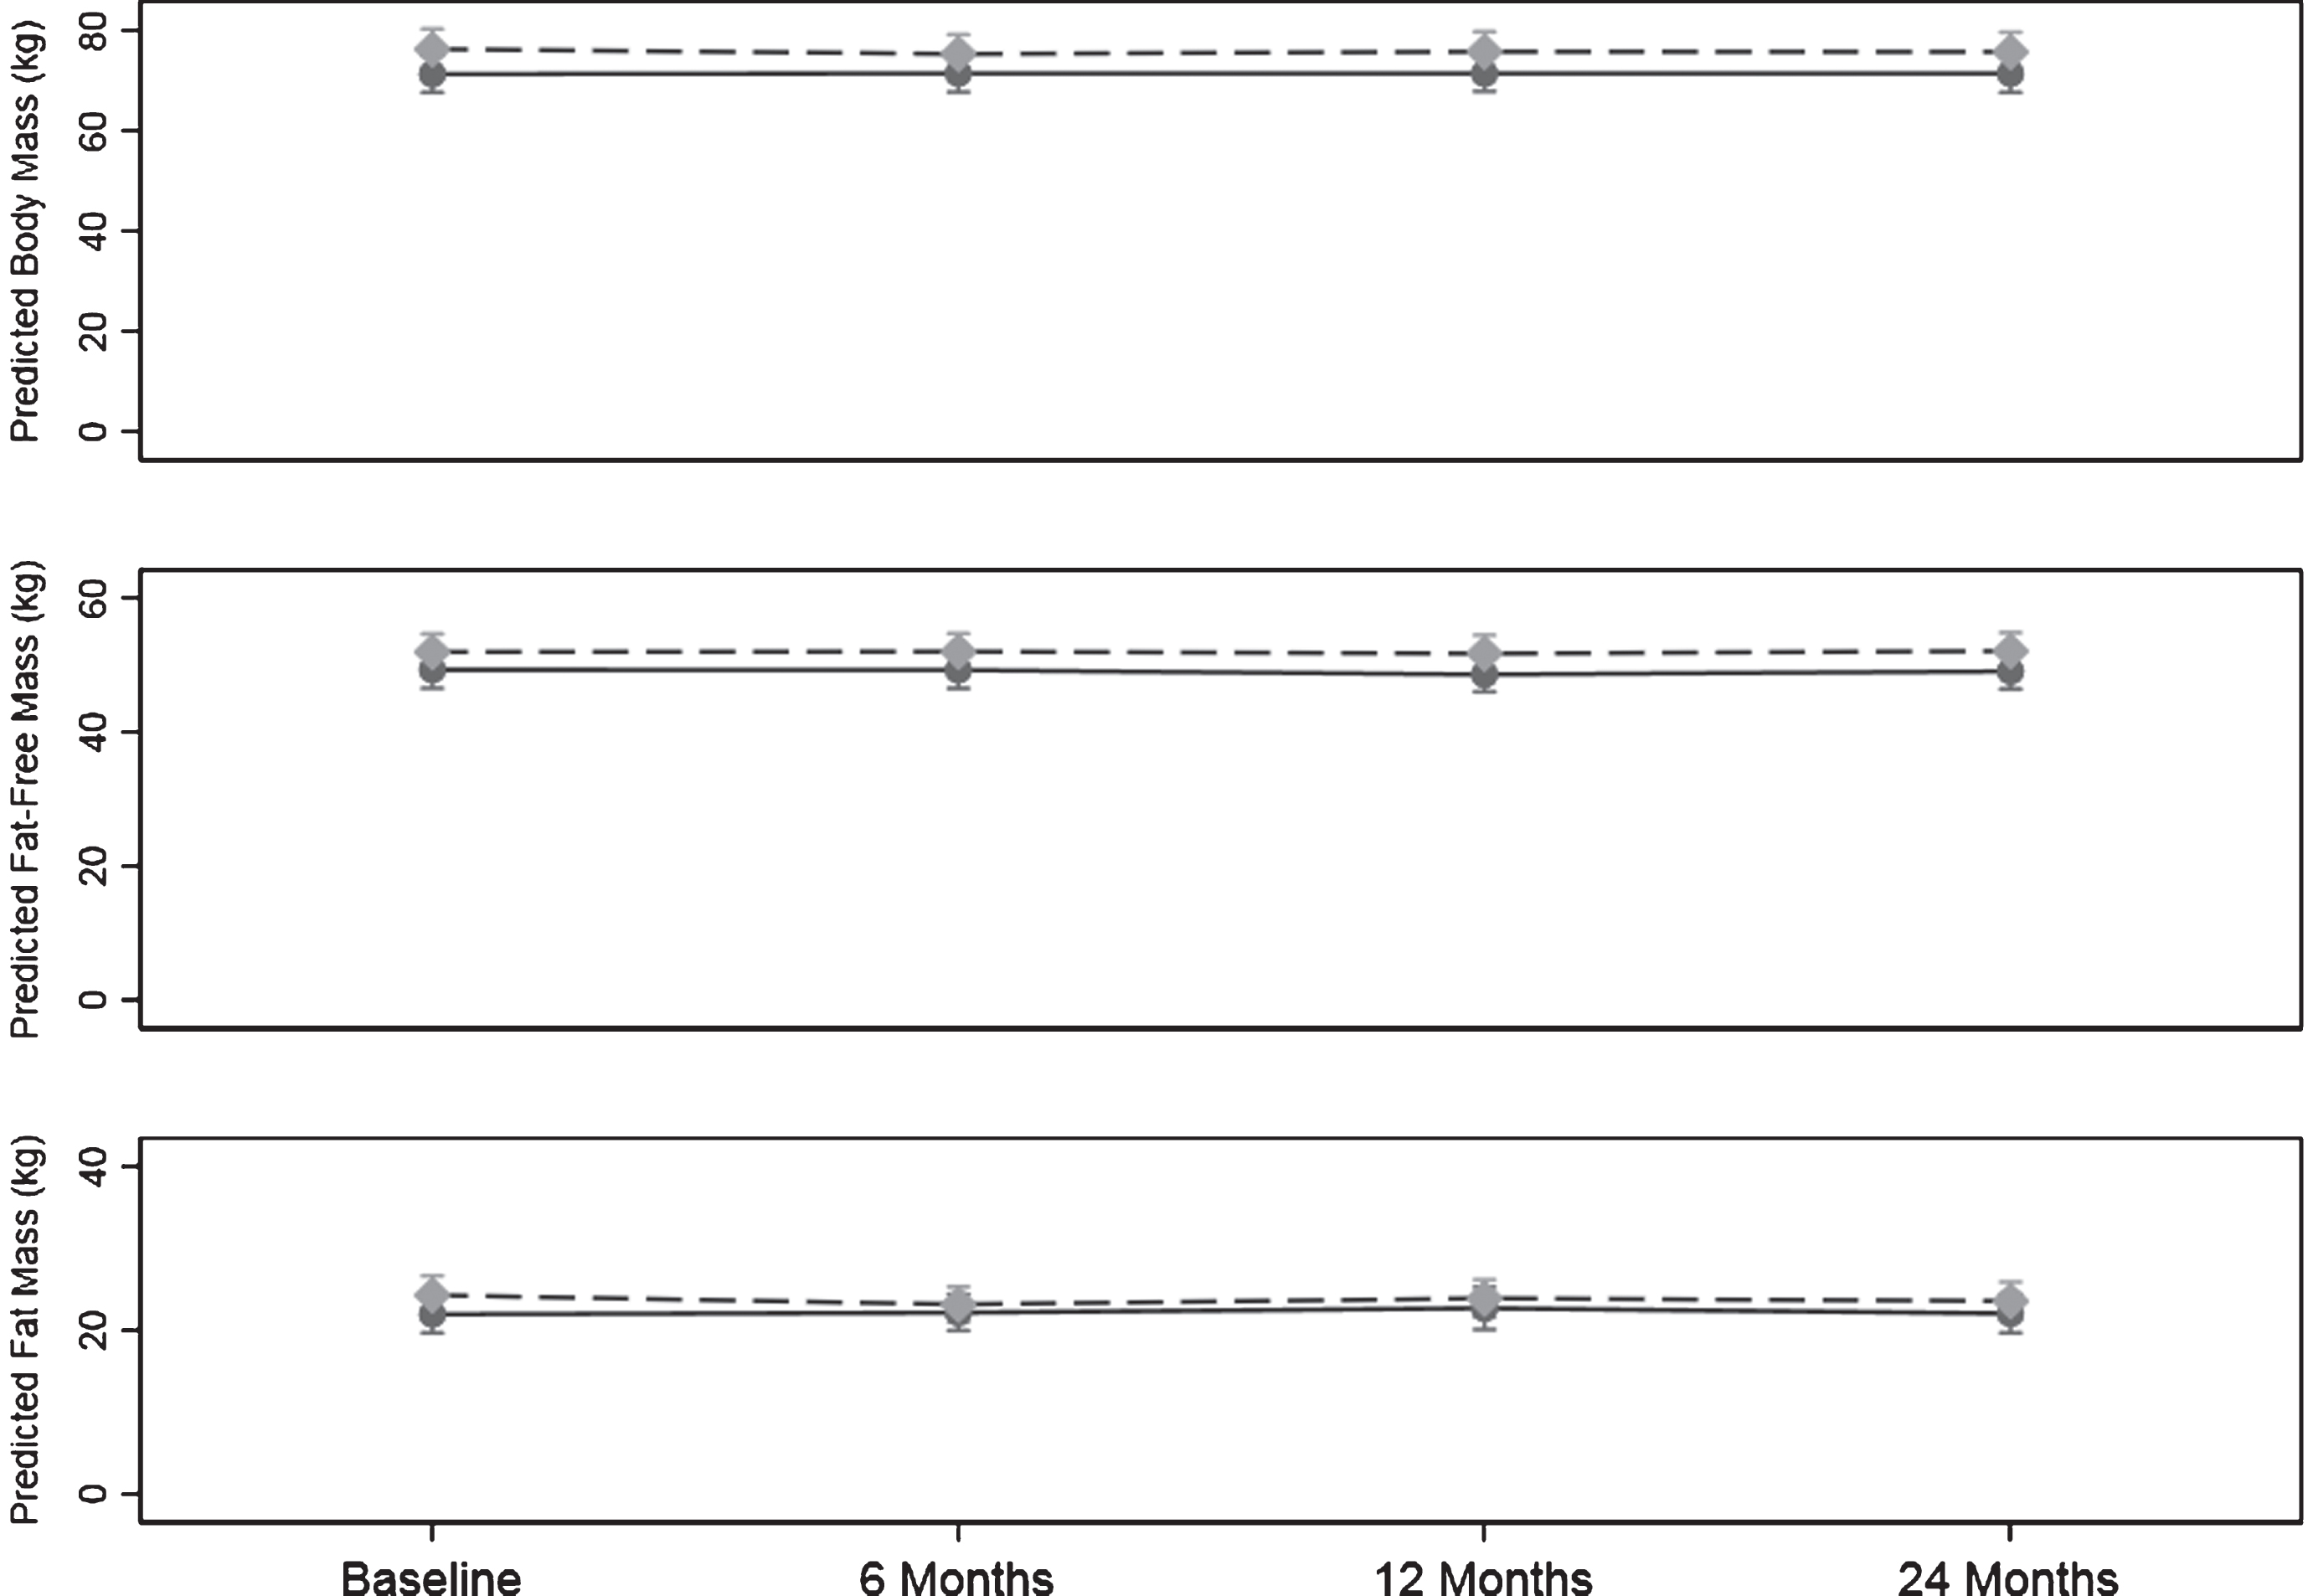
Body mass, body composition, BMI, waist and hip circumference results are shown on Table 5. Figure 4 shows the pattern of change in body mass, fat mass, and fat-free mass over the 24-months.
Table 5
BMI, body mass, body composition, and waist and hip circumference results over the 24-month period for the control and intervention groups in the AIBL Active study conducted in Melbourne, Australia 2011–2014
| Control Intervention | 0 Months (n = 51) (n = 55) | 6 Months (n = 48) (n = 52) | 12 Months (n = 50) (n = 51) | 24 Months (n = 50) (n = 52) | Change over time p value |
| BMI (kg/m2) | |||||
| Control | 26.47 | 26.56 | 26.67 | 26.61 | 0.11 |
| (25.25, 27.68) | (25.22, 27.90) | (25.39, 27.91) | (25.22, 27.99) | ||
| Intervention | 27.46 | 26.80 | 27.18 | 27.10 | |
| (26.37,28.55) | (25.73, 27.87) | (26.04, 28.31) | (25.99, 28.20) | ||
| Body Mass (kg) | |||||
| Control | 71.71 | 71.00 | 71.27 | 71.25 | 0.14 |
| (67.51, 74.84) | (67.07, 74.94) | (67.62, 74.91) | (67.41, 75.09) | ||
| Intervention | 76.15 | 73.98 | 75.42 | 75.16 | |
| (72.02,80.27) | (70.15, 77.82) | (71.10, 79.73) | (71.00, 79.33) | ||
| Fat Mass (kg) | |||||
| Control | 21.92 | 22.40 | 22.78 | 22.16 | 0.03 |
| (19.64,24.20) | (20.07,24.74) | (20.12, 25.43) | (19.74, 24.57) | ||
| Intervention | 24.25 | 22.73 | 23.73 | 23.48 | |
| (21.80, 26.69) | (20.36, 25.10) | (21.22, 26.24) | (21.03, 25.93) | ||
| % Body Fat | |||||
| Control | 30.61 | 31.97 | 31.54 | 31.09 | 0.07 |
| (28.33, 32.9) | (29.51, 34.43) | (29.15, 33.93) | (28.82, 33.35) | ||
| Intervention | 31.34 | 30.36 | 31.13 | 30.88 | |
| (29.07, 33.61) | (28.02, 32.70) | (28.84, 33.41) | (28.58, 33.19) | ||
| Fat-free Mass (kg) | |||||
| Control | 48.27 | 47.63 | 47.52 | 47.93 | 0.85 |
| (45.61, 51.08) | (44.92, 50.50) | (45.01, 50.17) | (45.31, 50.70) | ||
| Intervention | 50.87 | 49.99 | 50.29 | 50.34 | |
| (48.19, 53.70) | (47.49, 52.63) | (47.56, 53.17) | (47.56, 53.27) | ||
| Waist circumference (cm) | |||||
| Control | 88.88 | 88.27 | 89.77 | 89.61 | 0.47 |
| (85.39, 92.37) | (84.71, 91.83) | (86.24, 93.30) | (85.81, 93.42) | ||
| Intervention | 91.46 | 89.65 | 90.34 | 91.49 | |
| (87.77, 95.15) | (86.15, 93.15) | (86.47, 94.22) | (87.85, 95.13) | ||
| Hip circumference (cm) | |||||
| Control | 102.28 | 102.66 | 102.93 | 102.10 | 0.02 |
| (99.59, 104.96) | (99.95, 105.37) | (100.21, 105.64) | (99.23, 104.95) | ||
| Intervention | 104.98 | 102.96 | 103.01 | 102.21 | |
| (102.42, 107.55) | (100.54, 105.38) | (100.43, 105.59) | (99.73, 104.68) |
Values are mean and (95% CI) Value for fat-free mass is geometric mean and (95% CI). The p value reflects the interaction p value that tests for a difference between groups over time. When adjusted for age, sex, and BMI the result was unchanged.
Fig. 4.
Change body mass, fat mass and fat-free mass over the 24-month study. Values are predicted mean (kg) and 95% margins. Control Group Intervention Group. There was a significant difference in the pattern of change over time for fat mass (kg) between the control and intervention group (p = 0.03). The p value reflects the interaction p value that tests for a difference between groups over time.
Body mass and BMI
There was no significant difference in the pattern of change over time in body mass between the control and the intervention group (p = 0.14). When the analysis was adjusted for sex and age the results did not change.
The results for BMI were similar with no significant difference in pattern of change over time in BMI (p = 0.11).
Fat mass and % body fat
There was a significant difference in the pattern of change over time in fat mass between the control and intervention (p = 0.03). From baseline to 6 months there was a significant change in the intervention group of –1.12 (–1.80, –0.43) kg (p = 0.001) with no significant change over time in the control group which constituted a difference between the two groups of 1.33 (0.44, 2.23) kg.
For % body fat there was no significant difference in the change over time between the groups (p = 0.078).
Fat-free mass
There was no significant difference between groups in change over time in fat-free mass (p = 0.857). Further, there was no significant change over time in fat-free mass within either group for any stage.
Waist circumference
For waist circumference, the pattern of change over time between the two groups was not significant.
Hip circumference
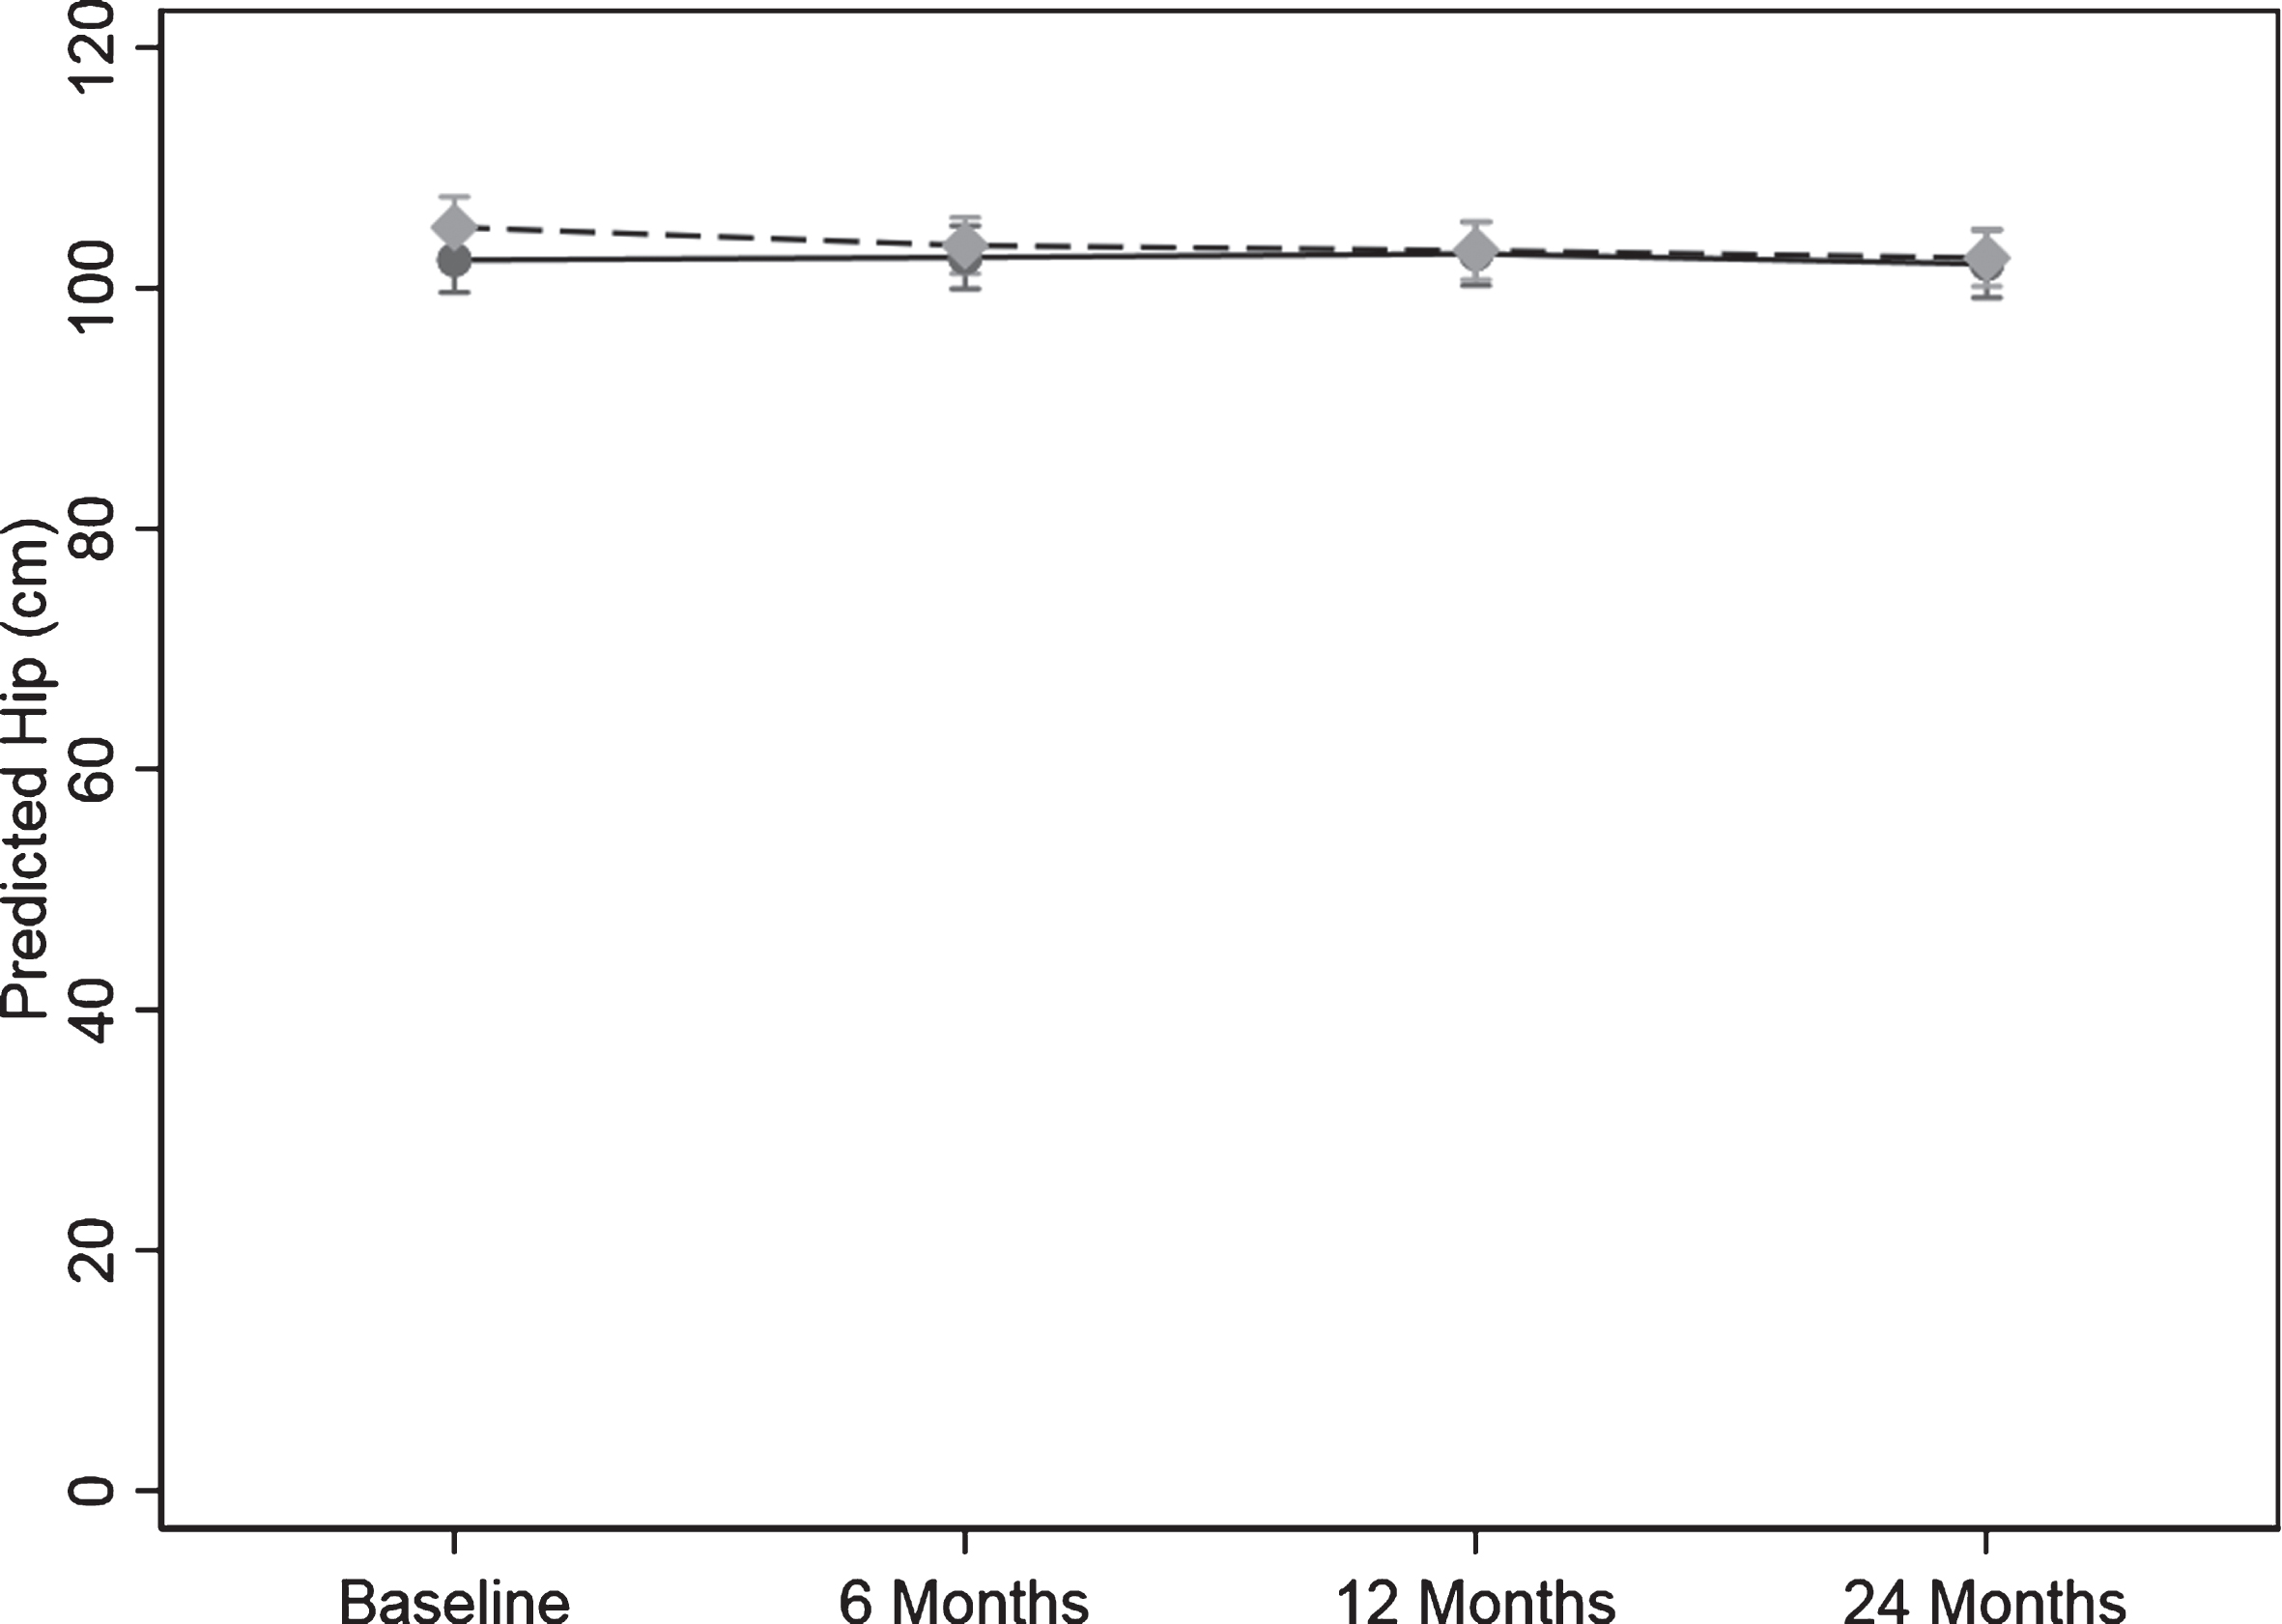
For hip circumference there was a significant difference in the pattern of change over time between the control and intervention group (p = 0.020) (Table 5 and Fig. 5).
In the intervention group, the change over time from baseline to 6, 12, and 24 months in hip circumference was 1.72 (0.24, 3.20) cm, (p = 0.022), 2.44 (0.75, 4.13) cm, (p = 0.005), and 2.22 (0.60, 3.83) cm (p = 0.007) lower than the control group, respectively. The result was unchanged when adjusted for age and sex.
Fig. 5.
Change hip circumference over the 24-months study. Values are predicted mean (cm) and 95% margins. Control Group Intervention Group. There was a significant difference in the pattern of change over time for hip circumference (cm) between the control and intervention group (p = 0.02). The p value reflects the interaction p value that tests for a difference between groups over time.
Dietary habits
No significant difference in the change over time was detected for fruit, vegetable or protein intake (p = 0.33, p = 0.31, and p = 0.55, respectively).
Program evaluation
At 6 months 91% and 85% of control and intervention participants completed the program evaluation. In the intervention group enjoyment of the PA program was high (97.8%). The newsletters and phone calls were rated as “helpful – extremely helpful” by (94.3%) and (96.6%) of participants, respectively. The workbook was rated as “helpful – extremely helpful” by 97.7% of the intervention group with 78% stating that they enjoyed completing the BI worksheets.
DISCUSSION
We have demonstrated that in this group of older adults at risk of AD and having at least 1 CVR factor, participants achieved excellent study retention and adherence to a moderate intensity PA program which was maintained for 24 months. Further, the PA program participants achieved an improved health profile with sustained PA levels, improved leg strength, lower fat mass and hip circumference in the long-term and short-term improvements in body mass, when compared to control participants. The results of the program evaluation demonstrated that the program was enjoyable, and acceptable.
To our knowledge, no other study has achieved these levels of PA adherence over a 24-month period. The median adherence score of 91.6% over the 24-month period was in-line with the 87% that we previously reported for a similar 6-month PA intervention in older adults with and without memory concerns [13], but higher than 71% for a 12-month center-based walking program [32] and 79.2% for a 12-month multicomponent exercise program [33]. Even though 12.7% (n = 7) participants allocated to the PA intervention failed to start the program this was better than the non-start rate for other studies. We previously reported a 22% non-start rate [20]. van Uffelen et al. [32] reported 32% non-start and a range of non-response rates of 21% – 90% has been reported for home and group-based PA [34]. The reasons for not starting the PA program are unknown and the numbers are too few to speculate. It is noted, however, that non-responders were from both the active and inactive categories at baseline. This highlights the problem of motivating older adults to firstly, initiate a PA program and underscores the need to find strategies to tackle this ongoing challenge in this target group.
We did not observe any difference between the sexes in the uptake and maintenance of PA at any stage. This is in contrast to our previous study in which men achieved a 14% higher adherence to the prescribed PA during the 6-month intervention period [13]. The number of PA related injuries reported in this study was low and mostly due to previous conditions. This is consistent with our previous trial [13] demonstrating that older adults can engage a moderate intensity, predominantly walking PA program safely.
The observation of a significant reduction in PA measured by the pedometer control group over the 24 months was not unexpected as PA declines with age highlighting the need for PA to continue to be promoted during older age. The 15.4% and 13.4% reduction translates into approximately 73 and 63 min/week less moderate intensity PA (3 METS) at 12 and 24 months for the control group [35]. The magnitude of the reduction is substantial given it is approximately the mean of 1day/week of PA at baseline and nearly 50% of the 150 min/week of moderate intensity PA recommended for good health [36]. Even though the increase in PA by the intervention group did not reach statistical significance, the difference between the two groups in the pattern of change over time was statistically significant, which supports a finding of successful maintenance of PA in the intervention group. The inability to show a significant difference in the intervention group is most likely due to the relatively small group numbers and lack of power. This maintenance of PA levels over the 24-month period in the intervention group was achieved with a home-based program employing a BI, and although this was supported by mail-outs and phone calls it was of low intensity. These results underscore the importance of developing appropriate strategies for this target group that achieve good adherence [12] and persist in the long-term. Further, this suggests that to achieve significant increases in PA levels approaches may need to be more intensive.
PA measured via the CHAMPS questionnaire did not show an increase in PA when compared to the control group. That was not the case with the objective measure using the pedometer. As this questionnaire relies on the recall of PA in a typical week over the past month in this target group of individuals with memory concerns it is possible that the result was a consequence of inaccurate recall. Thus highlighting the need for PA interventions in this target group to use objective measures of PA.
While cardiovascular fitness did not differ in the pattern of change between the two groups over the period of the intervention, this is not surprising. Previous studies have similarly failed to observe a difference between control and intervention in fitness [37]. Further, this sample included some participants who were already doing some moderate intensity PA at baseline which limited the amount of PA that could be added to the participant’s PA program. Only the ‘inactive’ group at baseline (26.4%) were prescribed the amount recommended to improve health and fitness of 150 min/week of moderate intensity PA. Since the magnitude of change in fitness is related to baseline levels and the PA load, then the expected change would be small in magnitude. Thus limiting our ability to achieve higher levels of change in cardiovascular fitness. Further, the control group continued with their habitual PA again limiting our ability to show a large relative change between the two groups. However, it was encouraging to note that the relative increase from baseline to 24 months in the distance walked for the intervention group of 18.22 m was close to the range (19–22 m) considered to be a clinically relevant increase in fitness [38] and was similar in magnitude to that reported by Lamb et al. [39].
The improvement in leg strength with the home-based PA program was consistent with the results of a meta-analysis of center-based supervised PA interventions in people with cognitive impairment [5]. This is an important result as the specificity of the training is important for improved outcomes [5]. Although our PA program was predominantly walking and not strength training based, we achieved improvements similar to those that were mostly multimodal or resistance training programs. This finding of a 7% improvement in leg strength over the 24 months in the intervention group is relevant demonstrating that a walking program has the potential to not only reduce the decline in strength with age but to increase leg strength, thus potentially improving balance and physical function [39]. This is very salient, as individuals with MCI are reported to have higher levels of motor dysfunction than other older adults [40, 41]. In the current study we did not observe a difference between the groups on the balance test even though leg strength improved which is a finding that has been previously reported [42]. The lack of finding of a difference between the control and intervention group in grip strength was not unexpected as the PA program utilized walking which uses lower leg muscles whereas grip strength involves hand muscles and improvements with training are seen to be related to specificity of training [5]. Similarly, the lack of improvement in mobility (TUG) with the PA program was not surprising as even though both the TUG and PA program involve walking the performance of the TUG also requires leg strength and reaction time (in getting up and down from a chair), fast walking speed and agility in changing direction. The walking program engaged in by our participants did not specifically target these skills thus it is not surprising that we did not demonstrate an improvement in mobility. Improvements in physical function are specific to the type of training, and need to be of sufficient frequency and/or duration to improve, balance, hand strength and mobility [5]. These authors also reported in their systematic review of exercise training and physical function in MCI and AD participants that studies including community-based participants only reported no significant results. They suggested that their higher baseline values in these functional outcomes means they have less room for improvement. In the current study, the inability to show a significant difference between groups may also have been due to the relatively small group size and lack of power.
The finding of a difference between groups in the change fat mass over the 24-months with a reduction of fat mass in the intervention group and this taken in conjunction with a preservation of fat-free mass is important and relevant for this target group as weight loss has been shown to often precede AD [43]. This ‘obesity paradox’ raises the question if increasing PA results in a reduction in body weight does this reduction potentially increase the risk of AD in older adults already at increased risk? Exercise is often an adjunct to energy restriction in weight loss programs as reducing energy intake alone results in both fat loss and loss of fat-free mass [44]. The major component of fat-free mass is muscle mass. Preserving muscle mass is important as we age. The loss of skeletal muscle and strength with age is reported to be around 2% per year after the age of 60 years and this loss can affect daily activities [45–47]. This gradual loss of muscle mass and function known as ‘sarcopenia’ has also been associated with cognitive impairment [48]. Further, higher levels of sarcopenia and frailty in individuals with AD and CVR are associated with adverse outcomes such as falls, disability and mortality [49]. A supervised moderate intensity, walking program in combination with diet-induced weight loss has been shown to attenuate the loss of muscle mass [50]. In the current study, we did not have robust dietary monitoring and, although we cannot be certain that the fat loss was due to the walking program and not a reduction in energy intake, taken together with the lack of a reduction in fat-free mass it is likely that PA was the major contributor. Further, as we demonstrated a significant difference between the two groups in PA but not the 6-minute walk test this highlights the possibility that the changes in body composition were due to the amount of the PA over the duration of the trial rather than the intensity of the PA which is needed to improve fitness. That is, the energy expenditure achieved by more steps over a longer period resulted in energy output that was sufficient to reduce fat mass but may not have been of sufficient intensity to stimulate an increase in fitness. Even though the magnitude of the reduction in fat mass of 1.12 kg is not large, this translates into an even larger amount of weight lost. Given that an increase in weight of 0.5 kg/year is associated with an increase in all-cause mortality [51], our findings are clinically meaningful.
Further, taken together with the reduction in hip circumference and the increase in leg strength in the intervention group this suggests that the loss of fat could have been from buttocks region but with preservation of the gluteal muscle mass which play a major role in the sit to stand task. Although we were not able to determine if this was the case, preservation of lower limb fat-free mass determined by dual-energy x-ray absorptiometry, ‘leaner’ thigh muscle determined by CT and muscle fiber size determined by muscle biopsy has been reported with a walking intervention in older adults [50]. This novel finding is important, as it demonstrates that this PA intervention of moderate intensity walking has the potential to slow down the loss of muscle mass and strength seen with sarcopenia in this target group.
We were not able to demonstrate a significant difference in central obesity (waist circumference) a recognized CVR factor between the control and intervention group. This may have been due to measurement variation as the waist circumference measure taken at the level of the minimum width, is subject to more observer error than the hip circumference that has a reference of an anatomical landmark.
One of the strengths of our study is that we investigated the effects of a home-based PA intervention over a long-term period with 4 assessment periods which is rare in healthy older populations, and to our knowledge a first in this target group. We have been able to demonstrate that such programs can increase PA and that this increase is maintained. The excellent retention and adherence to the prescribed amount of PA enabled us to demonstrate a beneficial effect on PA, leg strength, and body composition that are not always apparent in the short–term. These results highlight the need to develop effective strategies that lead to sustained PA levels if the inclusion of modest amounts of PA is to be translated into community programs and have a meaningful effect on health status. The utilization of the pedometer as an objective measure PA rather than relying on participant recall in a group who has memory concerns adds to the strength of the study. The pedometer is limited however in the ability to determine the intensity of the PA. A further strength is the relatively large number of participants in a 24-month trial that was adequate for some outcomes but for some outcomes even with these numbers, we had limited power to be able to detect a significant difference between groups. We simplified the recording of the PA for the intervention group by providing individualized diaries to record their activity and supported both groups throughout the 24 months with newsletters and phone calls to enhance retention and adherence. The inclusion of participants who may have already been doing some moderate intensity PA limited the amount of PA that could be prescribed, thus reducing our ability to demonstrate an effect as the amount of PA prescribed depended upon the baseline PA and this varied within the intervention group. For those with higher baseline PA levels the effects on some measures may have been limited due to a ceiling effect. However, the inclusion of non-sedentary participants does not limit the generalizability of the results of this trial as the PA classifications of our participants were similar to those of Australians in the same age range [52]
Even though participants were asked not to change other lifestyle habits and we only collected basic self-reported dietary information and not detailed diet records, we cannot be sure that the body composition changes were not at least in part due to some change in diet and a possible reduction in energy intake. We used practical field measures for some outcomes such as fitness and body composition and while these have the advantage of being implemented and translated for use in a community setting they have limitations. Limitations in terms of the robustness and variability of the measures may have reduced the ability of this trial to detect small changes between groups. Another limitation of this study is that we have reported several secondary outcomes in this paper and as the analyses have not been adjusted for multiple comparisons it is possible that some results may be subject to type 1 error (false positives). However, it is also possible that by not reporting the unadjusted results there is the risk of a type 2 error where we report that there is no significant difference when there is one.
The results of this trial have several implications for implementation in a community and clinical setting. Firstly, the PA regime of moderate intensity, predominantly walking, is achievable by older adults without major health conditions and this was demonstrated in this group of older adults with MCI and at least 1 CVR factor. Secondly, being home-based means that PA can be undertaken with minimal or no cost, overcomes the potential barrier of transportation, and can be done at the individual’s convenience. Further, the low incidence of PA program related injury or musculoskeletal conditions and no major adverse events means that it can be engaged in safely. It also supports the findings of Hamer et al. [53] in older adults that sustained PA has health benefits but that these benefits are apparent even if PA is not taken up until later in life. In a longitudinal aging study, two-thirds of MCI cases were reported to be physically frail or pre-frail largely due to low muscle mass, slow gait speed, balance and gait impairment [54]. The improvement in leg strength, fat mass, and preservation of lean body mass reported in this study, if repeated in future trials, highlights the potential of this modest, easily accessible, and acceptable walking program to be used in programs targeting older adults, in particular those with MCI or SMC to achieve improved health status and the prevention of disability. Importantly, the uptake of PA needs to be maintained, underscoring the need for salient strategies to motivate this target group to sustain their PA.
In conclusion, in this target group at risk of AD and having a co-existing CVR factor long-term PA adherence is achievable, acceptable, and has health benefits in terms of fitness, body composition, and potentially attenuating sarcopenia and risk of disability.
Our novel results of high retention rates and excellent long-term adherence to a PA intervention are important for the global efforts to reduce dementia risk. To date there are no effective pharmacological treatments available for the prevention of cognitive decline AD or dementia. This makes the modification of lifestyle that reduces risk factors such as physical inactivity, cognitive inactivity, mid-life obesity, hypertension, heart disease, diabetes, smoking, and hypercholesterolemia a crucial strategy. This is underscored by the estimate that a third of AD cases worldwide may be attributed to modifiable risk factors. Recently it was reported that with a 10% reduction in each risk factor each decade, by 2050 the estimated reduction in the prevalence of AD would be 8.3% [11]. We have previously identified a need for targeted, effective, and viable PA intervention in order to achieve a reduction in the risk from inactivity [55]. The current study demonstrates that such PA interventions are not only achievable and effective in increasing PA long-term but are acceptable to the target group. Further the observed increase in leg strength and favorable improvements in fat mass and body fat distribution highlight the additional health benefits of PA interventions and the potential to reduce other risk factors for dementia. The moderate intensity PA intervention undertaken in this study was low risk, easily accessible, and possible for most older adults at minimal or no cost making it easily adaptable and available on a global scale. Hence highlighting the potential for PA interventions to have a potent impact as a global strategy for the prevention of dementia. Future research needs to concentrate on finding successful strategies for the implementation of PA programs into the community.
ACKNOWLEDGMENTS
We are grateful to all the participants for their time and dedication to this study and to our research staff.
This paper was supported by a project grant (1005942) and the Centre of Research Excellence in Cognitive Health (1100579) from the Australian National Health and Medical Research Council.
Funding for the AIBL study is provided by the CSIRO Flagship Collaboration Fund and the Science and Industry Endowment Fund (SIEF) in partnership with Edith Cowan University (ECU), Mental Health Research institute (MHRI), Alzheimer’s Australia (AA), National Ageing Research Institute (NARI), Austin Health, CogState Ltd., Hollywood Private Hospital, Sir Charles Gardner Hospital. The study also receives funding from the National Health and Medical Research Council, the Dementia Collaborative Research Centers program (DCRC2) and The McCusker Alzheimer’s Research Foundation and Operational Infrastructure Support from the Government of Victoria. The Australian Postgraduate Award supported the stipend for ML to be involved in this project.
CS is supported by the NHMRC (grant numbers: 547600, 1032350, and 1062133).
Authors’ disclosures available online (https://www.j-alz.com/manuscript-disclosures/18-0521r1).
REFERENCES
[1] | Lautenschlager NT , Cox KL , Flicker L , Foster JK , van Bockxmeer FM , Xiao J , Greenop KR , Almeida OP ((2008) ) Effect of physical activity on cognitive function in older adults at risk for Alzheimer disease: A randomized trial. JAMA 300: , 1027–1037. |
[2] | Panza GA , Taylor BA , MacDonald HV , Johnson BT , Zaleski AL , Livingston J , Thompson PD , Pescatello LS ((2018) ) Can exercise improve cognitive symptoms of Alzheimer's Disease? A meta-analysis. J Am Geriatr Soc 66: , 487–495. |
[3] | Hernandez SS , Sandreschi PF , da Silva FC , Arancibia BAV , da Silva R , Gutierres PJB , Andrade A ((2015) ) What are the benefits of exercise for Alzheimer's disease? A systematic review of the past 10 years. J Aging Phys Act 23: , 659–668. |
[4] | Rao AK , Chou A , Bursley B , Smulofsk J , Jezequel J ((2014) ) Systematic review of the effects of exercise on activities of daily living in people with Alzheimer's disease. Am J Occup Ther 68: , 50–56. |
[5] | Lam FMH , Huang MZ , Liao LR , Chung RCK , Kwok TCY , Pang MYC ((2018) ) Physical exercise improves strength, balance, mobility, and endurance in people with cognitive impairment and dementia: A systematic review. J Physio-ther 64: , 4–15. |
[6] | Whitmer RA , Gunderson EP , Barrett-Connor E , Quesen-berry CP Jr , Yaffe K ((2005) ) Obesity in middle age and future risk of dementia: A 27 year longitudinal population based study. BMJ 330: , 1360. |
[7] | Kivipelto M , Ngandu T , Fratiglioni L , Viitanen M , Kärehol I , Winblad B , Helkala E-L , Tuomilehto J , Soininen H , Nissi-nen A ((2005) ) Obesity and Am J Occup Ther and Alzheimer disease. Arch Neurol 62: , 1556–1560. |
[8] | Xu WL , Atti AR , Gatz M , Pedersen NL , Johansson B , Fratiglioni L ((2011) ) Midlife overweight and obesity increase late-life dementia risk. Neurology 76: , 1568–1574. |
[9] | Whitmer RA , Gustafson DR , Barrett-Connor E , Haan MN , Gunderson EP , Yaffe K ((2008) ) Central obesity and increased risk of dementia more than three decades later. Neurology 71: , 1057–1064. |
[10] | Gustafson D , Rothenberg E , Blennow K , Steen B , Skoog I ((2003) ) An 18-year follow-up of overweight and risk of Alzheimer disease. Arch Intern Med 163: , 1524–1528. |
[11] | Norton S , Matthews FE , Barnes DE , Yaffe K , Brayne C ((2014) ). Potential for primary prevention of Alzheimer's disease: An analysis of population-based data. Lancet Neurol 13: , 788–794. |
[12] | van der Wardt V , Hancox J , Gondek D , Logan P , das Nair R , Pollock K , Harwood R ((2017) ) Adherence support strategies for exercise interventions in people with mild cognitive impairment and dementia: A systematic review. Prev Med Rep 7: , 38–45. |
[13] | Cox KL , Flicker L , Almeida OP , Jianguo X , Greenop KR , Hendriks J , Phillips M , Lautenschlager NT ((2013) ) The FABS Trial: A randomized control trial of the effects of a 6-month physical activity intervention on adherence and long-term physical activity and self-efficacy in older adults with memory complaints. Prev Med 57: , 824–830. |
[14] | Cyarto EV Lautenschlager NT , Desmond PM , Ames D , Szoeke C , Salvado O , Sharman MJ , Ellis KA , Phal PM , Masters CL , Rowe CC , Martins RN , Cox KL ((2012) ) Protocol for a randomized controlled trial evaluating the effect of physical activity on delaying the progression of white matter changes on MRI in older adults with memory complaints and mild cognitive impairment: The AIBL Active trial. BMC Psychiatry 12: , 167. |
[15] | Ellis KA , Bush AI , Darby D , De Fazio D , Foster J , Hudson P , Lautenschlager NT , Lenzo N , Martins RN , Maruff P , Masters C , Milner A , Pike K , Rowe C , Savage G , Szoeke C , Taddei K , Villemagne V , Woodward M , Ames D and AIBL Research Group ((2009) ) The Australian Imaging, Biomark-ers and Lifestyle (AIBL) study of aging: Methodology and baseline characteristics of 1112 individuals recruited for a longitudinal study of Alzheimer's disease. Int Psychogeriatr 21: , 672–687. |
[16] | Almeida OP , Almeida SA ((1999) ) Short versions of the Geriatric Depression Scale: A study of their validity for the diagnosis of a major depressive episode according to ICD-10 and DSM-IV. Int J Geriatr Psychiatry 14: , 858–865. |
[17] | Larumbe R ((1997) ) Detection of early cases of Alzheimer's disease. Application ofthe CERAD neuropsychological test battery. Rev Med Univ Navarra 41: , 6–11. |
[18] | Molloy DW , Alemayehu E , Roberts R ((1991) ) Reliability of a Standardized Mini-Mental State Examination compared with the traditional Mini-Mental State Examination. Am J Psychiatry 148: , 102–105. |
[19] | Borg GAV ((1982) ) Psychological bases of physical exertion. Med Sci Sports Exec 14: , 377–381. |
[20] | Stewart AL , Mills KM , King AC , Haskell WL , Gillis D , Ritter PL ((2001) ) CHAMPS physical activity questionnaire for older adults: Outcomes for interventions. Med Sci Sports Exerc 33: , 1126–1141. |
[21] | Rikli RE , Jones CJ ((1998) ) The reliability and validity of a 6-minute walk test as a measure of physical endurance in older adults. J Aging Phys Activ 6: , 363–375. |
[22] | McCarthy EK , Horvat MA , Holtsberg PA , Wisenbaker JM ((2004) ) Repeated chair stands as a measure of lower limb strength in sexagenarian women. J Gerontol A Biol Sci Med Sci 59: , 1207–1212. |
[23] | Hill K , Bernhardt J , McGann A , Berkovits DM ((1996) ) A new test of dynamic standing balance for stroke patients: Reliability, validity, and comparison with healthy elderly. Physiother Can 48: , 257–262. |
[24] | Podsiadlo D , Richardson S ((1991) ) The timed “up and go”: A test of basic functional mobility for frail elderly persons. JAGS 39: , 142–148. |
[25] | Gore CJ , Edwards DA ((1992) ) Australian fitness norms: A manual for fitness assessors: The Health Development Foundation. |
[26] | Sims J , Hill K , Hunt S , Haralambous B ((2010) ) Physical activity recommendations for older Australians. Australasian J Ageing 29: , 81–87. |
[27] | Marcus BH , Banspach SW , Lefebvre RC , Rossi JS , Carleton RA , Abrams DB ((1992) ) Using the stages of change model to increase the adoption of physical activity among community participants. Am J Health Promotion 6: , 424–429. |
[28] | Cox KL , Burke V , Gorely TJ , Beilin LJ , Puddey IB ((2003) ) Determinants of retention and adherence in a stage-matched exercise intervention in women aged 40-65 years: The S.W.E.A.T. Study (The Sedentary Womens' Exercise Adherence Trial). Prev Med 36: , 17–29. |
[29] | Bandura A ((1986) ) Social foundations of thought and action: A social cognitive theory. Prentice-Hall International Inc., Englewood Cliffs, NJ. |
[30] | Bandura A ((2004) ) Health promotion by social cognitive means. Health Educ Behav 31: , 143–164. |
[31] | Tudor-Locke C , Bassett DR Jr ((2004) ) How many steps/day are enough? Preliminary pedometer indices for public health. Sports Med 34: , 1–8. |
[32] | van Uffelen JGZ , Chinapaw MJ , Hopman-Rock M , van Mechelen W ((2009) ) Feasibility and effectiveness of a walking program for community-dwelling older adults with mild cognitive impairment. J Ageing Physical Activity 17: , 398–415. |
[33] | Suzuki T , Shimada H , Makizako H , Doi T , Yoshida D , Tsut-sumimoto K , Anan Y , Uemura K , Lee S , Park H ((2012) ) Effects of multicomponent exercise on cognitive function in older adults with amnestic mild cognitive impairment: A randomized controlled trial. BMC Neurol 12: , 128. |
[34] | van der Bij AK , Laurent MGH , Wensing M ((2002) ) Effectiveness of physical activity interventions for older adults. Am J Prev Med 22: , 120–133. |
[35] | Miller R , Brown W , Tudor-Locke C ((2006) ) But what about swimming and cycling? How to “count” non-ambulatory activity when using pedometers to assess physical activity. J Phys Act Health 3: , 257–266. |
[36] | World Health Organization (2010) Global recommendations on physical activity for health. WHO. |
[37] | Uemura K , Doi T , Shimada H , Makizako H , Yoshida D , Tsutsumimoto K , Anan Y , Suzuki T ((2012) ) Effects of exercise intervention on vascular risk factors in older adults with mild cognitive impairment: A randomized controlled trial. Dement Geriatr Cogn Disord Extra 2: , 445–455. |
[38] | Perera S , Mody SH , Woodman RC , Studenski SA ((2006) ) Meaningful change and responsiveness in common physical performance measures in older adults. JAGS 54: , 743–749. |
[39] | Lamb SE , Sheehan B , Atherton N , Nichols V , Helen Collins H , Mistry D , Dosanjh S , Slowther AM , Khan I , Stavros Petrou S , Lall R , on behalf of the DAPA Trial Investigators ((2018) ) Dementia and Physical Activity (DAPA) trial of moderate to high intensity exercise training for people with dementia: Randomised controlled trial. BMJ 361: , k1675. |
[40] | Masatoshi T , Takashi M , Masayasu O , Golam S , Toshihisa T ((2008) ). Mild cognitive impairment and subjective cognitive impairment. Psychogeriatrics 8: , 155–160. |
[41] | Jeon SY , Han SJ , Jeong JH , Fregni F ((2014) ) Effect of exercise on balance in persons with mild cognitive impairment. Neurorehabilitation 35: , 271–278. |
[42] | Laussen J , Kowaleski C , Martin K , Hickey C , Fielding RA , Reid KF ((2016) ) Disseminating a clinically effective physical activity program to preserve mobility in a community setting for older adults. J Frailty Aging 5: , 82–87. |
[43] | Soto ME , Secher M , Gillette-Guyonnet S , van Kana GA , Andrieu S , Nourhashemia F , Rollanda Y , Vellas B ((2012) ) Weight loss and rapid cognitive decline in community-dwelling patients with Alzheimer's disease. J Alzheimers Dis 28: , 647–654. |
[44] | Yoshimura E , Kumahara H , Takuro Tobina T , Matsuda T , Watabe K , Matono S , Ayabe M , Kiyonaga A , Anzai K , Higaki Y , Tanaka H ((2014) ) Aerobic exercise attenuates the loss of skeletal muscle during energy restriction in adults with visceral adiposity. Obes Facts 7: , 26–35. |
[45] | Hughes VA , Frontera WR , Roubenoff R , Evans WJ , Fiatarone Singh MAMaria A Fiatarone Singh ((2002) ) Longitudinal changes in body composition in older men and women. Am J Clin Nutr 76: , 473–481. |
[46] | Fielding RA , Vellas B , Evans WJ Bhasin S , Morley JE , Newman AB , van Kan GA , Andrieu S , Bauer J , Breuille D , Cederholm T , Chandler J , De Meynard C , Donini L , Tamara Harris T , Tamara Harris T , Kannt A , Keime Guibert F , Onder G , Papanicolaou D , Rolland Y , Rooks D , Sieber C , Souhami E , Verlaan S , Zamboni M ((2011) ) Sarcopenia: An undiagnosed condition in older adults. Current consensus definition: Prevalence etiology and consequences. International working group on sarcopenia. J Am Med Dir Assoc 89: , 81–88. |
[47] | Jackson AS , Janssen I , Sui X , Church TS , Blair SN ((2012) ) Longitudinal changes in body composition associated with healthy ageing: Men aged 65-89 years. Br J Nutr 107: ,1085–1091. |
[48] | Chang KE-V , Hsu T-H , Wu W-T , Huang K-C , Han D-S ((2016) ) Association between sarcopenia and cognitive impairment: A systematic review and meta-analysis. J Am Med Dir Assoc 17: , 1164.e7e1164.e15. |
[49] | Hirose D , Hanyu H , Fukasawa R , Hatanaka H , Nayuta Namioka N , Sakurai H ((2016) ) Frailty and sarcopenia in subjects with Alzheimer's disease with or without cere-brovascular disease. Geriatr Gerontol Int 16: , 1235–1236. |
[50] | Chomentowski P , John J , Dube JJ , Amati F , Stefanovic-Racic M , Zhu S , Toledo FGS , Goodpaster BH ((2009) ) Moderate exercise attenuates the loss of skeletal muscle mass that occurs with intentional caloric restriction-induced weight loss in older, overweight to obese adults. J Gerontol A Biol Sci Med Sci 64A: , 575–580. |
[51] | Somes GW , Kritchevsky SB , Shorr RI , Pahor M , Applegate WB ((2002) ) Body mass index, weight change, and death in older adults: The Systolic Hypertension in the Elderly Program. Am J Epidemiol 156: , 132–138. |
[52] | ABS: 4364.0.55.004 - Australian Health Survey: Physical Activity, 2011-12. http://www.abs.gov.au/ausstats/[email protected]/Latestproducts/D4495467B7F7EB01CA257BAC0015F593?opendocument. |
[53] | Hamer M , Lavoie KL , Bacon SL ((2014) ) Taking up physical activity in later life and healthy ageing: The English longitudinal study of ageing. Br J Sports Med 48: , 239–243. |
[54] | Nyunt MSZ , Soh CY , Gao Q , Gwee X , Ling ASL , Lim WS , Lee TS , Yap PLK , Yap KB and Ng TP ((2017) ) Characterisation of Physical frailty and associated physical and functional impairments in mild cognitive impairment. Front Med 4: , 230. |
[55] | Cox KL , Cyarto EV , Etherton-Beer C , Ellis KA , Alfonzo H , Clare L , Liew D , Ames D , Flicker L , Almeida OP , LoGiu-dice D , Lautenschlager NT ((2017) ) A randomized controlled trial of physical activity with individual goal-setting and volunteer mentors to overcome sedentary lifestyle in older adults at risk of cognitive decline: The INDIGO trial protocol. BMC Geriatrics 17: , 215. |

