
Patterns of Regional Cerebral Blood Flow as a Function of Obesity in Adults
Abstract
Background:
While obesity has been shown to be a risk factor for Alzheimer’s disease, the potential mechanisms underlying this risk may be clarified with better understanding of underlying physiology in obese persons.
Objective:
To identify patterns of cerebral perfusion abnormality in adults as a function of body mass index (BMI) defined weight categories, including overweight or obese status.
Methods:
A large psychiatric cohort of 35,442 brain scans across 17,721 adults (mean age 40.8±16.2 years, range 18–94 years) were imaged with SPECT during baseline and concentration scans, the latter done after each participant completed the Connors Continuous Performance Test II. ANOVA was done to identify patterns of perfusion abnormality in this cohort across BMI designations of underweight (BMI < 18.5), normal weight (BMI = 18.5 to 24.9), overweight (BMI 24.9 to 29.9), obesity (BMI≥30), and morbid obesity (BMI≥40). This analysis was done for 128 brain regions quantifying SPECT perfusion using the automated anatomical labeling (AAL) atlas.
Results:
Across adulthood, higher BMI correlated with decreased perfusion on both resting and concentration brain SPECT scans. These are seen in virtually all brain regions, including those influenced by AD pathology such as the hippocampus.
Conclusion:
Greater BMI is associated with cerebral perfusion decreases in both resting and concentration SPECT scans across adulthood.
INTRODUCTION
While Alzheimer’s disease (AD) has been recognized as the most common cause of dementia for decades [1], lifestyle factors are increasingly recognized as risk modifiers for AD. Midlife-obesity, in particular, has been identified as a risk factor for future dementia [2]. Such a relationship is an important focus for potential risk reduction, particularly given the lack of currently available effective treatments for AD. However, the nature of this relationship between overweight or obese and the risk for AD remains unknown. Attempts to better understand this question in humans have used neuroimaging as a key tool. Previous work has demonstrated that overweight- and obesity-related brain volume loss can overlap in the same regions targeted by AD pathology, such as the hippocampus [3]. These changes have been demonstrated even in cognitively normal individuals, as well as persons with mild cognitive impairment and AD [4, 5].
Regional cerebral blood flow has also been used to track obesity-related brain abnormalities. For example, one voxel based single photon emission computed tomography (SPECT) study showed body mass index (BMI)-related hypoperfusion [6] in retired National Football League players. Obesity is thought to promote hypoperfusion by promoting hypertrophic inward remodeling of the cerebral vasculature [7]. Structural brain changes have also been reported in successful dieters [8]. Weight loss has also been shown in a systematic review to relate to attenuation of cognitive decline [9].
Functional neuroimaging remains an important resource in identifying potential risk factors for dementia [10], as well as age-related changes [11]. We have previously utilized SPECT functional neuroimaging to review and identify patterns of abnormality relevant to the diagnosis of traumatic brain injury [12, 13], depression versus dementia classification [14], marijuana-related influences in the brain [15], omega-3 fatty acid associated improved cerebral blood flow [16], gender-related differences in the brain [17], and brain aging [18]. This work has been done with a quantitative approach in regions of interest with knowledge of psychiatric co-morbidities for use in multi-variable statistical modeling. The purpose of this current work is to identify potential brain perfusion abnormalities in adults related to being overweight or obese.
MATERIALS AND METHODS
Subjects
Subjects were drawn from multiple branches of the Amen Clinics as described in prior work [19]. IRB approval for retrospective analysis of de-identified clinical and SPECT scan data was provided by accredited institutional review board, IntegReview (IRB# 004; http://www.integreview.com/). Inclusion criteria were expanded to encompass the largest number of subjects for analysis for BMI patterns across the lifespan and across a variety of psychiatric and neurological diagnosis. Some subjects had more than one diagnosis. Subject demographics are detailed in Table 1.
Table 1
Subject Demographics (Total n = 17721; 35442 scans)
| Variables | Statistics (χ ± σ, |
| Range, Percent (n)) | |
| Age | 40.8±16.2, Age 18–94 |
| Age Group (Adult/Geriatric) | 90.9 (33558)/9.1 (3345) |
| Gender (Male/Female) | 60.6 (18925)/39.4 (12296) |
| Body Mass Index | 25.2±6.2, (10.9–82.9) |
| Eating Disorder | 2.7 (481) |
| All Cause Dementia | 6.2 (1151) |
| (Including AD) | |
| ADHD | 51.1 (9055) |
| Major Depression | 17.5 (3107) |
| Bipolar Disorder | 7.4 (1313) |
| Generalized Anxiety Disorder | 56.5 (10006) |
| Traumatic Brain Injury | 43.5 (7700) |
| Schizophrenia | 2.4 (427) |
| Alcohol Use Disorder | 5.8 (1034) |
| Cannabis Use Disorder | 3.8 (682) |
Brain SPECT imaging
As detailed previously [13–18], all subjects received intravenous administration of an age- and weight-appropriate dose of technetium-99m hexamethylpropylene amine oxime (99mTc-HMPAO) for brain SPECT imaging. Each subject received a resting, or baseline, scan and a task or concentration scan on different days and discontinued medications on the day of scans. For baseline scans, subjects were injected while sitting quietly in same setting with eyes open. Subjects were then scanned 30 minutes later using a high-resolution Picker Prism 3000 triple-headed gamma camera with fan beam collimators, acquiring data in 128×128 matrices, yielding 120 images per scan with each image separated by 3° spanning 360°. SPECT data was processed and attenuation correction performed using general linear (Chang) method for attenuation correction. Brain SPECT images were then reconstructed and resliced according to anterior-posterior commissure line so final images were similarly aligned for analysis. Concentration scans were done on a separate day following with tracer injected 3 min after completion of the Connors Continuous Performance Test II [20]. The scan protocol was otherwise no different than the baseline scan. Cerebral perfusion was then estimated using a region of interest (ROI) basis using areas derived from the automated anatomical labeling atlas (AAL) [21]. As detailed in prior work [22], ROI counts in each region of interest (ROI) were quantified using trimmed means. Calculation of these trimmed means was done using all scores in a 98% confidence interval (–2.58 < Z < –2.58). Perfusion for each region was then estimated with the trimmed mean using the following formula.
Statistical analysis
All statistical analyses were conducted using SPSS (Version 26, IBM, Armonk, NY). First, the relationship between BMI, as a function of underweight (BMI < 18.5), normal weight (BMI 18.5–24.9), overweight (BMI 25–29.9), obese (BMI≥30), morbidly obese (BMI≥40), and regional cerebral blood flow was evaluated using one way ANOVA at both baseline and concentration tasks. Least squares differences were used to correct for multiple comparisons. p-values <0.05 were considered statistically significant. Partial correlations were then modeled between BMI and these regional baseline and concentration perfusion estimates controlling for age, gender, and co-morbidities including psychiatric co-morbidities.
RESULTS
ANOVA results are detailed in Supplementary Material 1 for baseline perfusion and Supplementary Material 2 for concentration perfusion.
Figures 1–5 detail the baseline perfusion ANOVA results of all participants as a function of worsening overweight and obesity in several areas of key relevance for AD: temporal lobes (Fig. 1), parietal lobes (Fig. 2), hippocampus (Fig. 3), posterior cingulate (Fig. 4), and precuneus (Fig. 5).
Fig. 1.
Areas of obesity-related hypoperfusion in brain regions vulnerable to Alzheimer’s disease: temporal lobes.
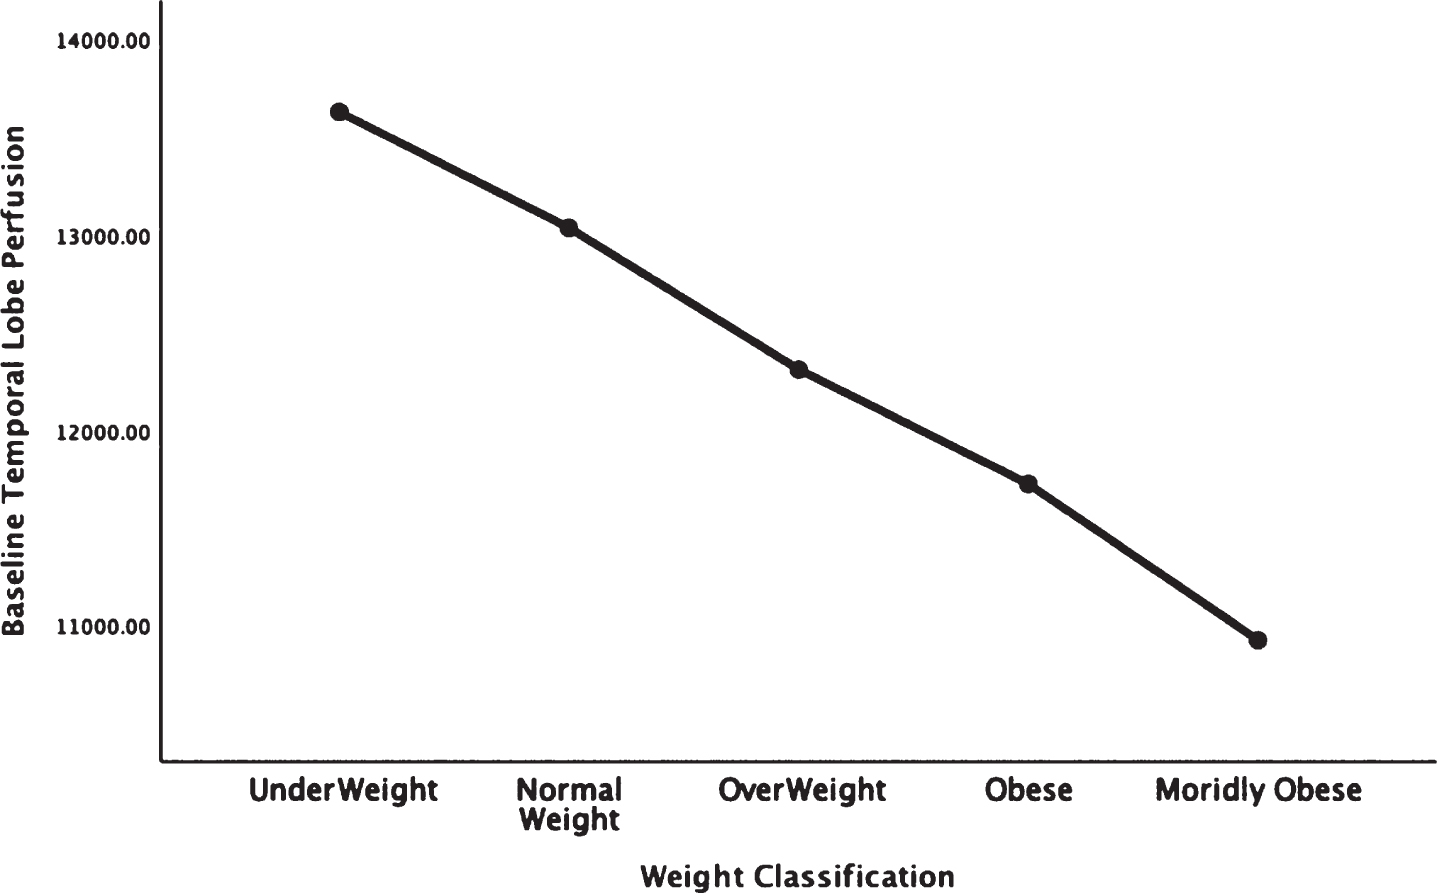
Fig. 2.
Areas of obesity-related hypoperfusion in brain regions vulnerable to Alzheimer’s disease: parietal lobes.
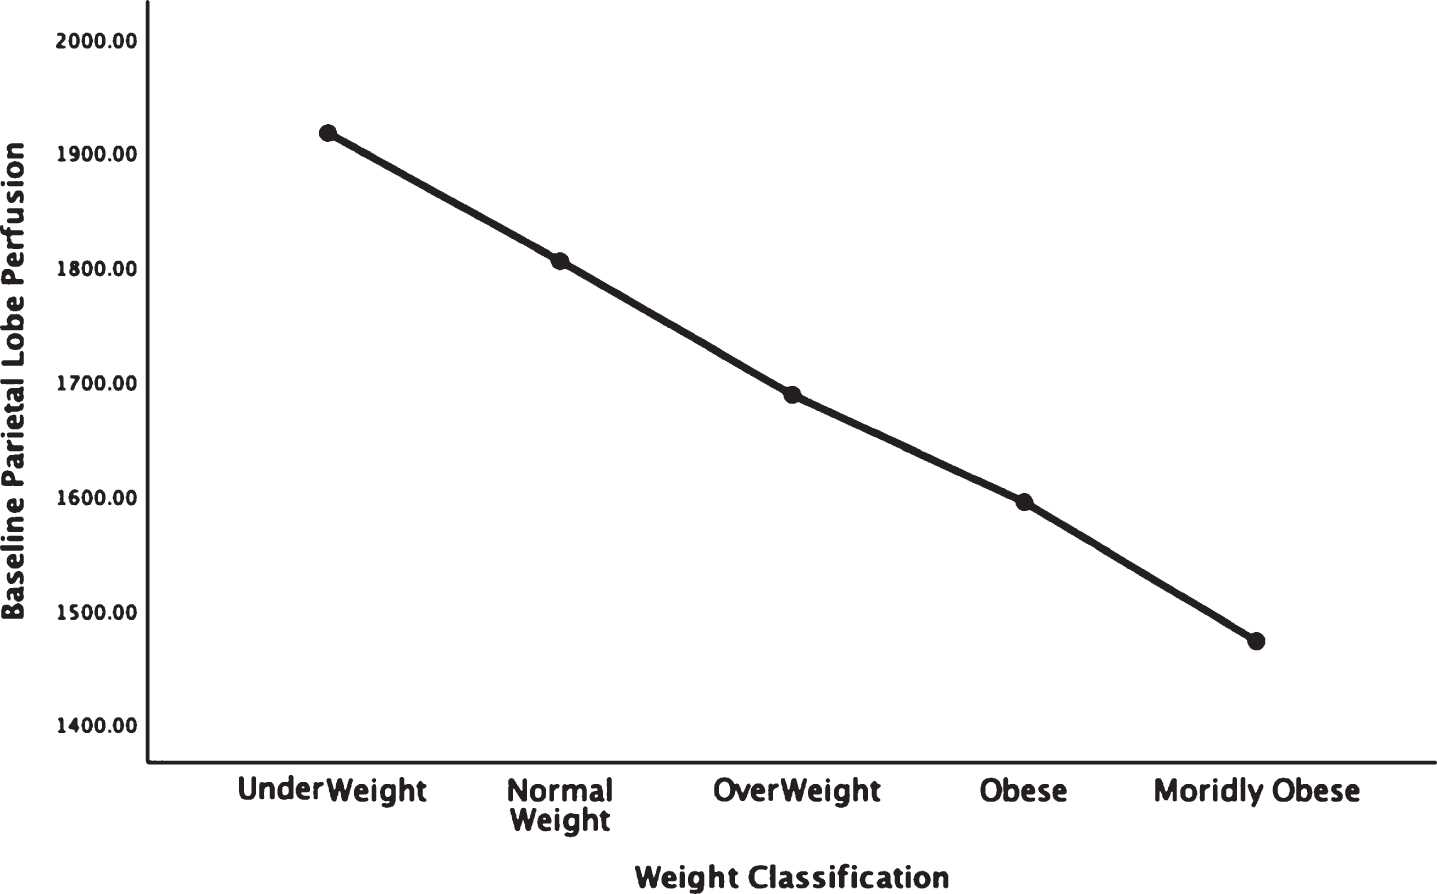
Fig. 3.
Areas of obesity-related hypoperfusion in brain regions vulnerable to Alzheimer’s disease: hippocampus.
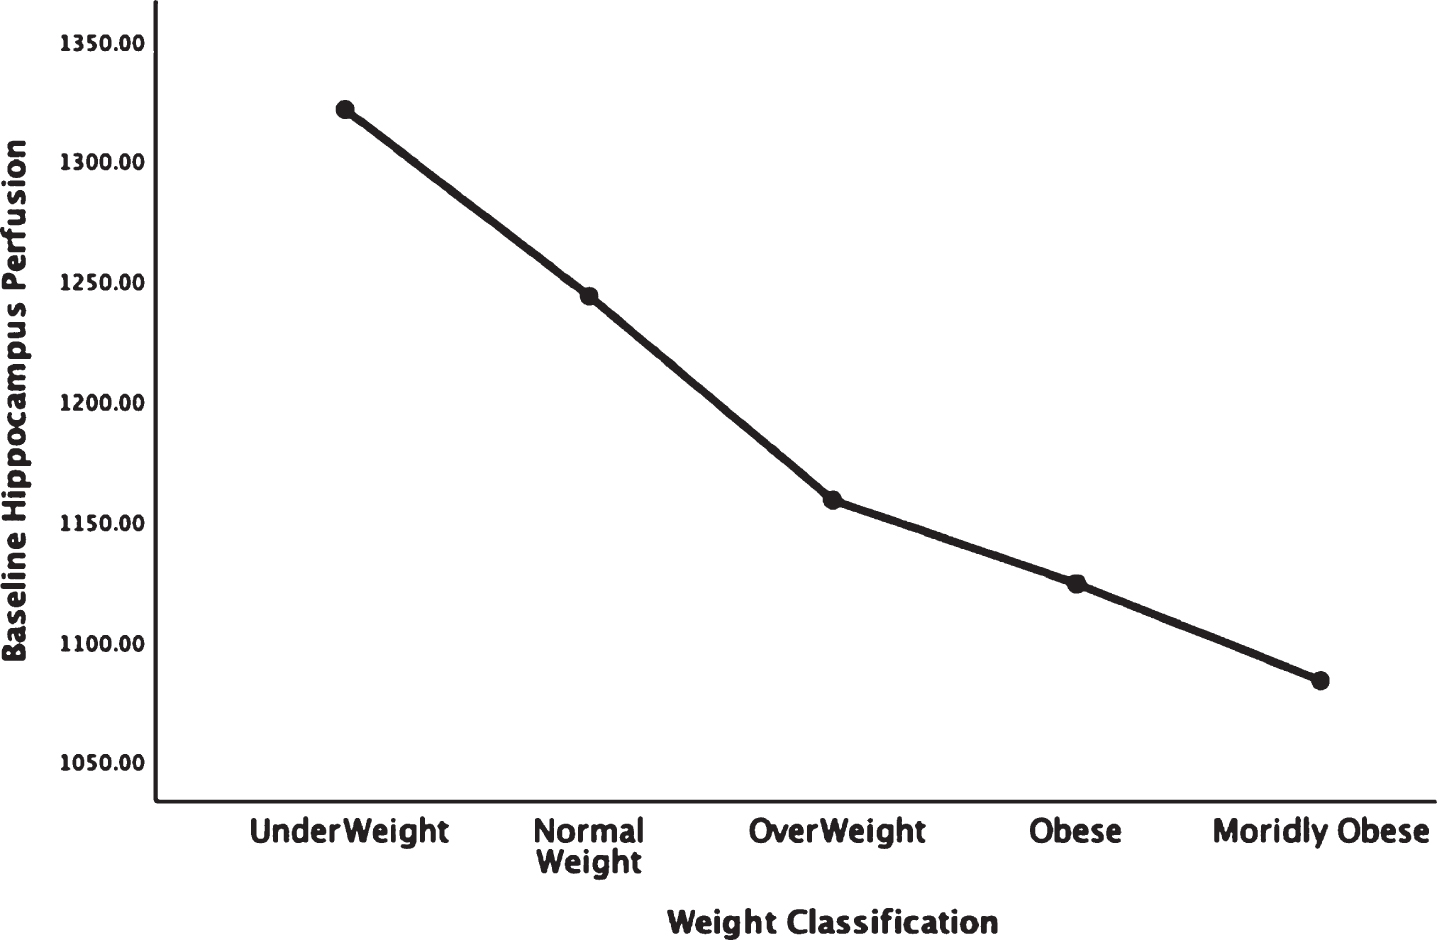
Fig. 4.
Areas of obesity-related hypoperfusion in brain regions vulnerable to Alzheimer’s disease: posterior cingulate.
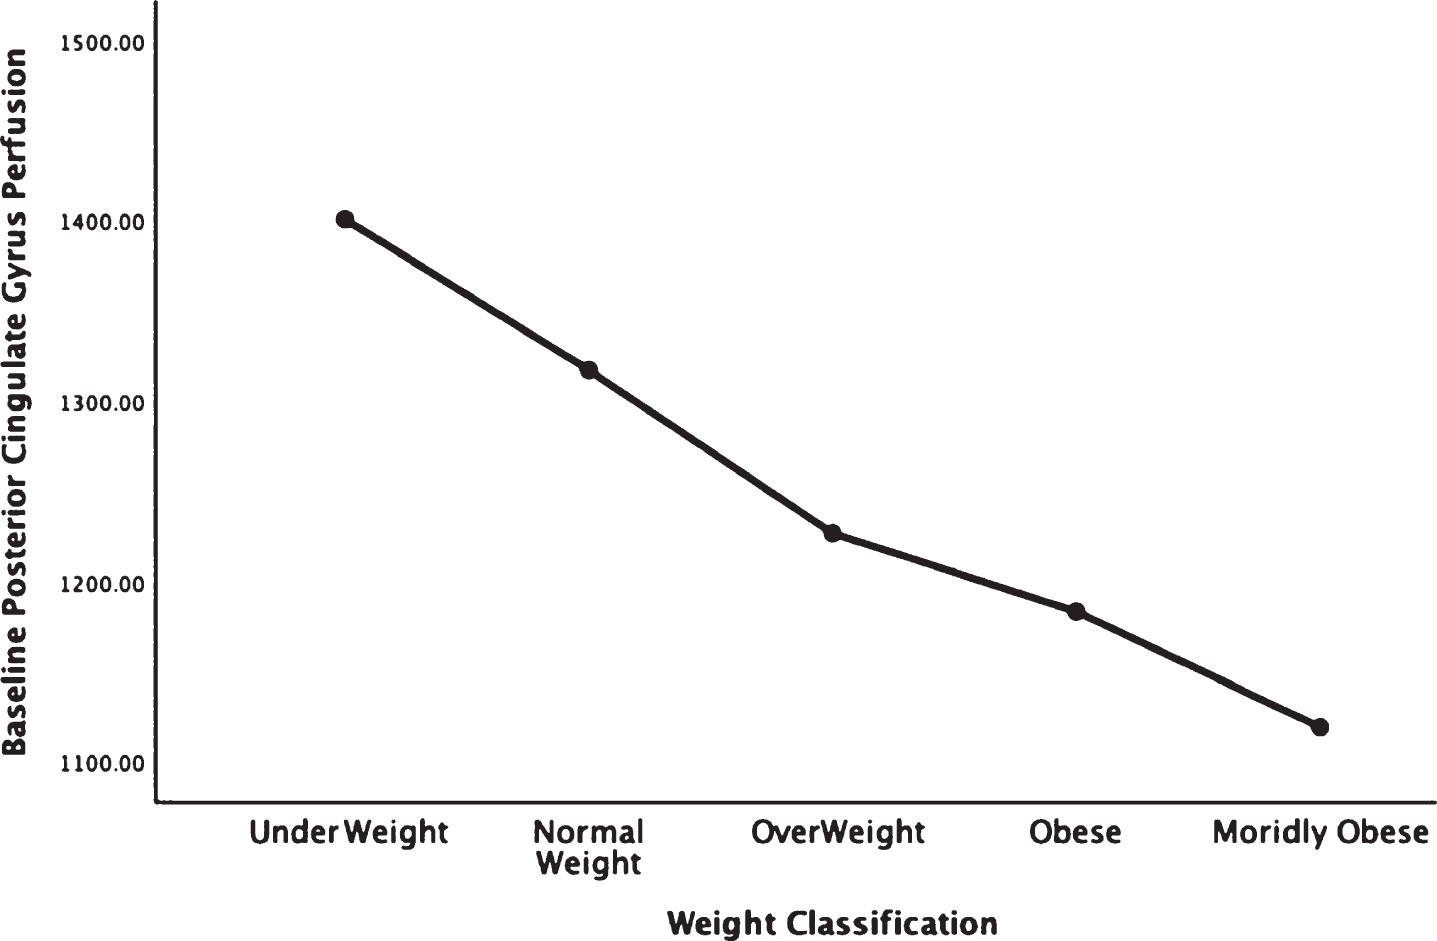
Fig. 5.
Areas of obesity-related hypoperfusion in brain regions vulnerable to Alzheimer’s disease: precuneus.
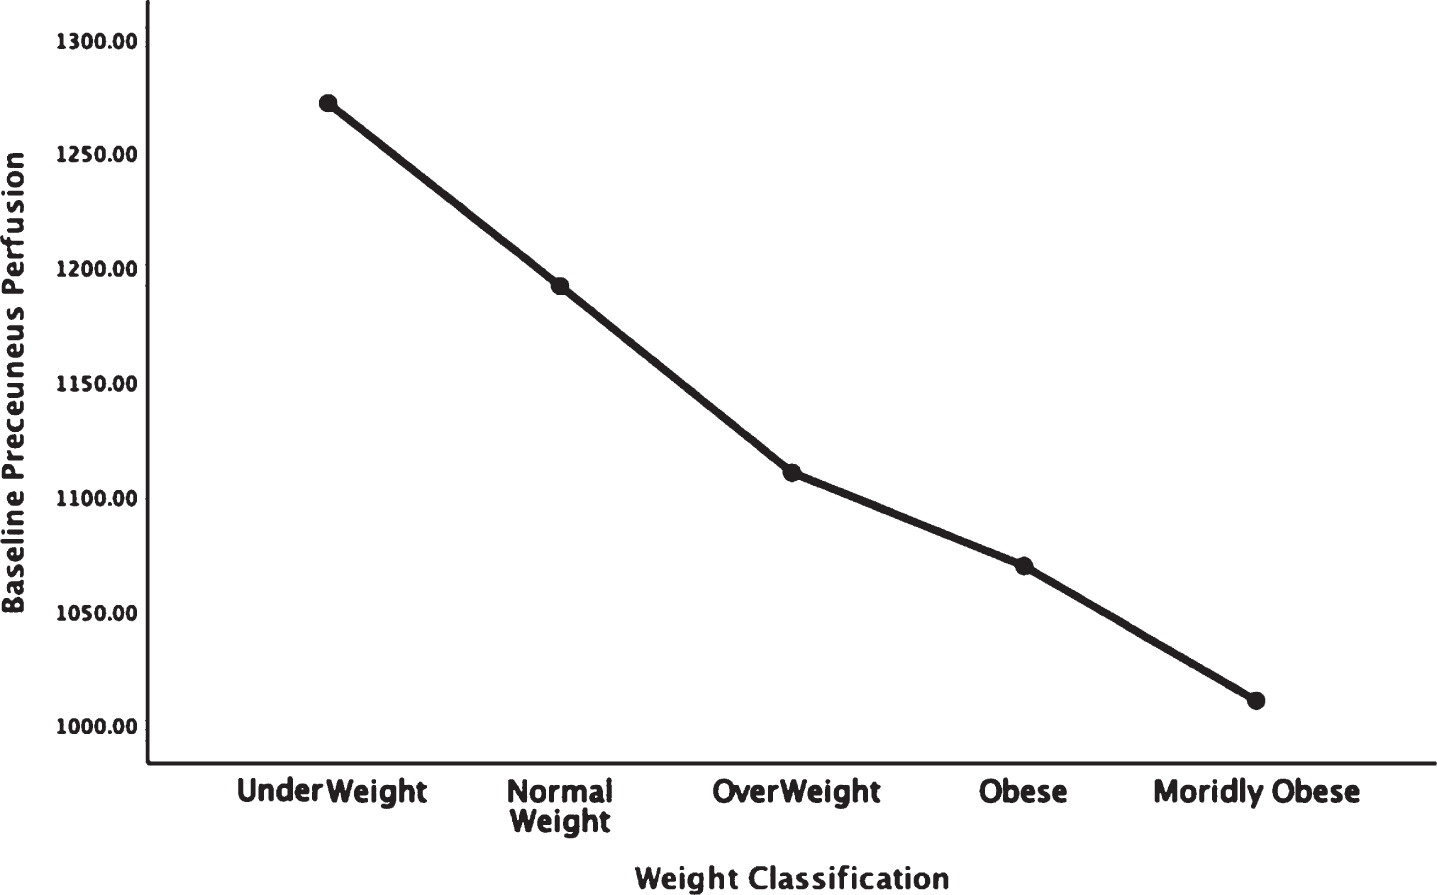
In each figure, the y-axis expresses the estimated perfusion as counts/pixel and the x-axis shows the weight categories by BMI. In summarizing this data, the most notable pattern across virtually all brain regions is the decline in cerebral perfusion in a progression from underweight to normal, overweight and then to obese categories. This pattern is consistent whether comparing baseline or concentration scans across weight groups. There were no regions that showed elevated perfusion in relation to higher BMI.
Figure 6 shows the progressive decrease in baseline resting perfusion comparing three different men of the same age with normal, overweight, and obese BMIs.
Fig. 6.
This figure showed 3-D renderings of resident perfusion averaged across normal BMI (BMI = 23), overweight (BMI = 29), and obese (BMI = 37) men, each 40 years of age.
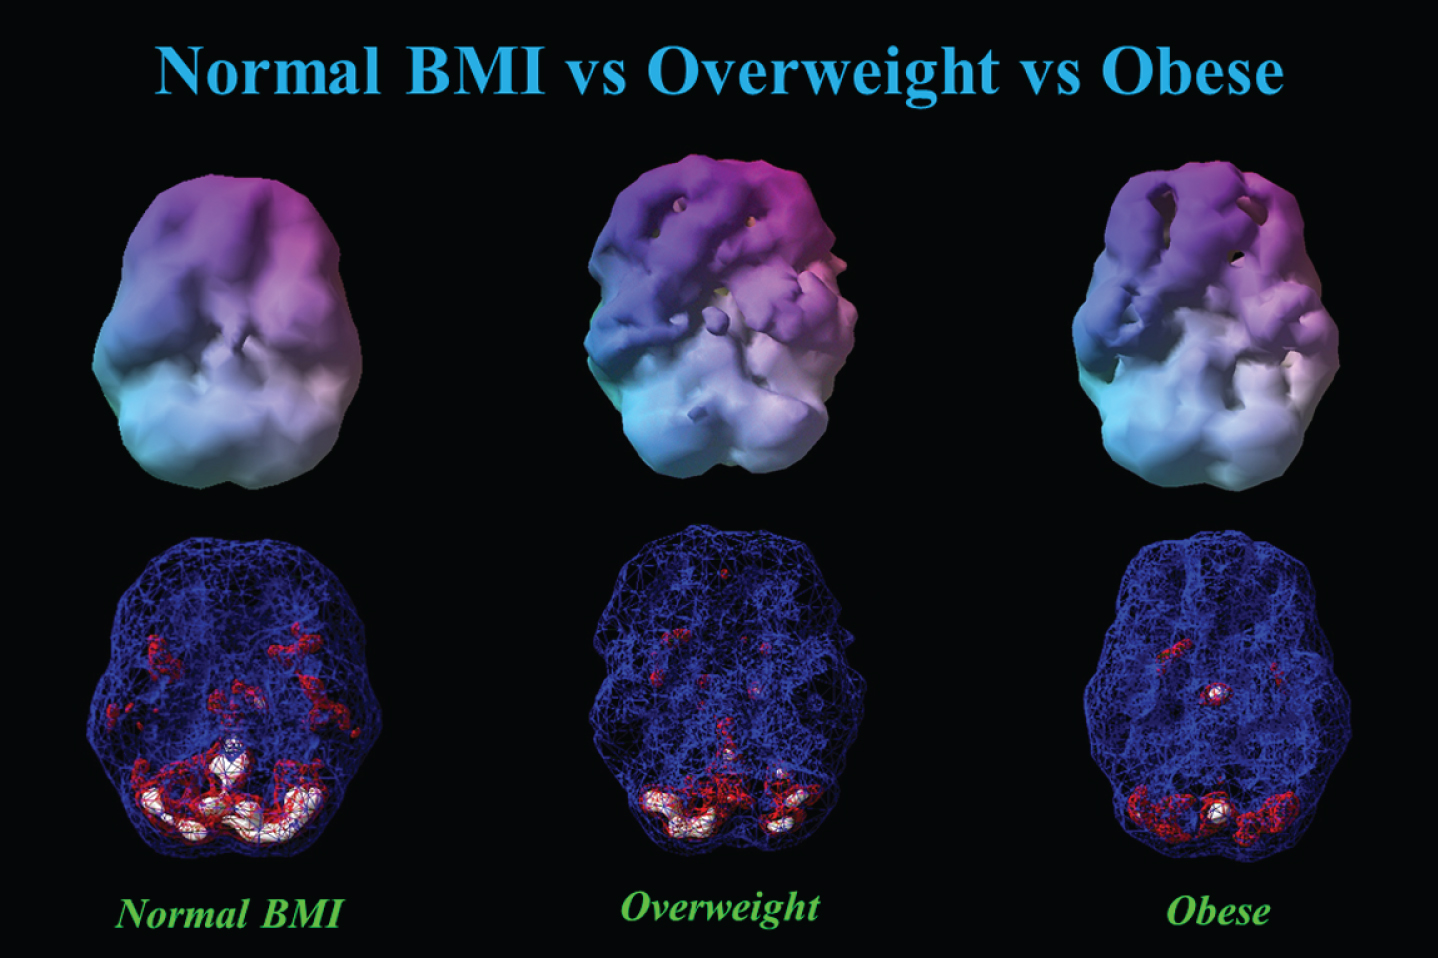
Table 2 shows the partial correlations between BMI and baseline perfusion adjusting for age, gender, and co-morbidities including psychiatry co-morbidities.
Table 2
Partial Correlations of BMI and Baseline Brain Perfusion in Regions Vulnerable to Alzheimer’s Disease
| Brain Regions | BMI | |
| Baseline | Correlation | –0.218 |
| _Temporal_Lobe | ||
| Significance (2-tailed) | <0.001 | |
| Baseline | Correlation | –0.221 |
| _Parietal_Lobe | ||
| Significance (2-tailed) | <0.001 | |
| Baseline | Correlation | –0.205 |
| _Hippocampus | ||
| Significance (2-tailed) | <0.001 | |
| Baseline | Correlation | –0.169 |
| _Posterior_Cingulate | ||
| Significance (2-tailed) | <0.001 | |
| Baseline_Preceuneus | Correlation | –0.223 |
| Significance (2-tailed) | <0.001 |
Supplementary Table 1 displays the partial correlation results for all areas adjusting for age, gender, and co-morbidities including psychiatry co-morbidities.
DISCUSSION
With over 35,000 functional neuroimaging scans across more than 17,000 individuals, this study is one of the larger studies linking obesity with brain dysfunction, as evidenced here by quantifiable regional perfusion. The striking patterns of progressively reduced perfusion found in virtually all regions across categories of underweight, normal weight, overweight, obesity, and morbid obesity was noted on both baseline (resting state) and concentration scans. In particular, brain areas noted to be vulnerable to AD: the temporal and parietal lobes, hippocampus, posterior cingulate gyrus, and precuneus were found to have reduced perfusion along the spectrum of weight classification from normal weight to overweight, obese, and morbidly obese [23]. While the majority of persons in this study had psychiatric co-morbidities, adjusting for these factors along with age and gender in a partial correlation analysis did not change the statistical significance of the relationships between BMI and lower perfusion. This related finding strongly suggests that body tissue adiposity and its relationship with lower cerebral perfusion is independent of the presence or absence of existing psychiatric co-morbidities. Combined with other literature [24], this work suggests a deleterious interplay between obesity and brain perfusion.
While the work presented here focused on body tissue adiposity and cerebral perfusion in a large cohort, other studies have suggested a negative relationship between BMI, obesity, and the brain, particularly with neuroimaging as a proxy of structure or function. For example, multiple initial studies focused on brain atrophy in relationship with obesity, particularly in elderly cohorts [3–5]. Initially, this relationship was shown in the Cardiovascular Health Study in 94 cognitively normal participants in their late 70s who remained cognitively normal 5 years after their brain MRI scan [3]. The findings of brain atrophy in relation to higher BMI were replicated in the separate Alzheimer’s Disease Neuroimaging Cohort (ADNI) and then in a larger Cardiovascular Study Cohort [4, 5]. However, what makes our study different from that work is the focus on brain perfusion, which shows greater sensitivity and earlier changes related to brain dysfunction than atrophy [25]. Our findings may therefore provide a possible physiological explanation for how obesity can act as an epidemiological risk factor for AD [10]. Interventions that target obesity as one factor for improvement of cognitive function further support the continued need for research into this area [26]. Additional work utilizing regional cerebral blood flow has suggested additive hypoperfusion is present in persons with both obesity and heart failure, compared to either alone [27]. To the extent that obesity is related to lower blood flow the observation of underweight status and higher cerebral perfusion can be related to literature linking caloric restriction to higher cerebral blood flow [28]. Cerebral perfusion may therefore warrant further study as a biomarker of caloric restriction in related efforts to improve brain health.
Interventions to improve brain health are derived primarily from AD prevention studies. One study, called the Finnish Geriatric Intervention Study to Prevent Cognitive Impairment and Disability (FINGER), used a multi-faceted approach to control vascular risk factors, including weight management, to improve processing speed and global cognition [26]. Another randomized controlled trial in 120 midlife adults showed that aerobic physical activity improved hippocampal volume compared to a passive stretching group [29]. Models of brain health care include attention to physical activity, management of weight, and treating psychiatric disorders that raise risk for AD, such as depression [30]. Within this context, imaging cerebral perfusion may provide a biomarker to evaluate if weight loss programs at midlife improve this metric and future risk for AD.
The influence of obesity on brain perfusion remained statistically significant despite adjusting for psychiatric disorders. This result suggests that the main effects of psychiatric disorders and obesity on the brain are independent. The relationship of obesity on brain physiology may occur through several mechanisms. One is through neuroinflammation and its influence on perfusion. Obesity is a known systemic proinflammatory state [31]. Neuroinflammation is related to cerebral hypoperfusion through pathways that include TREM-2 [32], a biomarker for neuroinflammation also noted in AD [33]. Thus, chronic obesity with its associated systemic inflammation my trigger a resultant neuroinflammation and hypoperfusion. Changes in sex hormone levels with obesity may also result in changes in cerebral perfusion. Future studies can further investigate specific factors related to these mechanisms.
We have previously shown that depression and dementia have distinguishable patterns of perfusion abnormality on SPECT neuroimaging [14]. A study of brain SPECT in late onset schizophrenia showed bilateral post-central gyrus hypoperfusion; the same study showed reduced cerebral perfusion in the precentral and inferior frontal gyri [34]. Schizophrenia and alcohol dependence have also been independently linked to lower hippocampal volumes [35, 36]. Traumatic brain injury has also been related to lower cerebral perfusion [12], but in a cohort of retired National Football Players who suffered from chronic repetitive concussions BMI also independently related to lower cerebral perfusion [6].
However, obesity is a problem spanning more than just the elderly. Across all ages in the United States, the average BMI is approximately 26.5 [37] which is in the overweight category. This trend is in line with the average BMI in our sample, also in the overweight category at 25.2 and this similarity, in conjunction with our large sample size, improves the generalizability of these findings. Moreover, since close to 20% of the United States population have a psychiatric disorder [38], our large sample is likely a reasonable representation of the U.S. population. Other large cohort studies of about 10,000 or more participants, namely the U.K. biobank, have also demonstrated both brain atrophy and white matter microstructural abnormalities on brain imaging [39] spanning 45–76 years. Affected regions include regions relevant for cognitive function, such as the hippocampus. As our sample size is broader (18–94 years), the findings carry additional relevance for the general population. The inclusion of baseline, as well as concentration scans, provides additional information not available from structural scans alone. Also, we include separate categorization of morbid obesity that has not been extensively studied in prior work. The use of SPECT to evaluate cerebral perfusion has shown relevance to AD with one study linking temporal parietal hypoperfusion of 2.5–4.2% per year with dementia severity [40]. However, our study does not examine longitudinal perfusion changes, nor do we have any insight on the potential risk of pediatric obesity, although preliminary data has suggested an obesity/neuroimaging relationship [41]. Thus, studies of pediatric obesity and brain hypoperfusion will be required in future work.
Overall, we have found a strong set of relationships between being overweight and obese and brain hypoperfusion across a large adult cohort spanning young adults to late life. The persistence of these abnormalities despite adjusting for demographic and psychiatric factors further highlights the need to address obesity as a target for interventions designed to improve brain function, be they AD prevention initiatives or attempts to optimize cognition in younger populations. Such work will be crucial in improving outcomes of these groups.
DISCLOSURE STATEMENT
Authors’ disclosures available online (https://www.j-alz.com/manuscript-disclosures/20-0655r2).
SUPPLEMENTARY MATERIAL
[1] The supplementary material is available in the electronic version of this article: https://dx.doi.org/10.3233/JAD-200655.
REFERENCES
[1] | Ganguli M , Rodriguez E ((2011) ) Age, Alzheimer’s disease, and the big picture. Int Psychogeriatr 23: , 1531–1534. |
[2] | Xu WL , Atti AR , Gatz M , Pedersen NL , Johansson B , Fratiglioni L ((2011) ) Midlife overweight and obesity increase late-life dementia risk: A population-based twin study. Neurology 76: , 1568–1574. |
[3] | Raji CA , Ho AJ , Parikshak NN , Becker JT , Lopez OL , Kuller LH , Hua X , Leow AD , Toga AW , Thompson PM ((2010) ) Brain structure and obesity. Hum Brain Mapp 31: , 353–364. |
[4] | Ho AJ , Raji CA , Becker JT , Lopez OL , Kuller LH , Hua X , Lee S , Hibar D , Dinov ID , Stein JL , Jack CR Jr. , Weiner MW , Toga AW , Thompson PM , Cardiovascular Health Study; ADNI ((2010) ) Obesity is linked with lower brain volume in 700 AD and MCI patients. Neurobiol Aging 31: , 1326–1339. |
[5] | Boyle CP , Raji CA , Erickson KI , Lopez OL , Becker JT , Gach HM , Longstreth WT Jr. , Teverovskiy L , Kuller LH , Carmichael OT , Thompson PM ((2015) ) Physical activity, body mass index, and brain atrophy in Alzheimer’s disease. Neurobiol Aging 36: Suppl 1, S194–202. |
[6] | Willeumier K , Taylor DV , Amen DG ((2012) ) Elevated body mass in National Football League players linked to cognitive impairment and decreased prefrontal cortex and temporal pole activity. Transl Psychiatry 2: , e68. |
[7] | Dorrance A , Matin N , Pires P ((2014) ) The effects of obesity on the cerebral vasculature. Curr Vasc Pharmacol 12: , 462–472. |
[8] | Honea RA , Szabo-Reed AN , Lepping RJ , Perea R , Breslin F , Martin LE , Brooks WM , Donnelly JE , Savage CR ((2016) ) Voxel-based morphometry reveals brain gray matter volume changes in successful dieters: Brain volume changes in successful dieters. Obesity 24: , 1842–1848. |
[9] | Veronese N , Facchini S , Stubbs B , Luchini C , Solmi M , Manzato E , Sergi G , Maggi S , Cosco T , Fontana L ((2017) ) Weight loss is associated with improvements in cognitive function among overweight and obese people: A systematic review and meta-analysis. Neurosci Biobehav Rev 72: , 87–94. |
[10] | Barnes DE , Yaffe K ((2011) ) The projected effect of risk factor reduction on Alzheimer’s disease prevalence. Lancet Neurol 10: , 819–828. |
[11] | Hays CC , Zlatar ZZ , Wierenga CE ((2016) ) The utility of cerebral blood flow as a biomarker of preclinical Alzheimer’s disease. Cell Mol Neurobiol 36: , 167–179. |
[12] | Raji CA , Tarzwell R , Pavel D , Schneider H , Uszler M , Thornton J , van Lierop M , Cohen P , Amen DG , Henderson T ((2014) ) Clinical utility of SPECT neuroimaging in the diagnosis and treatment of traumatic brain injury: A systematic review. PLoS One 9: , e91088. |
[13] | Amen DG , Willeumier K , Omalu B , Newberg A , Raghavendra C , Raji CA ((2016) ) Perfusion neuroimaging abnormalities alone distinguish National Football League players from a healthy population. J Alzheimers Dis 53: , 237–241. |
[14] | Amen DG , Krishnamani P , Meysami S , Newberg A , Raji CA ((2017) ) Classification of depression, cognitive disorders, and co-morbid depression and cognitive disorders with perfusion SPECT neuroimaging. J Alzheimers Dis 57: , 253–266. |
[15] | Amen DG , Darmal B , Raji CA , Bao W , Jorandby L , Meysami S , Raghavendra CS ((2017) ) Discriminative properties of hippocampal hypoperfusion in marijuana users compared to healthy controls: Implications for marijuana administration in Alzheimer’s dementia. J Alzheimers Dis 56: , 261–273. |
[16] | Amen DG , Harris WS , Kidd PM , Meysami S , Raji CA ((2017) ) Quantitative erythrocyte omega-3 EPA plus DHA levels are related to higher regional cerebral blood flow on brain SPECT. J Alzheimers Dis 58: , 1189–1199. |
[17] | Amen DG , Trujillo M , Keator D , Taylor DV , Willeumier K , Meysami S , Raji CA ((2017) ) Gender-based cerebral perfusion differences in 46,034 functional neuroimaging scans. J Alzheimers Dis 60: , 605–614. |
[18] | Amen DG , Egan S , Meysami S , Raji CA , George N ((2018) ) Patterns of regional cerebral blood flow as a function of age throughout the lifespan. J Alzheimers Dis 65: , 1087–1092. |
[19] | Amen DG , Raji CA , Willeumier K , Taylor D , Tarzwell R , Newberg A , Henderson TA ((2015) ) Functional neuroimaging distinguishes posttraumatic stress disorder from traumatic brain injury in focused and large community datasets. PLoS One 10: , e0129659. |
[20] | Conners CK , Sitarenios G ((2011) ) Conners’ Continuous Performance Test (CPT), In Encyclopedia of Clinical Neuropsychology, KreutzerJS, DeLucaJ, CaplanB, eds. Springer, New York, NY, pp. 681–683. |
[21] | Tzourio-Mazoyer N , Papathanassiou D , Crivello F , Etard O , Delcroix N , Mazoyer B , Joliet M ((2002) ) Automated anatomical labeling of activations in SPM using a macroscopic anatomical parcellation of the MNI MRI single-subject brain. Neuroimage 15: , 273–289. |
[22] | Amen DG , Taylor DV , Meysami S , Raji CA ((2018) ) Deficits in regional cerebral blood flow on brain SPECT predict treatment resistant depression. J Alzheimers Dis 63: , 529–538. |
[23] | Mevel K , Chételat G , Eustache F , Desgranges B ((2011) ) The default mode network in healthy aging and Alzheimer’s disease. Int J Alzheimers Dis 2011: , 1–9. |
[24] | Toda N , Ayajiki K , Okamura T ((2014) ) Obesity-induced cerebral hypoperfusion derived from endothelial dysfunction: One of the risk factors for Alzheimer’s disease. Curr Alzheimer Res 11: , 733–744. |
[25] | de la Torre JC ((2012) ) Cardiovascular risk factors promote brain hypoperfusion leading to cognitive decline and dementia. Cardiovasc Psychiatry Neurol 2012: , 1–15. |
[26] | Ngandu T , Lehtisalo J , Solomon A , Levälahti E , Ahtiluoto S , Antikainen R , Bäckman L , Hänninen T , Jula A , Laatikainen T , Lindström J , Mangialasche F , Paajanen T , Pajala S , Peltonen M , Rauramaa R , Stigsdotter-Neely A , Strandberg T , Tuomilehto J , Soininen H , Kivipelto M ((2015) ) A 2 year multidomain intervention of diet, exercise, cognitive training, and vascular risk monitoring versus control to prevent cognitive decline in at-risk elderly people (FINGER): A randomised controlled trial. Lancet 385: , 2255–2263. |
[27] | Alosco ML , Spitznagel MB , Raz N , Cohen R , Sweet LH , Colbert LH , Josephson R , van Dulmen M , Hughes J , Rosneck J , Gunstad J ((2012) ) Obesity interacts with cerebral hypoperfusion to exacerbate cognitive impairment in older adults with heart failure. Cerebrovasc Dis Extra 2: , 88–98. |
[28] | Lin A-L , Parikh I , Hoffman JD , Ma D ((2017) ) Neuroimaging biomarkers of caloric restriction on brain metabolic and vascular functions. Curr Nutr Rep 6: , 41–48. |
[29] | Erickson KI , Voss MW , Prakash RS , Basak C , Szabo A , Chaddock L , Kim JS , Heo S , Alves H , White SM , Wojcicki TR , Mailey E , Vieira VJ , Martin SA , Pence BD , Woods JA , McAuley E , Kramer AF ((2011) ) Exercise training increases size of hippocampus and improves memory. Proc Natl Acad Sci U S A 108: , 3017–3022. |
[30] | Petersen RB , Lissemore FM , Appleby B , Aggarwal N , Boyatzis R , Casadesus G , Cummings J , Jack A , Perry G , Safar J , Sajatovic M , Surewicz WK , Wang Y , Whitehouse P , Lerner A ((2015) ) From neurodegeneration to brain health: An integrated approach. J Alzheimers Dis 46: , 271–283. |
[31] | Lee H , Lee IS , Choue R ((2013) ) Obesity, inflammation and diet. Pediatr Gastroenterol Hepatol Nutr 16: , 143. |
[32] | Zhang J , Liu Y , Zheng Y , Luo Y , Du Y , Zhao Y , Guan J , Zhang X , Fu J ((2020) ) TREM-2-p38 MAPK signaling regulates neuroinflammation during chronic cerebral hypoperfusion combined with diabetes mellitus. J Neuroinflammation 17: , 2. |
[33] | Suárez-Calvet M , Kleinberger G , Araque Caballero MÁ , Brendel M , Rominger A , Alcolea D , Fortea J , Lleó A , Blesa R , Gispert JD , Sánchez-Valle R , Antonell A , Rami L , Molinuevo JL , Brosseron F , Traschütz A , Heneka MT , Struyfs H , Engelborghs S , Sleegers K , Van Broeckhoven C , Zetterberg H , Nellgård B , Blennow K , Crispin A , Ewers M , Haass C ((2016) ) sTREM2 cerebrospinal fluid levels are a potential biomarker for microglia activity in early-stage Alzheimer’s disease and associate with neuronal injury markers. EMBO Mol Med 8: , 466–476. |
[34] | Wake R , Miyaoka T , Araki T , Kawakami K , Furuya M , Limoa E , Hashioka S , Horiguchi J ((2016) ) Regional cerebral blood flow in late-onset schizophrenia: A SPECT study using 99mTc-ECD. Eur Arch Psychiatry Clin Neurosci 266: , 3–12. |
[35] | Koolschijn PCMP , van Haren NEM , Cahn W , Schnack HG , Janssen J , Klumpers F , Hulshoff Pol HE , Kahn RS ((2010) ) Hippocampal volume change in schizophrenia. J Clin Psychiatry 71: , 737–744. |
[36] | Agartz I , Momenan R , Rawlings RR , Kerich MJ , Hommer DW ((1999) ) Hippocampal volume in patients with alcohol dependence. Arch Gen Psychiatry 56: , 356. |
[37] | Centers for Disease Control and Prevention. About Adult BMI | Healthy Weight. https://www.cdc.gov/healthyweight/assessing/bmi/adult_bmi/index.html. |
[38] | National Institutes of Mental Health. Mental Illness, https://www.nimh.nih.gov/health/statistics/mental-illness.shtml. |
[39] | Dekkers IA , Jansen PR , Lamb HJ ((2019) ) Obesity, brain volume, and white matter microstructure at MRI: A cross-sectional UK Biobank Study. Radiology 291: , 763–771. |
[40] | Ashford JW , Shih WJ , Coupal J , Shetty R , Schneider A , Cool C , Aleem A , Kiefer VH , Mendiondo MS , Schmitt FA ((2000) ) Single SPECT measures of cerebral cortical perfusion reflect time-index estimation of dementia severity in Alzheimer’s disease. J Nucl Med 41: , 57–64. |
[41] | Ou X , Andres A , Pivik RT , Cleves MA , Badger TM ((2015) ) Brain gray and white matter differences in healthy normal weight and obese children: Brain differences in obese children. J Magn Reson Imaging 42: , 1205–1213. |

