
Disentangling Clinical Profiles of Apathy in Behavioral Variant Frontotemporal Dementia
Abstract
Background:
Apathy is highly frequent in behavioral variant frontotemporal dementia (bvFTD). It is presumed to involve different pathophysiological mechanisms and neuroanatomical regions.
Objective:
We explored the hypothesis that subgroups showing distinct profiles of apathy and distinct patterns of atrophy within frontal lobes could be disentangled in bvFTD.
Methods:
Using data-driven clustering applied to 20 bvFTD patients, we isolated subgroups according to their profiles on the three subscales of the Dimensional Apathy Scale (DAS). We explored their apathy profiles and atrophy patterns. Apathy profiles were characterized through both subjective measures of apathy by questionnaires and measures including objective behavioral metrics. Atrophy patterns were obtained by voxel-based morphometry, contrasting each bvFTD subgroup with healthy controls (N = 16).
Results:
By clustering based on DAS dimensions, we disentangled three subgroups of bvFTD patients, with distinct apathy profiles and atrophy patterns. One subgroup, which presented the smallest pattern of atrophy (including orbitofrontal cortex) with a right asymmetry, was characterized by high self-reported emotional and initiation apathy and by a self-initiation deficit reversible by external guidance. In other subgroups showing more diffuse bilateral atrophies extending to lateral prefrontal cortex, apathy was not reversible by external guidance and more difficulty to focus on goal-management was observed, especially in the subgroup with the largest atrophy and highest levels of executive apathy.
Conclusion:
Distinct clinical profiles of apathy, corresponding to distinct anatomical subtypes of bvFTD, were identified. These findings have implications for clinicians in a perspective of precision medicine as they could contribute to personalize treatments of apathy.
INTRODUCTION
Apathy is the most frequent behavioral syndrome in neurological and psychiatric diseases [1–3]. Because of its prevalence, status as a prognostic indicator and functional significance of disease, apathy is a relevant target in the management of patients with neurodegenerative dementias such as Alzheimer’s disease (AD) or frontotemporal dementia [4, 5]. In particular, behavioral variant frontotemporal dementia (bvFTD) is a very good model to study apathy as the presence of apathy is one of the main and most frequent criteria enabling a clinical diagnosis of bvFTD [6, 7] and it remains almost constant throughout the disease [8]. In line with an international consensus on apathy criteria in brain disorders [9], we define apathy as a quantitative reduction of voluntary goal-directed behaviors, a definition which enables an objective description and quantification of apathy [1, 10, 11]. Until now, treatments for apathy have not been effective. One possible reason to explain the poor efficiency of current treatments may be that several different mechanisms contribute to reduce goal-directed behaviors, as suggested by their varied neuroanatomical correlates [12]. Indeed, if the mechanisms underlying apathy are as qualitatively different as some research suggests, they are likely to require different therapeutic interventions. A better understanding of the different forms of apathy would help to improve the treatment of this syndrome. The hypothesis of distinct mechanisms contributing to goal-directed behaviors is highlighted by the very latest consensus diagnostic criteria for apathy in neurocognitive disorders, which states that impairments in two of three clinical features are required for a diagnosis of apathy: 1) diminished initiative, 2) diminished interest, 3) diminished emotional expression/responsiveness [13].
The neural correlates of apathy put forward in the literature are highly suggestive of distinct underlying mechanisms. In a neurocircuitry model of apathy, Levy and colleagues [1, 10, 11] have postulated that three distinct processes, resulting from damages to three prefrontal cortex (PFC)-basal ganglia circuits, could explain most cases of apathy. First, difficulties to evaluate the affective value of a given context impacting motivation for goals (“a-motivation”) can be caused by lesions in the orbital and mesial ventral PFC-basal ganglia circuit. Second, an inability to generate or activate strategies required to successfully complete a given plan of actions (“cognitive inertia”) can be due to lesions in the lateral PFC-basal ganglia circuit. Third, an inability to transfer the affective value of a given action towards its self-initiation (“invigoration deficit”) may be due to lesions to the medial PFC/anterior cingulate cortex-basal ganglia circuit. Several empirical studies of the neural correlates of apathy subtypes are globally in line with Levy and colleagues’ model [14–16]. In particular, Massimo and colleagues [14] assessed three components of goal-directed behaviors (i.e., motivation, planning, and initiation) in bvFTD patients using the Philadelphia Apathy Computerized Test and they observed that poor motivation was related to grey matter atrophy in orbitofrontal cortex (OFC), planning impairment to atrophy in dorsolateral PFC, and poor initiation to atrophy in anterior cingulate cortex (ACC). Using the informant-rating of the Dimensional Apathy Scale (DAS) in patients with bvFTD and AD, Wei and colleagues [16] found that emotional apathy was associated with loss of grey matter integrity in the ventral PFC, executive apathy with integrity of the dorsolateral PFC and OFC, and initiation apathy with lower grey matter intensity in the medial PFC and ACC.
Because the frontal lobes are always affected but not uniformly across bvFTD patients, we hypothesized that these patients could be clinical models to disentangle different apathy profiles, characterized by different combinations of apathy mechanisms (or apathy subtypes). bvFTD population is known to be very heterogenous and because of the high phenotype diversity across patients and disease stages, it can be hard to understand the underlying mechanisms of bvFTD symptoms. Several categorizations of bvFTD patients have already been suggested, either based on their clinical phenotype or their neuroanatomical features. For instance, exploratory classifications of bvFTD patients showed that distinct anatomical subtypes could be identified according to their degree of grey matter loss within frontal and temporal lobes [17] or according to their gray matter loss in specific functional neural networks [18, 19]. Distinct behavioral phenotypes of bvFTD have also been disentangled in particular according to the severity of disinhibition and apathy symptoms [20]. However, bvFTD patients have never been stratified according to their apathy profiles. According to Massimo and colleagues [12], the decrease in goal-directed behaviors observed in the syndrome of apathy may stem from any combination of deficits in initiation, planning, and motivation. Thus, apathy subtypes are not exclusive in a patient, they interact and form a specific combination resulting in an “apathy profile”. Such a profile approach, which is no longer dimension-based, allows to consider the phenotypic diversity of apathy in a more holistic manner.
This study aimed to disentangle subgroups of bvFTD patients with distinct apathy profiles. We used the DAS scores to classify bvFTD patients into clusters of different apathy profiles. The DAS is a validated easy-to-use tool, specifically aimed at assessing apathy subtypes according to three distinct dimensions in neurodegenerative populations [21]. Clustering from these dimensions was supposed to promote the disentangling of different apathy profiles. We then aimed to characterize more precisely these distinct apathy profiles and corresponding neuroanatomical features. Thus, the final objective of this study was to provide clinicians with the ability not only to categorize a bvFTD patient simply based on their DAS assessment but also to infer a corresponding clinical sub-phenotype.
In view of the subjectivity associated with self-reporting questionnaires such as the DAS [1, 2] (especially in the case of bvFTD patients with potentially high anosognosia), our characterization of apathy profiles was complemented by more objective measures obtained using novel technologies such as movement sensors [9, 22]. Such objective behavioral metrics were computed from sensor data (video records and acceleration data) and were developed to reflect different aspects of apathetic behavior within a close-to-real-life situation. For the characterization of neuroanatomical features, we used voxel-based morphometry to explore the patterns of grey matter atrophy within clusters of bvFTD patients.
MATERIALS AND METHODS
Participants and protocol overview
In this study, we included and analyzed the data of 20 bvFTD patients and 16 HC, matched to patients for age, gender and education level. bvFTD patients were recruited in two tertiary referral centers, at the Pitié-Salpêtriére Hospital and the Lariboisière Fernand-Widal Hospital, in Paris. They were diagnosed according to the International Consensus Diagnostic Criteria [6]. Healthy controls (HC) were recruited by public announcement.
The data gathered for this article are part of the ECOCAPTURE protocol (Clinicaltrials.gov:NCT02496312; see Batrancourt et al. [23] and Supplementary Material 1A for further details on the global protocol) designed to investigate the behavioral signature and mechanisms of neuropsychiatric syndromes. For this study, we used data allowing to: 1) disentangle subgroups of bvFTD showing distinct profiles of apathy and 2) characterize the clinical phenotypes of identified subgroups.
Subjective measures of apathy by questionnaires
To disentangle subgroups of bvFTD, we used the DAS [21], which consists of three subscales respectively measuring the Emotional (8 items; e.g., “I become emotional easily when watching something happy or sad on TV”), Initiation (8 items; e.g., “I set goals for myself”), and Executive (8 items; e.g., “I find it difficult to keep my mind on things”) subtypes of apathy derived from the theoretical model proposed by Levy and Dubois [1]. We also used the Starkstein Apathy Scale (SAS) [24] (a shortened version of the first scale developed by Marin et al. [25]) (14 items; e.g., “Do you have motivation?”), which assesses apathy as a unidimensional construct, for a first description of apathy levels in identified subgroups of bvFTD.
Other neuropsychological measures
We also used complementary measures of global mental efficiency and cognitive functions for a basic characterization of the clinical profiles of identified subgroups of bvFTD: the Mini-Mental State Evaluation (MMSE) [26] and the Mattis Dementia Rating Scale (DRS) [27, 28], the Frontal Assessment Battery (FAB) [29], and the Hayling error score of the Hayling Sentence Completion Test (HSCT) [30] assessing inhibitory control deficit [31]. The HSCT task, developed by Burgess and Shallice (1997), was designed to be sensitive to symptoms of executive disturbance.
Measures of apathy profiles including objective behavioral metrics
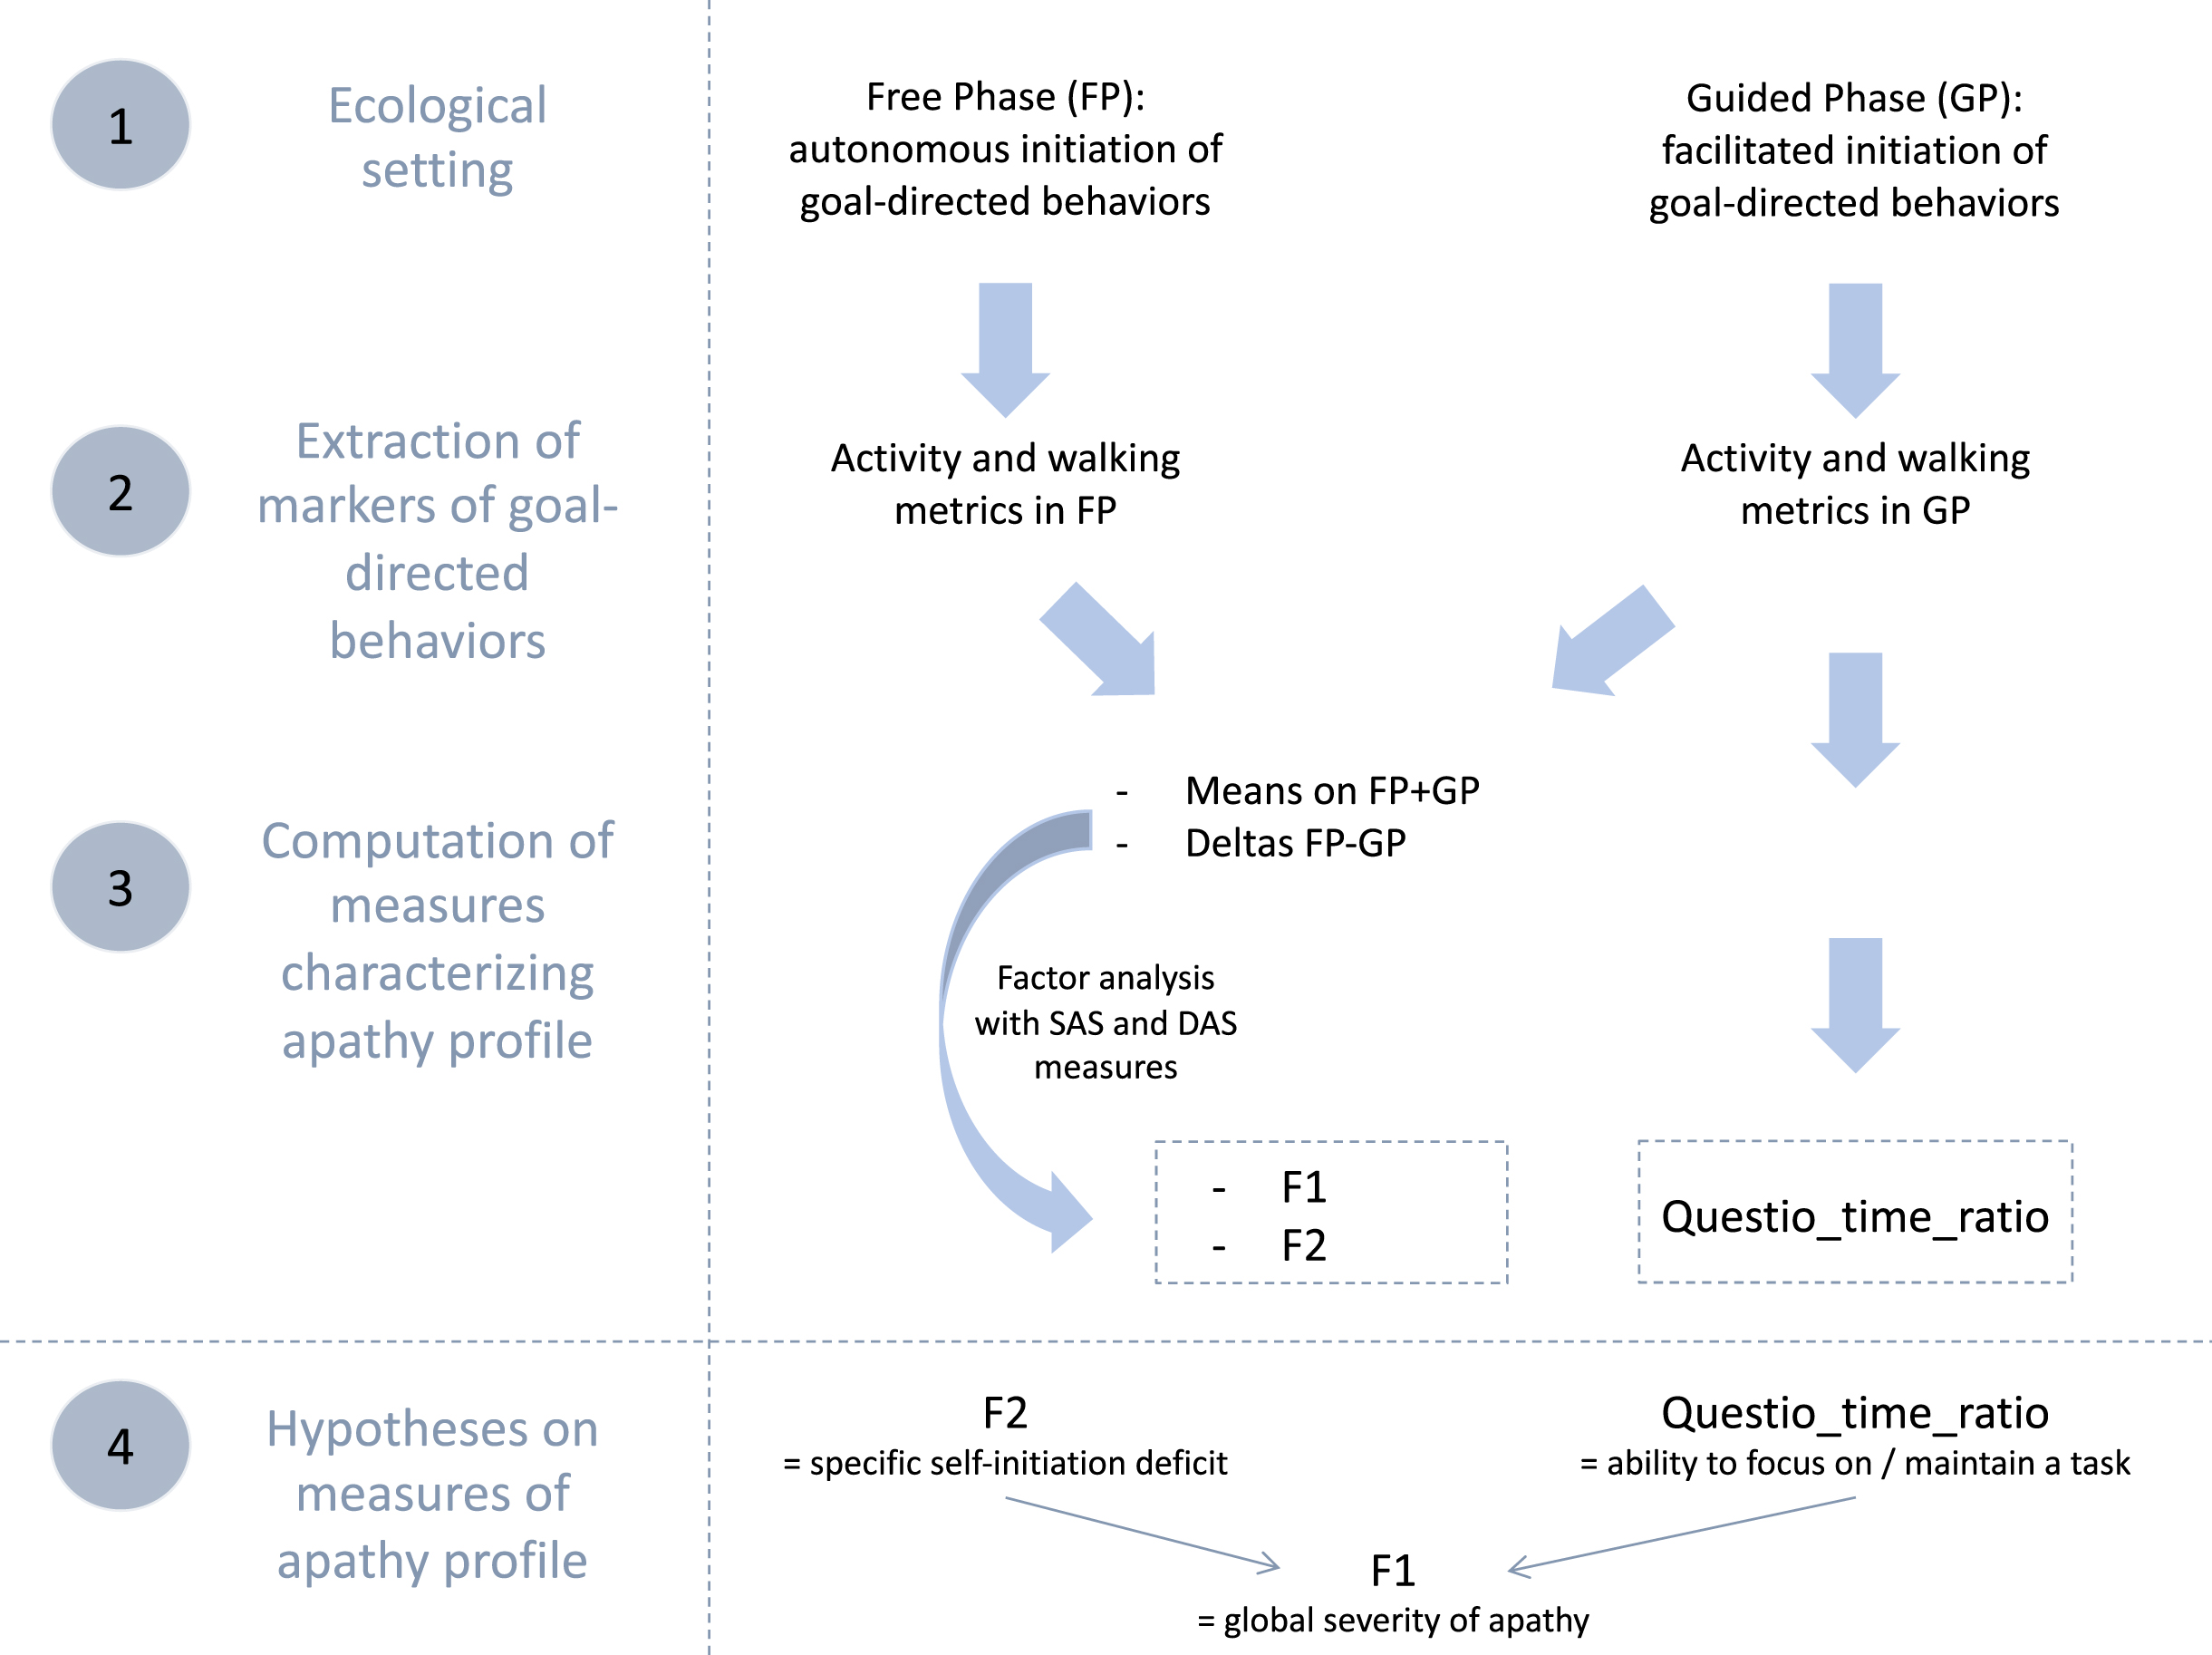
To accurately characterize the apathy profiles of identified subgroups of bvFTD, we used complementary objective behavioral data collected within an ecological context (ECOCAPTURE). We selected: 1) two “composite” dimensions (mixing objective and subjective measures) from a previous study by Godefroy et al. [32] and 2) a complementary objective behavioral metric. Figure 1 summarizes all these measures used to describe apathy profiles, how they were obtained and what they were supposed to represent.
Fig. 1
Summary of data flow to manage measures of apathy profile and hypotheses on their conceptual validity. SAS, Starkstein Apathy Scale; DAS, Dimensional Apathy Scale; F1 and F2 are the two factors extracted by factor analysis; Questio_time_ratio: ratio of time spent exclusively for goal-directed actions related to the completing of a questionnaire in the guided phase.
Description of the ECOCAPTURE ecological setting
We extracted some behavioral metrics from the recorded behavior of participants within the ECOCAPTURE ecological setting, which reproduced a close-to-real life situation (i.e., being left alone in a “waiting room”) with a predetermined script (see Supplementary Material 1B for further details on the ECOCAPTURE scenario). In this setting, participants were firstly left in a freely moving phase called “free phase” (FP - 7 minutes) in which actions were totally self-initiated. This phase was followed by other phases including a “guided phase” (GP - 10 minutes) in which the initiation of actions was facilitated by hetero-guidance. In the guided phase, participants were asked by the experimenter to fill out a questionnaire, with very easy questions, but requiring in-depth exploration of the room. During the whole scenario, participants’ behavior was video-recorded and their body acceleration was measured using a body sensor (Move II®, Movisens, Karlsruhe, Germany) worn on the hip. Participants’ behaviors were coded from recorded videos and coded behaviors were matched with the corresponding acceleration signal (see Supplementary Material 1C for further details on coding of behavior). In the specific ecological situation of ECOCAPTURE, we assumed that a reduction of goal-directed behaviors would present as a combination of a decreased time spent in goal-directed actions and a tendency to wander in the room (with frequent, long-lasting walking episodes of low acceleration) without being able to focus on any specific activity.
Two dimensions mixing objective and subjective measures
First, we used the total activity time ratio and walking episode features (occurrences, acceleration, and duration) extracted in both the free and guided phases. These objective behavioral metrics were shown to be different in bvFTD (characterized by high apathy) and controls and to correlate with apathy assessed by SAS. Thus they were assumed to be markers of goal-directed behaviors contributing to the assessment of apathy (defined as a quantitative reduction of goal-directed behaviors) [32] (see Godefroy et al. [32] and Supplementary Material 2A for further details on the extraction and validity tests of these metrics).
Second, for each marker of goal-directed behaviors, we calculated: 1) the mean on the two phases ((FP+GP)/2) as a potential indicator of the global reduction of goal-directed behaviors and 2) the difference between the two phases (FP-GP) as a potential indicator of the specific deficit of self-initiation. Indeed, the more participants are characterized by a specific deficit of self-initiation underlying apathy, the more their markers of goal-directed behaviors should improve in the guided phase (i.e., with external guidance) compared to free phase (i.e., without external guidance).
Third, we applied an exploratory factor analysis to: 1) the calculated means/differences of objective quantifiers of goal-directed behaviors (extracted from the ECOCAPTURE setting) and 2) the subjective measures of apathy by questionnaires (SAS and three DAS dimensions). This strategy allowed to draw on the complementarity of the two types of measures: objective measures avoided subjective bias while subjective measures (by previously validated questionnaires) conveyed conceptual validity to the dimensions of apathy extracted by factor analysis. Besides, by combining both types of measures (thus gathering different sources of information), the extracted dimensions constitute a more thorough and precise quantification of apathy. The two extracted dimensions were: 1) F1, a pattern of behavior represented by low mean quantifiers of goal-directed behaviors (combined with high unidimensional apathy measured by SAS and high DAS-Executive) and 2) F2, a pattern of behavior related to high differences of quantifiers of goal-directed behaviors between free and guided phase (combined with high DAS-Initiation and high DAS-Emotional). F1 characterized the global reduction of goal-directed behaviors while F2 represented the specific deficit of self-initiation reversible by hetero-guidance, a central mechanism contributing to the reduction of goal-directed behaviors (see Godefroy et al. [32] and Supplementary Material 2B for the results of the exploratory factor analysis leading to the extraction of F1 and F2).
A complementary objective behavioral metric
In this study, we also used one additional objective behavioral metric which was specific to the guided phase: the questionnaire-related time ratio (Questio_time_ratio), defined as the ratio of time spent exclusively for goal-directed actions related to the completing of the questionnaire in the guided phase (this ratio did not take into account the time spent in goal-directed actions that were not related to the questionnaire like preparing a drink). Since it depended on the ability to stay focused on the proposed questionnaire activity, we assumed that this behavioral metric could be used as an approximation of the ability to focus on goal management and maintain a goal-directed activity. Thus, this metric could represent a second mechanism, complementary to the specific self-initiation deficit (assessed by F2), impacting the global reduction of goal-directed behaviors (assessed by F1).
Neuroimaging data preprocessed for voxel-based morphometry analysis
We used structural MRI data to elucidate the atrophy patterns of identified bvFTD subgroups. MRI data acquisitions were performed at CENIR (Human MRI Neuroimaging core facility, ICM, Salpêtrière hospital, Paris, France) using a 3T Siemens MRI scanner 64-channel TIM system. The brain MRI protocol includes a 3D T1 scan allowing the study of structural abnormalities. Structural data were analyzed with FSL-VBM [33] (http://fsl.fmrib.ox.ac.uk/fsl/fslwiki/FSLVBM), an optimized VBM protocol [34] carried out using FSL tools [35]. First, structural images were brain-extracted and grey matter (GM)-segmented before being registered to the MNI 152 standard space using non-linear registration [36]. The resulting images were averaged and flipped along the x-axis to create a left-right symmetric, study-specific GM template. All native GM images were then non-linearly registered to this study-specific template and “modulated” to correct for local expansion (or contraction) due to the non-linear component of the spatial transformation. The modulated GM images were then smoothed with an isotropic Gaussian kernel with a sigma of 3 mm.
Statistical analyses
All statistical analyses on demographic, behavioral and neuropsychological data were performed using RStudio (version 1.2.5033). Statistical analyses on neuroimaging data were performed using FSL tools [35].
Data-driven clustering based on DAS dimensions
We selected the total scores on the three dimensions of the DAS as a basis for the data-driven clustering to optimize the chances to separate distinct profiles of apathy (and not only distinct severities of apathy). The clustering allowed to form clusters of bvFTD patients showing within-cluster similarities and between-cluster differences. More precisely, we used a k-means clustering approach, a method of unsupervised clustering based on an algorithm which minimizes intra-cluster inertia and maximizes inter-cluster inertia at each iteration to find the best clustering solution. We determined the number of clusters (k = 3) using the average silhouette method [37].
Isolated bvFTD subgroups were firstly characterized on a few basic measures. Using one-way ANOVA tests followed by multiple comparisons of means with Tukey contrasts, we compared the identified bvFTD subgroups on: 1) their demographic and neurocognitive characteristics and 2) the subjective measures of apathy by questionnaires (SAS and DAS). For all ANOVA analyses, the normality and homogeneity of residuals were verified (using Shapiro’s and Levene’s tests).
Characterization of apathy profiles
The precise characterization of clinical phenotypes of identified bvFTD subgroups started with the elucidation of their apathy profiles using the measures including objective behavioral metrics (composite dimensions F1 and F2, questionnaire-related time ratio), supposed to be more thorough and precise than the purely subjective measures by questionnaires.
First, we performed analyses investigating the validity of these measures used to characterize apathy profiles. Analyses supporting the validity of measures by F1 and F2, as measures of global apathy and self-initiation deficit respectively, were performed in a previous study [32] (further details on the analyses performed are in Supplementary Material 2C). In this study, to investigate the validity of questionnaire-related time ratio (Questio_time_ratio) as a complementary measure of the ability to maintain focus on a goal-directed activity, we performed: 1) a comparison between bvFTD and controls on Questio_time_ratio; 2) correlation tests with a measure of inhibitory control deficit by Hayling error score and a measure of the executive form of apathy by the DAS-Executive; and 3) a multiple regression analysis testing the ability of Questio_time_ratio, along with F2, to predict F1.
After these validity analyses, we used one-way ANOVA tests followed by multiple comparisons of means with Tukey contrasts to compare the identified bvFTD subgroups on F1, F2 and Questio_time_ratio. For all ANOVA analyses, the normality and homogeneity of residuals were verified (using Shapiro’s and Levene’s tests).
Characterization of atrophy patterns
The second step of the characterization of clinical phenotypes of isolated bvFTD subgroups was the exploration of their atrophy patterns. The whole bvFTD group was contrasted with the HC group and each identified bvFTD subgroup was contrasted with HC controlling for age and sex (to determine each subgroup’s atrophy pattern). We also tested contrasts between identified bvFTD subgroups controlling for age and sex.
Voxelwise GLM with Threshold-Free Cluster Enhancement (TFCE) was applied using permutation-based non-parametric testing, either correcting for multiple comparisons across space (controlling the family-wise error rate at a threshold of p < 0.05) or without correcting for multiple comparisons (at a threshold of p < 0.01, only for comparisons between bvFTD subgroups). TFCE method estimates a voxel value that represents the accumulative cluster-like local spatial support at a range of cluster-forming thresholds. TFCE has a variety of advantages that make it an elegant solution to correct for multiple comparisons in structural analyses. First, it does not need an arbitrary cluster-forming threshold, making it more objective. Second, it combines statistics based on the local significance as well as the spatial extent of this effect [38].
Ethical statement
This study is part of clinical trial C16-87 sponsored by INSERM, the French national institute for biomedical research. It was granted approval by the local Ethics Committee (“Comité de Protection des Personnes”) on 05/17/2017 and registered in a public registry (clinicaltrials.gov: NCT03272230). All study participants gave their written informed consent to participate, according to the Declaration of Helsinki and in line with French ethical guidelines.
Data availability
The data that support the findings of this study are available from the corresponding author, upon reasonable request.
RESULTS
Characteristics of participants
The demographic and neuropsychological characteristics of bvFTD patients and HC are described in Table 1. We found no significant difference between bvFTD and HC for age, sex, and education level. BvFTD patients presented significantly lower MMSE, DRS, and FAB scores as compared to HC (p < 0.001). Fifteen out of 20 bvFTD patients (75%) were above the Starkstein Apathy Scale pathological cut-off (i.e., SAS ≥14), while none of the HC were. As expected, SAS score (p < 0.001) was significantly higher in bvFTD than in HC.
Table 1
Demographical, neurocognitive, and apathy characteristics of participants1
| bvFTD | HC | FTD versus HC | bvFTD-G1 | bvFTD-G2 | bvFTD-G3 | Subgroup effect | |
| % Women | 35% | 62.5% | p = 0.19a | 25% | 20% | 57.1% | p = 0.31a |
| Age | 65.8 (8.8) | 62.9 (7.6) | p = 0.29b | 63.8 (9.0) | 62.6 (9.9) | 70.4 (6.8) | p = 0.23d |
| Years since 1st symptoms | 4.4 (2.3) | – | – | 4.7 (3.1) | 5.3 (2.1) | 3.5 (1.0) | p = 0.48d |
| Education level | 6.4 (2.0) | 7.3 (1.1) | p = 0.34c | 6.2 (2.6) | 5.8 (2.3) | 7.0 (1.3) | p = 0.63d |
| MMSE (/30) | 24.1 (2.8) | 29.4 (0.8) | p < 0.001c | 25.0 (2.4) | 23.8 (2.3) | 23.1 (3.5) | p = 0.45d |
| DRS (/144) | 119.5 (9.3) | 142.3 (1.3) | p < 0.001c | 123.4 (9.0) | 121.4 (11.9) | 113.7 (4.7) | p = 0.11d |
| FAB (/18) | 12.5 (3.4) | 17.3 (0.9) | p < 0.001c | 14.5 (1.2) | 13.4 (1.1) | 9.4 (4.2) | p < 0.01d |
| G3 < G1, G3 < G2 | |||||||
| Hayling - error score | 19.5 (14.4) | 2.7 (2.3) | p < 0.001c | 7.0(5.4) | 12.8 (4.1) | 27.0 (11.8) | p < 0.01d |
| G3 > G1, G3 > G2 | |||||||
| SAS (/42) | 15.4 (4.8) | 6.3 (2.8) | p < 0.001b | 18.0 (5.5) | 12.0 (4.3) | 14.7 (2.4) | p = 0.07d |
| DAS (/72) | 30.4 (10.5) | 19.6 (8.6) | p < 0.01b | 39.5 (6.5) | 16.4 (3.5) | 30.0 (4.0) | p < 0.001d |
| G1 > G3 > G2 |
1Data are given as Mean (SD); bvFTD: N = 20 / HC: N = 16; bvFTD-G1: N = 8 / bvFTD-G2: N = 5 / bvFTD-G3: N = 7; aChi-square test; bStudent t-test; cWilcoxon test; dANOVA test followed by post-hoc Tuckey contrasts (significant contrasts at p < 0.05 at least are indicated); bvFTD, behavioral variant of frontotemporal dementia; MMSE, Mini-Mental State Examination; DRS, Dementia Rating Scale; FAB, Frontal Assessment Battery; SAS, Starkstein Apathy Scale; DAS, Dimensional Apathy Scale.
Data-driven clustering based on DAS dimensions
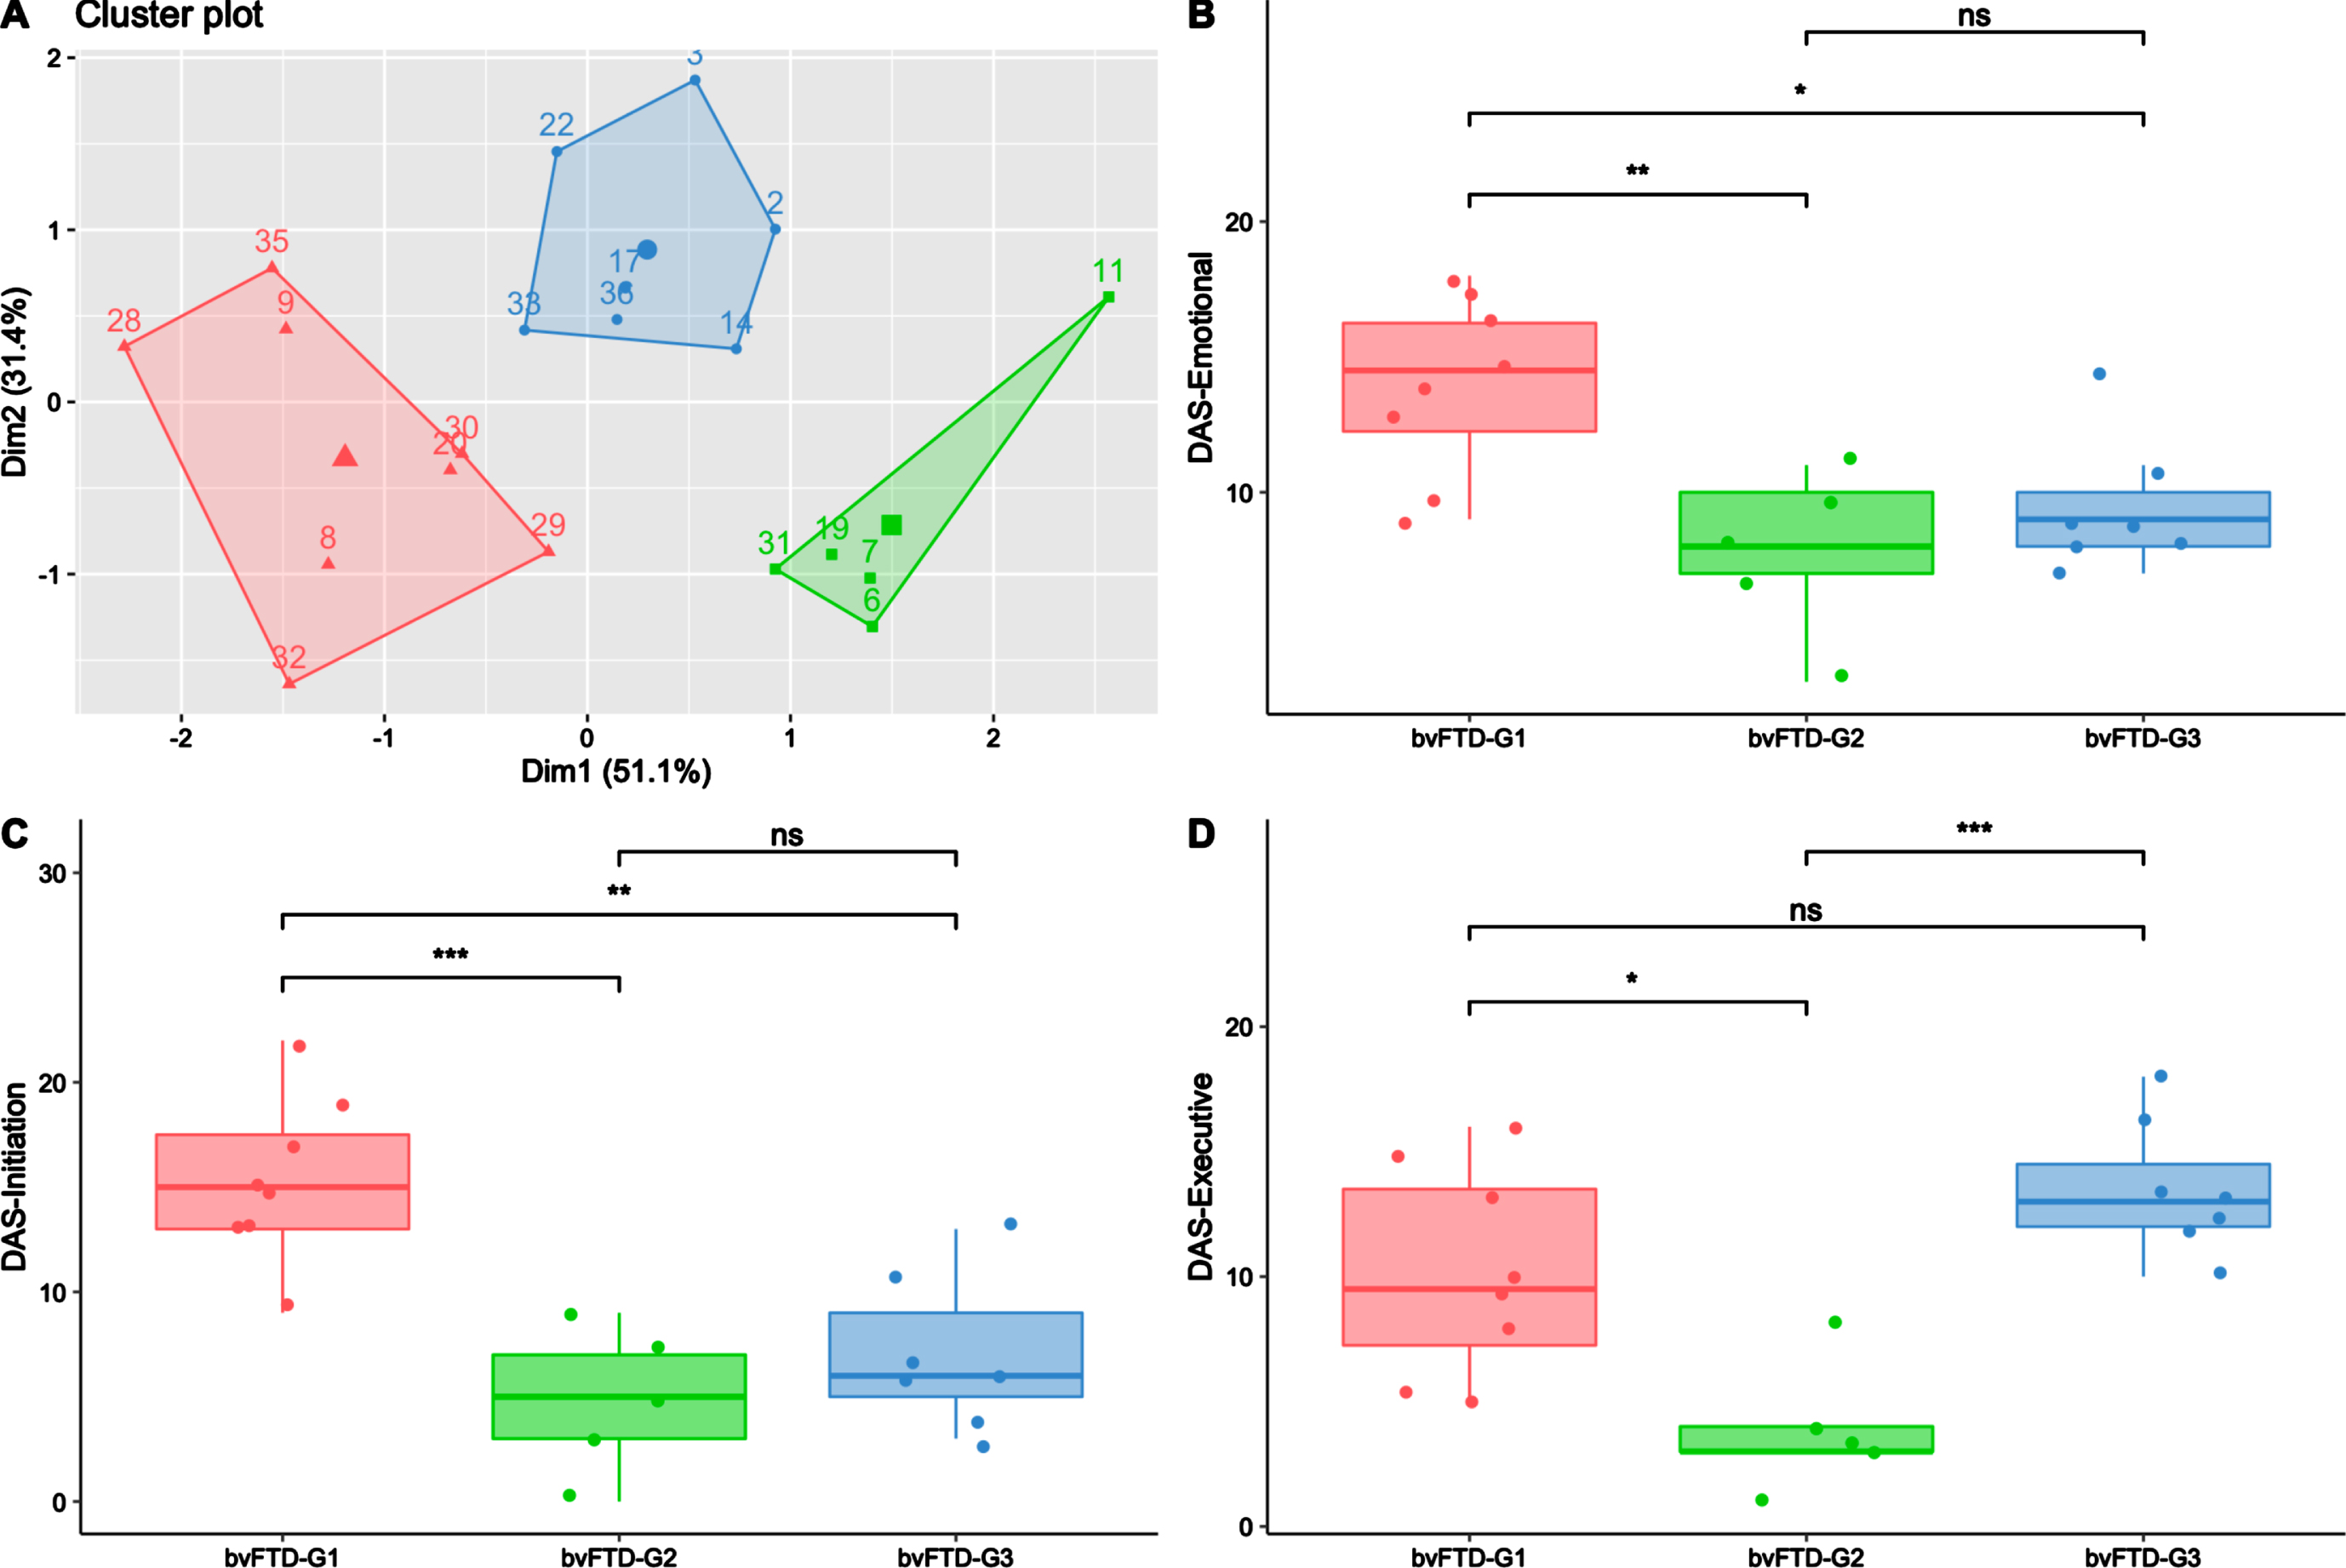
The data-driven clustering approach based on DAS subscales enabled the identification of three subgroups among bvFTD patients: bvFTD-G1 (N = 8), bvFTD-G2 (N = 5), and bvFTD-G3 (N = 7). Figure 2A shows a projection of the three identified clusters and their centroids in a two-dimension scatter plot. The two dimensions result from dimension reduction (by principal component analysis): dimension 1 (Dim1) increases with lower DAS-Emotional and DAS-Initiation while dimension 2 (Dim2) increases with higher DAS-Executive.
Fig. 2
Three bvFTD subgroups and their profiles of apathy on DAS subscales. BvFTD-G1 in red (N = 8), bvFTD-G2 in green (N = 5), bvFTD-G3 in blue (N = 7). A) Results of the k-means clustering analysis (based on DAS subscales) defining three subgroups of bvFTD patients (each point with a number represents a bvFTD patient); B) Diminished integration, processing and expression of emotions (assessed by DAS-Emotional) in the three bvFTD subgroups; C) Lessened initiation of thoughts and actions (assessed by DAS-Initiation) in the three bvFTD subgroups; D) Inability to manage goals and cognitively strategize to execute a plan of actions (assessed by DAS-Executive) in the three bvFTD subgroups. Levels of significance (adjusted p-values): ns, non-significant; *p < 0.05; **p < 0.01; ***p < 0.001.
Characterization of bvFTD subgroups on demographic and neurocognitive measures
As described in Table 1, there was no significant difference in terms of age, gender, education level and disease duration between patients of the three subgroups. Regarding the global cognitive abilities assessed by MMSE and DRS, there was no significant difference between subgroups either. However, bvFTD-G3’s total score on the FAB was significantly lower than those in bvFTD-G1 (p < 0.01) and bvFTD-G2 (p = 0.05), suggesting a higher frontal lobe syndrome in G3 than in the two other subgroups. Moreover, the Hayling error score was significantly higher in bvFTD-G3 compared to both bvFTD-G1 (p < 0.01) and bvFTD-G2 (p < 0.05), suggesting poorer inhibitory control in bvFTD-G3. Further details on individual demographic and neurocognitive characteristics of patients in the three subgroups are provided in Supplementary Material 3.
Characterization of bvFTD subgroups on SAS and DAS
As described in Table 1, compared to other subgroups, bvFTD-G1 was characterized by the highest SAS score and was significantly higher on total DAS compared to both bvFTD-G2 (p < 0.001) and G3 (p < 0.01). On the opposite, bvFTD-G2 was characterized by the lowest SAS score and was significantly lower on total DAS compared to both bvFTD-G1 (p < 0.001) and G3 (p < 0.001). The characterization of the three subgroups in terms of apathy subtypes assessed by the DAS are detailed in Fig. 2B–D. bvFTD-G1 presented the highest mean scores on DAS-Emotional and DAS-Initiation and was significantly higher on these scores compared to both bvFTD-G2 and G3. The highest mean score on DAS-Executive was observed in bvFTD-G3 and both bvFTD-G3 and bvFTD-G1 showed higher DAS-Executive compared to bvFTD-G2. BvFTD-G2 was characterized by the lowest mean score on the three DAS subscales. Further details on individual scores on SAS and DAS subscales of patients in the three subgroups are provided in Supplementary Material 3.
Characterization of apathy profiles
Validity of measures used to characterize apathy profiles
Results of a previous study [32] provided arguments supporting the validity of F1 and F2 as dimensions measuring global apathy and specific self-initiation deficit respectively (see Supplementary Material 2C for the summary of these results). In sum, F1 was found to: 1) distinguish bvFTD from controls; 2) correlate with frontal lobe syndrome (assessed by the FAB); and 3) correlate with the resting-state functional connectivity of hub regions of the salience network (i.e., a network assumed to explain the severity of the main neuropsychiatric symptoms of bvFTD [39]). F2 was shown to: 1) distinguish bvFTD from controls and 2) correlate with the resting-state functional connectivity of the lateral parietal cortex (a brain area assumed to be highly involved in impaired internal initiation of behavior across diseases [40]).
In this study, we investigated the Questio_time_ratio behavioral metric (i.e., the time spent on questionnaire-related activity in guided phase) as an indicator of the ability to focus on goal management, at least among bvFTD patients. We did not find any significant difference between bvFTD patients and HC on Questio_time_ratio, which was probably due to the combination in HC of higher focusing on the questionnaire activity (which increases Questio_time_ratio) but also higher efficiency to complete the questionnaire (which decreases Questio_time_ratio), as compared to bvFTD. Thus, Questio_time_ratio can be a marker of the ability to focus on goal management only among subjects with comparable global cognitive abilities.
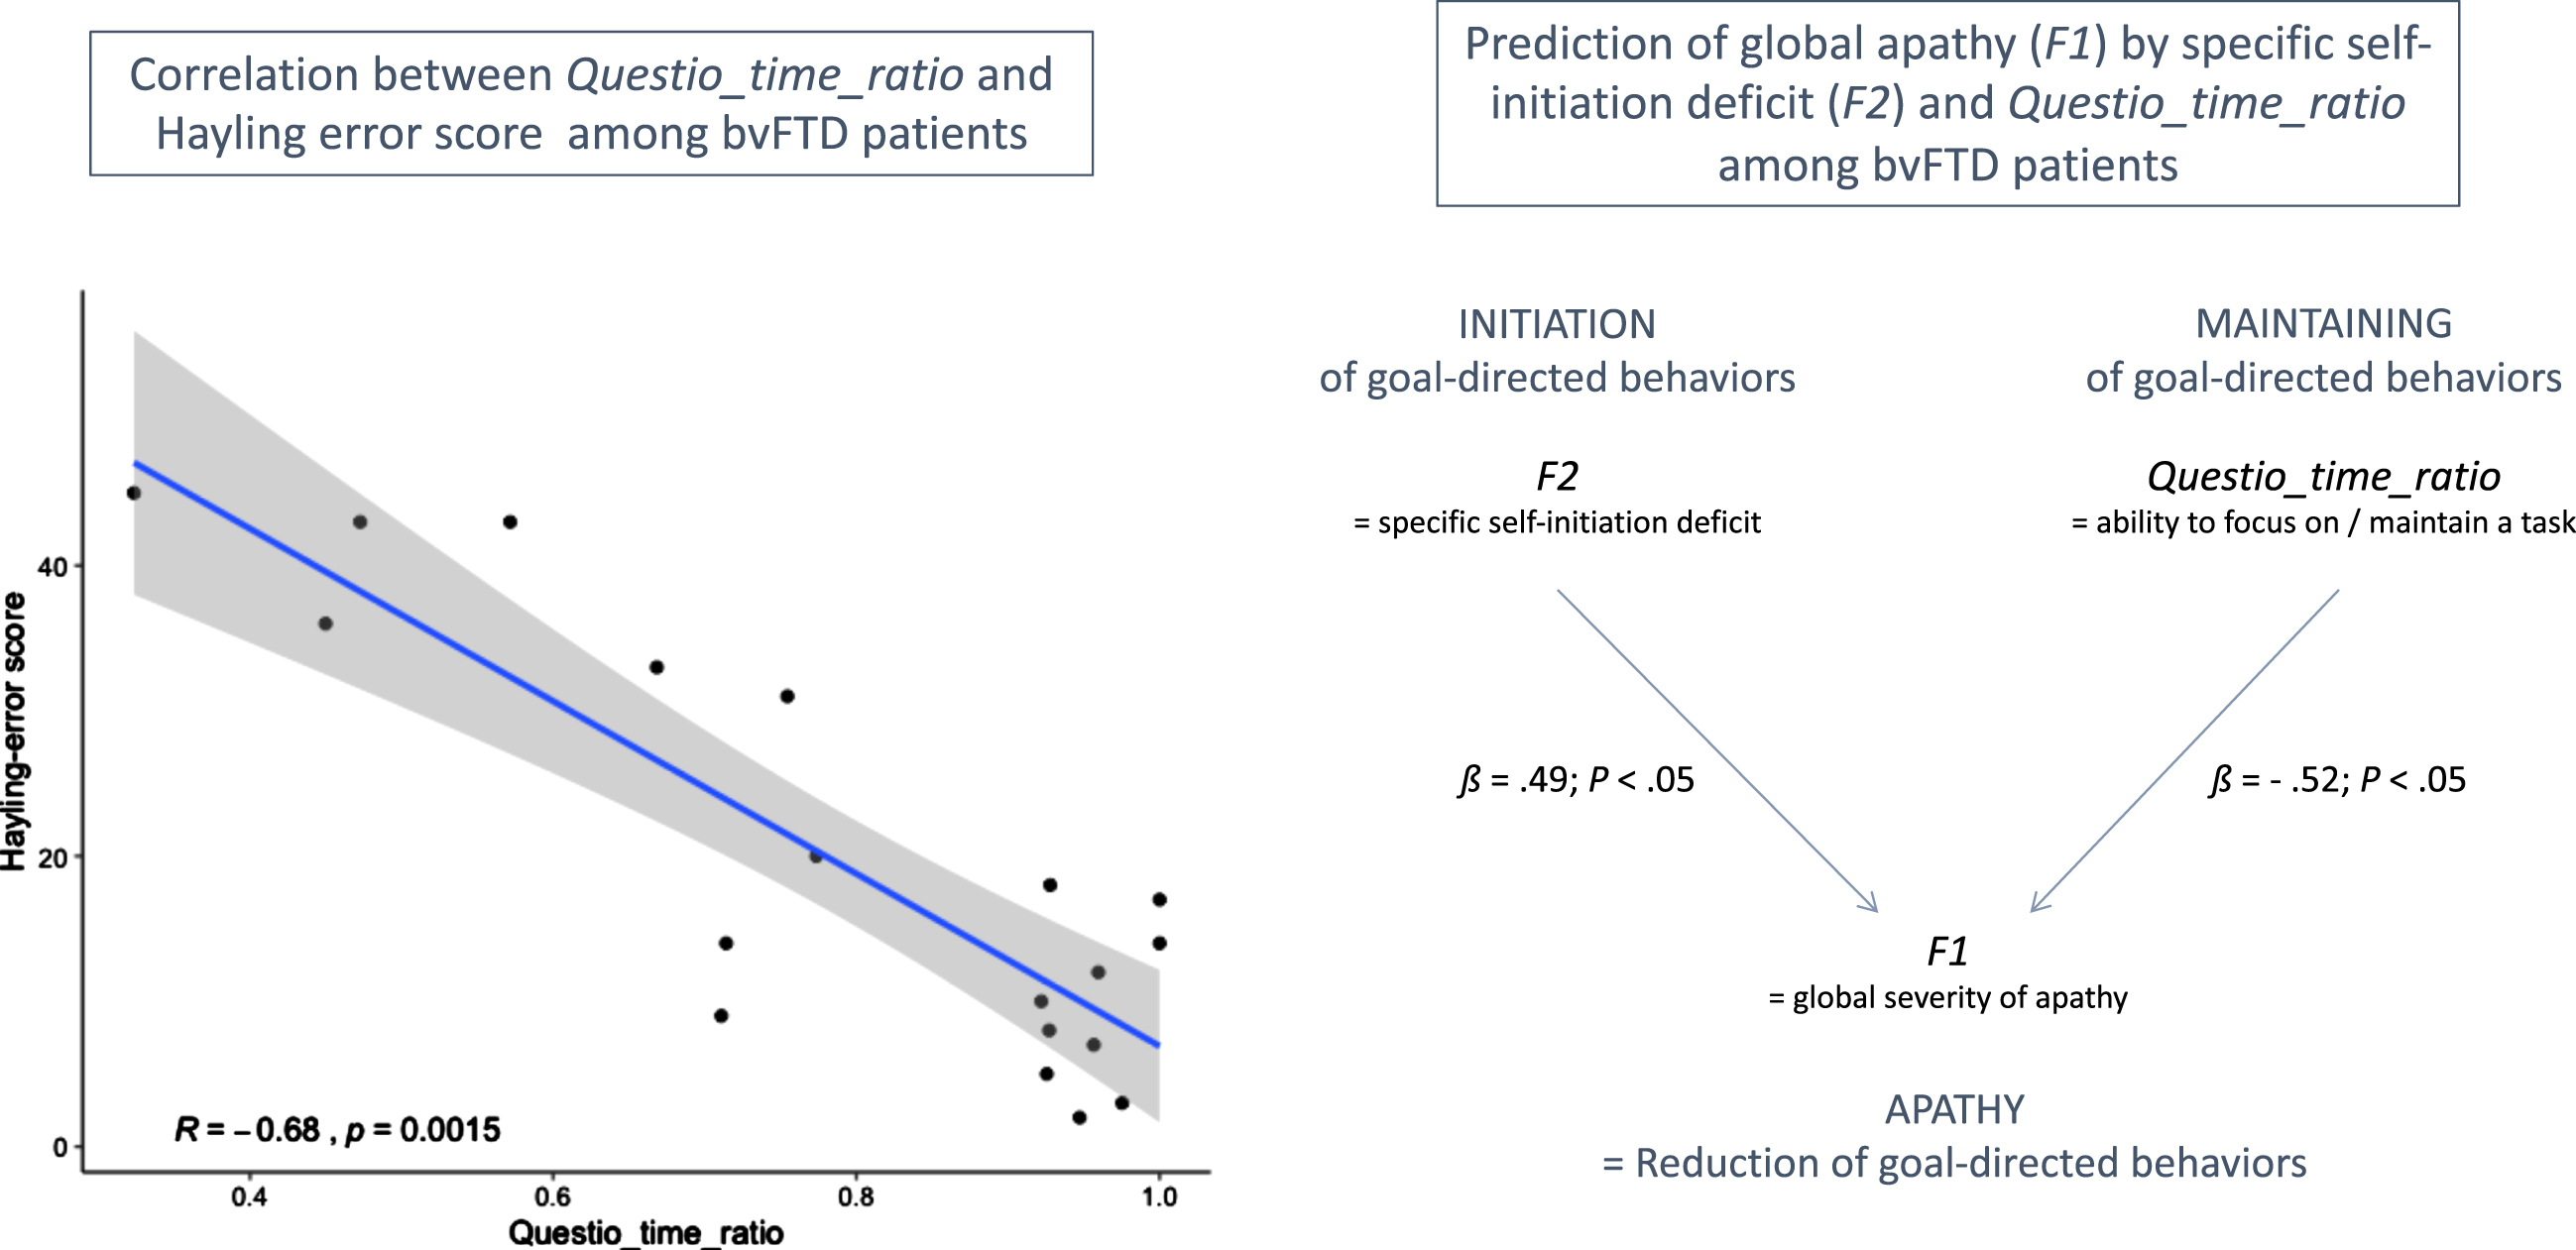
Figure 3 shows the main results of the correlation tests and regression analysis (within bvFTD patients) supporting the validity of Questio_time_ratio as an indicator of ability to maintain focus on goal management. Within bvFTD patients, Questio_time_ratio was negatively related to the executive form of apathy (assessed by DAS-Executive) but this link was not significant (Spearman’s ρ= –0.33; p = 0.16). At least two reasons can explain this non-significant correlation: 1) inspection of the item content of the DAS-Executive subscale (including for instance: “I need a bit of encouragement to get things started”) suggests that this measure does not target exclusively the ability to maintain focus on goal management; 2) DAS-Executive is a subjective measure while Questio_time_ratio is an objective measure. Besides, Questio_time_ratio was strongly and negatively correlated with the objective Hayling error score (Spearman’s ρ= –0.68; p = 0.002). This confirmed that higher Questio_time_ratio was related to lower deficits of inhibition and lower executive disturbance symptoms in bvFTD. Thus, Questio_time_ratio could be a marker of the ability to inhibit distractors to maintain focus on a task among bvFTD patients. Finally, using regression analysis within bvFTD patients, we showed that F2 and Questio_time_ratio were both independent predictors of F1. Together, they explained 38% of the variance of F1. Thus, Questio_time_ratio contributed to predict global apathy (assessed by F1) above and beyond the specific deficit of self-initiation (assessed by F2), which further supported that this metric could be a marker of a second independent mechanism potentially contributing to the global reduction of goal-directed behaviors.
Fig. 3
Results supporting the validity of Questio_time_ratio as an indicator of ability to maintain focus on goal management in bvFTD patients. On the left: R indicates the Spearman’s rank correlation coefficient between Hayling error score and Questio_time_ratio. On the right: ß values are the standardized coefficients of the multiple linear regression analysis (with their associated p-values).
Characterization of bvFTD subgroups on measures of apathy profile
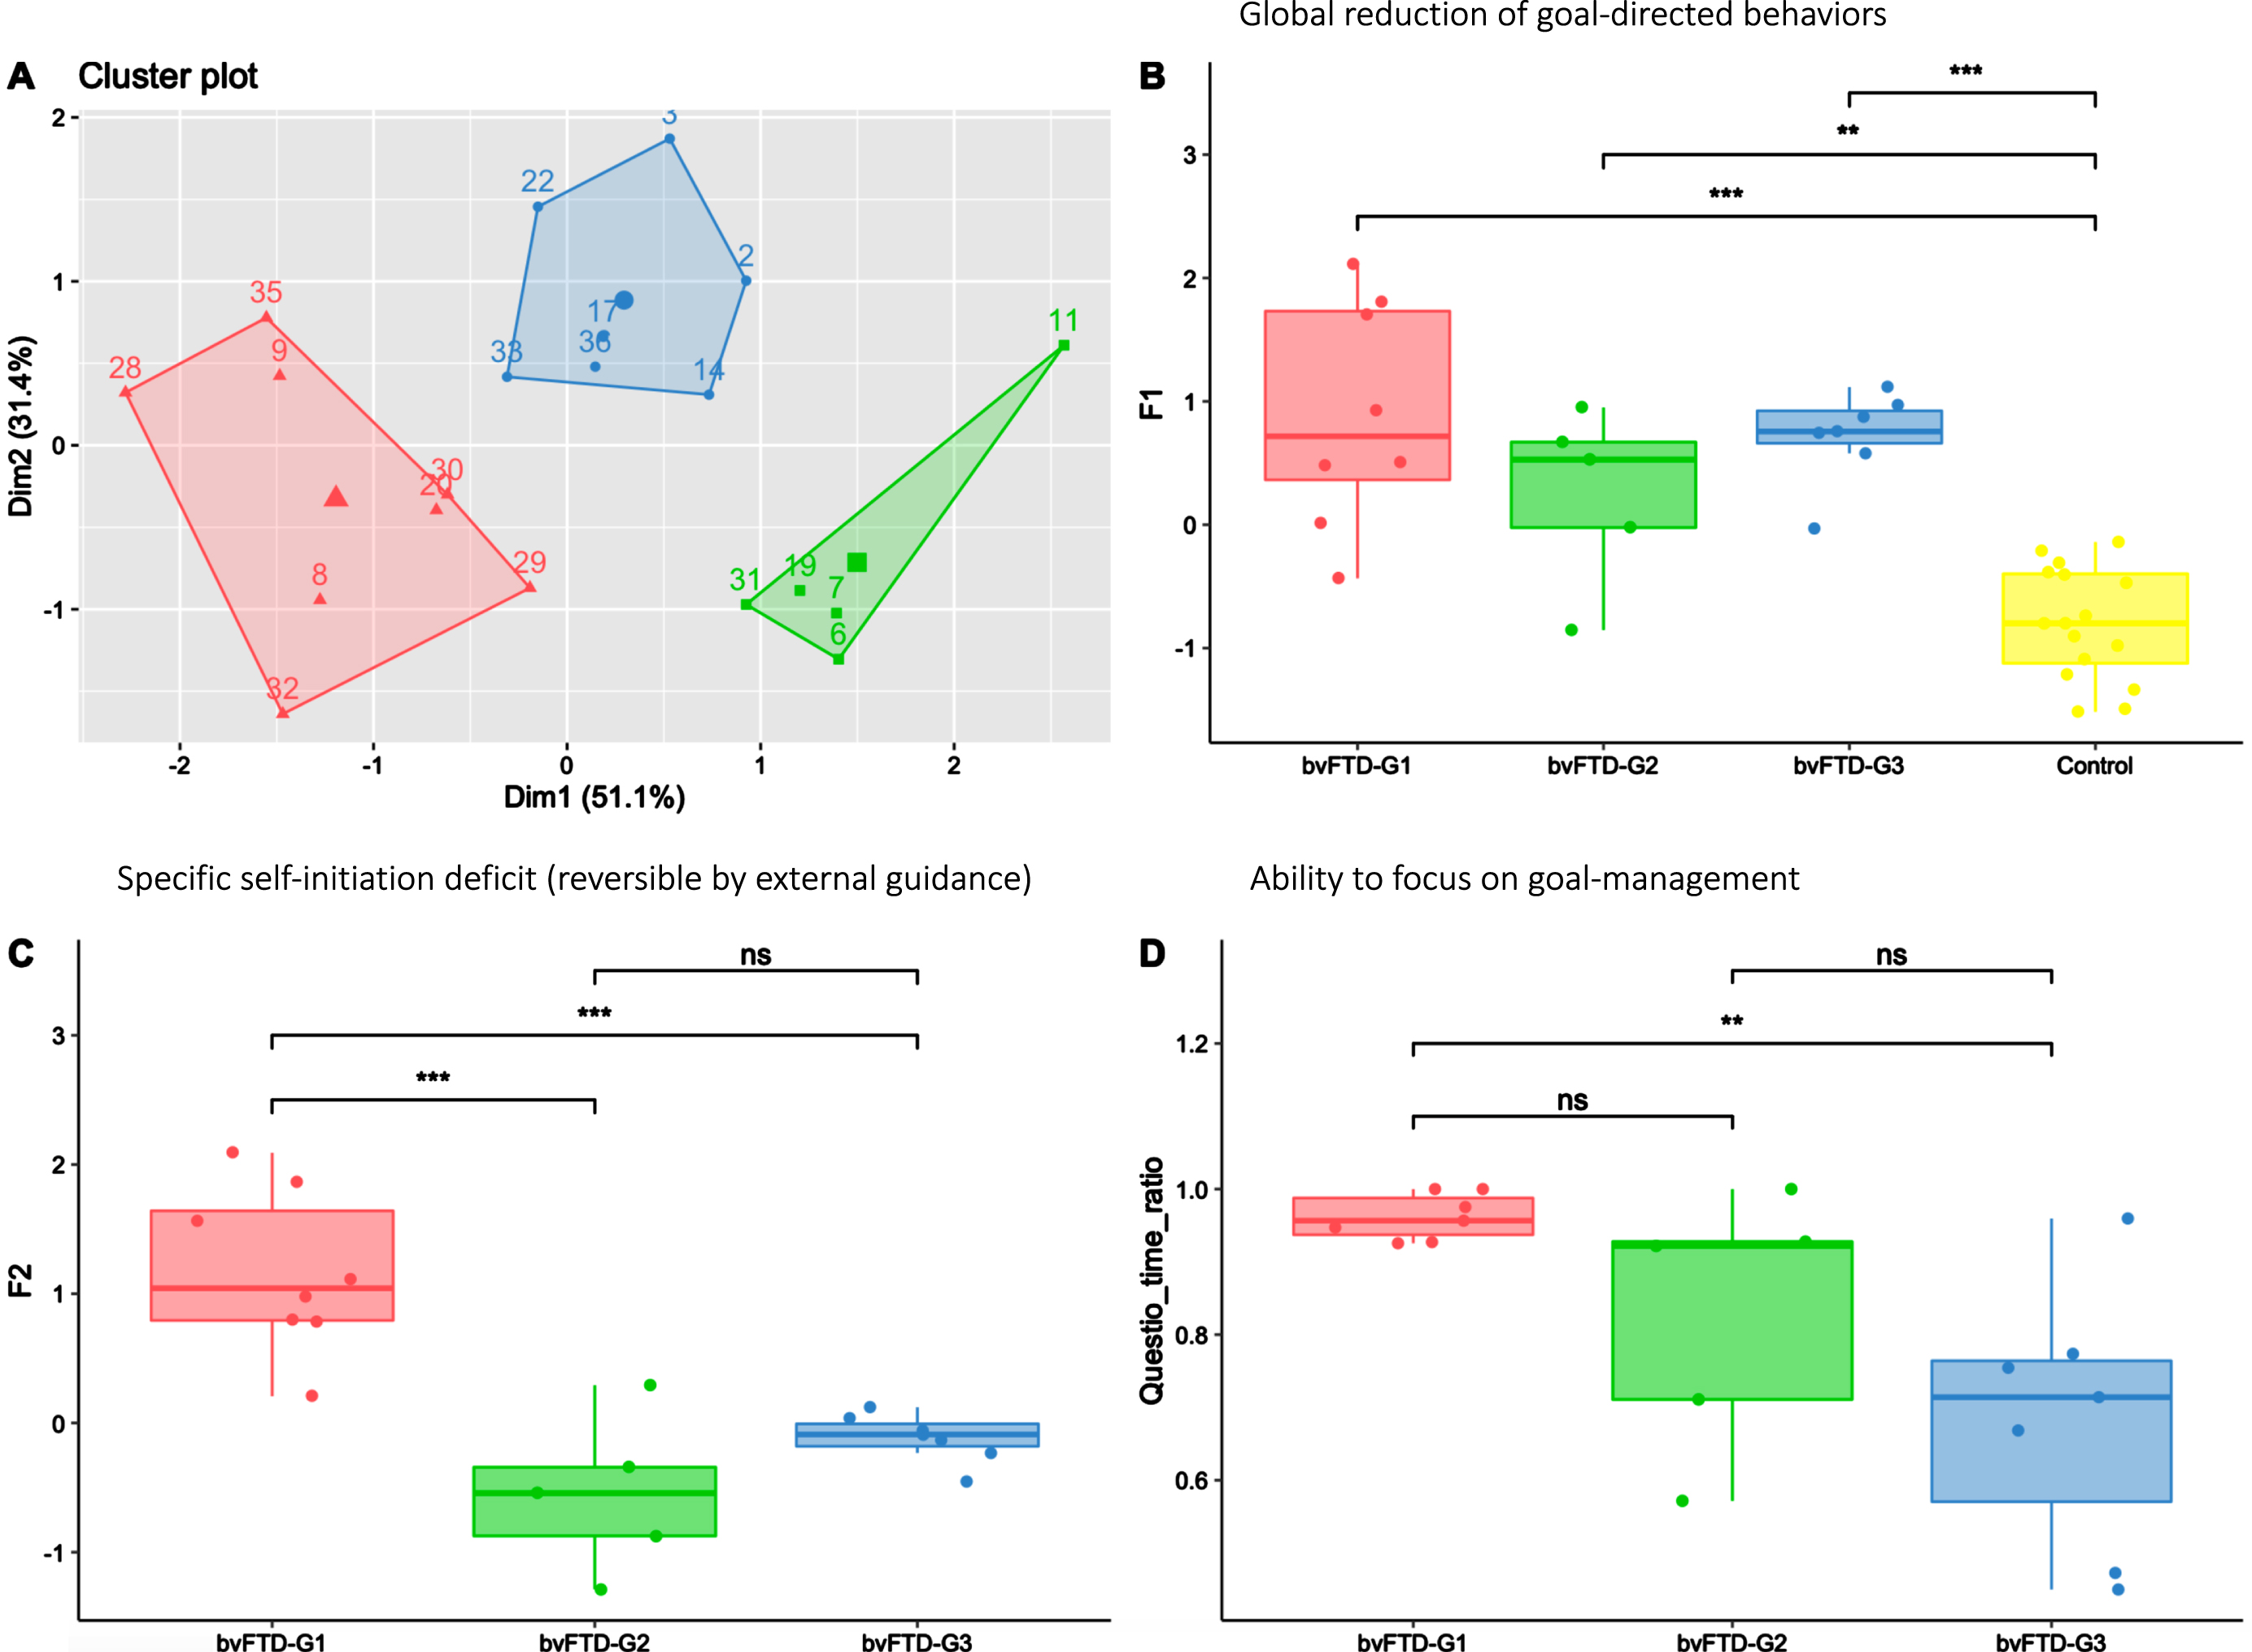
In Fig. 4, the apathy profiles of the three identified bvFTD subgroups (shown in Fig. 4A) are described using the F1 and F2 dimensions and the Questio_time_ratio behavioural metric. All bvFTD subgroups showed similar levels of global apathy (as assessed by F1), significantly higher compared to HC (Fig. 4B). Compared to both bvFTD-G2 and bvFTD-G3, bvFTD-G1 was characterized by a higher self-initiation deficit (as assessed by F2) (Fig. 4C), reversible with hetero-guidance as confirmed by the relatively high time devoted the questionnaire activity in the guided phase (Fig. 4D). On the opposite, in bvFTD-G2 and G3 compared to bvFTD-G1, the specific self-initiation deficit contributed less to explain global apathy and the ability to focus on goal management in guided phase (as assessed by Questio_time_ratio) was lower, especially for bvFTD-G3.
Fig. 4
Three bvFTD subgroups and their profiles of apathy on measures including behavioral metrics. bvFTD-G1 in red (N = 8), bvFTD-G2 in green (N = 5), bvFTD-G3 in blue (N = 7), and HC in yellow (N = 16). A) Results of the k-means clustering analysis (based on DAS subscales) defining three subgroups of bvFTD patients; B) Apathy defined as a global reduction of goal-directed behaviors (assessed by F1) in the three bvFTD subgroups compared to HC: no difference was observed between subgroups; C) Specific self-initiation deficit potentially reversible by hetero-guidance (assessed by F2) in the three bvFTD subgroups; D) Ability to focus on goal management (assessed by Questio-time-ratio) in the three bvFTD subgroups. Levels of significance (adjusted p-values): ns: non-significant; *p < 0.05; **p < 0.01; ***p < 0.001.
Characterization of atrophy patterns
The overall contrast of all bvFTD patients compared with HC revealed an expected pattern of diffuse atrophy in frontal and temporal regions (data not shown). Figure 5 shows results of the following contrasts: bvFTD-G1 versus HC, bvFTD-G2 versus HC, and bvFTD-G3 versus HC. Supplementary Material 4 reports the detailed list of coordinates with local maximum atrophy for each patient subgroup compared with HC. Three distinct patterns of GM atrophy were identified for the three subgroups of patients, with the highest extent of atrophy found in bvFTD-G3 and the lowest in bvFTD-G1. BvFTD-G1 showed a clear right-sided pattern of atrophy including OFC, ACC, dorsolateral prefrontal cortex (DLPFC), anterior insula, temporal regions, and striatum. bvFTD-G2 presented a more diffuse bilateral atrophy within all frontal regions (in particular, the lateral prefrontal cortex) and within the insula and striatum, but very little atrophy within temporal lobes. Finally, bvFTD-G3 revealed the most diffuse and intense pattern of bilateral atrophy within frontal regions (in particular in frontal pole), insula, temporal regions and subcortical regions (including amygdala, hippocampus, striatum, and thalamus).
Fig. 5
Three bvFTD subgroups and their VBM– derived GM atrophy maps. bvFTD-G1 (N = 8), bvFTD-G2 (N = 5), and bvFTD-G3 (N = 7). The (1-p) value maps show the atrophy patterns compared with HC (N = 16) and are superimposed onto a whole-brain MNI template. Effects were corrected for age and sex, and statistical significance was set at p < 0.05 FWE-corrected for multiple comparisons.
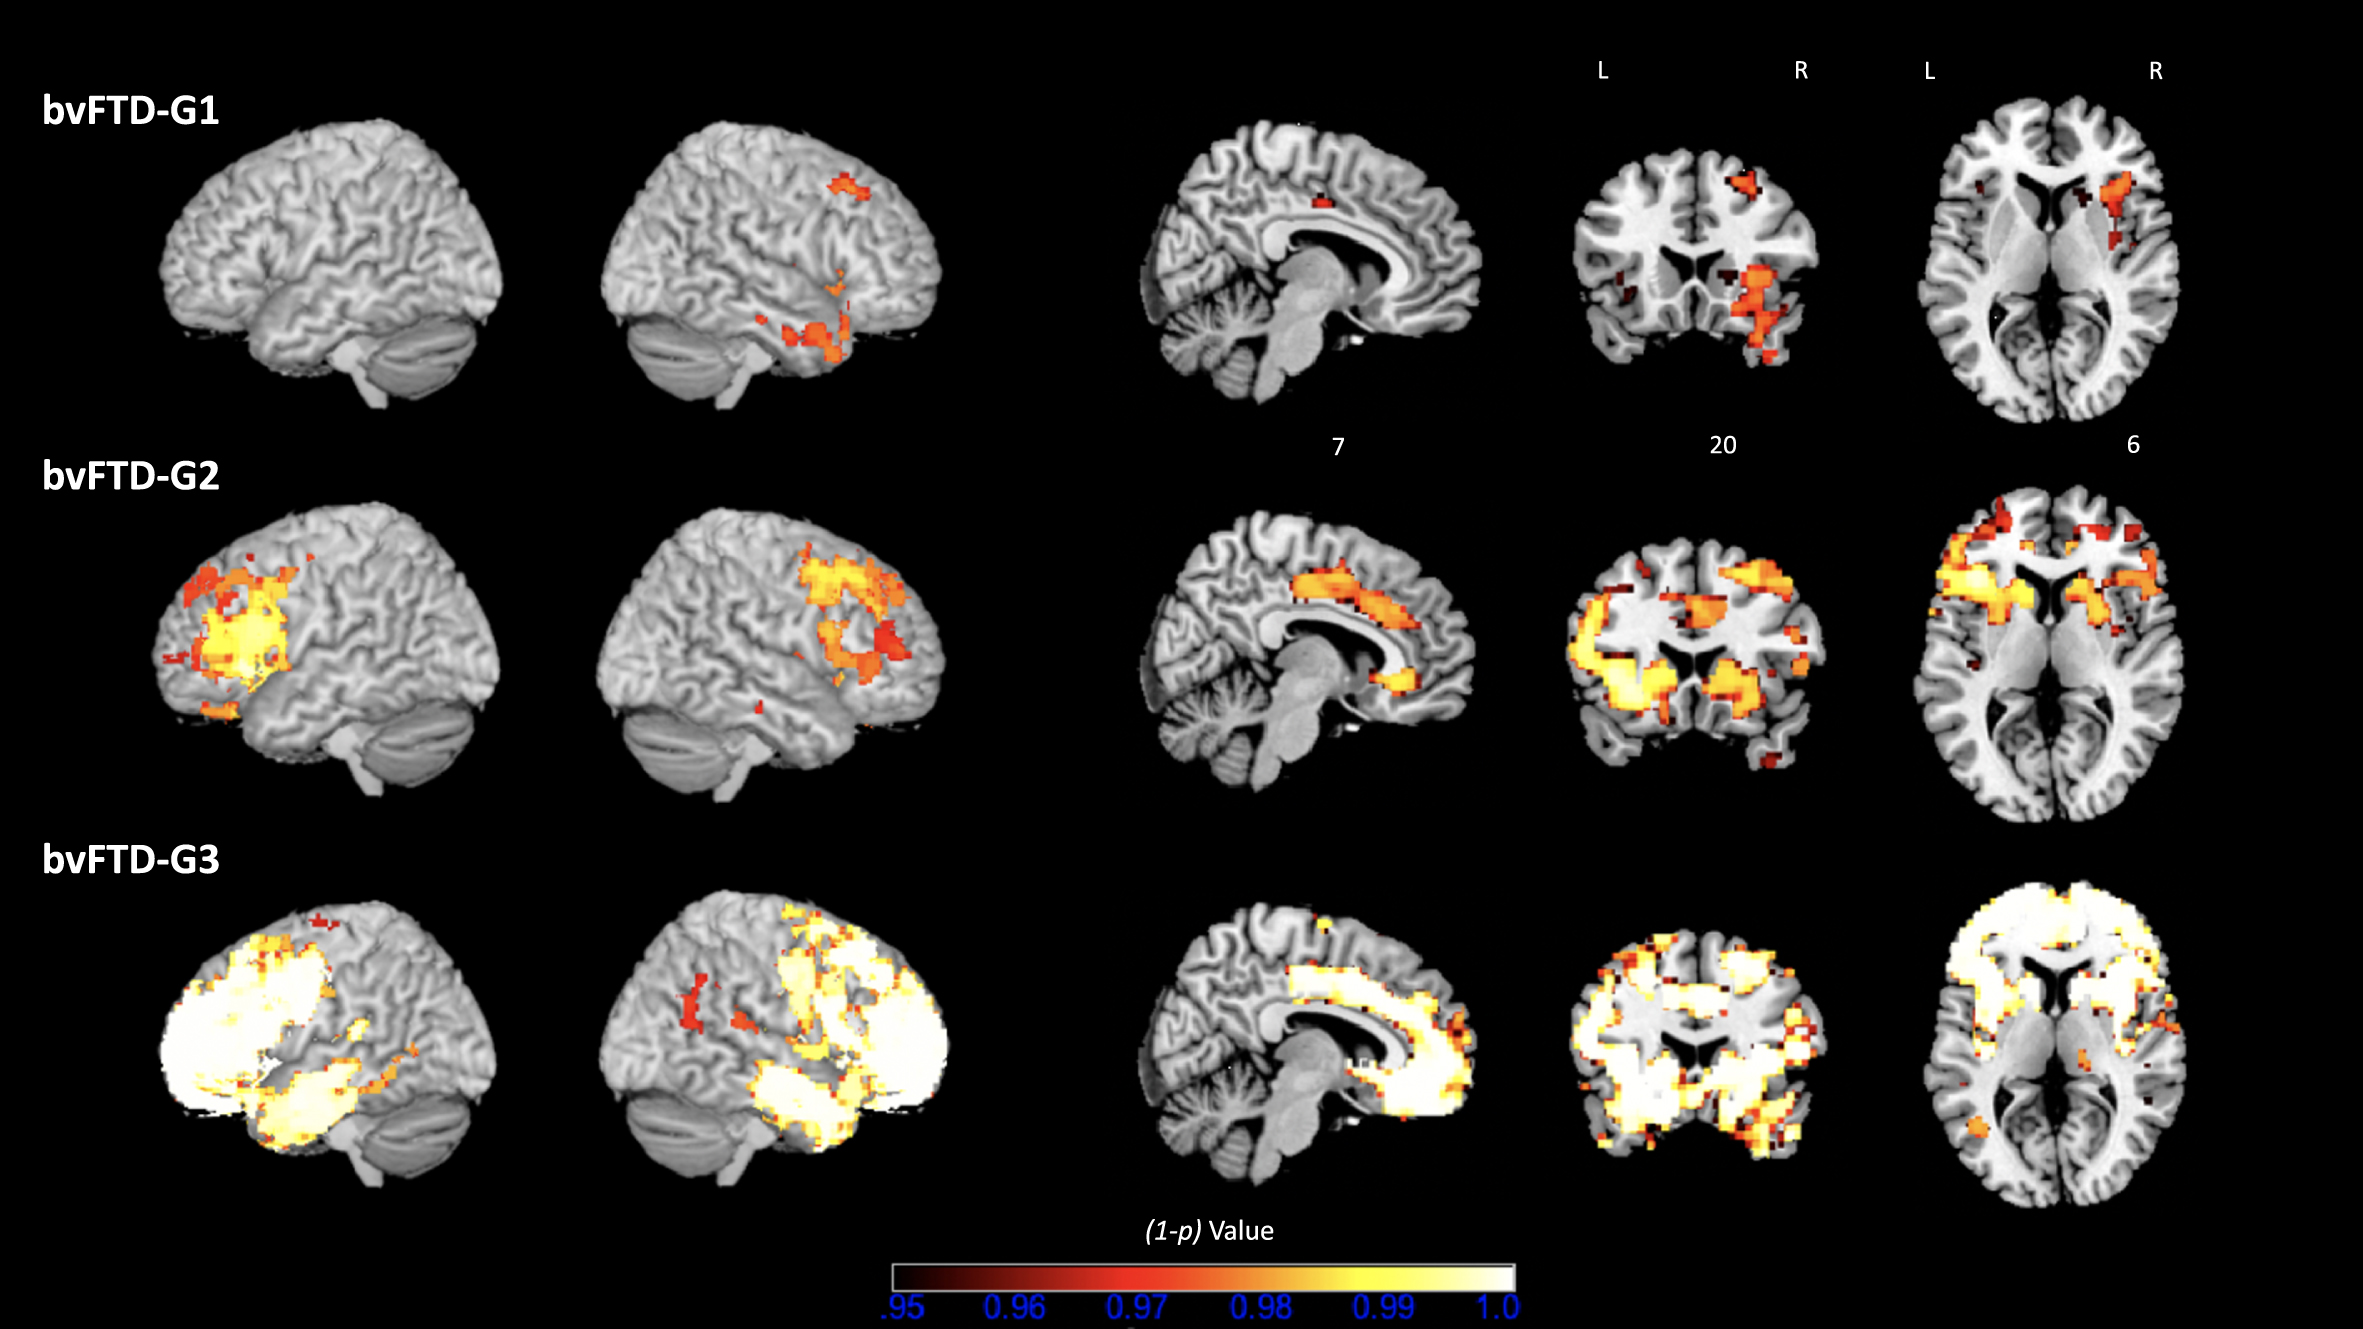
Further, we tested the following contrasts between identified bvFTD subgroups: bvFTD-G1 versus bvFTD-G2, bvFTD-G2 versus bvFTD-G3, and bvFTD-G1 versus bvFTD-G3. Detailed results are shown in Supplementary Material 5. Due to lack of statistical power, most of these results were uncorrected for multiple comparisons but were however informative. The comparison between bvFTD-G1 and bvFTD-G2 confirmed that bvFTD-G2 presented higher atrophy within the left lateral prefrontal cortex than bvFTD-G1 (at p < 0.01 uncorrected for multiple comparisons). Contrasting bvFTD-G2 and bvFTD-G3 showed that bvFTD-G3 had increased atrophy compared to bvFTD-G2 in right lateral prefrontal cortex, right frontal pole, bilateral temporal regions (in particular temporooccipital part) and subcortical regions (thalamus and pallidum) (at p < 0.01 uncorrected for multiple comparisons). The contrast between bvFTD-G1 and bvFTD-G3 revealed higher atrophy in bvFTD-G3 in many frontal and temporal regions (at p < 0.01 uncorrected for multiple comparisons). Of note, in the lateral prefrontal cortex and most importantly in the frontal pole, atrophy was significantly higher in bvFTD-G3 compared to bvFTD-G1 at p < 0.05 corrected for multiple comparisons.
DISCUSSION
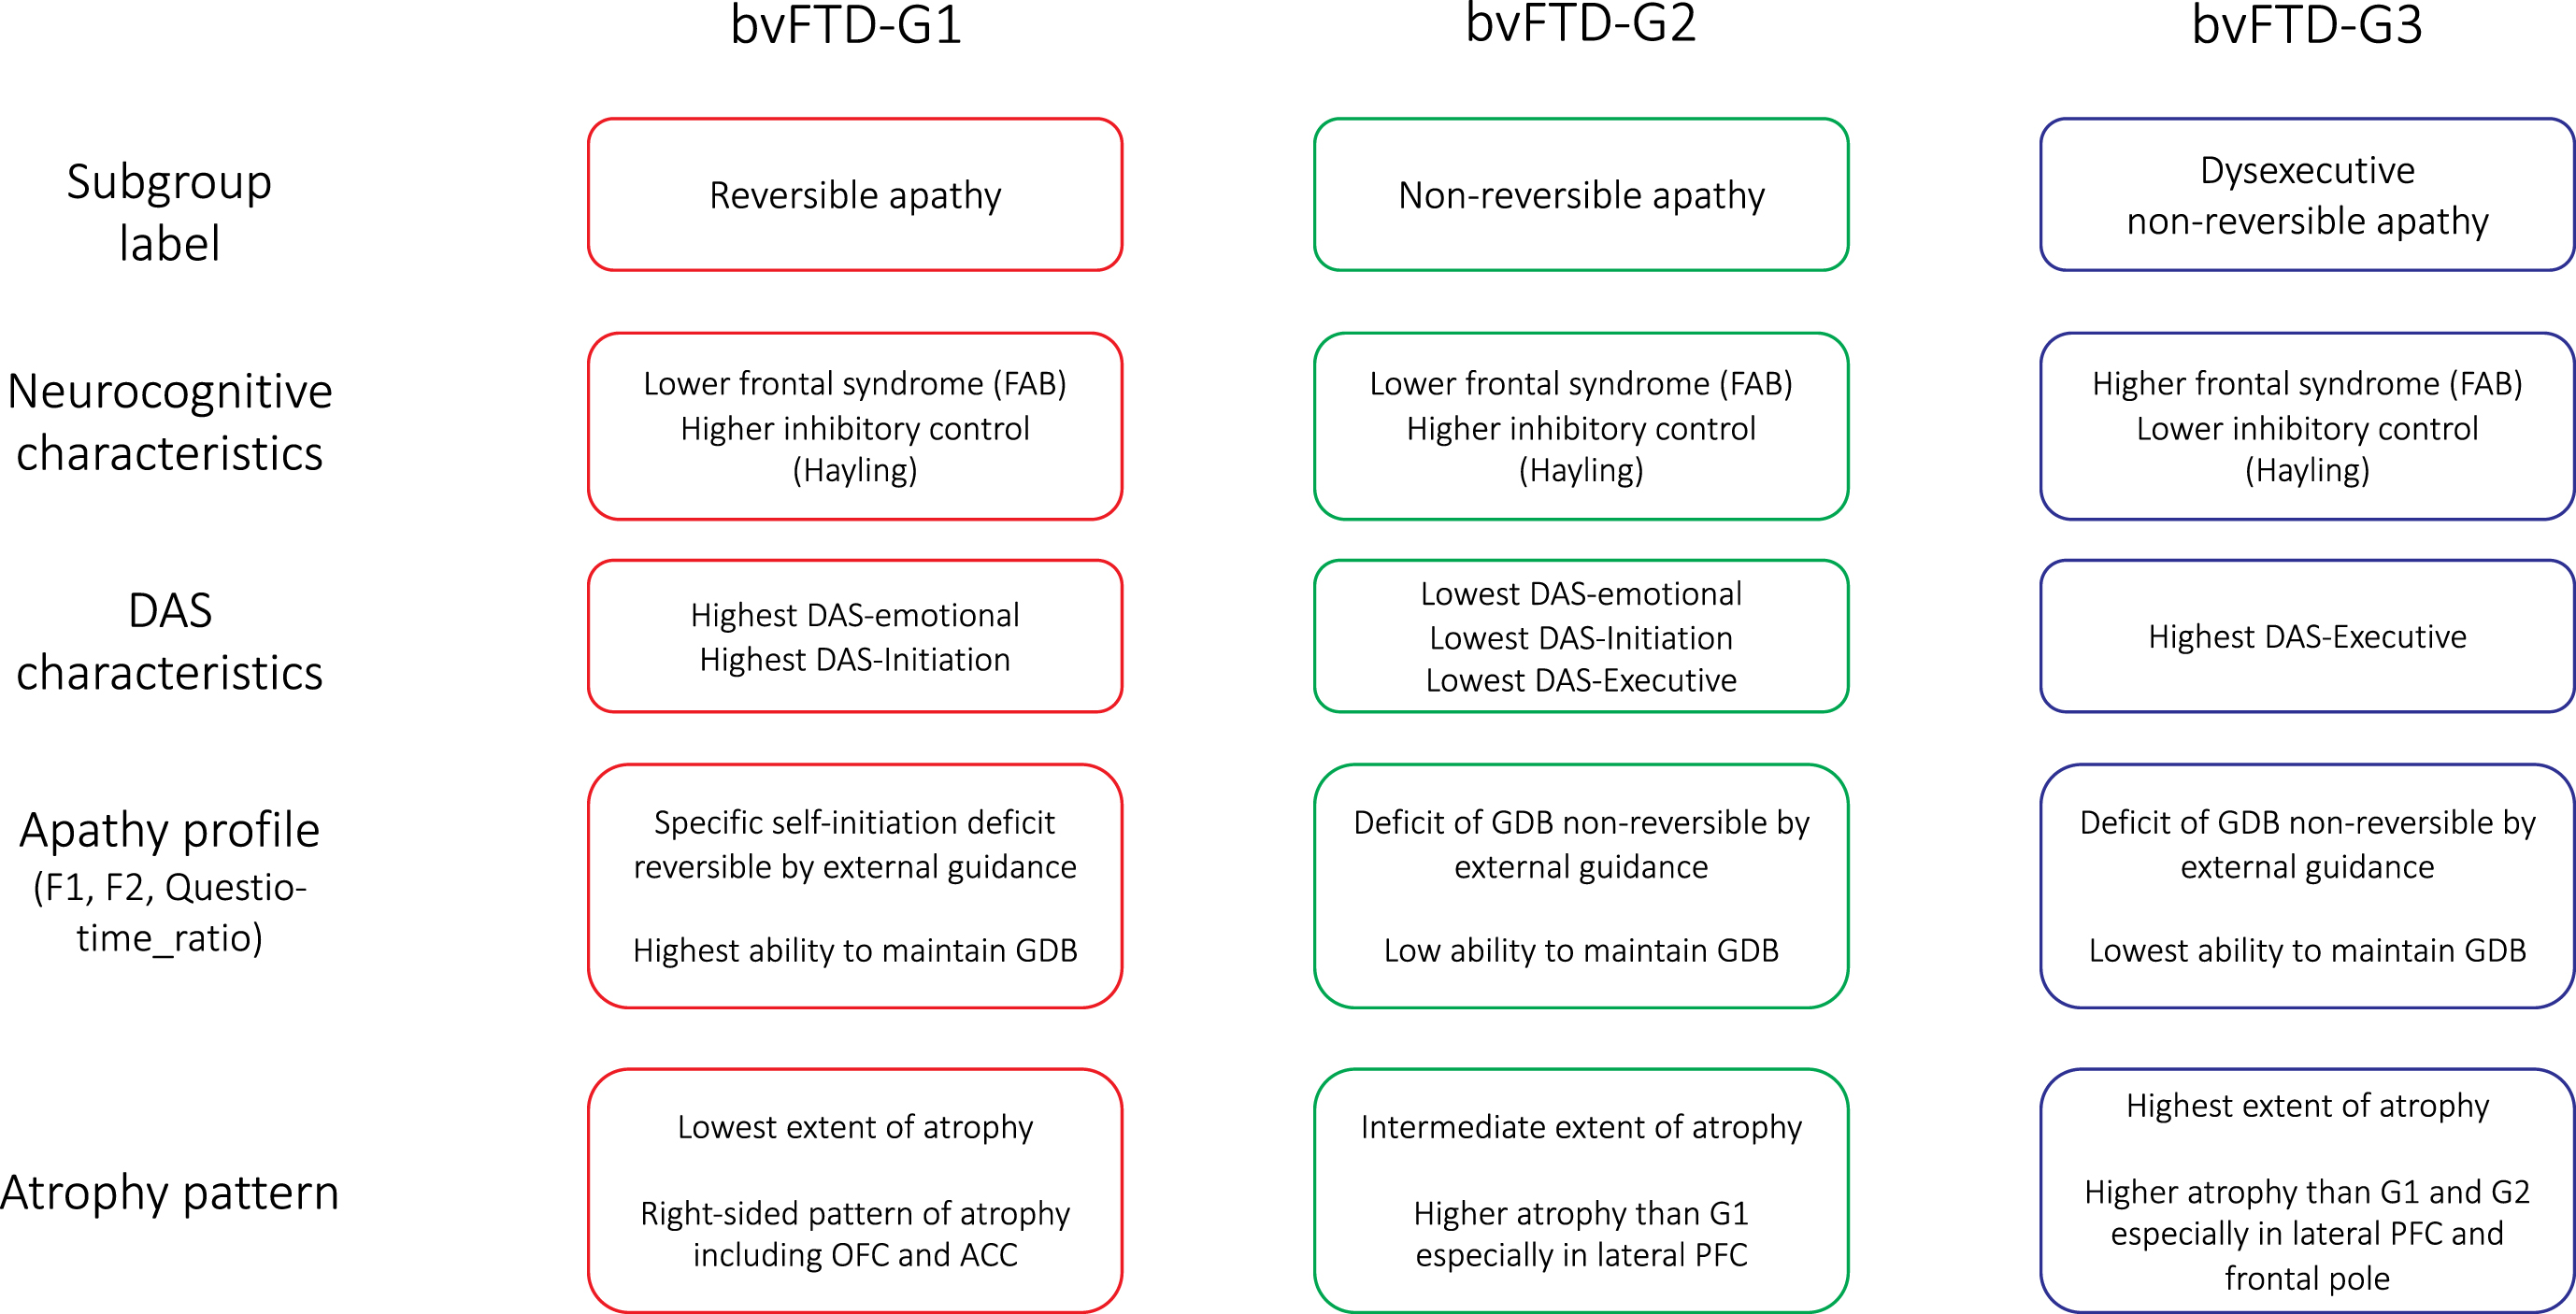
The present investigation allowed us to distinguish subgroups of bvFTD patients showing different profiles of apathy and specific characteristics in terms of atrophy pattern. Although apathy subtypes (according to Levy and Dubois’s model [1]) have already been investigated in bvFTD patients, to our knowledge, this is the first report of being able to stratify bvFTD patients according to their apathy subtype combinations. The description of apathy profiles and atrophy patterns of the identified bvFTD subgroups is summarized in Fig. 6. We discuss the implications of our findings: 1) for the accurate characterization of patients’ profiles of apathy and 2) for the prediction of the clinical-anatomical profile of bvFTD patients from DAS assessment.
Fig. 6
Summarized characteristics of the three bvFTD subgroups identified by data-driven clustering. DAS, Dimensional Apathy Scale; FAB, Frontal Assessment Battery; GDB, goal-directed behaviors; OFC, orbitofrontal cortex; ACC, anterior cingulate cortex; PFC, prefrontal cortex.
Apathy profiles of bvFTD subgroups
We isolated three subgroups of bvFTD patients (bvFTD-G1, -G2 and -G3), with specific characteristics in terms of their apathy profiles. As detailed in Fig. 6, apathy profiles in the three subgroups were labelled as: “reversible apathy” in bvFTD-G1, “non-reversible apathy” in bvFTD-G2, and “dysexecutive non-reversible apathy” in bvFTD-G3. Patients with reversible apathy reported the highest levels of disturbed emotional-motivational processing (DAS-Emotional) and lack of initiation of thought and actions (DAS-Initiation). They were characterized by a specific self-initiation deficit explaining their apathy (as indicated by high F2) but they could still benefit from environmental stimulation to engage in goal-directed behaviors with external guidance (as indicated by high Questio_time_ratio). Patients with reversible apathy were thus close to patients with a syndrome of auto-activation deficit in whom, despite the loss of self-initiated behaviors, the ability to execute externally-driven behavior is relatively spared [41]. Patients of the “non-reversible apathy” subgroup did not increase their “goal-directedness” with external guidance in the guided phase (as indicated by low F2) and they showed an intermediary capacity to focus on goal-management (as indicated by Questio_time_ratio). Like patients of the “non-reversible apathy” subgroup, patients with “dysexecutive non-reversible apathy” were characterized by a reduction of goal-directed behaviors which was not reversible by external guidance (as suggested by low F2). These patients were characterized as “dysexecutive” because they reported the highest executive difficulties (DAS-Executive), and three objective measures confirmed their lower executive abilities compared to other subgroups (Hayling-Error, FAB, and Questio_time_ratio).
Some discrepancies were observed between the characterization of subgroups exclusively by subjective measures and their characterization after taking account of objective behavioral metrics. Patients with non-reversible apathy (bvFTD-G2 and G3) surprisingly reported lower apathy (measured by SAS and total DAS) than patients with reversible apathy (bvFTD-G1), but the global level of apathy indicated by F1 was in fact similar in all subgroups. These discrepancies reflect a gap between what patients report and what they actually do, which is consistent with an observation made by Ducharme et al. [4]: “some patients with bvFTD report an intact sense of motivation but engage in little productive activity, while others express remarkable indifference but still perform tasks.”
We suggest that SAS and DAS provided only partial information to describe apathy. Apathy profiles described after taking account of behavioral metrics (by the variables F1, F2 and Questio_time_ratio) appeared more consistent with the atrophy patterns observed in bvFTD subgroups. For instance, bvFTD-G2 subgroup presented a pattern of frontal atrophy which included all the regions of the bvFTD-G1’s atrophy pattern and was more extended than in bvFTD-G1. Thus, it seems unlikely that patients in bvFTD-G2 were less apathetic than patients in bvFTD-G1 (as suggested by SAS and total DAS). Besides, since bvFTD-G2’s atrophy pattern included regions typically associated with apathy in the literature [1, 3, 4, 11, 42], it is also doubtful that this subgroup could be a “no-apathy” group, as suggested by their mean SAS score below the clinical cut-off of 14. The characterization of bvFTD-G2 as similar to other subgroups in terms of global apathy (according to F1) is therefore more consistent with the atrophy pattern observed in this subgroup. Eventually, bvFTD-G2 might correspond to a profile of patients with high lack of awareness of their apathy.
Thus, our results demonstrate again the high importance of using objective behavioral metrics as a complement to subjective measures by questionnaires in order to precisely assess patients’ profiles of apathy. To this end, the ecological setting, the behavioral metrics and “composite” dimensions that we developed in the ECOCAPTURE study could be useful to future research on apathy, especially in bvFTD. Several previous studies have already used ecological and objective behavioral methods to assess different aspects of apathy (such as actigraphy to assess the motor component of apathy) [22] but our method goes beyond: it contributes to determine the profile of apathy (including the underlying mechanisms) and not only its severity, by combining both objective and subjective measures.
In a clinical context, the method we used is of course difficult to implement in everyday practice (because it takes too long and is not automatized enough). However, in the future, we could develop a simplified form of our behavioral method, more adapted to clinical practice. We could also explore the correspondence between the apathy profiles identified in this study (with our behavioral method) and apathy profiles determined from a clinician’s point of view using the current diagnostic criteria of apathy [13]. This could help clinicians to categorize bvFTD patients in terms of their apathy profile from a simple clinical evaluation. In particular, we could test the hypothesis that patients with “reversible apathy” (bvFTD-G1) would be especially high on the “diminished initiative” criteria (B1 dimension: “less likely to initiate usual activities”) [13] while patients with “non-reversible apathy” (bvFTD-G2) and “dysexecutive non-reversible apathy” (bvFTD-G3) would show higher “diminished interest” (B2 dimension: “Reduced participation in activities even when stimulated” and “less persistence in maintaining or completing tasks or activities”) [13].
Atrophy patterns of bvFTD subgroups with distinct apathy profiles
Identified bvFTD subgroups showing different apathy profiles corresponded to distinct degrees of frontal affection. The correspondence between apathy profiles and atrophy patterns of bvFTD subgroups allows to draw out a few conclusions, but we can only make assumptions regarding the causal links between apathy profiles and atrophy patterns. First, atrophy patterns of bvFTD subgroups provide insight into the core regions of apathy. In the three bvFTD subgroups, atrophy pattern included areas usually associated with apathy in previous literature [1, 3, 4, 11, 42]. All subgroups, including bvFTD-G1 with the smallest extent of atrophy, showed significantly more global apathy (F1) compared to controls. Thus, showing an exclusively right-sided pattern of atrophy within the OFC, ACC, DLPFC, anterior insula, and striatum is sufficient to present an apathetic behavior in bvFTD. Among these regions, the OFC and ACC might be core regions, as suggested by the results of a recent study which investigated the neural correlates of apathy measured by the SAS [43]. Of note, the intensity of global apathy (F1) was not found to be higher in the subgroup with the highest extent of frontal atrophy (i.e., bvFTD-G3) than in the subgroup with the lowest extent of frontal atrophy (i.e., bvFTD-G1). As already observed in bvFTD, the severity of symptoms does not depend solely upon the severity of the grey matter atrophy pattern [44]. The severity of apathy may be more closely related to specific functional network disconnections (due to the impairment of specific hub regions) that are convergent across all bvFTD subgroups. Besides, the correspondence between apathy profiles and atrophy patterns in bvFTD suggests that as long as frontal atrophy includes the OFC and ACC and extends little into the lateral PFC and frontal pole (like in bvFTD-G1), apathy is exclusively due to a difficulty to self-initiate goal-directed behaviors and reversible by external guidance. As soon as frontal atrophy intensifies within areas of the lateral prefrontal cortex, especially within areas of the frontal pole (like in bvFTD-G2 and bvFTD-G3 compared to bvFTD-G1), apathy may become less reversible and more related to difficulties to maintain goal-directed behaviors (i.e., focus on a plan of actions towards goal-management). This would be consistent with the theory that one of frontal pole core functions is enabling cognitive branching (that is, the ability to put on hold an alternative course of action during the concurrent performance of the ongoing one) [45].
Interestingly, the bvFTD subgroups identified by clustering based on DAS may correspond to anatomic subtypes of bvFTD already evidenced by previous studies. Like in a recent study investigating disinhibition profiles in bvFTD [46], we identified three patterns of atrophy mirroring those previously isolated in bvFTD patients by Ranasinghe et al. [18], by clustering according to grey matter loss in some specific brain regions. These patterns were identified by clustering according to grey matter loss in regions of the salience network (SN; in charge of the coordination of social-emotional processing and executive processing) and semantic appraisal network (SAN; in charge of valuation and context appraisal). A more recent longitudinal study [19] confirmed the stability of these identified anatomic subtypes of bvFTD at baseline and over time. In our study, bvFTD-G1’s pattern of atrophy appears similar to those in the “SAN-predominant subgroup” whilst bvFTD-G2 and bvFTD-G3’s atrophy patterns seem similar to the two “SN-predominant subgroups”. BvFTD-G1’s profile of apathy (“reversible apathy”) was consistent with a disruption of SAN function, as it affects the valuation process of external stimuli supposed to guide the self-initiation of goal-directed behaviors. As for the profiles of apathy observed in bvFTD-G2 and G3 (“non-reversible apathy” and “dysexecutive non-reversible apathy”), they were coherent with dysfunctional SN since an impaired coordination between social-emotional and executive processing may result in a difficulty to maintain incentive and focus on the management of a given objective.
Upon validation of a stable correspondence between anatomic subtypes of bvFTD and apathy profiles, apathy profile could be predicted from anatomic subtype, or conversely, anatomic subtype predicted from apathy profile. Being able to reliably predict patients’ profile of apathy from their anatomic subtype could be very helpful for research on the tailoring of treatments. In particular, the clustering of bvFTD patients allowed to identify an anatomic subtype showing a relatively preserved ability to execute externally-driven behavior (or “reversible apathy”). This subtype of patients may represent the best candidates to respond to environmental stimulations fostering goal-directed behaviors. Detecting these patients from their pattern of atrophy and testing their reactions to various stimulations is very promising in the perspective of improving apathy care strategies. On the other hand, predicting patients’ anatomic subtype (associated with a global clinical profile) from their apathy profile could be useful to clinical practice. Further work is however needed to establish clinical cut-offs on DAS dimensions to facilitate the precise identification of a patient’s apathy profile from DAS measures.
Methodological limits
The relatively small sample size of bvFTD patients is a first limitation of the present study. However, despite the small sample size and resulting low statistical power, comparisons between subgroups demonstrated that we disentangled distinct profiles by data-driven clustering. Small sample size is a common issue in studies investigating the neural bases of apathy in FTD [4]. This is due to the heavy requirements of our protocol (two days of experimental protocol with extensive neuropsychological testing) and to our selective inclusion criteria for bvFTD patients (e.g., MMSE score >20). We included only patients at a rather early stage of the disease so that the resulting patient stratification can be useful early in the course of the disease in order to tailor treatments. Thus, this study is only a first exploration of clustering of bvFTD patients from DAS measures and results must be further tested in a larger, more representative cohort. In particular, the stability of identified clusters and their associated characteristics (in terms of apathy profile and atrophy pattern) should be investigated across independent samples of bvFTD and across time. In this perspective, the observed similarity between identified bvFTD clusters and already evidenced stable anatomic subtypes of bvFTD is very encouraging.
The extent of the impact of anosognosia, potentially biasing subjective measures of apathy in bvFTD patients [2], is difficult to estimate because we lack reports from the caregiver. Caregiver’s point of view would be an insightful complementary information, but our protocol did not include this measure. Clustering based on caregiver’s report would also be interesting to explore. However, caregiver’s report is also biased by subjectivity (although not as much impacted by lack of awareness as in the patients) and here, the actual behavior observed in ecological conditions has been used as the most objective measure, complementary to subjective measures. We can assume that in this research, subjective bias was compensated for by the addition of objective behavioral measures to describe the apathy profile more accurately. The validity and relevance of measures used to characterize apathy profiles were indeed supported by several arguments (e.g., higher consistence with atrophy patterns of bvFTD subgroups).
Conclusions
From a theoretical perspective, our results go beyond the already evidenced associations between distinct apathy subtypes and distinct brain regions. They allow us to observe how different patterns of atrophy across the brain, potentially corresponding to anatomic subtypes of bvFTD, translate into clinical profiles of apathy. More work will be needed to further explore the causal links explaining the relationship between these specific patterns of brain atrophy and associated profiles of apathy. This could be the objective of future studies to investigate the underlying neural mechanisms explaining the profile of apathy observed in each bvFTD subgroup.
For clinicians, our results provide an interesting basis for the development of tools allowing to precise the clinical profile of bvFTD patients. The DAS could become a clinical tool which complements the evaluation of diagnostic criteria of apathy and facilitates the determination of a bvFTD patient’s apathy profile. Given that apathy is an important source of morbidity that predicts clinical worsening in neurological diseases [2], identification of apathy profile might prove very useful for disease course prediction in individual patients. Indeed, the different apathy profiles might be more or less debilitating and have distinct impacts on daily living. Moreover, our results open the way to the possible identification of the clinical-anatomical subtype of a bvFTD patient from DAS assessment, which offers interesting perspectives in terms of personalized medicine. This kind of individualized diagnostic strategy could be applied to other neurological conditions such as AD, in which the phenotypical heterogeneity of apathy could also be investigated by clustering methods.
ACKNOWLEDGMENTS
This study was funded by grant ANR-10-IAIHU-06 from the program “Investissements d’avenir”, by grant FRM DEQ20150331725 from the foundation “Fondation pour la recherche médicale”, and by the ENEDIS company. Valérie Godefroy is supported by “Fédération pour la Recherche sur le Cerveau”. Arabella Bouzigues is supported by “Fondation Vaincre Alzheimer”. Raffaella Migliaccio is supported by France Alzheimer and Philippe Chatrier Foundations, and by Rosita Gomez association.
We sincerely acknowledge the participants and caregivers for their involvement in this study.
Authors’ disclosures available online (https://www.j-alz.com/manuscript-disclosures/22-0370r2).
SUPPLEMENTARY MATERIAL
[1] The supplementary material is available in the electronic version of this article: https://dx.doi.org/10.3233/JAD-220370.
REFERENCES
[1] | Levy R , Dubois B ((2006) ) Apathy and the functional anatomy of the prefrontal cortex–basal ganglia circuits. Cereb Cortex 16: , 916–928. |
[2] | Levy R ((2012) ) Apathy: A pathology of goal-directed behaviour. A new concept of the clinic and pathophysiology of apathy. Rev Neurol (Paris) 168: , 585–597. |
[3] | Le Heron C , Apps MAJ , Husain M ((2018) ) The anatomy of apathy: A neurocognitive framework for amotivated behaviour. Neuropsychologia 118: , 54–67. |
[4] | Ducharme S , Price BH , Dickerson BC ((2018) ) Apathy: A neurocircuitry model based on frontotemporal dementia. J Neurol Neurosurg Psychiatry 89: , 389–396. |
[5] | Teixeira AL , Gonzales MM , de Souza LC , Weisenbach SL ((2021) ) Revisiting apathy in Alzheimer’s disease: From conceptualization to therapeutic approaches. Behav Neurol 2021: , e6319826. |
[6] | Rascovsky K , Hodges JR , Knopman D , Mendez MF , Kramer JH , Neuhaus J , van Swieten JC , Seelaar H , Dopper EGP , Onyike CU , Hillis AE , Josephs KA , Boeve BF , Kertesz A , Seeley WW , Rankin KP , Johnson JK , Gorno-Tempini M-L , Rosen H , Prioleau-Latham CE , Lee A , Kipps CM , Lillo P , Piguet O , Rohrer JD , Rossor MN , Warren JD , Fox NC , Galasko D , Salmon DP , Black SE , Mesulam M , Weintraub S , Dickerson BC , Diehl-Schmid J , Pasquier F , Deramecourt V , Lebert F , Pijnenburg Y , Chow TW , Manes F , Grafman J , Cappa SF , Freedman M , Grossman M , Miller BL ((2011) ) Sensitivity of revised diagnostic criteria for the behavioural variant of frontotemporal dementia. Brain 134: , 2456–2477. |
[7] | Rascovsky K , Hodges JR , Kipps CM , Johnson JK , Seeley WW , Mendez MF , Knopman D , Kertesz A , Mesulam M , Salmon DP , Galasko D , Chow TW , DeCarli C , Hillis A , Josephs K , Kramer JH , Weintraub S , Grossman M , Gorno-Tempini M-L , Miller BM ((2007) ) Diagnostic criteria for the behavioral variant of frontotemporal dementia (bvFTD): Current limitations and future directions. Alzheimer Dis Assoc Disord 21: , S14–S18. |
[8] | Pasquier F , Lebert F , Lavenu I , Guillaume B ((1999) ) The clinical picture of frontotemporal dementia: Diagnosis and follow-up. Dement Geriatr Cogn Disord 10: (Suppl 1), 10–14. |
[9] | Robert P , Lanctôt KL , Agüera-Ortiz L , Aalten P , Bremond F , Defrancesco M , Hanon C , David R , Dubois B , Dujardin K , Husain M , König A , Levy R , Mantua V , Meulien D , Miller D , Moebius HJ , Rasmussen J , Robert G , Ruthirakuhan M , Stella F , Yesavage J , Zeghari R , Manera V ((2018) ) Is it time to revise the diagnostic criteria for apathy in brain disorders? The 2018 international consensus group. Eur Psychiatry 54: , 71–76. |
[10] | Godefroy V , Batrancourt B , Levy R ((2020) ) Apathy: From the underlying pathophysiological mechanisms to future assessments and therapeutic strategies. In, Reference Module in Neuroscience and Biobehavioral Psychology, Della SalaS, ed., Elsevier. https://doi.org/10.1016/B978-0-12-819641-0.00057-8. |
[11] | Levy R ((2021) ) Apathy: A pathology of goal-directed behaviour and prefrontal cortex-basal ganglia circuits. In Apathy. Clinical and Neuroscientific Perspectives from Neurology and Psychiatry. AlemanA, LanctôtKL, eds.,Oxford University Press UK. |
[12] | Massimo L , Evans LK , Grossman M ((2014) ) Differentiating subtypes of apathy to improve person-centered care in frontotemporal degeneration. J Gerontol Nurs 40: , 58–65. |
[13] | Miller DS , Robert P , Ereshefsky L , Adler L , Bateman D , Cummings J , DeKosky ST , Fischer CE , Husain M , Ismail Z ((2021) ) Diagnostic criteria for apathy in neurocognitive disorders. Alzheimers Dement 17: , 1892–1904. |
[14] | Massimo L , Powers JP , Evans LK , McMillan CT , Rascovsky K , Eslinger P , Ersek M , Irwin DJ , Grossman M ((2015) ) Apathy in frontotemporal degeneration: Neuroanatomical evidence of impaired goal-directed behavior. Front Hum Neurosci 9: , 611. |
[15] | Kumfor F , Zhen A , Hodges JR , Piguet O , Irish M ((2018) ) Apathy in Alzheimer’s disease and frontotemporal dementia: Distinct clinical profiles and neural correlates. Cortex 103: , 350–359. |
[16] | Wei G , Irish M , Hodges JR , Piguet O , Kumfor F ((2020) ) Disease-specific profiles of apathy in Alzheimer’s disease and behavioural-variant frontotemporal dementia differ across the disease course. J Neurol 267: , 1086–1096. |
[17] | Whitwell JL , Przybelski SA , Weigand SD , Ivnik RJ , Vemuri P , Gunter JL , Senjem ML , Shiung MM , Boeve BF , Knopman DS , Parisi JE , Dickson DW , Petersen RC , Jack CR , Josephs KA ((2009) ) Distinct anatomical subtypes of the behavioural variant of frontotemporal dementia: A cluster analysis study. Brain 132: , 2932–2946. |
[18] | Ranasinghe KG , Rankin KP , Pressman PS , Perry DC , Lobach IV , Seeley WW , Coppola G , Karydas AM , Grinberg LT , Shany-Ur T , Lee SE , Rabinovici GD , Rosen HJ , Gorno-Tempini ML , Boxer AL , Miller ZA , Chiong W , DeMay M , Kramer JH , Possin KL , Sturm VE , Bettcher BM , Neylan M , Zackey DD , Nguyen LA , Ketelle R , Block N , Wu TQ , Dallich A , Russek N , Caplan A , Geschwind DH , Vossel KA , Miller BL ((2016) ) Distinct subtypes of behavioral variant frontotemporal dementia based on patterns of network degeneration. JAMA Neurol 73: , 1078. |
[19] | Ranasinghe KG , Toller G , Cobigo Y , Chiang K , Callahan P , Eliazer C , Kramer JH , Rosen HJ , Miller BL , Rankin KP ((2021) ) Computationally derived anatomic subtypes of behavioral variant frontotemporal dementia show temporal stability and divergent patterns of longitudinal atrophy. Alzheimers Dement (Amst) 13: , e12183. |
[20] | O’Connor CM , Landin-Romero R , Clemson L , Kaizik C , Daveson N , Hodges JR , Hsieh S , Piguet O , Mioshi E ((2017) ) Behavioral-variant frontotemporal dementia: Distinct phenotypes with unique functional profiles. Neurology 89: , 570–577. |
[21] | Radakovic R , Abrahams S ((2014) ) Developing a new apathy measurement scale: Dimensional Apathy Scale. Psychiatry Res 219: , 658–663. |
[22] | König A , Aalten P , Verhey F , Bensadoun G , Petit P-D , Robert P , David R ((2014) ) A review of current information and communication technologies: Can they be used to assess apathy? Current and new methods for the assessment of apathy. Int J Geriatr Psychiatry 29: , 345–358. |
[23] | Batrancourt BM , Lecouturier K , Ferrand-Verdejo J , Guillemot V , Azuar C , Bendetowicz D , Migliaccio R , Rametti-Lacroux A , Dubois B , Levy R ((2019) ) Exploration deficits under ecological conditions as a marker of apathy in frontotemporal dementia. Front Neurol 10: , 941. |
[24] | Starkstein SE , Mayberg HS , Preziosi T , Andrezejewski P , Leiguarda R , Robinson RG ((1992) ) Reliability, validity, and clinical correlates of apathy in Parkinson’s disease. J Neuropsychiatry Clin Neurosci 4: , 134–139. |
[25] | Marin RS , Biedrzycki RC , Firinciogullari S ((1991) ) Reliability and validity of the apathy evaluation scale. Psychiatry Res 38: , 143–162. |
[26] | Folstein MF , Folstein SE , McHugh PR ((1975) ) “Mini-mental state”. A practical method for grading the cognitive state of patients for the clinician. J Psychiatr Res 12: , 189–198. |
[27] | Mattis S ((1976) ) Mental status examination for organic mental syndrome in the elderly patients. Geriatric Psychiatry BellackL, KarusuTB, eds. Grune Stratton, New Yorkpp. 77–121. |
[28] | Mattis S ((1988) ) , Psychological Assessment Resources, Incorporated. Dementia Rating Scale: Professional Manual. |
[29] | Dubois B , Slachevsky A , Litvan I , Pillon B ((2000) ) The FAB: A frontal assessment battery at bedside. Neurology 55: , 1621–1626. |
[30] | Burgess PW , Shallice T ((1997) ) The Hayling and Brixton Tests. Thames Valley Test Company. |
[31] | Flanagan EC , Wong S , Dutt A , Tu S , Bertoux M , Irish M , Piguet O , Rao S , Hodges JR , Ghosh A , Hornberger M ((2016) ) False recognition in behavioral variant frontotemporal dementia and Alzheimer’s disease— disinhibition or amnesia? Front Aging Neurosci 8: , 177. |
[32] | Godefroy V , Batrancourt B , Charron S , Bouzigues A , Bendetowicz D , Carle G , Rametti-Lacroux A , Bombois S , Cognat E , Migliaccio R , Levy R ((2022) ) Functional connectivity correlates of reduced goal-directed behaviors in behavioural variant frontotemporal dementia. Brain Struct Funct 10.1007/s00429-022-02519-5. |
[33] | Douaud G , Smith S , Jenkinson M , Behrens T , Johansen-Berg H , Vickers J , James S , Voets N , Watkins K , Matthews PM , James A ((2007) ) Anatomically related grey and white matter abnormalities in adolescent-onset schizophrenia. Brain 130: , 2375–2386. |
[34] | Good CD , Johnsrude IS , Ashburner J , Henson RN , Friston KJ , Frackowiak RS ((2001) ) A voxel-based morphometric study of ageing in 465 normal adult human brains. Neuroimage 14: , 21–36. |
[35] | Smith SM , Jenkinson M , Woolrich MW , Beckmann CF , Behrens TEJ , Johansen-Berg H , Bannister PR , De Luca M , Drobnjak I , Flitney DE , Niazy RK , Saunders J , Vickers J , Zhang Y , De Stefano N , Brady JM , Matthews PM ((2004) ) Advances in functional and structural MR image analysis and implementation as FSL. Neuroimage 23: , S208–S219. |
[36] | Anderson JLR , Jenkinson M , Smith S ((2007) ) Non-linear registration, aka Spatial normalisation FMRIB technical report TR07JA2. www.fmrib.ox.ac.uk/analysis/techrep FMRIB Centre, Oxford, UK. |
[37] | Kaufman L , Rousseeuw PJ ((2009) ) Finding Groups in Data: An Introduction to Cluster Analysis John Wiley & Sons. |
[38] | Kurth F , Luders E , Gaser C ((2015) ) Voxel-based morphometry. In Brain Mapping, Elsevier, pp.345–349. |
[39] | Zhou J , Seeley WW ((2014) ) Network dysfunction in Alzheimer’s disease and frontotemporal dementia: Implications for psychiatry. Biol Psychiatry 75: , 565–573. |
[40] | Tumati S , Martens S , de Jong BM , Aleman A ((2019) ) Lateral parietal cortex in the generation of behavior: Implications for apathy. Prog Neurobiol 175: , 20–34. |
[41] | Laplane D , Dubois B ((2001) ) Auto-activation deficit: A basal ganglia related syndrome. Mov Disord 16: , 810–814. |
[42] | Schroeter ML , Vogt B , Frisch S , Becker G , Seese A , Barthel H , Mueller K , Villringer A , Sabri O ((2011) ) Dissociating behavioral disorders in early dementia— an FDG-PET study. Psychiatry Res Neuroimaging 194: , 235–244. |
[43] | Gonçalves S de AB , Caramelli P , Mariano LI , Guimarães HC , Gambogi LB , Resende E de PF , Teixeira AL , de Souza LC ((2020) ) Apathy in frontotemporal dementia is related to medial prefrontal atrophy and is independent of executive dysfunction. Brain Res 1737: , 146799. |
[44] | Lee SE , Khazenzon AM , Trujillo AJ , Guo CC , Yokoyama JS , Sha SJ , Takada LT , Karydas AM , Block NR , Coppola G ((2014) ) Altered network connectivity in frontotemporal dementia with C9orf72 hexanucleotide repeat expansion. Brain 137: , 3047–3060. |
[45] | Koechlin E ((2011) ) Frontal pole function: What is specifically human? Trends Cogn Sci 15: , 241. |
[46] | Godefroy V , Tanguy D , Bouzigues A , Sezer I , Ferrand-Verdejo J , Azuar C , Bendetowicz D , Carle G , Rametti-Lacroux A , Bombois S , Cognat E , Jannin P , Morandi X , Ber IL , Levy R , Batrancourt B , Migliaccio R ((2021) ) Frontotemporal dementia subtypes based on behavioral inhibition deficits. Alzheimers Dement (Amst) 13: , e12178. |

