
Associations Between Vascular Diseases and Alzheimer’s Disease or Related Dementias in a Large Cohort of Men and Women with Colorectal Cancer
Abstract
Background:
Long term risk of Alzheimer’s disease (AD) and related dementias (ADRD) associated with vascular diseases in people with colorectal cancer is unknown.
Objective:
To determine the risk of ADRD in association with cardiovascular diseases (CVD), stroke, hypertension, and diabetes in a cohort of patients with colorectal cancer.
Methods:
This retrospective cohort study consisted of 210,809 patients diagnosed with colorectal cancer at age≥65 years in 1991–2015 from the Surveillance, Epidemiology, and End Results (SEER)-Medicare linked database with follow-up from 1991–2016, who were free of any ADRD at the baseline (<12 months prior to or < 30 days after the date of cancer diagnosis).
Results:
The crude 26-year cumulative incidence of total ADRD in men and women with colorectal cancer was higher in those with versus without CVD (31.92% versus 28.12%), with versus without stroke (39.82% versus 26.39%), with versus without hypertension (31.88% versus 24.88%), and with versus without diabetes (32.01% versus 27.66%). After adjusting for socio-demographic and tumor factors, the risk of developing ADRD was significantly higher in patients with CVD (adjusted hazard ratio: 1.17, 95% confidence intervals: 1.14–1.20), stroke (1.65, 1.62–1.68), hypertension (1.07, 1.05–1.09), and diabetes (1.26, 1.24–1.29) versus persons without. For those with 1, 2, 3 and 4 vascular diseases present versus absent, the risk of AD increased from 1.12 (1.07–1.16) to 1.31 (1.25–1.36), 1.66 (1.57–1.75), and 2.03 (1.82–2.27).
Conclusion:
In older patients with colorectal cancer, a significant dose-response relationship was observed between an increasing number of these vascular diseases and the risk of all types of dementia.
INTRODUCTION
The prevalence of Alzheimer’s disease (AD) and related dementias (ADRDs) has been increasing in the United States and worldwide over the past several decades [1–5] and is projected to triple by 2050 [1–5]. Although the causes of ADRD remain unknown, a number of risk factors associated with ADRD have been identified [1–3, 6–41]. These include age, education, social support, medical history of psychiatric disorders, head trauma, genetic factors, and medical conditions such as cardiovascular diseases (CVD), stroke, hypertension, and diabetes [1–3, 6–41]. Although numerous studies have been conducted in population-based cohorts of general population with and without vascular diseases [6–40], few have focused on the ADRD and vascular disease association in long-term cancer survivors [41]. Recent research has suggested a complex relationship between AD and cancers [42–53]. A number of epidemiological studies [42–47, 51, 53] and systematic reviews [48, 49, 52] have shown that cancers are associated with a decreased risk of AD. This inverse relationship seems counterintuitive because patients diagnosed with cancer are more likely to experience anxiety, pain, and stress than those who do not have cancer, which would likely lead to a higher risk of cognitive impairment or dementia [52]. Furthermore, a number of clinical trials and observational studies have also shown that certain types of cancer chemotherapy regimens are associated with an increased risk of difficulties with memory, attention, and concentration [54–60]. Therefore, the risk of AD may be different between patients with cancer and those without cancer. It becomes imperative for the scientific community to confirm this relationship between cancers and dementias and to identify potential mechanisms of this inverse association, if true. We recently completed a study on the risk of ADRD among women with breast cancer in association with vascular diseases, hypertension, and diabetes, and found that CVD, stroke, hypertension, and diabetes were associated with a significantly elevated risk of developing ADRD [41]. This current study aimed to examine whether the incidence of AD and ADRD in association with a number of vascular diseases and other factors in men and women with colorectal cancer are similar to those in women with breast cancer. Our hypothesis was that the long-term risks of AD and ADRD are significantly higher in men and women with colorectal cancer who had a medical history of CVD, stroke, hypertension, and diabetes than those who did not have a history of these vascular diseases.
METHODS
Data sources
This study utilized the Surveillance, Epidemiology, and End Results (SEER) –Medicare linked database [61] for patients with colorectal cancer in 17 SEER areas between 1991 and 2015 with follow-up from 1991 to 2016. The detailed methods have been reported elsewhere [41]. In brief, the SEER program, supported by the National Cancer Institute (NCI), includes 17 population-based tumor registries in 8 states (Connecticut, Iowa, New Mexico, Utah, Hawaii, Kentucky, Louisiana, and New Jersey), 7 metropolitan/rural areas (San Francisco/Oakland, Detroit, Atlanta, Seattle, Rural-Georgia, Los Angeles County, and the San Jose-Monterey areas), Greater-California, and Greater-Georgia since 2000 to 2015 [62]. The population covered by 17 SEER areas accounted for 28% of the U.S. population and are comparable to the general U.S. population with regard to measures of poverty and education [63]. Our study included all 17 SEER registries, 9 of which were available since 1991 (Connecticut, Iowa, New Mexico, Utah, Hawaii, San Francisco/Oakland, Detroit, Atlanta, and Seattle), 3 registries of which were available since 1992 (Rural-Georgia, Los Angeles County, and the San Jose-Monterey areas), and 5 registries of which were available since 2000 (Kentucky, Louisiana, New Jersey, Greater-California, and Greater-Georgia) [62]. This study did not include new registries that joined the SEER since 2018 (Idaho, Massachusetts, New York, and Wisconsin). SEER and Medicare data were linked for cancer cases from 1991 to 2015 with Medicare claims data to December 2016 [61]. The Medicare program provides payments for hospital, physician and outpatient medical services for > 97% of persons aged≥65 [61]. The study was approved by the Committee for the Protection of Human Subjects at the University of Texas Health Science Center at Houston.
Study design and population
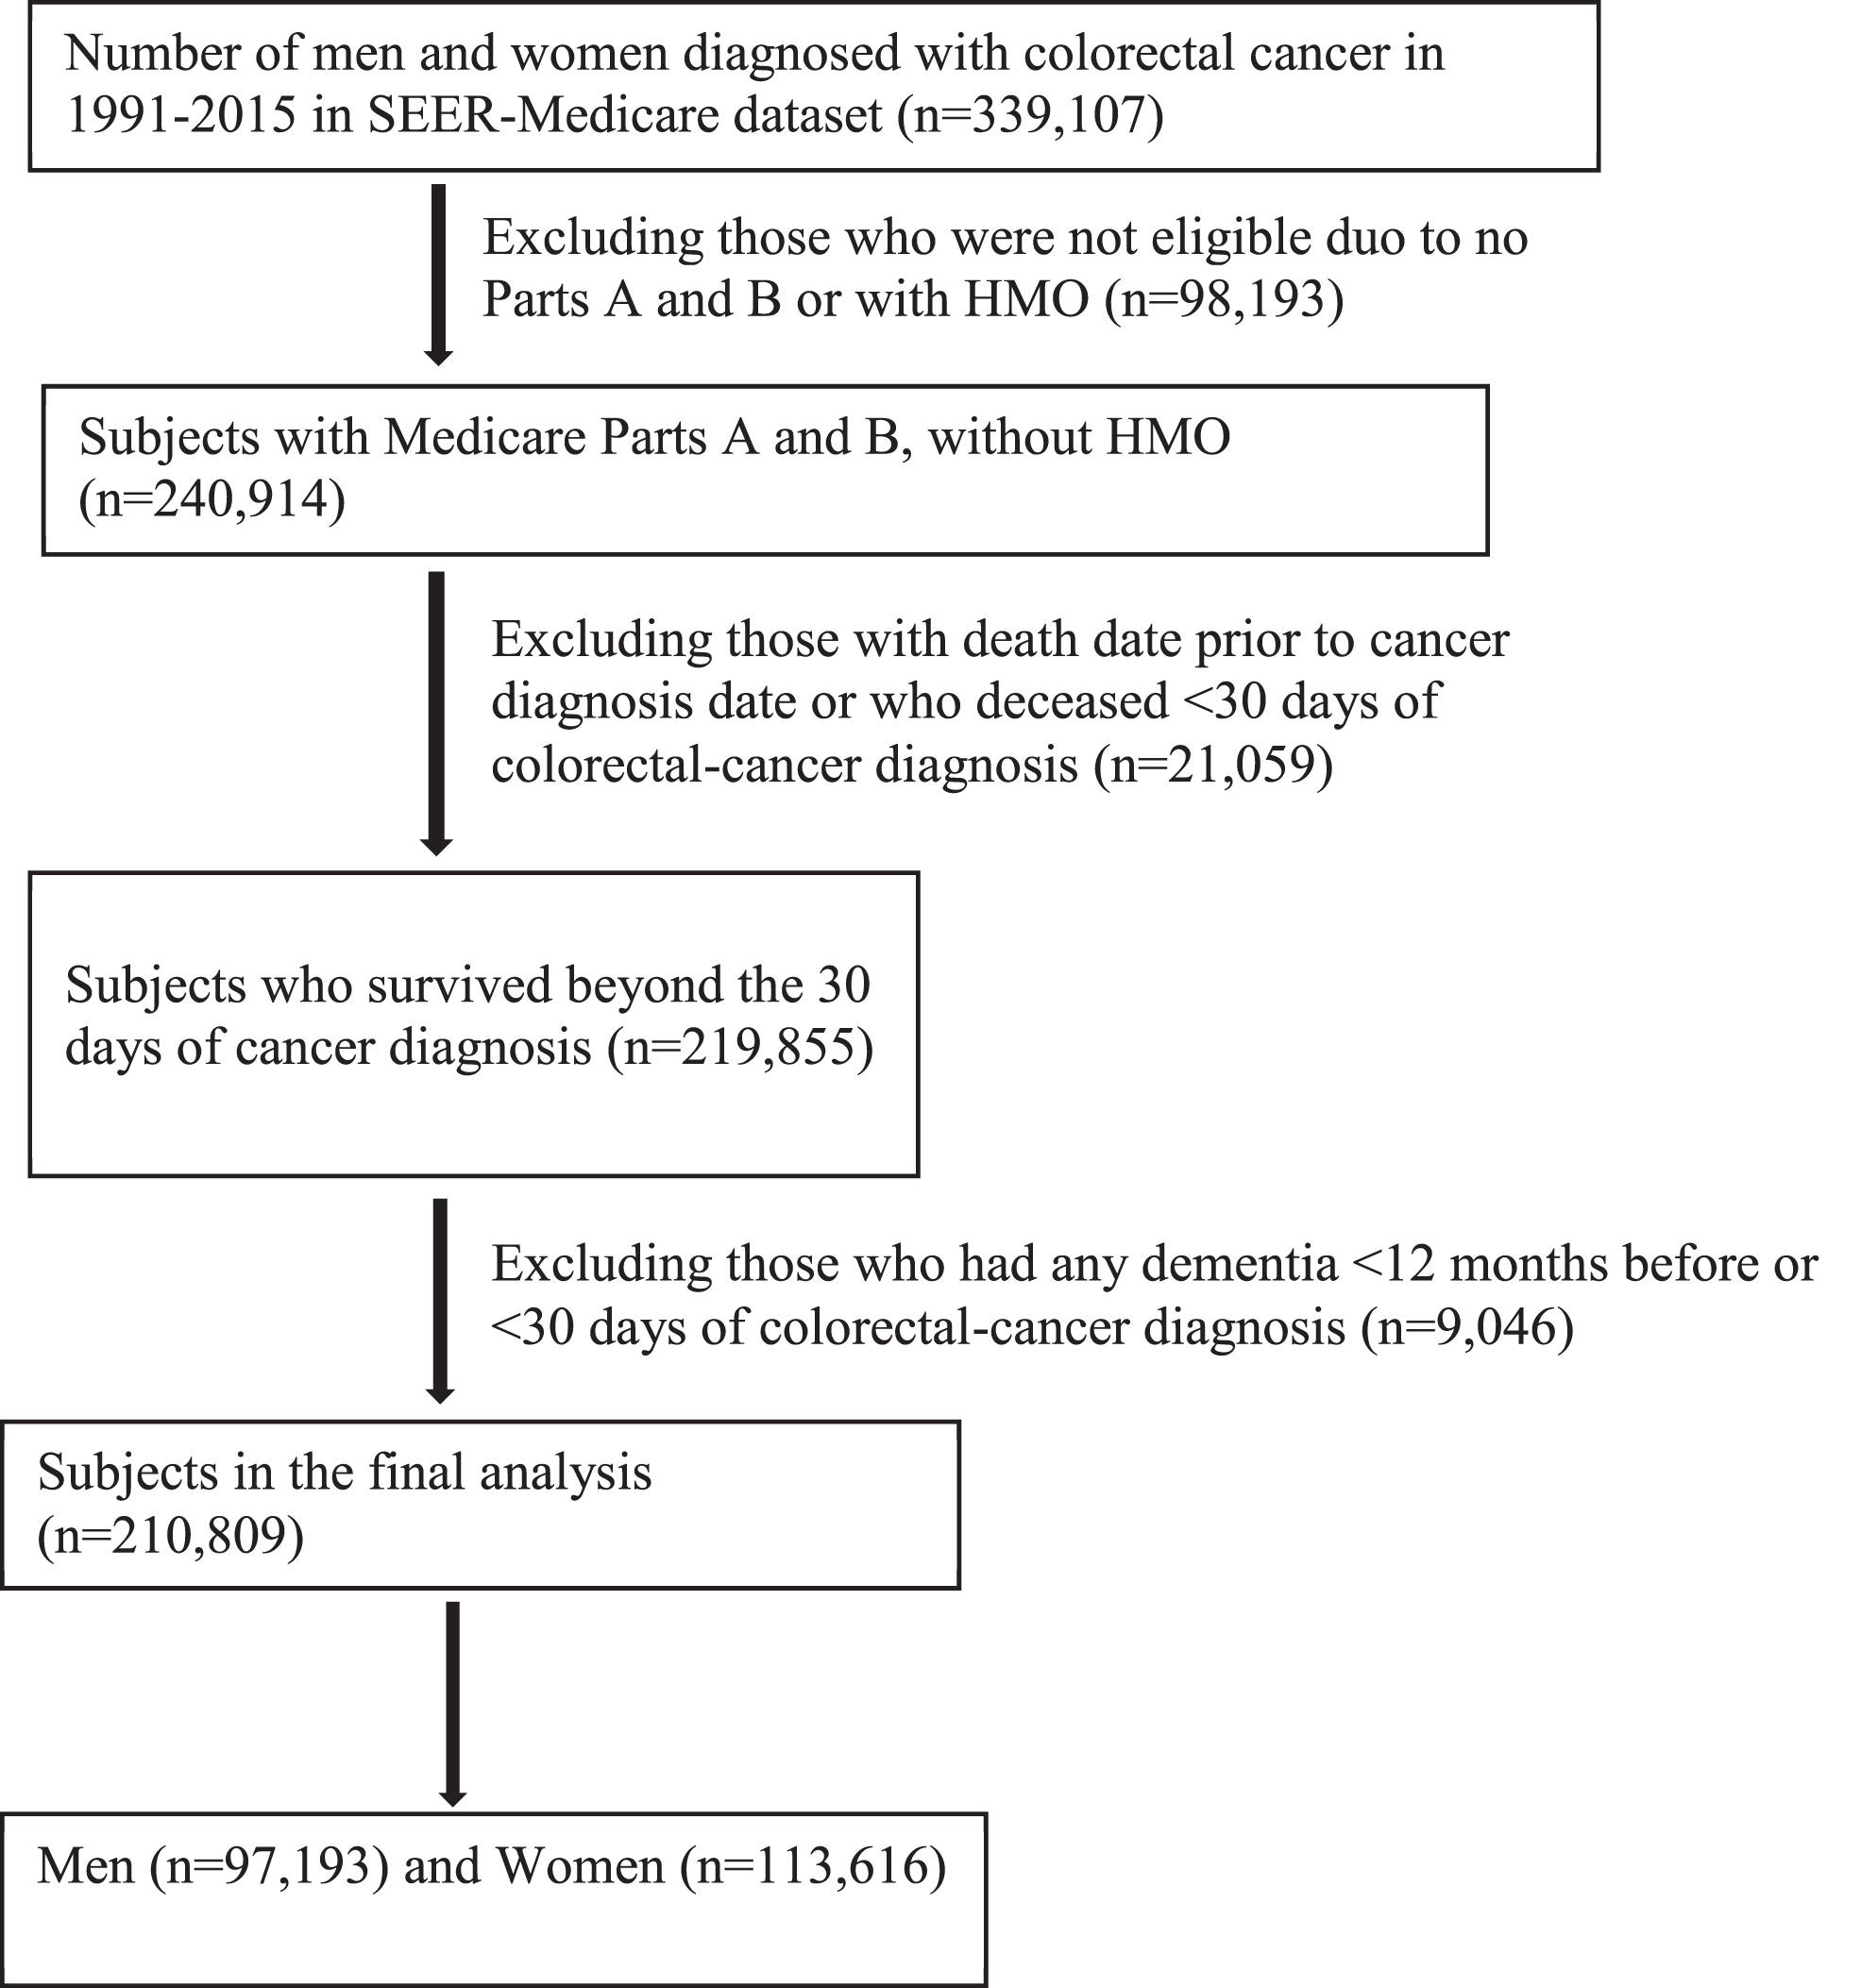
This is a retrospective cohort study and the study population consisted of 210,809 patients (97,193 men and 113,616 women) who were diagnosed with colorectal cancer at age 65 years or older between January 1, 1991 and December 31, 2015 (Fig. 1). Colorectal cancer was ascertained and confirmed by SEER registries and coded by the ICD-O-3 for colon cancer (C180-C189, or C260) and for rectal cancer (C199 or C209) [62]. After exclusions due to a number of reasons, such as no Parts A and B, enrollment of Health Maintenance Organization or Part C (Medicare Advantage), death within 30 days of cancer diagnosis, or data error (see Fig. 1), 210,809 men and women with colorectal cancer who were free of any diagnosed ADRD at the baseline (within 12 months prior to and 30 days after the date of diagnosis for colorectal cancer) were left in the final analysis. The study baseline includes a full year prior to the date of cancer diagnosis and also includes 30 days after the date of cancer diagnosis in order to capture all potential diagnosed ADRD and other comorbidities during this intensive check-up period for planning treatment for cancer.
Fig. 1
Chart of study population with inclusion and exclusion criteria.
Study variables
The methods to define main exposures [CVD (including myocardial infarction, congestive heart failure, or peripheral vascular disease), stroke, hypertension, and diabetes], outcomes (AD and ADRD), and covariates are described elsewhere [41]. In brief, CVD, stroke, hypertension, and diabetes were identified from Medicare data using ICD-9 or ICD-10 diagnosis codes that are listed in Supplementary Table 1. AD and ADRD were identified from Medicare data using ICD-9 or ICD-10 diagnosis codes that are listed in Supplementary Table 2. ADRD was then broken into the following 6 specific types of dementias: AD, vascular dementia, dementia with Lewy bodies (DLB), frontotemporal degeneration and dementias (FTD), mild cognitive impairment (MCI), and other dementias. Other variables include sociodemographic factors (including age, gender, race and ethnicity, and marital status), tumor factors (tumor stage, grade, site, and receipt of chemotherapy and radiotherapy), comorbidity score, calendar year of cancer diagnosis, and SEER areas by state where the registries are located [41, 61, 63]. Comorbidities were defined as co-existing medical conditions other than the interest (ADRD, vascular diseases, and cancer) under study. These include chronic pulmonary disease, congestive tissue disease, ulcer disease, mild liver disease, hemiplegia, moderate or severe renal disease, leukemia, moderate or severe liver disease, human immunodeficiency virus positive or acquired immune deficiency syndrome [64–67]. Comorbidities were identified through diagnoses or procedures made 1 year prior to and 30 days after study baseline using SAS programs provided by the National Cancer Institute [65, 67]. Each comorbid disease was weighted according to the severity of comorbid conditions [64–67] and the sum of all scores were analyzed as a continuous variable or categorical variable (score of 0, 1, and≥2).
Analysis
The distributions of baseline characteristics among colorectal cancer patients by exposures were compared and tested using the chi-square statistic for categorical variables or using the Kruskal-Wallis test for median age comparisons. The methods for calculating the cumulative incidence and incidence density rates of ADRD were reported elsewhere [41]. In brief, the cumulative incidence of ADRD is defined as the ratio of the number of cases with a new dementia over the total number of participants-at risk who were free of any diagnosed ADRD at the baseline when a colorectal cancer diagnosis was made. Incidence density is defined as the ratio of the number of cases with a new dementia over the total number of person-years by taking into consideration the differential follow-up times of study participants. Person-years are calculated as the number of people multiplied by the number of years from the time of colorectal cancer diagnosis to the date of first dementia, or date of death, or date of last follow-up (December 31, 2016), whichever occurred first. This study used the Cox regression models for the time to event analysis to determine the risk of developing dementia by exposures while adjusting for potential confounders. The proportionality assumption was evaluated by the log-log Kaplan-Meier curves and interaction terms between exposures and time variables in the Cox regression models [68, 69]. The Fine and Gray competing risk proportional hazards regression was analyzed by considering death as a competing risk [45]. The main confounders for exposures (vascular diseases) and outcomes (AD and ADRD) relationships included age (65–69, 70–74, 75–79, 80–84, or≥85 years), gender (men and women), race/ethnicity (Non-Hispanic [NH]-whites, NH-blacks, NH-Asians/Pacific Islanders, Hispanics, others, or unknown/missing), marital status (married, unmarried, or unknown/missing), tumor stage (local, regional, distant stage, or unknown/missing), tumor grade (well, moderately, or poorly differentiated, or unknown/missing), tumor site (colon or rectal), comorbidity score (0, 1, or≥2), chemotherapy (yes or no), radiation therapy (yes or no), year of diagnosis (from 1991 to 2015), and SEER areas (by states), which were adjusted in the regression models. In addition, age was also treated as a continuous variable in a sensitivity analysis.
RESULTS
Table 1 presents the distributions of baseline factors by exposure status (CVD, stroke, hypertension, and diabetes) among a large cohort of men and women diagnosed with colorectal cancer. A higher proportion of older patients had CVD and stroke, but patients older than 80 had a lower proportion of hypertension and diabetes than those aged 70–79. While men had a higher percentage of CVD (54.8% versus 45.2 for women, p < 0.01), women had a higher proportion than men of having stroke (54.2% versus 46.2%, p = 0.225), hypertension (57.5% versus 42.5%, p < 0.01), and diabetes (53.2% versus 46.8%, p < 0.01). The distributions of race/ethnicity, marital status, tumor factors, chemotherapy, radiotherapy, comorbidity score, calendar year of diagnosis, and SEER registries were similar by the status of CVD, stroke, hypertension, and diabetes.
Table 1
Distributions of characteristics in men and women with colorectal cancer by CVD, stroke, hypertension, and diabetes
| Patient and Tumor | Number of patients (column %) by exposure status | |||||||
| Characteristics | Cardiovascular diseases | Stroke | Hypertension | Diabetes | ||||
| Did not | Had | Did not | Had | Did not | Had | Did not | Had | |
| Mean, Median (range) age | 77, 76 (65, 108) | 78, 78 (65, 108) | 76, 76 (65, 108) | 79, 79 (65, 108) | 76, 77 (65, 108) | 77, 76 (65, 108) | 77, 77 (65, 108) | 76, 76 (65, 104) |
| Age (y) | ||||||||
| 65–69 | 38100 (21.2) | 4483 (14.6) | 38267 (21.9) | 4316 (12.0) | 22428 (23.2) | 20155 (17.6) | 32668 (20.2) | 9915 (20.2) |
| 70–74 | 39523 (22.0) | 6000 (19.5) | 39041 (22.3) | 6482 (18.1) | 21383 (22.2) | 24140 (21.1) | 34152 (21.1) | 11371 (23.2) |
| 75–79 | 38722 (21.5) | 6821 (22.1) | 37422 (21.4) | 8121 (22.6) | 20129 (20.9) | 25414 (22.2) | 34368 (21.3) | 11175 (22.8) |
| 80–84 | 32676 (18.2) | 6660 (21.6) | 31057 (17.8) | 8279 (23.1) | 16635 (17.2) | 22701 (19.9) | 30231 (18.7) | 9105 (18.6) |
| 85 or older | 30972 (17.2) | 6852 (22.2) | 29103 (16.6) | 8721 (24.3) | 15965 (16.5) | 21859 (19.1) | 30314 (18.7) | 7510 (15.3) |
| Gender | ||||||||
| Men | 80305 (44.6) | 16888 (54.8) | 80737 (46.2) | 16456 (45.8) | 48669 (50.4) | 48524 (42.5) | 74243 (45.9) | 22950 (46.8) |
| Women | 99688 (55.4) | 13928 (45.2) | 94153 (53.8) | 19463 (54.2) | 47871 (49.6) | 65745 (57.5) | 87490 (54.1) | 26126 (53.2) |
| Race/ethnicity | ||||||||
| NH-Whites | 141513 (78.6) | 24641 (80.0) | 137749 (78.8) | 28405 (79.1) | 78394 (81.2) | 87760 (76.8) | 131044 (81.0) | 35110 (71.5) |
| NH-Blacks | 15089 (8.4) | 2823 (9.2) | 14449 (8.3) | 3463 (9.6) | 6599 (6.8) | 11313 (9.9) | 12151 (7.5) | 5761 (11.7) |
| NH-Asians/Pacific Islanders | 8653 (4.8) | 1148 (3.7) | 8238 (4.7) | 1563 (4.4) | 3958 (4.1) | 5843 (5.1) | 6786 (4.2) | 3015 (6.1) |
| Hispanics | 10480 (5.8) | 1584 (5.1) | 10305 (5.9) | 1759 (4.9) | 5569 (5.8) | 6495 (5.7) | 8132 (5.0) | 3932 (8.0) |
| Others | 2643 (1.5) | 407 (1.3) | 2598 (1.5) | 452 (1.3) | 1225 (1.3) | 1825 (1.6) | 2183 (1.4) | 867 (1.8) |
| Unknown/missing | 1615 (0.9) | 213 (0.7) | 1551 (0.9) | 277 (0.8) | 795 (0.8) | 1033 (0.9) | 1437 (0.9) | 391 (0.8) |
| Marital status | ||||||||
| Married | 87573 (48.7) | 14563 (47.3) | 86364 (49.4) | 15772 (43.9) | 49798 (51.6) | 52338 (45.8) | 79166 (49.0) | 22970 (46.8) |
| Unmarried | 83872 (46.6) | 14852 (48.2) | 80285 (45.9) | 18439 (51.3) | 42198 (43.7) | 56526 (49.5) | 75040 (46.4) | 23684 (48.3) |
| Unknown | 8548 (4.8) | 1401 (4.6) | 8241 (4.7) | 1708 (4.8) | 4544 (4.7) | 5405 (4.7) | 7527 (4.7) | 2422 (4.9) |
| Tumor stage | ||||||||
| Local | 74688 (41.5) | 13437 (43.6) | 72469 (41.4) | 15656 (43.6) | 38758 (40.2) | 49367 (43.2) | 67317 (41.6) | 20808 (42.4) |
| Regional | 62734 (34.9) | 10632 (34.5) | 61043 (34.9) | 12323 (34.3) | 33167 (34.4) | 40199 (35.2) | 56167 (34.7) | 17199 (35.1) |
| Distant | 33333 (18.5) | 4787 (15.5) | 32493 (18.6) | 5627 (15.7) | 19112 (19.8) | 19008 (16.6) | 29670 (18.4) | 8450 (17.2) |
| Unknown/Missing | 9238 (5.1) | 1960 (6.4) | 8885 (5.1) | 2313 (6.4) | 5503 (5.7) | 5695 (5.0) | 8579 (5.3) | 2619 (5.3) |
| Tumor grade | ||||||||
| Well-differentiated | 15155 (8.4) | 2600 (8.4) | 14781 (8.5) | 2974 (8.3) | 7968 (8.3) | 9787 (8.6) | 13509 (8.4) | 4246 (8.7) |
| Moderately-differentiated | 105454 (58.6) | 18254 (59.2) | 102613 (58.7) | 21095 (58.7) | 55804 (57.8) | 67904 (59.4) | 94673 (58.5) | 29035 (59.2) |
| Poorly-differentiated | 32928 (18.3) | 5476 (17.8) | 31885 (18.2) | 6519 (18.2) | 17843 (18.5) | 20561 (18) | 29750 (18.4) | 8654 (17.6) |
| Unknown/Missing | 26456 (14.7) | 4486 (14.6) | 25611 (14.6) | 5331 (14.8) | 14925 (15.5) | 16017 (14) | 23801 (14.7) | 7141 (14.6) |
| Tumor site | ||||||||
| Colon | 133689 (74.3) | 24081 (78.1) | 129525 (74.1) | 28245 (78.6) | 70750 (73.3) | 87020 (76.2) | 119970 (74.2) | 37800 (77.0) |
| Rectal | 46304 (25.7) | 6735 (21.9) | 45365 (25.9) | 7674 (21.4) | 25790 (26.7) | 27249 (23.9) | 41763 (25.8) | 11276 (23.0) |
| Chemotherapy | ||||||||
| No | 143482 (79.7) | 25933 (84.2) | 138991 (79.5) | 30424 (84.7) | 82688 (85.7) | 86727 (75.9) | 132091 (81.7) | 37324 (76.1) |
| Yes | 36511 (20.3) | 4883 (15.9) | 35899 (20.5) | 5495 (15.3) | 13852 (14.4) | 27542 (24.1) | 29642 (18.3) | 11752 (24.0) |
| Radiotherapy | ||||||||
| No | 169226 (94.0) | 29393 (95.4) | 164277 (93.9) | 34342 (95.6) | 92109 (95.4) | 106510 (93.2) | 152868 (94.5) | 45751 (93.2) |
| Yes | 10767 (6.0) | 1423 (4.6) | 10613 (6.1) | 1577 (4.4) | 4431 (4.6) | 7759 (6.8) | 8865 (5.5) | 3325 (6.8) |
| Comorbidity Scores | ||||||||
| 0 | 113374 (63.0) | 13130 (42.6) | 109692 (62.7) | 16812 (46.8) | 63898 (66.2) | 62606 (54.8) | 100987 (62.4) | 25517 (52.0) |
| 1 | 50391 (28.0) | 11177 (36.3) | 49280 (28.2) | 12288 (34.2) | 25682 (26.6) | 35886 (31.4) | 46440 (28.7) | 15128 (30.8) |
| ≥2 | 16228 (9.0) | 6509 (21.1) | 15918 (9.1) | 6819 (19.0) | 6960 (7.2) | 15777 (13.8) | 14306 (8.9) | 8431 (17.2) |
| Year of Diagnosis | ||||||||
| 1991–1994 | 18424 (10.2) | 2246 (7.3) | 18022 (10.3) | 2648 (7.4) | 11260 (11.7) | 9410 (8.2) | 16790 (10.4) | 3880 (7.9) |
| 1995–1999 | 20870 (11.6) | 3160 (10.3) | 20175 (11.5) | 3855 (10.7) | 10142 (10.5) | 13888 (12.2) | 18724 (11.6) | 5306 (10.8) |
| 2000–2004 | 42225 (23.5) | 7259 (23.6) | 40982 (23.4) | 8502 (23.7) | 17670 (18.3) | 31814 (27.8) | 37521 (23.2) | 11963 (24.4) |
| 2005–2009 | 48534 (27.0) | 8750 (28.4) | 46734 (26.7) | 10550 (29.4) | 27009 (28.0) | 30275 (26.5) | 43870 (27.1) | 13414 (27.3) |
| 2010–2015 | 49940 (27.8) | 9401 (30.5) | 48977 (28.0) | 10364 (28.9) | 30459 (31.6) | 28882 (25.3) | 44828 (27.7) | 14513 (29.6) |
| SEER Areas | ||||||||
| Connecticut | 14108 (7.8) | 2616 (8.5) | 14230 (8.1) | 2494 (6.9) | 7413 (7.7) | 9311 (8.2) | 13145 (8.1) | 3579 (7.3) |
| Detroit | 14353 (8.0) | 3111 (10.1) | 13625 (7.8) | 3839 (10.7) | 6525 (6.8) | 10939 (9.6) | 12027 (7.4) | 5437 (11.1) |
| Hawaii | 2849 (1.6) | 439 (1.4) | 2854 (1.6) | 434 (1.2) | 1494 (1.6) | 1794 (1.6) | 2532 (1.6) | 756 (1.5) |
| Iowa | 16622 (9.2) | 2209 (7.2) | 16333 (9.3) | 2498 (7.0) | 9116 (9.4) | 9715 (8.5) | 15149 (9.4) | 3682 (7.5) |
| New Mexico | 4584 (2.6) | 614 (2) | 4589 (2.6) | 609 (1.7) | 2876 (3.0) | 2322 (2.0) | 4183 (2.6) | 1015 (2.1) |
| Seattle | 10431 (5.8) | 1304 (4.2) | 10189 (5.8) | 1546 (4.3) | 6530 (6.8) | 5205 (4.6) | 9718 (6.0) | 2017 (4.1) |
| Utah | 4362 (2.4) | 571 (1.9) | 4438 (2.5) | 495 (1.4) | 2711 (2.8) | 2222 (1.9) | 4014 (2.5) | 919 (1.9) |
| Georgia | 13268 (7.4) | 2188 (7.1) | 12926 (7.4) | 2530 (7.0) | 7263 (7.5) | 8193 (7.2) | 12011 (7.4) | 3445 (7.0) |
| Kentucky | 11784 (6.6) | 2304 (7.5) | 11758 (6.7) | 2330 (6.5) | 5969 (6.2) | 8119 (7.1) | 10655 (6.6) | 3433 (7.0) |
| Louisiana | 9599 (5.3) | 1684 (5.5) | 9009 (5.2) | 2274 (6.3) | 4708 (4.9) | 6575 (5.8) | 8468 (5.2) | 2815 (5.7) |
| New Jersey | 22393 (12.4) | 4904 (15.9) | 21274 (12.2) | 6023 (16.8) | 10521 (10.9) | 16776 (14.7) | 19677 (12.2) | 7620 (15.5) |
| California | 55640 (30.9) | 8872 (28.8) | 53665 (30.7) | 10847 (30.2) | 31414 (32.5) | 33098 (29.0) | 50154 (31.0) | 14358 (29.3) |
| Total | 179993 (100.0) | 30816 (100.0) | 174890 (100.0) | 35919 (100.0) | 96540 (100.0) | 114269 (100.0) | 161733 (100.0) | 49076 (100.0) |
Table 2 presents the cumulative incidence rates of each individual dementia type history of vascular disease, demographic, and tumor characteristics. The crude 26-year incidence of total ADRD was higher in patients with versus without CVD (31.92% versus 28.12%, p < 0.01), with versus without stroke (39.82% versus 26.39%, p < 0.01), with versus without hypertension (31.88% versus 24.88%, p < 0.01), and with versus without diabetes (32.01% versus 27.66%, p < 0.01). The crude incidence of AD and other specific dementias varied by CVD, stroke, hypertension, and diabetes. The cumulative incidence of total ADRD increased from 16.76% for patients aged 65–69 to 23.66% for patients aged 70–74, 30.41% for patients aged 75–79, 35.89% for patients aged 80–84, and 38.53% for patients aged≥85.
Table 2
Cumulative-incidence of dementias (ADRD) by a history of vascular diseases
| Cumulative-incidence (%) of dementias | |||||||
| Characteristics | AD | Vascular | DLB | FTD | MCI | Others | Total |
| Cardiovascular disease | |||||||
| No | 8.71 | 3.88 | 0.62 | 0.14 | 1.43 | 26.46 | 28.12 |
| Yes | 8.53 | 4.77 | 0.56 | 0.12 | 1.26 | 30.00 | 31.92* |
| Stroke | |||||||
| No | 8.18 | 3.34 | 0.56 | 0.12 | 1.34 | 24.86 | 26.39 |
| Yes | 11.11 | 7.24 | 0.84 | 0.21 | 1.72 | 37.28 | 39.82* |
| Hypertension | |||||||
| No | 7.53 | 3.25 | 0.59 | 0.13 | 1.42 | 23.33 | 24.88 |
| Yes | 9.66 | 4.65 | 0.63 | 0.14 | 1.39 | 30.06 | 31.88* |
| Diabetes | |||||||
| No | 8.61 | 3.79 | 0.61 | 0.14 | 1.45 | 26.03 | 27.66 |
| Yes | 8.92 | 4.73 | 0.62 | 0.12 | 1.26 | 30.11 | 32.01* |
| Age (y) | |||||||
| 65–69 | 4.28 | 2.16 | 0.46 | 0.11 | 1.08 | 15.51 | 16.76 |
| 70–74 | 7.02 | 3.36 | 0.64 | 0.15 | 1.41 | 22.15 | 23.66 |
| 75–79 | 9.90 | 4.59 | 0.76 | 0.16 | 1.56 | 28.57 | 30.41 |
| 80–84 | 11.76 | 5.25 | 0.71 | 0.13 | 1.56 | 34.06 | 35.89 |
| 85 or older | 10.97 | 4.87 | 0.45 | 0.11 | 1.41 | 36.40 | 38.53 |
| Gender | |||||||
| Men | 7.12 | 3.45 | 0.74 | 0.13 | 1.29 | 24.26 | 25.89 |
| Women | 10.02 | 4.49 | 0.50 | 0.14 | 1.50 | 29.30 | 31.06 |
| Race/ethnicity | |||||||
| NH-Whites | 8.85 | 4.00 | 0.62 | 0.14 | 1.48 | 27.24 | 28.89 |
| NH-Blacks | 8.68 | 5.05 | 0.45 | 0.15 | 1.17 | 27.62 | 29.61 |
| NH-Asians/Pacific Islanders | 7.31 | 3.36 | 0.58 | 0.07 | 0.99 | 24.99 | 26.85 |
| Hispanics | 7.89 | 3.24 | 0.64 | 0.09 | 1.02 | 24.85 | 26.58 |
| Others | 7.08 | 3.54 | 0.82 | 0.10 | 1.57 | 24.85 | 26.49 |
| Unknown/missing | 8.59 | 3.88 | 0.60 | 0.16 | 0.93 | 25.00 | 27.02 |
| Marital status | |||||||
| Married | 7.99 | 3.46 | 0.70 | 0.15 | 1.45 | 23.97 | 25.58 |
| Unmarried | 9.38 | 4.60 | 0.51 | 0.11 | 1.34 | 30.08 | 31.89 |
| Unknown | 8.81 | 3.81 | 0.62 | 0.19 | 1.49 | 27.06 | 28.61 |
| Tumor stage | |||||||
| Local | 11.46 | 5.16 | 0.87 | 0.19 | 1.95 | 32.38 | 34.36 |
| Regional | 9.04 | 4.14 | 0.61 | 0.12 | 1.38 | 28.01 | 29.74 |
| Distant | 1.99 | 1.04 | 0.07 | 0.02 | 0.36 | 12.62 | 13.52 |
| Unknown/Missing | 7.21 | 4.18 | 0.34 | 0.13 | 0.79 | 26.5 | 28.56 |
| Tumor grade | |||||||
| Well-differentiated | 10.63 | 4.73 | 0.74 | 0.21 | 1.64 | 30.43 | 32.25 |
| Moderately-differentiated | 9.32 | 4.24 | 0.66 | 0.14 | 1.45 | 28.14 | 29.92 |
| Poorly-differentiated | 7.31 | 3.4 | 0.43 | 0.11 | 1.31 | 24.10 | 25.63 |
| Unknown/Missing | 6.72 | 3.42 | 0.55 | 0.11 | 1.18 | 23.89 | 25.44 |
| Tumor site | |||||||
| Colon | 9.03 | 4.17 | 0.62 | 0.13 | 1.46 | 27.72 | 29.46 |
| Rectal | 7.63 | 3.53 | 0.57 | 0.14 | 1.23 | 24.77 | 26.35 |
| Chemotherapy | |||||||
| No | 9.38 | 4.39 | 0.64 | 0.14 | 1.48 | 28.57 | 30.37 |
| Yes | 5.83 | 2.44 | 0.47 | 0.10 | 1.10 | 20.47 | 21.74 |
| Radiotherapy | |||||||
| No | 8.84 | 4.08 | 0.62 | 0.14 | 1.43 | 27.32 | 29.04 |
| Yes | 6.08 | 2.83 | 0.39 | 0.10 | 0.99 | 21.45 | 22.79 |
| Comorbidity Scores | |||||||
| 0 | 8.68 | 3.85 | 0.62 | 0.14 | 1.45 | 25.27 | 26.91 |
| 1 | 8.86 | 4.11 | 0.60 | 0.14 | 1.37 | 28.73 | 30.45 |
| ≥2 | 8.20 | 4.63 | 0.58 | 0.10 | 1.25 | 31.70 | 33.69 |
| SEER Areas | |||||||
| Connecticut | 10.98 | 7.96 | 0.75 | 0.28 | 1.57 | 31.46 | 33.71 |
| Detroit | 13.44 | 6.48 | 0.73 | 0.13 | 1.26 | 34.19 | 36.10 |
| Hawaii | 8.45 | 4.99 | 0.61 | 0.06 | 1.49 | 26.28 | 27.74 |
| Iowa | 8.01 | 3.21 | 0.50 | 0.05 | 1.06 | 26.42 | 27.51 |
| New Mexico | 7.08 | 3.12 | 0.48 | 0.06 | 1.10 | 24.99 | 26.30 |
| Seattle | 5.81 | 2.69 | 0.32 | 0.09 | 0.66 | 18.88 | 20.18 |
| Utah | 6.45 | 2.94 | 0.26 | 0.12 | 1.03 | 23.15 | 24.41 |
| Georgia | 6.55 | 2.23 | 0.36 | 0.12 | 0.98 | 21.48 | 22.88 |
| Kentucky | 8.95 | 2.87 | 0.67 | 0.10 | 1.01 | 28.58 | 29.76 |
| Louisiana | 5.98 | 2.61 | 0.40 | 0.15 | 1.03 | 21.84 | 23.37 |
| New Jersey | 10.58 | 4.70 | 0.79 | 0.18 | 1.88 | 29.69 | 32.00 |
| California | 7.94 | 3.51 | 0.67 | 0.13 | 1.73 | 26.70 | 28.48 |
| Total | 8.68 | 4.01 | 0.61 | 0.13 | 1.40 | 26.98 | 28.67 |
ADRD, Alzheimer’s disease and related dementias; AD, Alzheimer’s disease; Vascular, vascular dementia; DLB, dementia with Lewy bodies; FTD, frontotemporal degeneration and dementias; MCI, mild cognitive impairment; others, other dementias; total, any of above ADRD. *Comparisons of crude cumulative incidence rates of total ADRD by 4 vascular diseases were significant at p < 0.01.
Table 3 presents the incidence density rates of specific dementias and total ADRD by considering differential follow-up times of patients with colorectal cancer. The number of ADRD cases per 1,000 person-years were higher in those with vascular diseases than without (102.48 versus 62.38 for CVD, 131.39 versus 57.79 for stroke, 75.53 versus 56.51 for hypertension, and 86.89 versus 61.58 for diabetes; p < 0.01 for all 4 incidence density rate ratios). The incidence density rates also increased significantly by age from 28.57 ADRD cases per 1,000 person-years for age 65– 69 to 45.35 for age 70– 74, 68.89 for age 75– 79, 106.10 for age 80– 84, and 169.45 for age 80 or older. Tables 2 and 3 also present the crude cumulative incidence and incidence density rates of dementias by gender, race, tumor factors, comorbidity, chemotherapy, radiotherapy, calendar year of diagnosis, and SEER registries.
Table 3
Incidence-density of dementias by a history of vascular diseases
| Incidence-density of dementias (per 1,000 person-years) | |||||||
| Factors | AD | Vascular | DLB | FTD | MCI | Others | Total |
| Cardiovascular disease | |||||||
| No | 17.09 | 7.41 | 1.16 | 0.26 | 2.70 | 57.84 | 62.38 |
| Yes | 23.27 | 12.71 | 1.45 | 0.31 | 3.30 | 94.75 | 102.48* |
| Stroke | |||||||
| No | 16.00 | 6.37 | 1.05 | 0.22 | 2.53 | 53.73 | 57.79 |
| Yes | 29.35 | 18.61 | 2.08 | 0.52 | 4.28 | 119.87 | 131.39* |
| Hypertension | |||||||
| No | 15.34 | 6.37 | 1.15 | 0.25 | 2.80 | 52.30 | 56.51 |
| Yes | 19.83 | 18.61 | 1.23 | 0.27 | 2.73 | 70.06 | 75.53* |
| Diabetes | |||||||
| No | 16.99 | 7.28 | 1.15 | 0.26 | 2.75 | 57.12 | 61.58 |
| Yes | 20.76 | 10.72 | 1.37 | 0.27 | 2.80 | 80.30 | 86.89* |
| Age (y) | |||||||
| 65–69 | 6.79 | 3.39 | 0.71 | 0.18 | 1.69 | 26.23 | 28.57 |
| 70–74 | 12.10 | 5.66 | 1.06 | 0.26 | 2.36 | 41.90 | 45.35 |
| 75–79 | 19.56 | 8.78 | 1.43 | 0.30 | 2.94 | 63.64 | 68.89 |
| 80–84 | 29.03 | 12.46 | 1.63 | 0.29 | 3.62 | 98.59 | 106.10 |
| 85 or older | 38.45 | 16.40 | 1.48 | 0.36 | 4.64 | 156.45 | 169.45 |
| Gender | |||||||
| Men | 14.84 | 7.05 | 1.49 | 0.25 | 2.61 | 55.82 | 60.35 |
| Women | 20.18 | 8.75 | 0.95 | 0.27 | 2.89 | 66.78 | 71.95 |
| Race/ethnicity | |||||||
| NH-Whites | 17.90 | 7.88 | 1.20 | 0.27 | 2.89 | 61.65 | 66.30 |
| NH-Blacks | 20.92 | 11.88 | 1.04 | 0.33 | 2.70 | 74.99 | 81.89 |
| NH-Asians/Pacific Islanders | 14.34 | 6.41 | 1.09 | 0.13 | 1.87 | 54.98 | 60.36 |
| Hispanics | 17.25 | 6.85 | 1.33 | 0.19 | 2.13 | 60.52 | 65.91 |
| Others | 11.71 | 5.72 | 1.31 | 0.16 | 2.52 | 45.16 | 48.81 |
| Unknown/missing | 14.42 | 6.33 | 0.97 | 0.26 | 1.50 | 46.17 | 50.79 |
| Marital status | |||||||
| Married | 14.58 | 6.15 | 1.23 | 0.27 | 2.57 | 47.98 | 51.86 |
| Unmarried | 21.88 | 10.41 | 1.14 | 0.24 | 2.99 | 80.5 | 86.85 |
| Unknown | 18.62 | 7.84 | 1.26 | 0.39 | 3.03 | 64.5 | 69.11 |
| Tumor stage | |||||||
| Local | 18.49 | 8.08 | 1.34 | 0.30 | 3.01 | 58.57 | 63.12 |
| Regional | 17.62 | 7.87 | 1.15 | 0.23 | 2.59 | 61.08 | 65.76 |
| Distant | 12.81 | 6.64 | 0.43 | 0.12 | 2.32 | 87.6 | 94.6 |
| Unknown/Missing | 16.71 | 9.51 | 0.75 | 0.29 | 1.75 | 70.23 | 77.24 |
| Tumor grade | |||||||
| Well-differentiated | 17.96 | 7.76 | 1.19 | 0.34 | 2.66 | 57.75 | 62.05 |
| Moderately-differentiated | 17.84 | 7.91 | 1.21 | 0.25 | 2.68 | 60.28 | 65.04 |
| Poorly-differentiated | 17.85 | 8.08 | 1.02 | 0.26 | 3.07 | 65.88 | 71.07 |
| Unknown/Missing | 17.08 | 8.48 | 1.34 | 0.27 | 2.90 | 67.68 | 73.15 |
| Tumor site | |||||||
| Colon | 18.58 | 8.34 | 1.22 | 0.26 | 2.88 | 64.07 | 69.16 |
| Rectal | 15.39 | 6.96 | 1.10 | 0.27 | 2.41 | 55.12 | 59.38 |
| Chemotherapy | |||||||
| No | 19.26 | 8.77 | 1.26 | 0.28 | 2.91 | 65.99 | 71.26 |
| Yes | 11.77 | 4.82 | 0.91 | 0.2 | 2.16 | 45.18 | 48.54 |
| Radiotherapy | |||||||
| No | 18.05 | 8.11 | 1.22 | 0.27 | 2.80 | 62.48 | 67.43 |
| Yes | 12.87 | 5.87 | 0.79 | 0.20 | 2.04 | 49.74 | 53.38 |
| Comorbidity Scores | |||||||
| 0 | 16.24 | 7.01 | 1.11 | 0.25 | 2.60 | 52.19 | 56.34 |
| 1 | 19.66 | 8.87 | 1.27 | 0.30 | 2.93 | 72.63 | 78.19 |
| ≥2 | 24.39 | 13.44 | 1.66 | 0.27 | 3.56 | 111.41 | 120.88 |
| SEER Areas | |||||||
| Connecticut | 21.18 | 15.02 | 1.38 | 0.50 | 2.89 | 68.68 | 74.89 |
| Detroit | 26.53 | 12.31 | 1.35 | 0.23 | 2.34 | 76.75 | 82.44 |
| Hawaii | 15.18 | 8.74 | 1.04 | 0.10 | 2.57 | 52.90 | 56.62 |
| Iowa | 14.53 | 5.70 | 0.87 | 0.09 | 1.87 | 53.32 | 56.00 |
| New Mexico | 14.04 | 6.05 | 0.92 | 0.11 | 2.11 | 55.63 | 59.11 |
| Seattle | 11.23 | 5.11 | 0.61 | 0.16 | 1.25 | 39.22 | 42.34 |
| Utah | 12.43 | 5.55 | 0.49 | 0.23 | 1.94 | 49.34 | 52.51 |
| Georgia | 15.43 | 5.13 | 0.81 | 0.26 | 2.25 | 55.21 | 59.54 |
| Kentucky | 20.2 | 6.27 | 1.44 | 0.21 | 2.19 | 73.78 | 77.55 |
| Louisiana | 13.43 | 5.74 | 0.87 | 0.33 | 2.25 | 53.16 | 57.64 |
| New Jersey | 23.76 | 10.2 | 1.68 | 0.37 | 4.03 | 75.08 | 82.63 |
| California | 15.99 | 6.89 | 1.29 | 0.26 | 3.36 | 60.47 | 65.60 |
| Total | 17.76 | 7.99 | 1.19 | 0.26 | 2.76 | 61.75 | 66.62 |
*Comparisons of crude incidence density rates of total ADRD by 4 vascular diseases were significant at p < 0.01.
Table 4 presents the time to event Cox regression analyses on the risk of dementias after controlling for multiple confounding factors. Patients with CVD (adjusted hazard ratio: 1.17, 95% CI: 1.14–1.20), stroke (1.65, 1.62–1.68), hypertension (1.07, 1.05–1.09), and diabetes (1.26, 1.24–1.29) had significantly elevated risks of developing any dementias (ADRD) than those who did not have these conditions after adjusting for age, gender, race/ethnicity, marital status, tumor stage, tumor grade, tumor site, comorbidity score, chemotherapy, radiation therapy, year of diagnosis, and SEER areas. Men and women who were diagnosed with colorectal cancer and who also had a history of CVD, stroke, hypertension, and diabetes had a significantly higher risk of AD, vascular dementia, and other dementias than those who did not have these diseases. Stroke was significantly associated with a higher risk for all kinds of dementias (including dementia with Lewy bodies, FTD, and MCI). In contrast, CVD and hypertension were not significantly associated with the risk of dementia with Lewy bodies, FTD, and MCI. Diabetes was associated with a significantly higher risk of dementia with Lewy bodies but was not significantly associated with the risk of FTD or MCI.
Table 4
Hazard ratio of dementias by combination of vascular diseases (CVD, stroke, hypertension and diabetes) in patients with colorectal cancer
| Hazard ratio (95% confidence intervals)* of dementias by the number of vascular diseases present | |||||||
| Risk factors | AD | Vascular | DLB | FTD | MCI | Others | Total |
| Status of 4 vascular diseases (CVD, stroke, hypertension, and diabetes) | |||||||
| None | 1.00 | 1.00 | 1.00 | 1.00 | 1.00 | 1.00 | 1.00 |
| 1 of 4 risk factors | 1.12 (1.07–1.16) | 1.29 (1.22–1.36) | 1.05 (0.91–1.20) | 1.26 (0.94–1.68) | 0.90 (0.83–0.99) | 1.17 (1.15–1.20) | 1.18 (1.15–1.20) |
| 2 of 4 risk factors | 1.31 (1.25–1.36) | 1.73 (1.62–1.84) | 1.23 (1.05–1.43) | 1.24 (0.88–1.74) | 1.06 (0.96–1.17) | 1.48 (1.45–1.52) | 1.49 (1.45–1.52) |
| 3 of 4 risk factors | 1.66 (1.57–1.75) | 2.87 (2.65–3.10) | 1.57 (1.27–1.95) | 1.70 (1.06–2.73) | 1.30 (1.12–1.50) | 1.97 (1.91–2.04) | 1.98 (1.92–2.05) |
| 4 of 4 risk factors | 2.03 (1.82–2.27) | 3.50 (3.06–4.01) | 1.90 (1.25–2.88) | 3.15 (1.44–6.91) | 1.15 (0.83–1.61) | 2.46 (2.32–2.60) | 2.46 (2.33–2.60) |
| Age (y) | |||||||
| 65–69 | 1.00 | 1.00 | 1.00 | 1.00 | 1.00 | 1.00 | 1.00 |
| 70–74 | 1.75 (1.65–1.86) | 1.57 (1.44–1.70) | 1.52 (1.26–1.82) | 1.45 (1.00–2.09) | 1.39 (1.23–1.57) | 1.53 (1.48–1.58) | 1.51 (1.47–1.56) |
| 75–79 | 2.84 (2.69–3.00) | 2.35 (2.17–2.54) | 2.16 (1.81–2.58) | 1.72 (1.19–2.49) | 1.74 (1.55–1.96) | 2.24 (2.17–2.31) | 2.21 (2.15–2.27) |
| 80–84 | 4.30 (4.07–4.55) | 3.21 (2.96–3.48) | 2.68 (2.22–3.24) | 1.78 (1.18–2.68) | 2.21 (1.95–2.50) | 3.28 (3.19–3.39) | 3.20 (3.11–3.30) |
| 85 or older | 5.93 (5.59–6.29) | 4.08 (3.75–4.44) | 2.81 (2.26–3.50) | 2.44 (1.57–3.80) | 2.91 (2.55–3.33) | 4.77 (4.62–4.92) | 4.65 (4.51–4.79) |
| Gender | |||||||
| Women versus Men | 1.08 (1.04–1.11) | 0.95 (0.91–1.00) | 0.56 (0.49–0.63) | 1.05 (0.82–1.35) | 0.98 (0.91–1.06) | 0.95 (0.93–0.96) | 0.95 (0.93–0.96) |
| Race ðnicity | |||||||
| NH-White | 1.00 | 1.00 | 1.00 | 1.00 | 1.00 | 1.00 | 1.00 |
| NH-Black | 1.18 (1.12–1.25) | 1.46 (1.36–1.57) | 0.92 (0.73–1.17) | 1.26 (0.83–1.92) | 0.99 (0.85–1.14) | 1.18 (1.15–1.22) | 1.2 (1.16–1.23) |
| NH–Asians/Pacific Islander | 0.90 (0.83–0.98) | 0.84 (0.74–0.95) | 0.85 (0.64–1.14) | 0.51 (0.23–1.12) | 0.52 (0.42–0.64) | 0.94 (0.9–0.98) | 0.95 (0.92–1.00) |
| Hispanic | 1.15 (1.07–1.23) | 0.95 (0.86–1.06) | 1.12 (0.88–1.42) | 0.73 (0.39–1.35) | 0.66 (0.55–0.79) | 1.04 (1.00–1.08) | 1.04 (1.01–1.08) |
| Others | 0.79 (0.68–0.90) | 0.78 (0.64–0.96) | 1.14 (0.75–1.72) | 0.63 (0.2–2.02) | 0.78 (0.58–1.05) | 0.86 (0.8–0.92) | 0.87 (0.81–0.93) |
| Unknown/missing | 0.81 (0.69–0.95) | 0.80 (0.63–1.01) | 0.74 (0.41–1.35) | 0.80 (0.25–2.51) | 0.46 (0.28–0.74) | 0.76 (0.69–0.84) | 0.78 (0.71–0.85) |
| Marital status | |||||||
| Married cases | 1.00 | 1.00 | 1.00 | 1.00 | 1.00 | 1.00 | 1.00 |
| Unmarried cases | 1.09 (1.06–1.13) | 1.27 (1.21–1.33) | 1.01 (0.89–1.14) | 0.75 (0.57–0.98) | 1.00 (0.92–1.08) | 1.24 (1.21–1.26) | 1.23 (1.21–1.25) |
| Unknown cases | 1.06 (0.99–1.14) | 1.09 (0.98–1.21) | 1.06 (0.81–1.38) | 1.29 (0.79–2.10) | 1.17 (0.99–1.39) | 1.15 (1.10–1.19) | 1.13 (1.09–1.18) |
| Tumor stage | |||||||
| Local | 1.00 | 1.00 | 1.00 | 1.00 | 1.00 | 1.00 | 1.00 |
| Regional | 1.02 (0.98–1.05) | 1.06 (1.00–1.11) | 0.95 (0.84–1.08) | 0.86 (0.65–1.13) | 0.88 (0.81–0.96) | 1.07 (1.05–1.09) | 1.07 (1.05–1.09) |
| Distant | 0.86 (0.80–0.93) | 0.88 (0.79–0.98) | 0.44 (0.29–0.65) | 0.52 (0.24–1.12) | 0.80 (0.66–0.95) | 1.25 (1.21–1.29) | 1.24 (1.20–1.28) |
| Unknown/Missing | 0.72 (0.67–0.77) | 0.99 (0.90–1.10) | 0.43 (0.31–0.61) | 0.85 (0.48–1.49) | 0.38 (0.31–0.48) | 0.90 (0.87–0.94) | 0.93 (0.89–0.96) |
| Tumor grade | |||||||
| Well-differentiated | 1.00 | 1.00 | 1.00 | 1.00 | 1.00 | 1.00 | 1.00 |
| Moderately-differentiated | 1.02 (0.97–1.07) | 1.07 (1.00–1.15) | 1.08 (0.90–1.30) | 0.84 (0.59–1.21) | 1.07 (0.94–1.21) | 1.02 (0.99–1.05) | 1.02 (1.00–1.05) |
| Poorly-differentiated | 1.01 (0.95–1.07) | 1.09 (1.00–1.19) | 0.99 (0.78–1.24) | 0.94 (0.60–1.47) | 1.23 (1.06–1.42) | 1.04 (1.00–1.08) | 1.05 (1.01–1.08) |
| Unknown/Missing | 1.03 (0.97–1.10) | 1.11 (1.01–1.22) | 1.27 (1.01–1.60) | 0.82 (0.51–1.32) | 1.21 (1.03–1.41) | 1.12 (1.08–1.16) | 1.12 (1.08–1.16) |
| Tumor site | |||||||
| Rectal versus Colon | 0.99 (0.96–1.03) | 1.01 (0.96–1.07) | 0.97 (0.85–1.11) | 1.20 (0.90–1.58) | 0.93 (0.85–1.02) | 1.02 (1.00–1.04) | 1.02 (0.99–1.04) |
| Chemotherapy | |||||||
| Yes versus No | 0.79 (0.75–0.83) | 0.68 (0.64–0.74) | 0.89 (0.75–1.05) | 0.87 (0.61–1.25) | 0.92 (0.83–1.03) | 0.83 (0.81–0.85) | 0.83 (0.81–0.85) |
| Radiotherapy | |||||||
| Yes versus No | 0.96 (0.88–1.03) | 0.93 (0.83–1.04) | 0.78 (0.57–1.07) | 0.81 (0.44–1.50) | 0.94 (0.77–1.14) | 0.98 (0.94–1.02) | 0.98 (0.94–1.02) |
| Comorbidity Scores | |||||||
| 0 | 1.00 | 1.00 | 1.00 | 1.00 | 1.00 | 1.00 | 1.00 |
| 1 | 1.09 (1.05–1.12) | 1.09 (1.04–1.15) | 1.10 (0.97–1.24) | 1.17 (0.90–1.52) | 1.08 (0.99–1.17) | 1.20 (1.17–1.22) | 1.19 (1.17–1.21) |
| ≥2 | 1.22 (1.16–1.28) | 1.36 (1.27–1.46) | 1.34 (1.11–1.62) | 1.04 (0.66–1.63) | 1.25 (1.10–1.42) | 1.50 (1.46–1.54) | 1.49 (1.46–1.53) |
| SEER Areas | |||||||
| Connecticut | 1.30 (1.23–1.37) | 2.15 (2.00–2.30) | 1.02 (0.83–1.25) | 1.72 (1.19–2.49) | 0.74 (0.65–0.85) | 1.13 (1.10–1.17) | 1.14 (1.11–1.18) |
| Detroit | 1.61 (1.53–1.69) | 1.56 (1.45–1.68) | 0.98 (0.80–1.21) | 0.75 (0.46–1.21) | 0.60 (0.52–0.70) | 1.20 (1.17–1.24) | 1.19 (1.16–1.23) |
| Hawaii | 1.23 (1.08–1.40) | 1.70 (1.43–2.02) | 0.80 (0.50–1.28) | 0.57 (0.13–2.43) | 1.01 (0.75–1.37) | 1.12 (1.04–1.21) | 1.10 (1.02–1.18) |
| Iowa | 0.92 (0.87–0.98) | 0.89 (0.81–0.98) | 0.67 (0.53–0.84) | 0.33 (0.17–0.64) | 0.48 (0.41–0.56) | 0.95 (0.92–0.98) | 0.93 (0.90–0.95) |
| New Mexico | 1.00 (0.90–1.11) | 1.09 (0.92–1.28) | 0.71 (0.47–1.07) | 0.44 (0.14–1.40) | 0.66 (0.50–0.86) | 1.08 (1.02–1.14) | 1.06 (1.00–1.12) |
| Seattle | 0.76 (0.70–0.82) | 0.84 (0.75–0.95) | 0.48 (0.34–0.66) | 0.60 (0.31–1.16) | 0.34 (0.27–0.43) | 0.72 (0.69–0.75) | 0.72 (0.69–0.75) |
| Utah | 0.86 (0.77–0.97) | 0.95 (0.81–1.13) | 0.38 (0.22–0.66) | 0.83 (0.36–1.91) | 0.53 (0.40–0.70) | 0.95 (0.90–1.01) | 0.94 (0.88–0.99) |
| Georgia | 1.10 (1.03–1.18) | 0.78 (0.70–0.88) | 0.72 (0.54–0.95) | 1.03 (0.61–1.73) | 0.66 (0.56–0.79) | 0.98 (0.94–1.02) | 0.97 (0.93–1.01) |
| Kentucky | 1.44 (1.35–1.53) | 0.98 (0.88–1.09) | 1.19 (0.94–1.50) | 0.77 (0.43–1.38) | 0.62 (0.52–0.74) | 1.32 (1.27–1.36) | 1.27 (1.23–1.32) |
| Louisiana | 0.93 (0.86–1.01) | 0.83 (0.73–0.94) | 0.74 (0.54–1.01) | 1.20 (0.70–2.05) | 0.65 (0.53–0.79) | 0.91 (0.88–0.96) | 0.91 (0.87–0.95) |
| New Jersey | 1.44 (1.37–1.51) | 1.34 (1.25–1.44) | 1.28 (1.08–1.51) | 1.29 (0.89–1.85) | 1.09 (0.98–1.21) | 1.13 (1.10–1.17) | 1.15 (1.12–1.18) |
| California | 1.00 | 1.00 | 1.00 | 1.00 | 1.00 | 1.00 | 1.00 |
*Hazard ratios adjusted for the following variables: age, gender, race/ethnicity, marital status, tumor stage, tumor grade, tumor site, comorbidity score, chemotherapy, radiation therapy, year of diagnosis, and SEER areas.
The hazard ratios of dementias (AD, vascular dementia, dementia with Lewy bodies, FTD, MCI, other dementias, and total ADRD) increased significantly with age. For example, the hazard ratio of AD was 1.75 (95% confidence intervals: 1.65–1.85) for patients aged 70–74, 2.83 (2.68–2.99) for patients aged 75–79, 4.26 (4.03–4.51) for patients aged 80–84, and 5.85 (5.51–6.20) for patients aged≥85 as compared to patients aged 65–69 years after adjusting for vascular diseases, gender, race/ethnicity, marital status, tumor stage, tumor grade, tumor site, comorbidity score, chemotherapy, radiation therapy, year of diagnosis, and SEER areas. Women had a significantly higher risk than men for AD (1.08, 1.05–1.12), but had a significantly lower risk for dementia with Lewy bodies (0.56, 0.50–0.63), other dementias (0.95, 0.94–0.97), and total ADRD (0.95, 0.94–0.97). There were no significant differences in the risk of vascular dementia, FTD, and MCI between men and women. As compared to NH-whites, NH-blacks had a significantly higher hazard ratio of AD (1.20, 1.13–1.27), vascular dementia (1.51, 1.40–1.62), other dementia (1.20, 1.17–1.24), and total ADRD (1.22, 1.18–1.25). NH-Asians had a significantly lower hazard ratio of AD, vascular dementia, MCI, and other dementias. In addition, Hispanics had a significantly elevated risk of AD, other dementias and total ADRD but a lower risk of MCI. Unmarried patients with colorectal cancer were more likely to develop AD, vascular dementia, other dementias, and total ADRD than married ones. The risk of ADRD was not consistently associated with tumor stage, grade, or site. However, those with distant tumor stage had a significantly decreased risk of AD, vascular dementia, dementia with Lewy bodies, and MCI, but had an increased risk of other dementias and total ADRD. Chemotherapy appeared to be associated with a significantly lower risk of AD, vascular dementia, other dementias, and total ADRD, but radiotherapy was not significantly associated with the risk of any types of ADRD. Those with higher comorbidity scores had a significantly higher risk of all types of dementias and total ADRD except for FTD. There were also some geographic differences observed by SEER registry areas in the risk of various dementias after adjusting for vascular diseases, gender, race/ethnicity, marital status, tumor stage, tumor grade, tumor site, comorbidity score, chemotherapy, radiation therapy, and year of diagnosis.
Table 5 presents the risk of various types of dementia in association with the number of vascular diseases that were present (CVD, stroke, hypertension, and diabetes). As compared to patients who did not have any of these diseases, those with≥3 of these diseases were significantly more likely to develop any dementias (including AD, vascular dementia, and total ADRD). A dose-response relationship was observed between the risk of all types of dementias and the number of 4 vascular diseases present. For instance, the risk of AD increased from 1.12 (1.07–1.16) to 1.31 (1.25–1.36), 1.66 (1.57–1.75), and 2.03 (1.82–2.27) from the presence of 1 disease to 2, 3, and 4 vascular diseases present as compared to those who did not have any of these diseases. Moreover, the 95% confidence intervals of these hazard ratios for AD, vascular dementia, and total ADRD did not overlap. These findings on the associations between the risk of various types of dementias and sociodemographic or tumor factors after adjusting for the combination of vascular diseases are similar to what were presented in Table 4 above after adjusting for individual vascular diseases.
Table 5
Hazard ratio of dementias by combination of vascular diseases (CVD, stroke, hypertension and diabetes) in patients with colorectal cancer
| Hazard ratio (95% confidence intervals)* of dementias by the number of vascular diseases present | |||||||
| Risk factors | AD | Vascular | DLB | FTD | MCI | Others | Total |
| Status of 4 vascular diseases (CVD, stroke, hypertension, and diabetes) | |||||||
| None | 1.00 | 1.00 | 1.00 | 1.00 | 1.00 | 1.00 | 1.00 |
| 1 of 4 risk factors | 1.12 (1.07–1.16) | 1.29 (1.22–1.36) | 1.05 (0.91–1.20) | 1.26 (0.94–1.68) | 0.90 (0.83–0.99) | 1.17 (1.15–1.20) | 1.18 (1.15–1.20) |
| 2 of 4 risk factors | 1.31 (1.25–1.36) | 1.73 (1.62–1.84) | 1.23 (1.05–1.43) | 1.24 (0.88–1.74) | 1.06 (0.96–1.17) | 1.48 (1.45–1.52) | 1.49 (1.45–1.52) |
| 3 of 4 risk factors | 1.66 (1.57–1.75) | 2.87 (2.65–3.10) | 1.57 (1.27–1.95) | 1.70 (1.06–2.73) | 1.30 (1.12–1.50) | 1.97 (1.91–2.04) | 1.98 (1.92–2.05) |
| 4 of 4 risk factors | 2.03 (1.82–2.27) | 3.50 (3.06–4.01) | 1.90 (1.25–2.88) | 3.15 (1.44–6.91) | 1.15 (0.83–1.61) | 2.46 (2.32–2.60) | 2.46 (2.33–2.60) |
| Age (y) | |||||||
| 65–69 | 1.00 | 1.00 | 1.00 | 1.00 | 1.00 | 1.00 | 1.00 |
| 70–74 | 1.75 (1.65–1.86) | 1.57 (1.44–1.70) | 1.52 (1.26–1.82) | 1.45 (1.00–2.09) | 1.39 (1.23–1.57) | 1.53 (1.48–1.58) | 1.51 (1.47–1.56) |
| 75–79 | 2.84 (2.69–3.00) | 2.35 (2.17–2.54) | 2.16 (1.81–2.58) | 1.72 (1.19–2.49) | 1.74 (1.55–1.96) | 2.24 (2.17–2.31) | 2.21 (2.15–2.27) |
| 80–84 | 4.30 (4.07–4.55) | 3.21 (2.96–3.48) | 2.68 (2.22–3.24) | 1.78 (1.18–2.68) | 2.21 (1.95–2.50) | 3.28 (3.19–3.39) | 3.20 (3.11–3.30) |
| 85 or older | 5.93 (5.59–6.29) | 4.08 (3.75–4.44) | 2.81 (2.26–3.50) | 2.44 (1.57–3.80) | 2.91 (2.55–3.33) | 4.77 (4.62–4.92) | 4.65 (4.51–4.79) |
| Gender | |||||||
| Women versus Men | 1.08 (1.04–1.11) | 0.95 (0.91–1.00) | 0.56 (0.49–0.63) | 1.05 (0.82–1.35) | 0.98 (0.91–1.06) | 0.95 (0.93–0.96) | 0.95 (0.93–0.96) |
| Race ðnicity | |||||||
| NH-White | 1.00 | 1.00 | 1.00 | 1.00 | 1.00 | 1.00 | 1.00 |
| NH-Black | 1.18 (1.12–1.25) | 1.46 (1.36–1.57) | 0.92 (0.73–1.17) | 1.26 (0.83–1.92) | 0.99 (0.85–1.14) | 1.18 (1.15–1.22) | 1.2 (1.16–1.23) |
| NH–Asians/Pacific Islander | 0.90 (0.83–0.98) | 0.84 (0.74–0.95) | 0.85 (0.64–1.14) | 0.51 (0.23–1.12) | 0.52 (0.42–0.64) | 0.94 (0.9–0.98) | 0.95 (0.92–1.00) |
| Hispanic | 1.15 (1.07–1.23) | 0.95 (0.86–1.06) | 1.12 (0.88–1.42) | 0.73 (0.39–1.35) | 0.66 (0.55–0.79) | 1.04 (1.00–1.08) | 1.04 (1.01–1.08) |
| Others | 0.79 (0.68–0.90) | 0.78 (0.64–0.96) | 1.14 (0.75–1.72) | 0.63 (0.2–2.02) | 0.78 (0.58–1.05) | 0.86 (0.8–0.92) | 0.87 (0.81–0.93) |
| Unknown/missing | 0.81 (0.69–0.95) | 0.80 (0.63–1.01) | 0.74 (0.41–1.35) | 0.80 (0.25–2.51) | 0.46 (0.28–0.74) | 0.76 (0.69–0.84) | 0.78 (0.71–0.85) |
| Marital status | |||||||
| Married cases | 1.00 | 1.00 | 1.00 | 1.00 | 1.00 | 1.00 | 1.00 |
| Unmarried cases | 1.09 (1.06–1.13) | 1.27 (1.21–1.33) | 1.01 (0.89–1.14) | 0.75 (0.57–0.98) | 1.00 (0.92–1.08) | 1.24 (1.21–1.26) | 1.23 (1.21–1.25) |
| Unknown cases | 1.06 (0.99–1.14) | 1.09 (0.98–1.21) | 1.06 (0.81–1.38) | 1.29 (0.79–2.10) | 1.17 (0.99–1.39) | 1.15 (1.10–1.19) | 1.13 (1.09–1.18) |
| Tumor stage | |||||||
| Local | 1.00 | 1.00 | 1.00 | 1.00 | 1.00 | 1.00 | 1.00 |
| Regional | 1.02 (0.98–1.05) | 1.06 (1.00–1.11) | 0.95 (0.84–1.08) | 0.86 (0.65–1.13) | 0.88 (0.81–0.96) | 1.07 (1.05–1.09) | 1.07 (1.05–1.09) |
| Distant | 0.86 (0.80–0.93) | 0.88 (0.79–0.98) | 0.44 (0.29–0.65) | 0.52 (0.24–1.12) | 0.80 (0.66–0.95) | 1.25 (1.21–1.29) | 1.24 (1.20–1.28) |
| Unknown/Missing | 0.72 (0.67–0.77) | 0.99 (0.90–1.10) | 0.43 (0.31–0.61) | 0.85 (0.48–1.49) | 0.38 (0.31–0.48) | 0.90 (0.87–0.94) | 0.93 (0.89–0.96) |
| Tumor grade | |||||||
| Well-differentiated | 1.00 | 1.00 | 1.00 | 1.00 | 1.00 | 1.00 | 1.00 |
| Moderately-differentiated | 1.02 (0.97–1.07) | 1.07 (1.00–1.15) | 1.08 (0.90–1.30) | 0.84 (0.59–1.21) | 1.07 (0.94–1.21) | 1.02 (0.99–1.05) | 1.02 (1.00–1.05) |
| Poorly-differentiated | 1.01 (0.95–1.07) | 1.09 (1.00–1.19) | 0.99 (0.78–1.24) | 0.94 (0.60–1.47) | 1.23 (1.06–1.42) | 1.04 (1.00–1.08) | 1.05 (1.01–1.08) |
| Unknown/Missing | 1.03 (0.97–1.10) | 1.11 (1.01–1.22) | 1.27 (1.01–1.60) | 0.82 (0.51–1.32) | 1.21 (1.03–1.41) | 1.12 (1.08–1.16) | 1.12 (1.08–1.16) |
| Rectal versus Colon | 0.99 (0.96–1.03) | 1.01 (0.96–1.07) | 0.97 (0.85–1.11) | 1.20 (0.90–1.58) | 0.93 (0.85–1.02) | 1.02 (1.00–1.04) | 1.02 (0.99–1.04) |
| Chemotherapy | |||||||
| Yes versus No | 0.79 (0.75–0.83) | 0.68 (0.64–0.74) | 0.89 (0.75–1.05) | 0.87 (0.61–1.25) | 0.92 (0.83–1.03) | 0.83 (0.81–0.85) | 0.83 (0.81–0.85) |
| Radiotherapy | |||||||
| Yes versus No | 0.96 (0.88–1.03) | 0.93 (0.83–1.04) | 0.78 (0.57–1.07) | 0.81 (0.44–1.50) | 0.94 (0.77–1.14) | 0.98 (0.94–1.02) | 0.98 (0.94–1.02) |
| Comorbidity Scores | |||||||
| 0 | 1.00 | 1.00 | 1.00 | 1.00 | 1.00 | 1.00 | 1.00 |
| 1 | 1.09 (1.05–1.12) | 1.09 (1.04–1.15) | 1.10 (0.97–1.24) | 1.17 (0.90–1.52) | 1.08 (0.99–1.17) | 1.20 (1.17–1.22) | 1.19 (1.17–1.21) |
| ≥2 | 1.22 (1.16–1.28) | 1.36 (1.27–1.46) | 1.34 (1.11–1.62) | 1.04 (0.66–1.63) | 1.25 (1.10–1.42) | 1.50 (1.46–1.54) | 1.49 (1.46–1.53) |
| SEER Areas | |||||||
| Connecticut | 1.30 (1.23–1.37) | 2.15 (2.00–2.30) | 1.02 (0.83–1.25) | 1.72 (1.19–2.49) | 0.74 (0.65–0.85) | 1.13 (1.10–1.17) | 1.14 (1.11–1.18) |
| Detroit | 1.61 (1.53–1.69) | 1.56 (1.45–1.68) | 0.98 (0.80–1.21) | 0.75 (0.46–1.21) | 0.60 (0.52–0.70) | 1.20 (1.17–1.24) | 1.19 (1.16–1.23) |
| Hawaii | 1.23 (1.08–1.40) | 1.70 (1.43–2.02) | 0.80 (0.50–1.28) | 0.57 (0.13–2.43) | 1.01 (0.75–1.37) | 1.12 (1.04–1.21) | 1.10 (1.02–1.18) |
| Iowa | 0.92 (0.87–0.98) | 0.89 (0.81–0.98) | 0.67 (0.53–0.84) | 0.33 (0.17–0.64) | 0.48 (0.41–0.56) | 0.95 (0.92–0.98) | 0.93 (0.90–0.95) |
| New Mexico | 1.00 (0.90–1.11) | 1.09 (0.92–1.28) | 0.71 (0.47–1.07) | 0.44 (0.14–1.40) | 0.66 (0.50–0.86) | 1.08 (1.02–1.14) | 1.06 (1.00–1.12) |
| Seattle | 0.76 (0.70–0.82) | 0.84 (0.75–0.95) | 0.48 (0.34–0.66) | 0.60 (0.31–1.16) | 0.34 (0.27–0.43) | 0.72 (0.69–0.75) | 0.72 (0.69–0.75) |
| Utah | 0.86 (0.77–0.97) | 0.95 (0.81–1.13) | 0.38 (0.22–0.66) | 0.83 (0.36–1.91) | 0.53 (0.40–0.70) | 0.95 (0.90–1.01) | 0.94 (0.88–0.99) |
| Georgia | 1.10 (1.03–1.18) | 0.78 (0.70–0.88) | 0.72 (0.54–0.95) | 1.03 (0.61–1.73) | 0.66 (0.56–0.79) | 0.98 (0.94–1.02) | 0.97 (0.93–1.01) |
| Kentucky | 1.44 (1.35–1.53) | 0.98 (0.88–1.09) | 1.19 (0.94–1.50) | 0.77 (0.43–1.38) | 0.62 (0.52–0.74) | 1.32 (1.27–1.36) | 1.27 (1.23–1.32) |
| Louisiana | 0.93 (0.86–1.01) | 0.83 (0.73–0.94) | 0.74 (0.54–1.01) | 1.20 (0.70–2.05) | 0.65 (0.53–0.79) | 0.91 (0.88–0.96) | 0.91 (0.87–0.95) |
| New Jersey | 1.44 (1.37–1.51) | 1.34 (1.25–1.44) | 1.28 (1.08–1.51) | 1.29 (0.89–1.85) | 1.09 (0.98–1.21) | 1.13 (1.10–1.17) | 1.15 (1.12–1.18) |
| California | 1.00 | 1.00 | 1.00 | 1.00 | 1.00 | 1.00 | 1.00 |
*Hazard ratios adjusted for the following variables: age, gender, race/ethnicity, marital status, tumor stage, tumor grade, tumor site, comorbidity score, chemotherapy, radiation therapy, year of diagnosis, and SEER areas.
The cumulative incidences and the adjusted hazard ratios of AD, other types of dementias, and total ADRD that were defined by primary diagnosis only (Supplementary Tables 3 and 4) had similar patterns by main exposures (CVD, stroke, hypertension, and diabetes) and other sociodemographic and tumor factors when compared to the above results using any diagnosis code for ADRD. However, overall cumulative incidence rates of dementias were lower due to a more stringent definition of ADRD. After considering death before ADRD as a competing risk in the Fine and Gray regression models, the hazard ratios of AD, vascular dementia, other types of dementias, and total ADRD were still significantly increased in patients with CVD, stroke, and diabetes. In contrast, the risk of AD, other dementias and total ADRD was significantly lower in patients with hypertension (see Supplementary Table 5). For example, the hazard ratio of AD was 1.26 (1.24–1.28) for CVD, 1.23 (1.21–1.24) for stroke, 1.20 (1.18–1.22) for diabetes, and 0.94 (0.93–0.95) for hypertension.
Because AD and ADRD may take a long time to develop, those AD and ADRD cases that occurred within a short time period after the baseline of cancer diagnosis might not be due to the effects of main exposures. Hence, we have performed 2 additional analyses by expanding ‘washout’ periods, in which we repeated the cumulative incidence analyses by excluding incident AD and ADRD cases that occurred during the first 1 year and 5 years after the date of cancer diagnosis. These analyses also aimed to control for potential reverse causation bias that could be resulted from the effects of preclinical or prodromal dementia on susceptibility to vascular diseases. The results from these analyses showed that cumulative incidence of AD and ADRD were expectedly lower after excluding incident AD and ADRD cases that occurred during the first 1 year and 5 years after the date of cancer diagnosis. However, the patterns of these cumulative incidence rates (Supplementary Table 6) and the adjusted hazard ratios of developing AD or ADRD (Supplementary Table 7) by history of vascular diseases, age, gender, and race/ethnicity were similar to the results that did not exclude those cases (Tables 2 and 4). The time to event Cox regression models showed that the adjusted hazard ratios of developing AD or ADRD were similar to those in Table 4 that did not exclude those cases within 1 or 5 years, after adjusting for age as categorical variable (Supplementary Table 7) or as a continuous variable (Table 6). For example, after excluding any ADRD cases that occurred during the first 5 years after the baseline (i.e., the date of colorectal cancer diagnosis), patients with CVD (adjusted hazard ratio: 1.10, 95% CI: 1.07–1.14), stroke (1.42, 1.38–1.4768), hypertension (1.09, 1.06–1.12), and diabetes (1.24, 1.21–1.27) had significantly elevated risks of developing any dementias (ADRD) than those who did not have these conditions after adjusting for age (continuous), gender, race/ethnicity, marital status, tumor stage, tumor grade, tumor site, comorbidity score, chemotherapy, radiation therapy, year of diagnosis, and SEER areas (Table 6). The adjusted hazard ratio of developing AD was significantly higher in patients with CVD (1.12, 1.05–1.20), stroke (1.22, 1.15–1.29), hypertension (1.07, 1.02–1.12), and diabetes (1.17, 1.11–1.23), after adjusting for age as a continuous variable and other factors listed in the footnote of Table 6. Among patients diagnosed with colorectal cancer at age 65 or older, the adjusted risk of AD significantly increased by 8% (hazard ratio: 1.08, 1.07–1.08) with every one-year age increase and the adjusted risk of any dementias (ADRD) significantly increased by 6% (hazard ratio: 1.06, 1.06–1.07) with every one-year age increase. Similarly, the adjusted risk of AD significantly increased by 8% (1.08, 1.08–1.09) with every one-year age increase and the adjusted risk of ADRD significantly increased by 7% (1.07, 1.07–1.07) with every one-year age increase after including all incident dementia (ADRD) cases that occurred after the baseline (Table 6).
Table 6
Adjusted hazard ratio of AD and ADRD after excluding dementia cases
| Adjusted hazard ratio (95% CI)* of AD and ADRD by excluding dementia cases that occurred < 1 year or < 5 years after the baseline | ||||||
| Cases<1 year of baseline were excluded | Cases<5 years of baseline were excluded | All cases included after baseline | ||||
| Characteristics | AD | ADRD | AD | ADRD | AD | ADRD |
| Cardiovascular disease | ||||||
| Yes versus No | 1.13 (1.07–1.18) | 1.16 (1.13–1.18) | 1.12 (1.05–1.20) | 1.10 (1.07–1.14) | 1.12 (1.07–1.17) | 1.17 (1.14–1.19) |
| Stroke | ||||||
| Yes versus No | 1.39 (1.33–1.44) | 1.56 (1.53–1.60) | 1.22 (1.15–1.29) | 1.42 (1.38–1.47) | 1.47 (1.42–1.53) | 1.65 (1.62–1.68) |
| Hypertension | ||||||
| Yes versus No | 1.05 (1.01–1.08) | 1.05 (1.03–1.07) | 1.07 (1.02–1.12) | 1.09 (1.06–1.12) | 1.05 (1.01–1.08) | 1.07 (1.05–1.08) |
| Diabetes | ||||||
| Yes versus No | 1.18 (1.14–1.23) | 1.27 (1.24–1.3) | 1.17 (1.11–1.23) | 1.24 (1.21–1.27) | 1.19 (1.15–1.23) | 1.27 (1.25–1.30) |
| Age (≥65 y) | ||||||
| Age (continuous) | 1.08 (1.08–1.08) | 1.07 (1.07–1.07) | 1.08 (1.07–1.08) | 1.06 (1.06–1.07) | 1.08 (1.08–1.09) | 1.07 (1.07–1.07) |
| Gender | ||||||
| Women versus Men | 1.09 (1.05–1.13) | 0.96 (0.95–0.98) | 1.11 (1.06–1.16) | 1.01 (0.98–1.03) | 1.08 (1.04–1.12) | 0.95 (0.93–0.97) |
| Race/ethnicity | ||||||
| NH-Whites | 1.00 | 1.00 | 1.00 | 1.00 | 1.00 | 1.00 |
| NH-Blacks | 1.17 (1.10–1.24) | 1.17 (1.13–1.21) | 1.12 (1.03–1.21) | 1.07 (1.02–1.12) | 1.20 (1.13–1.26) | 1.22 (1.18–1.25) |
| NH-Asians/Pacific Islanders | 0.92 (0.84–1.01) | 0.99 (0.94–1.03) | 0.87 (0.78–0.97) | 0.95 (0.90–1.01) | 0.92 (0.85–1.00) | 0.98 (0.93–1.02) |
| Hispanics | 1.15 (1.07–1.24) | 1.06 (1.02–1.10) | 1.10 (1.00–1.21) | 1.01 (0.96–1.06) | 1.17 (1.09–1.25) | 1.07 (1.03–1.11) |
| Others | 0.81 (0.7–0.94) | 0.88 (0.81–0.95) | 0.82 (0.69–0.98) | 0.86 (0.79–0.95) | 0.79 (0.69–0.91) | 0.88 (0.82–0.95) |
| Unknown/missing | 0.82 (0.69–0.97) | 0.81 (0.74–0.90) | 0.87 (0.70–1.06) | 0.87 (0.78–0.98) | 0.82 (0.70–0.96) | 0.79 (0.72–0.86) |
AD, Alzheimer’s disease; ADRD, Alzheimer’s disease and related dementias including AD; Vascular, vascular dementia; DLB, dementia with Lewy bodies; FTD, frontotemporal degeneration and dementias; MCI, mild cognitive impairment; other dementias. **Hazard ratios adjusted for the following variables: age (continuous), gender, race/ethnicity, marital status, tumor stage, tumor grade, tumor site, comorbidity score, chemotherapy, radiation therapy, year of diagnosis, and SEER areas.
4DISCUSSION
This study examined a large cohort of older men and women who were diagnosed with colorectal cancer to determine the long-term risk of dementias (AD, other specific types of dementias, and total ADRD) in association with main vascular diseases (CVD, stroke, hypertension, and diabetes) and other factors. The 26-year incidence of total ADRD was higher in patients with CVD, stroke, hypertension, and diabetes than those without these diseases. This study observed that CVD, stroke, hypertension, and diabetes were significantly associated with an increased risk of developing AD, vascular dementia, other dementias, and total ADRD combined. The risk of AD increased significantly with increasing numbers of 4 vascular diseases present (CVD, stroke, hypertension, and diabetes) as compared to those without any of these diseases. The risk of AD, other specific dementias, and total ADRD increased significantly with age. Patients with aged 75–79, 80–84, and≥85 had over 2-, 4-, and 5-fold higher risks of AD, respectively, as compared to patients aged 65–69 years. Women had a significantly higher risk of AD but a significantly lower risk of dementia with Lewy bodies, other dementias, and total ADRD versus men. There were substantial different risks for ADRD by race/ethnicity. NH-blacks had a significantly higher risk of AD, vascular dementia, other dementia, and total ADRD. Asians had a significantly decreased risk of AD, vascular dementia, MCI, and other dementias. Hispanics had a significantly higher risk of AD, other dementia and total ADRD but a decreased risk of MCI as compared to NH-whites.
Numerous previous studies have demonstrated a strong relationship between the risk of dementia and/or cognitive declines and vascular diseases, including cardiovascular disease [6–8, 26], cerebrovascular disease [7, 8, 18], hypertension [11, 12, 15], and diabetes [9, 19] in general populations and in women with breast cancer [41]. Various risk factors might contribute to cognitive decline in those patients, such as deficits in cerebral blood flow leading to decreased oxygen and glucose supply or heart failure-related cerebral microembolism [7, 8, 10, 13, 14, 16, 21]. Hypertension and elevated blood pressures are associated with a higher risk of cognitive decline and dementia [20, 22]. Diabetes with or without the presence of risk factors such as hypertension and smoking were associated with a higher risk of MCI, AD, and vascular dementia [19, 23–25]. The pathophysiological mechanisms in which diabetes could increase the risk of ADRD include changes in the inflammatory balance triggered by diabetes and hyperinsulinemia, a higher risk of white matter hyperintensities, and glycogen synthase kinase-3 (a pivotal enzyme in glycogen synthesis) that promotes tau phosphorylation and its activity is regulated by amyloid-β peptide [33]. Studies also show that stroke is associated with an elevated risk of dementia, and that small microbleeding or cerebral infarcts are associated with an increased risk of cognitive impairment [30–32].
These associations between vascular factors and dementia were observed in community-based general populations [6, 7, 10, 15, 24–27, 35–40] as well as in those population-based cohort of patients with cancer [41]. For instance, among women diagnosed with breast cancer, patients with CVD (hazard ratio: 1.30; 95% confidence intervals: 1.27,1.33), stroke (1.50; 1.47,1.54), hypertension (1.08; 1.06,1.09), and diabetes (1.26; 1.24,1.29) had significantly increased risks of developing dementia [41]. Black women had a significantly increased risk of AD (1.21; 1.16,1.27), whereas Asians or Pacific-Islanders had a significantly decreased risk of AD (0.77; 0.71,0.83) as compared to white women with breast cancer. The current study also demonstrated that in men and women diagnosed with colorectal cancer, vascular diseases (CVD, stroke, hypertension, and diabetes) were significantly associated with an elevated risk of developing AD, vascular dementia, other dementias, and total ADRD combined.
Similar to what was found in women with breast cancer, this study found that hypertension in older men and women with colorectal cancer was weakly associated with the risk of AD and vascular dementia, but it was not associated with the risk of dementia with Lewy bodies and MCI. This could be due to a more complicated relationship between hypertension and dementia in middle-aged adults versus an older population. For instance, some studies found that hypertension at midlife is a risk factor for ADRD but hypertension in late life (mean age≥70 years) may have no effect or a weak protective effect for ADRD [70–73]. A systematic review showed that the evidence for an association between the risk of dementia and the treatment of hypertension in older patients was inconclusive [74]. One clinical trial showed a promising result that intensive blood pressure control may be associated with a decreased risk of mild cognitive impairment [75], but it is still unclear whether the risk of late-onset dementias, such as AD, will also be significantly decreased.
Because studies on breast and colorectal cancer patients did not include subjects without cancer, it is still unclear how cancer impacts the association between vascular diseases and ADRD. Several previous studies reported an inverse relationship between dementia and cancer [42–53] and that the AD risk in patients with cancer might be decreased by about 35% [46]. Another review of numerous observational studies concluded an inverse association between AD dementia and cancer [52] and that this association is unlikely to be due to bias or confounding (such as diagnostic bias, competing risk bias, or inappropriate adjustment for confounding factors) [52]. Hence, it would be interesting to quantify how cancer affects these relationships between vascular disease and ADRD. Some potential biological mechanisms were proposed, including proteins that suppress tau and amyloid-β deposition and regulate the cell cycle [52], striking differences between post-mitotic neurons and regular mitotic cells, and differential regulation of common genes in AD and cancer [47]. More research on confirming cancer-AD inverse associations and their biological mechanisms are clearly needed.
This study has several strengths in its design and approach. Firstly, the study examined a nationwide, population-based cohort of men and women diagnosed with colorectal cancer at age 65 years or older in the SEER geographical regions, which accounted for 28% of the U.S. population [62, 63]. Because dementia takes a long time to develop and is uncommon at the early stage of study follow-up, a large study population with a long follow-up is often needed in order to generate meaningful information on the probability of developing dementias and on risk factors associated with it. This cohort of men and women with colorectal cancer from 1991 to 2015 was followed up for up to 26 years from 1991 to 2016, making the study significant and unique. Secondly, the national comprehensive Medicare insurance claims data were utilized to identify the incidence of dementias. The Medicare program is a federal health insurance for people aged 65 or older. Data from Medicare contains a list of billing records for Medicare beneficiaries from the date of Medicare enrollment to the date of death. Because Medicare is a national insurance program, Medicare claims may capture medical services offered outside the SEER areas. Thirdly, this population-based cohort with a large number of men and women with colorectal cancer were obtained from the SEER program of the National Cancer Institute, which provides a high cancer case ascertainment and accurate information on clinical tumor factors. Finally, because AD and ADRD may take a long time to develop, those AD and ADRD cases that occurred within a short time period after the baseline of cancer diagnosis might not be due to the effects of main exposures. Our study performed additional analyses by expanding ‘washout’ periods and controlling for potential reverse causation bias, in which the study excluded incident AD and ADRD cases that occurred during the first 1 year and 5 years after the date of cancer diagnosis. The findings showed that the patterns of adjusted hazard ratios of developing AD or ADRD by vascular diseases, age, gender, and race/ethnicity were similar to the results that did not exclude those cases, indicating that the long-term association between vascular diseases and AD and ADRD are robust in patients with colorectal cancer.
There are a few limitations to this current study, however. First, because medical history of vascular diseases was identified from Medicare data within 12 months prior to and 30 days after the date of colorectal cancer diagnosis, the duration of these vascular diseases and their treatment status were unknown. This might have affected the estimation of dementia risk. Second, Medicare claims were reported to have a sensitivity of 85% and a specificity of 89% for identifying overall dementia [76–78], but it is possible that total ADRD or specific types of ADRD could be either overestimated or underestimated. Third, because the study population in this report only included older men and women diagnosed with colorectal cancer at age 65 years or older, the study findings may not be generalizable to younger patients. Fourth, because we only analyzed patients who had Medicare Parts A and B and did not enroll with a Health Maintenance Organization or Part C (Medicare Advantage) due to potential incomplete claims, the study findings may not be generalizable to those who have Medicare Advantage plan. In addition, statistical significance from this large cohort study should be interpreted carefully with clinical significance on the associations between various factors and ADRD. Finally, the study did not have all relevant variables, such as smoking, education, and income, which might affect the estimated association between the risk of dementias and vascular diseases.
In summary, this study demonstrated that in older men and women diagnosed with colorectal cancer at age 65 or older with up to 26 years of follow-up, vascular diseases were associated with a significantly higher risk of developing dementia. There was a significant dose-response relationship between the risk of all types of dementias and the increasing number of these four vascular diseases present. Patients aged 75–79, 80–84, and≥85 had over 2-, 4-, and 5-fold higher risks of AD than those aged 65–69 years. There were substantially different risks of ADRD by race/ethnicity. It would be important in future studies to determine the impact of colorectal cancer or other cancers on the risk of dementias when comparing a cohort of cancer patients with those who have similar background risks, but do not have a diagnosis of cancer.
ACKNOWLEDGMENTS
We would like to thank the efforts of NCI, CMS, IMS, and SEER for creating the datasets used here (SEER-Medicare linked data).
This study was funded by the National Institute on Aging (R01AG067498, R01AG058971, and an Alzheimer’s-focused Administrative Supplement 3R01AG058971-03S1).
Authors’ disclosures available online (https://www.j-alz.com/manuscript-disclosures/22-0548r2).
DATA SHARING
Data sharing has been reported in detail elsewhere [41].
SUPPLEMENTARY MATERIAL
[1] The supplementary material is available in the electronic version of this article: https://dx.doi.org/10.3233/JAD-220548.
REFERENCES
[1] | Alzheimer’s Association ((2022) ) 2022 Alzheimer’s disease facts and figures. Alzheimers Dement 18: , 700–789. |
[2] | National Institute on Aging. Alzheimer–s Disease&Related Dementias. https://www.nia.nih.gov/health/alzheimers, Accessed on May 12, 2022. |
[3] | Hebert LE , Weuve J , Scherr PA , Evans DA ((2013) ) Alzheimer disease in the United States (2010–2050) estimated using the 2010 Census. Neurology 80: , 1778–1783. |
[4] | Matthews KA , Xu W , Gaglioti AH , Holt JB , Croft JB , Mack D , McGuire LC ((2019) ) Racial and ethnic estimates of Alzheimer’s disease and related dementias in the United States (2015–2060) in adults aged≥65 years. Alzheimers Dement 15: , 17–24. |
[5] | GBD 2016 Dementia Collaborators ((2019) ) Global, regional, and national burden of Alzheimer’s disease and other dementias, 1990–2016: A systematic analysis for the Global Burden of Disease Study 2016. Lancet Neurol 18: , 88–106. |
[6] | Chêne G , Beiser A , Au R , Preis SR , Wolf PA , Dufouil C , Seshadri S ((2015) ) Gender and incidence of dementia in the Framingham Heart Study from mid-adult life. Alzheimers Dement 11: , 310–320. |
[7] | Pendlebury ST , Rothwell PM ; Oxford Vascular Study ((2019) ) Incidence and prevalence of dementia associated with transient ischaemic attack and stroke: Analysis of the population-based Oxford Vascular Study. Lancet Neurol 18: , 248–258. |
[8] | Peters R , Booth A , Rockwood K , Peters J , D’Este C , Anstey KJ ((2019) ) Combining modifiable risk factors and risk of dementia: A systematic review and meta-analysis. BMJ Open 9: , e022846. |
[9] | Roberts RO , Knopman DS , Przybelski SA , Mielke MM , Kantarci K , Preboske GM , Senjem ML , Pankratz VS , Geda YE , Boeve BF , Ivnik RJ , Rocca WA , Petersen RC , Jack CR Jr ((2014) ) Association of type 2 diabetes with brain atrophy and cognitive impairment. Neurology 82: , 1132–1141. |
[10] | Gottesman RF , Albert MS , Alonso A , Coker LH , Coresh J , Davis SM , Deal JA , McKhann GM , Mosley TH , Sharrett AR , Schneider ALC , Windham BG , Wruck LM , Knopman DS ((2017) ) Associations between midlife vascular risk factors and 25-year incident dementia in the Atherosclerosis Risk in Communities (ARIC) Cohort. JAMA Neurol 74,: , 1246–1254. |
[11] | Skoog I , Lernfelt B , Landahl S , Palmertz B , Andreasson LA , Nilsson L , Persson G , Oden A , Svanborg A ((1996) ) 15-year longitudinal study of blood pressure and dementia. Lancet 347: , 1141–1145. |
[12] | Elias MF ((1998) ) Effects of chronic hypertension on cognitive functioning.. Geriatrics 53: ,Suppl 1 S49–52. |
[13] | Almeida OP , Flicker L ((2001) ) The mind of a failing heart: A systematic review of the association between congestive heart failure and cognitive functioning. Intern Med J 31: , 290–295. |
[14] | Ackerman RH ((2001) ) Cerebral blood flow and neurological change in chronic heart failure. Stroke 32: , 2462–2464. |
[15] | Havlik RJ , Foley DJ , Sayer B , Masaki K , White L , Launer LJ ((2002) ) Variability in midlife systolic blood pressure is related to late-life brain white matter lesions: The Honolulu-Asia Aging study. Stroke 33: , 26–30. |
[16] | Antonelli Incalzi R , Trojano L , Acanfora D , Crisci C , Tarantino F , Abete P , Rengo F ((2003) ) Verbal memory impairment in congestive heart failure. J Clin Exp Neuropsychol 25: , 14–23. |
[17] | Luchsinger JA , Tang MX , Shea S , Mayeux R ((2004) ) Hyperinsulinemia and risk of Alzheimer disease. , 1187-1192. Neurology 63: . |
[18] | de la Torre JC ((2006) ) How do heart disease and stroke become risk factors for Alzheimer’s disease? . Neurol Res 28: , 637–644. |
[19] | Biessels GJ , De Leeuw FE , Lindeboom J , Barkhof F , Scheltens P ((2006) ) Increased cortical atrophy in patients with Alzheimer’s disease and type 2 diabetes mellitus. J Neurol Neurosurg Psychiatry 77: , 304–307. |
[20] | Reitz C , Tang MX , Manly J , Mayeux R , Luchsinger JA ((2007) ) Hypertension and the risk of mild cognitive impairment. Arch Neurol 64: , 1734–1740. |
[21] | Rosendorff C , Beeri MS , Silverman JM ((2007) ) Cardiovascular risk factors for Alzheimer’s disease. Am J Geriatr Cardiol 16: , 143–149. |
[22] | Obisesan TO , Obisesan OA , Martins S , Alamgir L , Bond V , Maxwell C , Gillum RF ((2008) ) High blood pressure, hypertension, and high pulse pressure are associated with poorer cognitive function in persons aged 60 and older: The Third National Health and Nutrition Examination Survey. J Am Geriatr Soc 56: , 501–509. |
[23] | Irie F , Fitzpatrick AL , Lopez OL , Kuller LH , Peila R , Newman AB , Launer LJ ((2008) ) Enhanced risk for Alzheimer disease in persons with type 2 diabetes and APOE epsilon4: The Cardiovascular Health Study Cognition Study. Arch Neurol 65: , 89–93. |
[24] | Xu W , Qiu C , Gatz M , Pedersen NL , Johansson B , Fratiglioni L ((2009) ) Mid- and late-life diabetes in relation to the risk of dementia: A population-based twin study. Diabetes 58: , 71–77. |
[25] | Xu WL , von Strauss E , Qiu CX , Winblad B , Fratiglioni L ((2009) ) Uncontrolled diabetes increases the risk of Alzheimer’s disease: A population-based cohort study. Diabetologia 52: , 1031–1039. |
[26] | Purnell C , Gao S , Callahan CM , Hendrie HC ((2009) ) Cardiovascular risk factors and incident Alzheimer disease: A systematic review of the literature. Alzheimer Dis Assoc Disord 23: , 1–10. |
[27] | Knopman DS , Mosley TH , Catellier DJ , Coker LH ((2009) ) Fourteen-year longitudinal study of vascular risk factors, APOE genotype, and cognition: The ARIC MRI Study. Alzheimers Dement 5: , 207–214. |
[28] | Sonnen JA , Larson EB , Brickell K , Crane PK , Woltjer R , Montine TJ , Craft S ((2009) ) Different patterns of cerebral injury in dementia with or without diabetes. Arch Neurol 66: , 315–322. |
[29] | Launer LJ ((2009) ) Diabetes: Vascular or neurodegenerative: An epidemiologic perspective. Stroke 40: , S53–55. |
[30] | Staekenborg SS , Koedam EL , Henneman WJ , Stokman P , Barkhof F , Scheltens P , van der Flier WM ((2009) ) Progression of mild cognitive impairment to dementia: Contribution of cerebrovascular disease compared with medial temporal lobe atrophy. Stroke 40: , 1269–1274. |
[31] | DeCarli C , Miller BL , Swan GE , Reed T , Wolf PA , Carmelli D ((2001) ) Cerebrovascular and brain morphologic correlates of mild cognitive impairment in the National Heart, Lung, and Blood Institute Twin Study. Arch Neurol 58: , 643–647. |
[32] | Bell RD , Zlokovic BV ((2009) ) Neurovascular mechanisms and blood-brain barrier disorder in Alzheimer’s disease. Acta Neuropathol 118: , 103–113. |
[33] | de Toledo Ferraz Alves TC , Ferreira LK , Wajngarten M , Busatto GF ((2010) ) Cardiac disorders as risk factors for Alzheimer’s disease. J Alzheimers Dis 20: , 749–763. |
[34] | Ferreira LK , Tamashiro-Duran JH , Squarzoni P , Duran FL , Alves TC , Buchpiguel CA , Busatto GF ((2014) ) The link between cardiovascular risk, Alzheimer’s disease, and mild cognitive impairment: Support from recent functional neuroimaging studies. Braz J Psychiatry 36: , 344–357. |
[35] | Armstrong NM , Bangen KJ , Au R , Gross AL ((2019) ) Associations between midlife (but not late-life) elevated coronary heart disease risk and lower cognitive performance: Results from the Framingham Offspring Study. Am J Epidemiol 188: , 2175–2187. |
[36] | Yaffe K , Bahorik AL , Hoang TD , Forrester S , Jacobs DR Jr , Lewis CE , Lloyd-Jones DM , Sidney S , Reis JP ((2020) ) Cardiovascular risk factors and accelerated cognitive decline in midlife: The CARDIA Study. Neurology 95: , e839–e846. |
[37] | George KM , Gilsanz P , Peterson RL , Barnes LL , DeCarli CS , Mayeda ER , Mungas DM , Whitmer RA ((2021) ) Impact of cardiovascular risk factors in adolescence, young adulthood, and midlife on late-life cognition: Study of healthy aging in African Americans. J Gerontol A Biol Sci Med Sci 76: , 1692–1698. |
[38] | Wang K , Liu H ((2021) ) Early-onset subgroup of type 2 diabetes and risk of dementia, Alzheimer’s disease and stroke: A cohort study. J Prev Alzheimers Dis 8: , 442–447. |
[39] | Yaffe K , Vittinghoff E , Hoang T , Matthews K , Golden SH , Zeki Al Hazzouri A ((2021) ) Cardiovascular risk factors across the life course and cognitive decline: A pooled cohort study. Neurology 96: , e2212–e2219. |
[40] | Yassi N , Pase MP , Buckley RF , Rosenich E , Watson R , Maruff P , Lim YY ((2022) ) Cardiovascular risk associated with poorer memory in middle-aged adults from the healthy brain project. J Alzheimers Dis 86: , 1081–1091. |
[41] | Du XL , Song L , Schulz PE , Xu H , Chan W ((2022) ) Risk of developing Alzheimer’s disease and related dementias in association with cardiovascular disease, stroke, hypertension and diabetes in a large cohort of women with breast cancer and with up to 26 years of follow-up. J Alzheimers Dis 87: , 415–432. |
[42] | Roe CM , Behrens MI , Xiong C , Miller JP , Morris JC ((2005) ) Alzheimer disease and cancer. Neurology 8: , 895–898. |
[43] | Roe CM , Fitzpatrick AL , Xiong C , Sieh W , Kuller L , Miller JP , Williams MM , Kopan R , Behrens MI , Morris JC ((2010) ) Cancer linked to Alzheimer disease but not vascular dementia.y . Neurolog 12: , 106–112. |
[44] | Bennett DA , Leurgans S ((2010) ) Is there a link between cancer and Alzheimer disease? . Neurology 12: , 100–101. |
[45] | Driver JA , Beiser A , Au R , Kreger BE , Splansky GL , Kurth T , Kiel DP , Lu KP , Seshadri S , Wolf PA ((2012) ) Inverse association between cancer and Alzheimer’s disease: Results from the Framingham Heart Study. BMJ 344: , e1442. |
[46] | Musicco M , Adorni F , Di Santo S , Prinelli F , Pettenati C , Caltagirone C ((2013) ) Inverse occurrence of cancer and Alzheimer disease: A population-based incidence study. Neurology 81: , 322–328. |
[47] | Driver JA ((2014) ) Inverse association between cancer and neurodegenerative disease: Review of the epidemiologic and biological evidence. Biogerontology 15: , 547–557. |
[48] | Ma LL , Yu JT , Wang HF , Meng XF , Tan CC , Wang C , Tan L ((2014) ) Association between cancer and Alzheimer’s disease: Systematic review and meta-analysis. J Alzheimers Dis 42: , 565–573. |
[49] | Zhang Q , Guo S , Zhang X , Tang S , Shao W , Han X , Wang L , Du Y ((2015) ) Inverse relationship between cancer and Alzheimer’s disease: A systemic review meta-analysis. Neurol Sci 36: , 1987–1994. |
[50] | Ganguli M ((2015) ) Cancer and dementia: It’s complicated. Alzheimer Dis Assoc Disord 29: , 177–182. |
[51] | Ospina-Romero M , Abdiwahab E , Kobayashi L , Filshtein T , Brenowitz WD , Mayeda ER , Glymour MM ((2019) ) Rate of memory change before and after cancer diagnosis.. JAMA Netw Open 5: , e196160. |
[52] | Ospina-Romero M , Glymour MM , Hayes-Larson E , Mayeda ER , Graff RE , Brenowitz WD ((2020) ) Association between Alzheimer disease and cancer with evaluation of study bias: Systematic review and meta-analysis. JAMA Netw Open 3: , e2025515. |
[53] | Sun M , Wang Y , Sundquist J , Sundquist K , Ji J ((2020) ) The association between cancer and dementia: A national cohort study in Sweden. Front Oncol 10: , 73. |
[54] | van Dam FS , Schagen SB , Muller MJ , Boogerd W , vd Wall E , Droogleever Fortuyn ME , Rodenhuis S ((1998) ) Impairment of cognitive function in women receiving adjuvant treatment for high-risk breast cancer: High-dose versus standard-dose chemotherapy. J Natl Cancer Inst 90: , 210–218. |
[55] | Brezden CB , Phillips KA , Abdolell M , Bunston T , Tannock IF ((2000) ) Cognitive function in breast cancer patients receiving adjuvant chemotherapy. J Clin Oncol 18: , 2695–2701. |
[56] | Wefel JS , Lenzi R , Theriault RL , Davis RN , Meyers CA ((2004) ) The cognitive sequelae of standard-dose adjuvant chemotherapy in women with breast carcinoma: Results of a prospective, randomized, longitudinal trial. Cancer 100: , 2292–2299. |
[57] | Schagen SB , van Dam FS , Muller MJ , Boogerd W , Lindeboom J , Bruning PF ((1999) ) Cognitive deficits after postoperative adjuvant chemotherapy for breast carcinoma. Cancer 85: , 640–650. |
[58] | Hurria A , Rosen C , Hudis C , Zuckerman E , Panageas KS , Lachs MS , Witmer M , van Gorp WG , Fornier M , D’Andrea G , Moasser M , Dang C , Van Poznak C , Hurria A , Holland J ((2006) ) Cognitive function of older patients receiving adjuvant chemotherapy for breast cancer: A pilot prospective longitudinal study. J Am Geriatr Soc 54: , 925–931. |
[59] | Kreukels BP , van Dam FS , Ridderinkhof KR , Boogerd W , Schagen SB ((2008) ) Persistent neurocognitive problems after adjuvant chemotherapy for breast cancer. Clin Breast Cancer 8: , 80–87. |
[60] | Heck JE , Albert SM , Franco R , Gorin SS ((2008) ) Patterns of dementia diagnosis in surveillance, epidemiology, and end results breast cancer survivors who use chemotherapy. J Am Geriatr Soc 56: , 1687–1692. |
[61] | National Cancer Institute. SEER-Medicare: Brief Description of the SEER-Medicare Database. https://healthcaredelivery.cancer.gov/seermedicare/overview/. |
[62] | Surveillance, Epidemiology, and End Results (SEER) of the National Cancer Institute. List of SEER Registries. https://seer.cancer.gov/registries/list.html Accessed August 4. |
[63] | Surveillance, Epidemiology, and End Results (SEER) of the National Cancer Institute. Characteristics of the SEER population compared with the total United State population. National Cancer Institute. http://www.seer.cancer.gov/registries/characteristics.html. |
[64] | Charlson ME , Pompei P , Ales KL , MacKenzie CR ((1987) ) A new method of classifying prognostic comorbidity in longitudinal studies: Development and validation. J Chronic Dis 40: , 373–383. |
[65] | Klabunde CN , Potosky AL , Legler JM , Warren JL ((2000) ) Development of a comorbidity index using physician claims data. J Clin Epidemiol 53: , 1258–1267. |
[66] | Quan H , Li B , Couris CM , Fushimi K , Graham P , Hider P , Januel JM , Sundararajan V ((2011) ) Updating and validating the Charlson comorbidity index and score for risk adjustment in hospital discharge abstracts using data from 6 countries. Am J Epidemiol 173: , 676–682. |
[67] | National Cancer Institute. SEER-Medicare: Calculation of Comorbidity Weights.http://healthcaredelivery.cancer.gov/seermedicare/program/comorbidity.html Accessed on February 8, 2022. |
[68] | SAS Institute Inc (2012) Statistical Analysis with SAS/STAT®Software. SAS Institute Inc., Cary, NC. |
[69] | Fine JP , Gray RJ ((1999) ) A proportional hazards model for the subdistribution of a competing risk. J Am Stat Assoc 94: , 496–509. |
[70] | Lennon MJ , Koncz R , Sachdev PS ((2021) ) Hypertension and Alzheimer’s disease: Is the picture any clearer? . Curr Opin Psychiatry 34: , 142–148. |
[71] | Guan JW , Huang CQ , Li YH , Wan CM , You C , Wang ZR , Liu YY , Liu QX ((2011) ) No association between hypertension and risk for Alzheimer’s disease: A meta-analysis of longitudinal studies. J Alzheimers Dis 27: , 799–807. |
[72] | Power MC , Weuve J , Gagne JJ , McQueen MB , Viswanathan A , Blacker D ((2011) ) The association between blood pressure and incident Alzheimer disease: A systematic review and meta-analysis. Epidemiology 22: , 646–659. |
[73] | Kivipelto M , Helkala EL , Laakso MP , Hänninen T , Hallikainen M , Alhainen K , Iivonen S , Mannermaa A , Tuomilehto J , Nissinen A , Soininen H ((2002) ) Apolipoprotein E epsilon4 allele, elevated midlife total cholesterol level, and high midlife systolic blood pressure are independent risk factors for late-life Alzheimer disease. Ann Intern Med 137: , 149–155. |
[74] | Peters R , Beckett N ((2009) ) Hypertension, dementia, and antihypertensive treatment: Implications for the very elderly. Curr Hypertens Rep 11: , 277–282. |
[75] | SPRINT MIND Investigators for the SPRINT Research Group, Nasrallah IM , Pajewski NM , Auchus AP , Chelune G , Cheung AK , Cleveland ML , Coker LH , Crowe MG , Cushman WC , Cutler JA , Davatzikos C , Desiderio L , Doshi J , Erus G , Fine LJ , Gaussoin SA , Harris D , Johnson KC , Kimmel PL , Kurella Tamura M , Launer LJ , Lerner AJ , Lewis CE , Martindale-Adams J , Moy CS , Nichols LO , Oparil S , Ogrocki PK , Rahman M , Rapp SR , Reboussin DM , Rocco MV , Sachs BC , Sink KM , Still CH , Supiano MA , Snyder JK , Wadley VG , Walker J , Weiner DE , Whelton PK , Wilson VM , Woolard N , Wright JT Jr , Wright CB , Williamson JD , Bryan RN ((2019) ) Effect of Intensive vs standard blood pressure control on probable dementia: A randomized clinical trial. JAMA 321: , 553–561. |
[76] | Pippenger M , Holloway RG , Vickrey BG ((2001) ) Neurologists’ use of ICD-9CM codes for dementia. Neurology 56: , 1206–1209. |
[77] | Taylor DH Jr , Østbye T , Langa KM , Weir D , Plassman BL ((2009) ) The accuracy of Medicare claims as an epidemiological tool: The case of dementia revisited. J Alzheimers Dis 17: , 807–815. |
[78] | Lee E , Gatz M , Tseng C , Schneider LS , Pawluczyk S , Wu AH , Deapen D ((2019) ) Evaluation of Medicare claims data as a tool to identify dementia. J Alzheimers Dis 67: , 769–778. |

