
Low-background materials for high pressure cells used in inelastic neutron scattering experiments
Abstract
The signal-to-noise ratio is the ultimate limiting factor for high pressure neutron scattering experiments where sample environment equipment could create significant background signal which in many cases may significantly exceed the signal from the sample itself. This is the particularly serious issue in case of high-pressure sample environment for inelastic neutron scattering. Here we review materials which could be used for development of new generation of high-pressure cells for inelastic and quasi-elastic neutron scattering experiments. We also present results of modelling of the background of high-pressure vessels made out of different materials. This approach will allow designing and producing high pressure vessels with parameters desired for particular neutron scattering experiment.
1.Introduction
The combination of high-pressure sample environment with neutron scattering proves to be a powerful tool for studying the phase transitions and physical properties of solids at the atomic scale [9]. Since pressure is defined as the ratio of force by unit area, the very high pressures can be achieved for very small samples. An ability of neutron diffraction to measure small samples allowed expanding experimental pressure range to tens of GPa. The situation is quite different for inelastic and quasi-elastic measurements which quite often require fairly large sample volumes. Consequently, high pressure can only be obtained by applying large forces which implies massive mechanical devices. As a result, the main difficulty encountered in inelastic neutron scattering experiments is the issue of the neutron beam having to travel through rather thick sections of the pressure vessels which contain the sample under investigation [5,7]. This gives rise to unwanted absorption and coherent or incoherent background scattering which can be mitigated by the right choice of vessel material and the optimisation of a high-pressure vessel geometry design [8,18].
In this paper, we review materials which could be used for development of new generation of high-pressure cells for inelastic and quasi-elastic neutron scattering experiments. We present background data of different materials obtained experimentally in several inelastic scattering instruments. We also present results of modelling of the background of high-pressure vessels made out of materials of interest. This approach will allow constructing of high-pressure vessels with parameters desired for particular neutron scattering experiment.
2.Test materials
Table 1 contains identification codes (IC) of all test samples under investigation. There are two groups of samples: discs and bars (cylinders). The disc samples have been machined from bars of the same materials. All disc samples except NCA1 have diameter Ø18 mm and width 0.5 mm. The diameter of NCA1 is Ø12.3 mm with the same width of 0.5 mm. All bar (cylindrical) samples except NCA3 have diameter Ø18 mm. The diameter of NCA3 is Ø12.3 mm. The material of samples NCA1 and NCA3 has been used for producing the cell described in [18].
Table 1
Test samples identification codes (IC)
| Material | Disk samples | Bar samples |
| Aluminium 7049A T6 | A1 | A2 |
| Aluminium 7075A T6 | A3 | A4 |
| CuBe | C1 | C2 |
| TiZr | T1 | T2 |
| TAV6 | TA1 | TA2 |
| NiCrAl (Ø12.3) | NCA1 | NCA3 |
| NiCrAl | NCA2 | NCA4 |
| MP35N | M1 | M2 |
In Table 2, we present the mechanical properties of materials under investigation. The material certificates can be found in Ref. [20] and are available upon request.
Table 2
Mechanical properties of materials under investigation
| Material | Tensile strength [MPa] | Yield strength [MPa] | Failure elongation [%] |
| Al 7049A T6 | 621 | 585 | 8.7 |
| Al 7075A T6 | 607 | 531 | 7.9 |
| CuBe | 1400 | 1240 | 6.3 |
| TiZr | 706 | 555 | 29.3 |
| TAV6 | 980 | 896 | 21 |
| NiCrAl (Ø12.3) | 1632 | 1530 | 6 |
| NiCrAl* | – | – | – |
| MP35N | 1937 | 1896 | 4.9 |
* The material is very sensitive to temperature variations during age hardening, as a result its parameters may vary in a range of values comparable with NiCrAl (Ø12.3).
It is worth mentioning that at high pressure and high temperature mechanical properties of the materials under investigation may be affected by using of some gases and fluids (for example Hydrogen) as a pressure transmitting medium, however these effects are beyond the scope of the paper.
3.Collected neutron data
The first set of material test data has been taken on LET instrument at ISIS facility. The LET is a cold neutron multi-chopper spectrometer with incident energy: 0.5–30 meV (12–1.65 Å); maximum energy resolution: 20 μeV at Ei = 1 meV and 500 μeV at Ei = 20 meV; and neutron flux at 5 meV and 2% resolution: 5 × 10⁴ n cm−1 s−1 [2]. The results of the tests are presented for direct comparison in Fig. 1 and Fig. 2 which show the inelastic scattering of the sample under investigation. Vertical axis is the energy transfer and the horizontal axis is the modulus of momentum transfer.
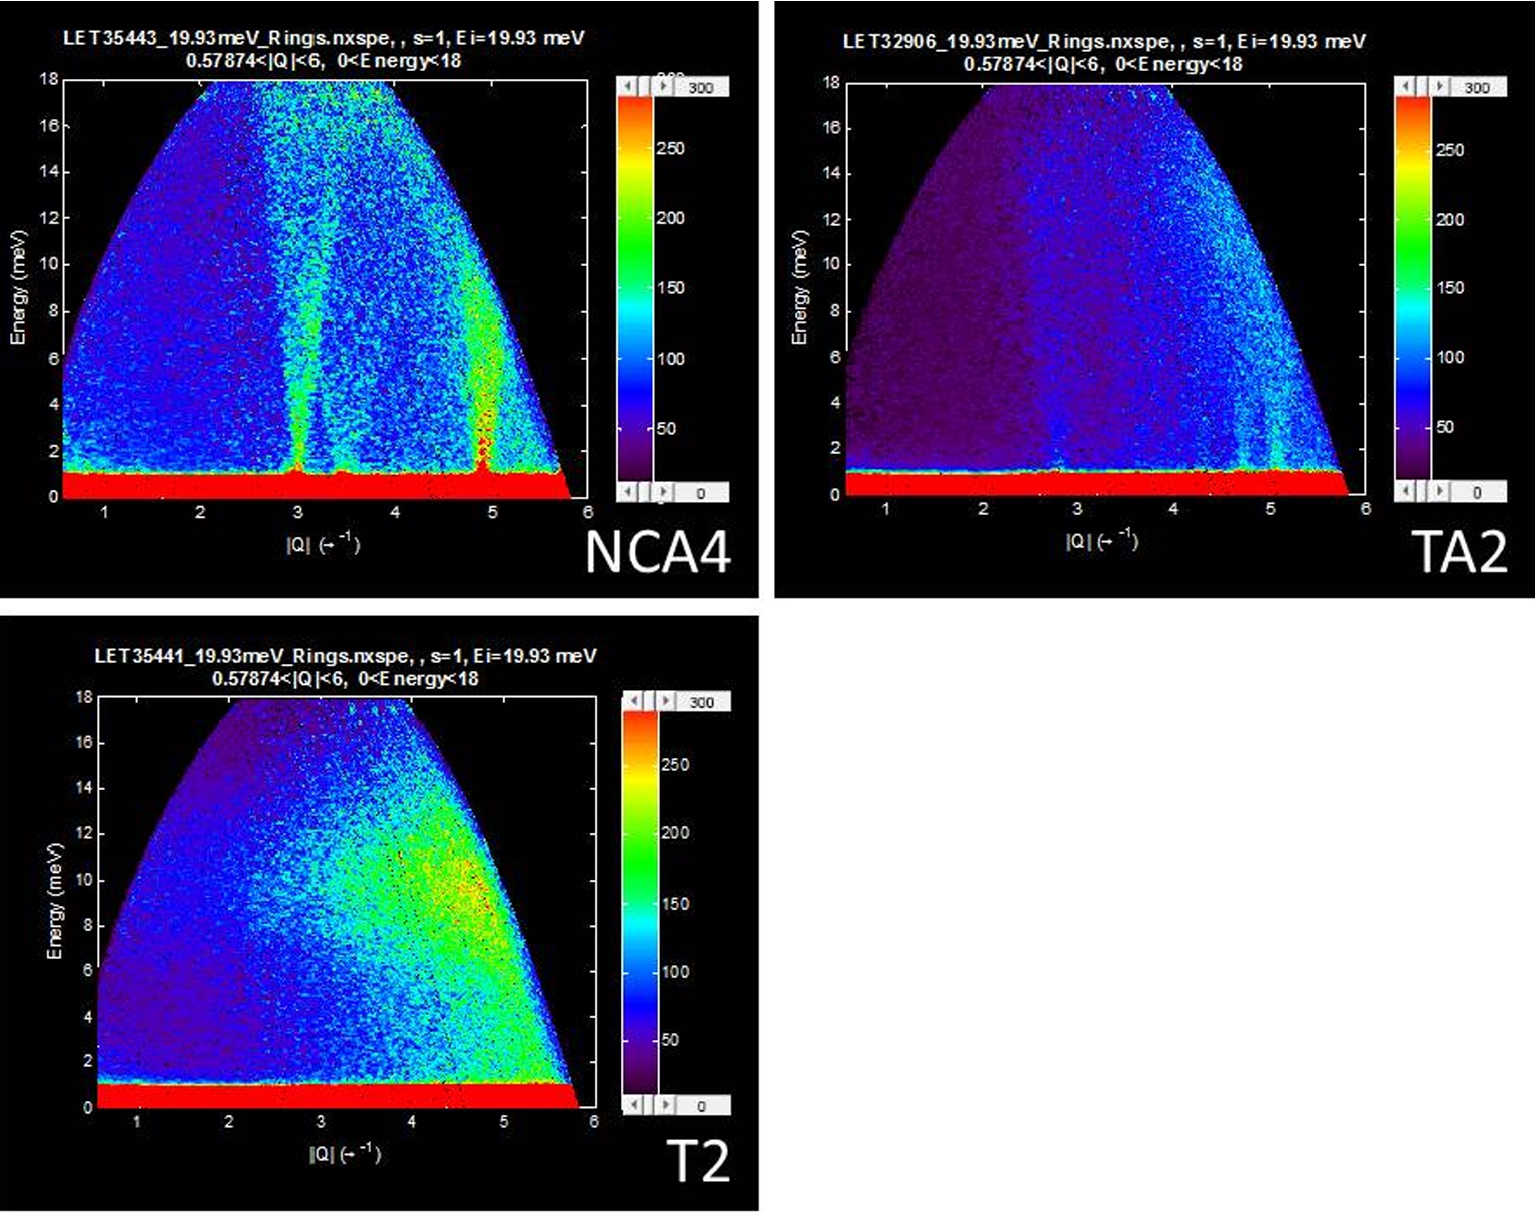
All samples were of the same dimensions and run for the same time at room temperature with an incident energy of 20 meV. As we can see, the sample C2 (CuBe) is the worst by far cell material for neutron spectroscopy. It has the strongest inelastic scattering and a poor neutron transmission (presented in Fig. 3). Sample M2 (MP35N) has the lowest inelastic background, but this is part due to its poor transmission. Both aluminium alloy samples A2 and A4 have the best transmission and the background is low in some regions but there are quite a few strong phonon branches. Sample TA2 (TAV6) seems to have the best combination of the low background and reasonable transmission.
Fig. 1.
Inelastic scattering on LET for samples: C2 (CuBe), M2 (MP35N), A2 (Al 7049A), A4 (Al 7075A). Vertical axis is the energy transfer and the horizontal axis is the modulus of momentum transfer.
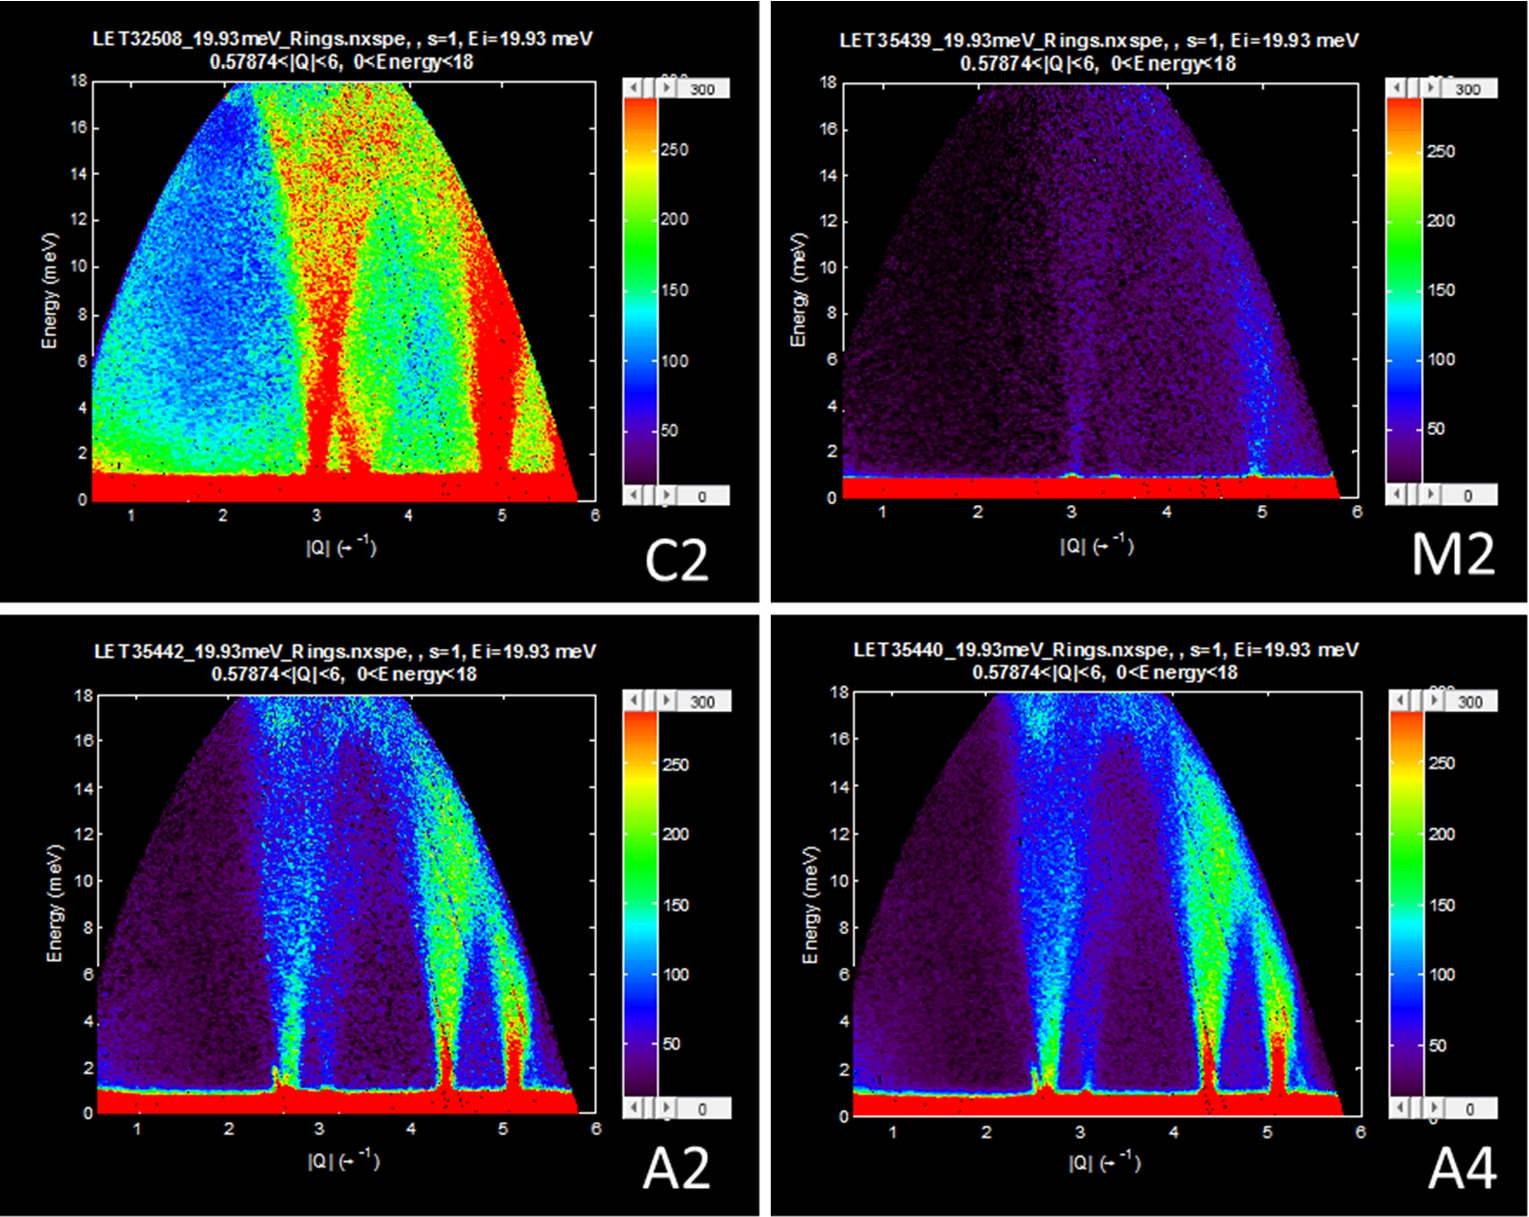
Fig. 2.
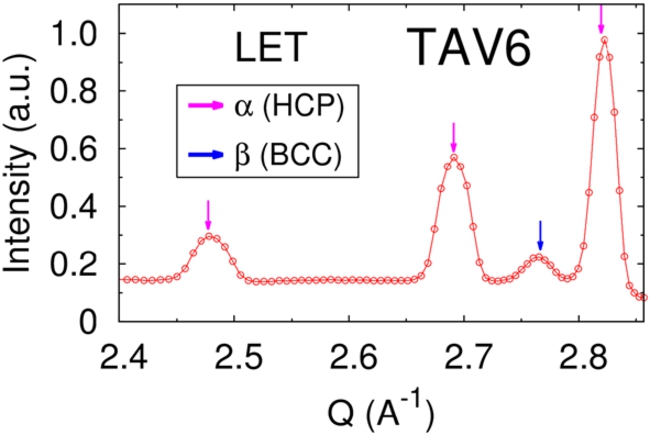
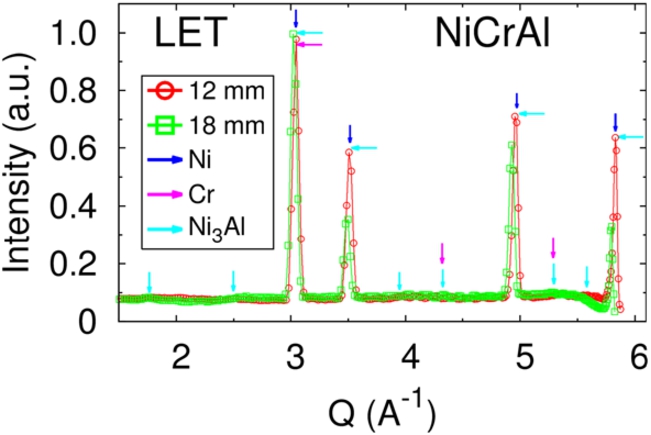
Inelastic scattering on LET for samples: NCA4 (NiCrAl), TA2 (TAV6) and T2 (TiZr). Vertical axis is the energy transfer and the horizontal axis is the modulus of momentum transfer.
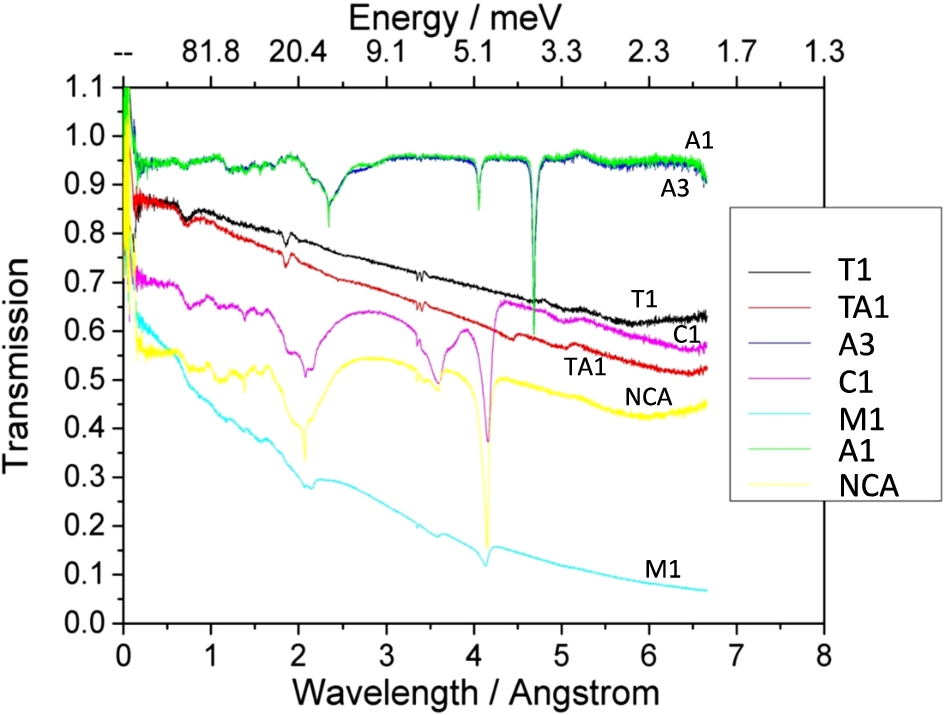
In Fig. 3, we present neutron transmissions I/I0 as a function of the neutron wavelength measured on IMAT neutron imaging and diffraction instrument at ISIS [10]. Samples T1, TA1, A3, C1, M1, A1, and NCA2 were run for the same time at room temperature. We observed sharp change in the features (strong texture due to preferred orientation of crystallites) and smooth Bragg edges (weak or no texture due to the random orientation distribution). Aluminium alloy samples A1 and A3 have highest transmission which are followed by transmissions of samples T1 (TiZr) and TA1 (TAV6). Sample M1 (MP35N) has demonstrated the lowest transmission.
Fig. 3.
Neutron transmissions as a function of the neutron wavelength measured for samples: T1 (TiZr), TA1 (TAV6), A3 (Al 7075A), C1 (CuBe), M1 (MP35N), A1 (Al 7049A), NCA2 (NiCrAl).
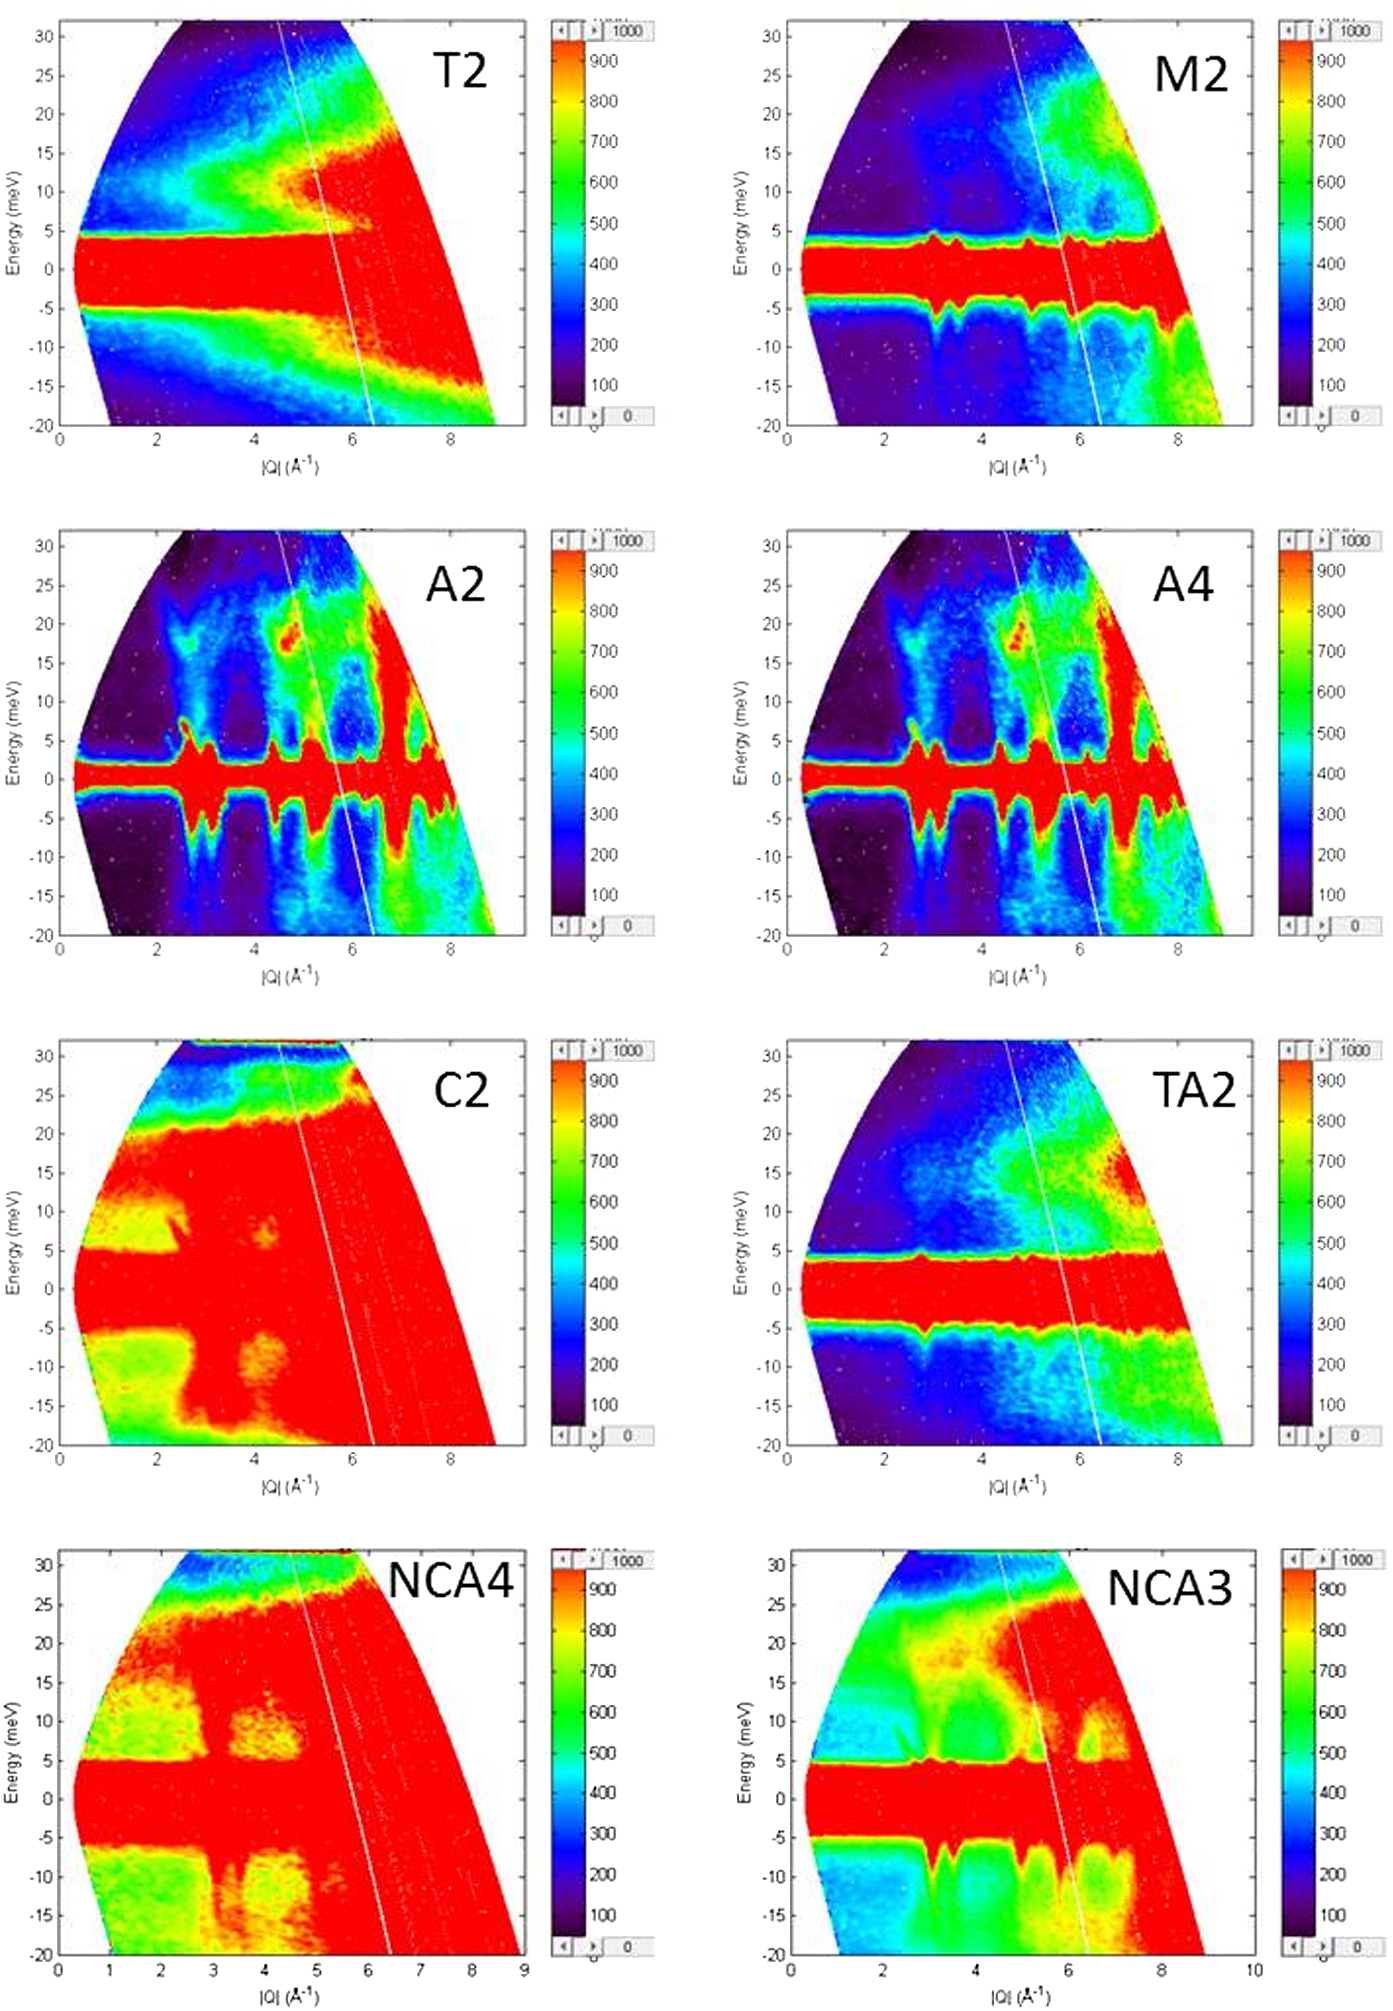
The next set of material test data has been taken on MERLIN instrument at ISIS facility and presented in Fig. 4. The MERLIN is a high-count rate, medium energy resolution, direct geometry chopper spectrometer with incident energy 7–2000 meV; the energy resolution depends on the choice and speed of Fermi chopper
All samples were of the same dimensions and run for the same time at room temperature with an incident energy of 38 meV. As it is possible to see in Fig. 4, the sample TA2 (TAV6) is the best choice because of combination of smooth and low background with reasonable transmission. Combination of the background and transmission is even better for aluminium alloys A2 and A4 but there are few phonon branches. Similar to LET measurements, the sample M2 (MP35N) has reasonable inelastic background, but poor transmission.
Fig. 4.
Inelastic scattering on MERLIN for samples: T2 (TiZr), M2 (MP35N), A2 (Al7049A), A4 (Al7075A), C2 (CuBe), TA2 (TAV6), NCA4 (NiCrAl) and NCA3 (NiCrAl). Vertical axis is the energy transfer and the horizontal axis is the modulus of momentum transfer.
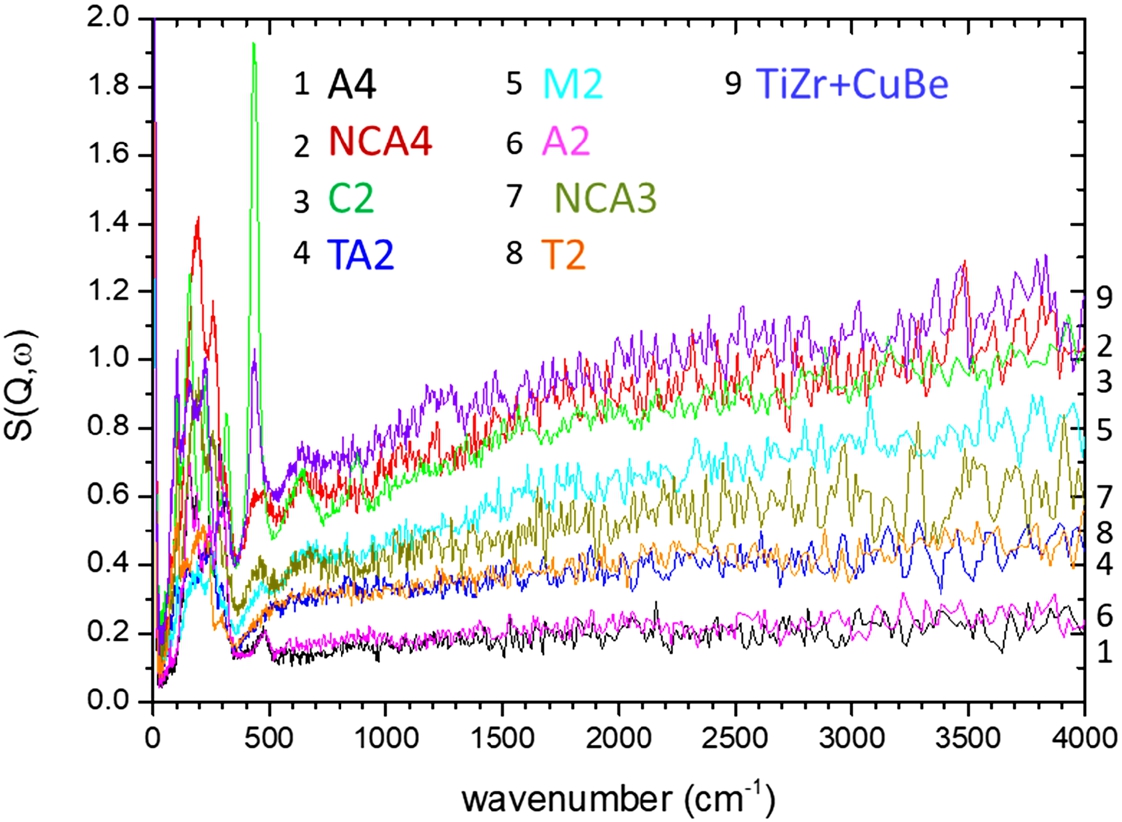
The data presented in Fig. 5 have been obtained on TOSCA instrument at ISIS facility. The TOSCA is a broadband, indirect geometry thermal neutron spectrometer optimised for vibrational spectroscopy with energy range −20, 8000 cm−1 (−2.5, 1000 meV) and energy resolution ∼1%
Inelastic neutron scattering spectra of aluminium alloy cylinders give weakest signal/background and thus aluminium alloy may be most suitable as material for sample cells, as long as system under study does not require very high temperatures or pressures. In cases where higher temperatures or pressures are required cells made from TAV6 and/or TiZr material may be preferable. We also included for comparison a spectrum of the high-pressure cell made of TiZr in CuBe sleeve already used in TOSCA experiments [7].
Fig. 5.
Inelastic neutron scattering spectra (in the region between 0 and 4000 cm−1) of samples: A4 (Al7075A), NCA4 (NiCrAl), C2 (CuBe), TA2 (TAV6), M2 (MP35N), A2 (Al7049A), NCA3 (NiCrAl), T2 (TiZr).
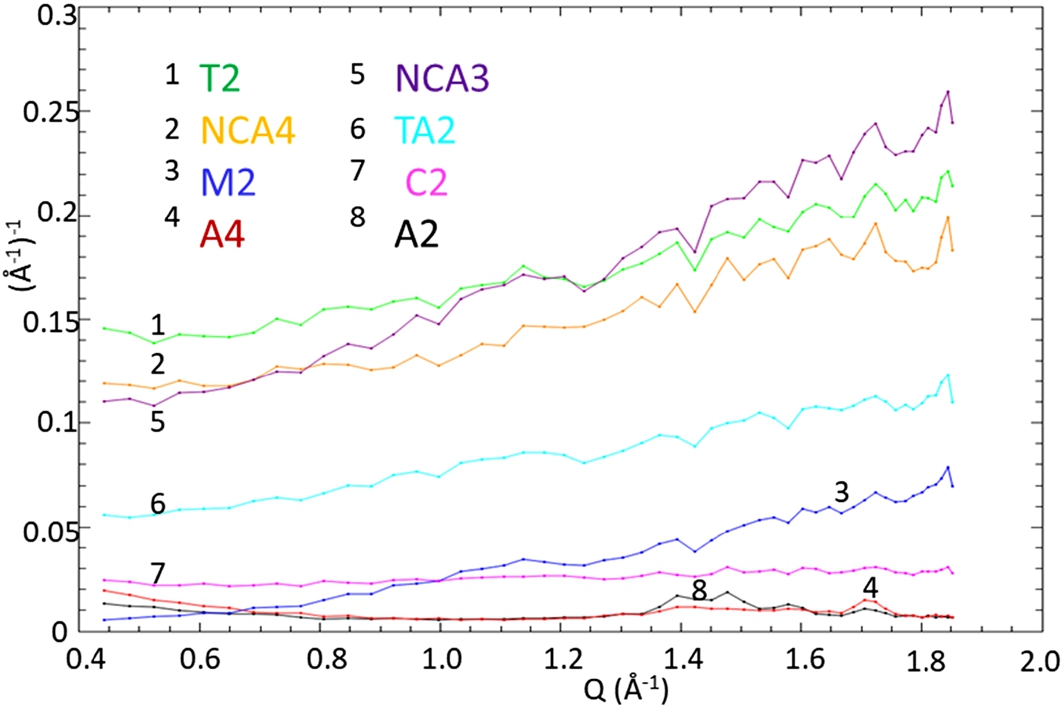
The last data set was obtained on IRIS backscattering spectrometer at ISIS facility. IRIS is a time-of-flight inverted-geometry crystal analyser spectrometer designed for Quasi Elastic Neutron Scattering (QENS) and low-energy high resolution inelastic spectroscopy [3]. In Fig. 6, we present the elastic intensity variation with Q (Å−1). As it is possible to see, the aluminium alloys give the lowest background signal but also have few Bragg peaks. The CuBe alloy gives least variable signal in studied region which makes it the best material choice for QENS measurements high pressure cell.
Fig. 6.
The elastic intensity variation with Q (Å−1) of samples: T2 (TiZr), NCA3 (NiCrAl), NCA4 (NiCrAl), TA2 (TAV6), M2 (MP35N), C2 (CuBe), A4 (Al7075A), A2 (Al7049A) measured at IRIS spectrometer.
4.Data analysis
Monte Carlo simulations can be a very useful tool to optimize the signal-to-noise ratio of an instrument. To this end, the materials that form the instrument have to be modelled from measurements. In particular, we need the crystallographic structure, the micro-texture, and, for the inelastic scattering, an effective phonon Generalized Density of States (GDOS) [11]. In case of phase separation, which takes place in most alloys, it is also necessary to know the volume fraction occupied by each phase as well as the crystal structure and the micro-texture of each phase. The analysis of the data presented before allows us to get the crystalline structure and phases of the alloys, and the GDOS, which can be obtained respectively from the data collected at the LET and TOSCA instruments of ISIS facility. Additional measurements, which are currently in progress, are necessary to get the micro-texture and the volume occupied by each phase. In what follows we summarize the results of the analysis of the present data.
4.1.Aluminium alloys
The aluminium alloys Al 7049 and Al 7075 are composed by 5.3 wt% Zn, 2.5 wt% Mg, 1.3 wt% Cu and 88.8 wt% Al, and other elements. The alloys present phase separation, with regions of α and η phases. The α phase is rich in Al, and has an FCC crystal structure with lattice parameter
Fig. 7.
Diffraction from the LET measurements diagram for the two aluminium alloys.
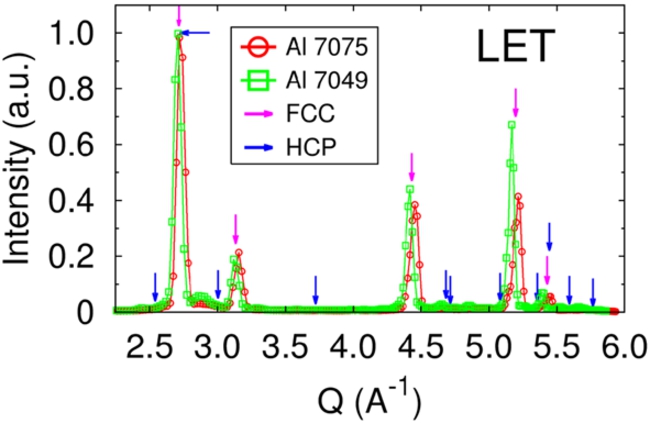
Fig. 8.
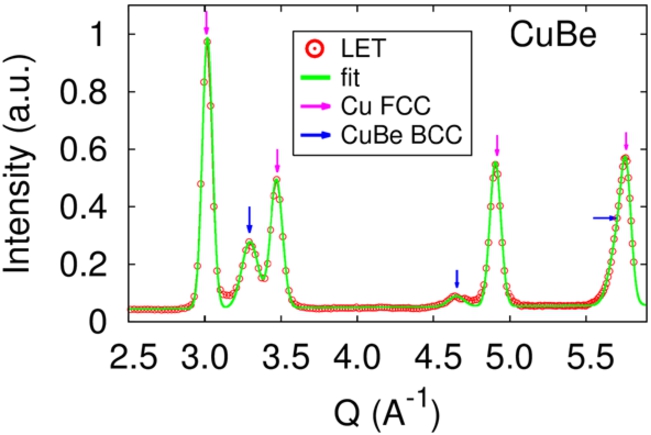
Diffraction from the LET measurements diagram for the CuBe alloy.
4.2.Hardened CuBe alloy
The CuBe alloy is composed approximately by 98 wt% Cu and 2 wt% Be. It presents also phase separation, with regions of α and γ phases. The α phase is depleted of Be and has an FCC crystal structure, with lattice parameter
Fig. 9.
Diffraction from the LET measurements diagram for the TAV-6 alloy.
4.3.Titanium alloy
TAV-6 is a titanium alloy composed approximately by 6 wt% Al, 4 wt% V, and 90 wt% Ti. It is an α–β alloy that contains separated α and β phases. The α phase has an HCP crystal structure, with lattice parameters
4.4.Russian alloy
NiCrAl is the Russian alloy 40HNV-VI, composed by 56.5 wt% Ni, 40 wt% Cr, and 3.5 wt% Al, approximately. The large concentration of Cr causes phase separation, appearing separated Ni rich, Cr rich, and Ni3Al rich regions. The Ni rich phase has an FCC crystal structure with
Fig. 10.
Diffraction from the LET measurements diagram for the NiCrAl alloy.
The TiZr alloy is a null matrix that do not produce coherent elastic scattering. Thus, no Bragg peak appear in the diffraction pattern.
4.5.Generalised density of states of the alloys
The simulation of the inelastic background relies in the incoherent approximation, as inelastic coherent effects are too complicated and cannot be presently considered [11]. In the incoherent approximation, the essential ingredient is an effective generalized phonon density of states (GDoS), that in the energy loss mode is obtained as [16,17]
In the above equation for
The effective GDoS of the different alloys has been obtained using the scattering functions
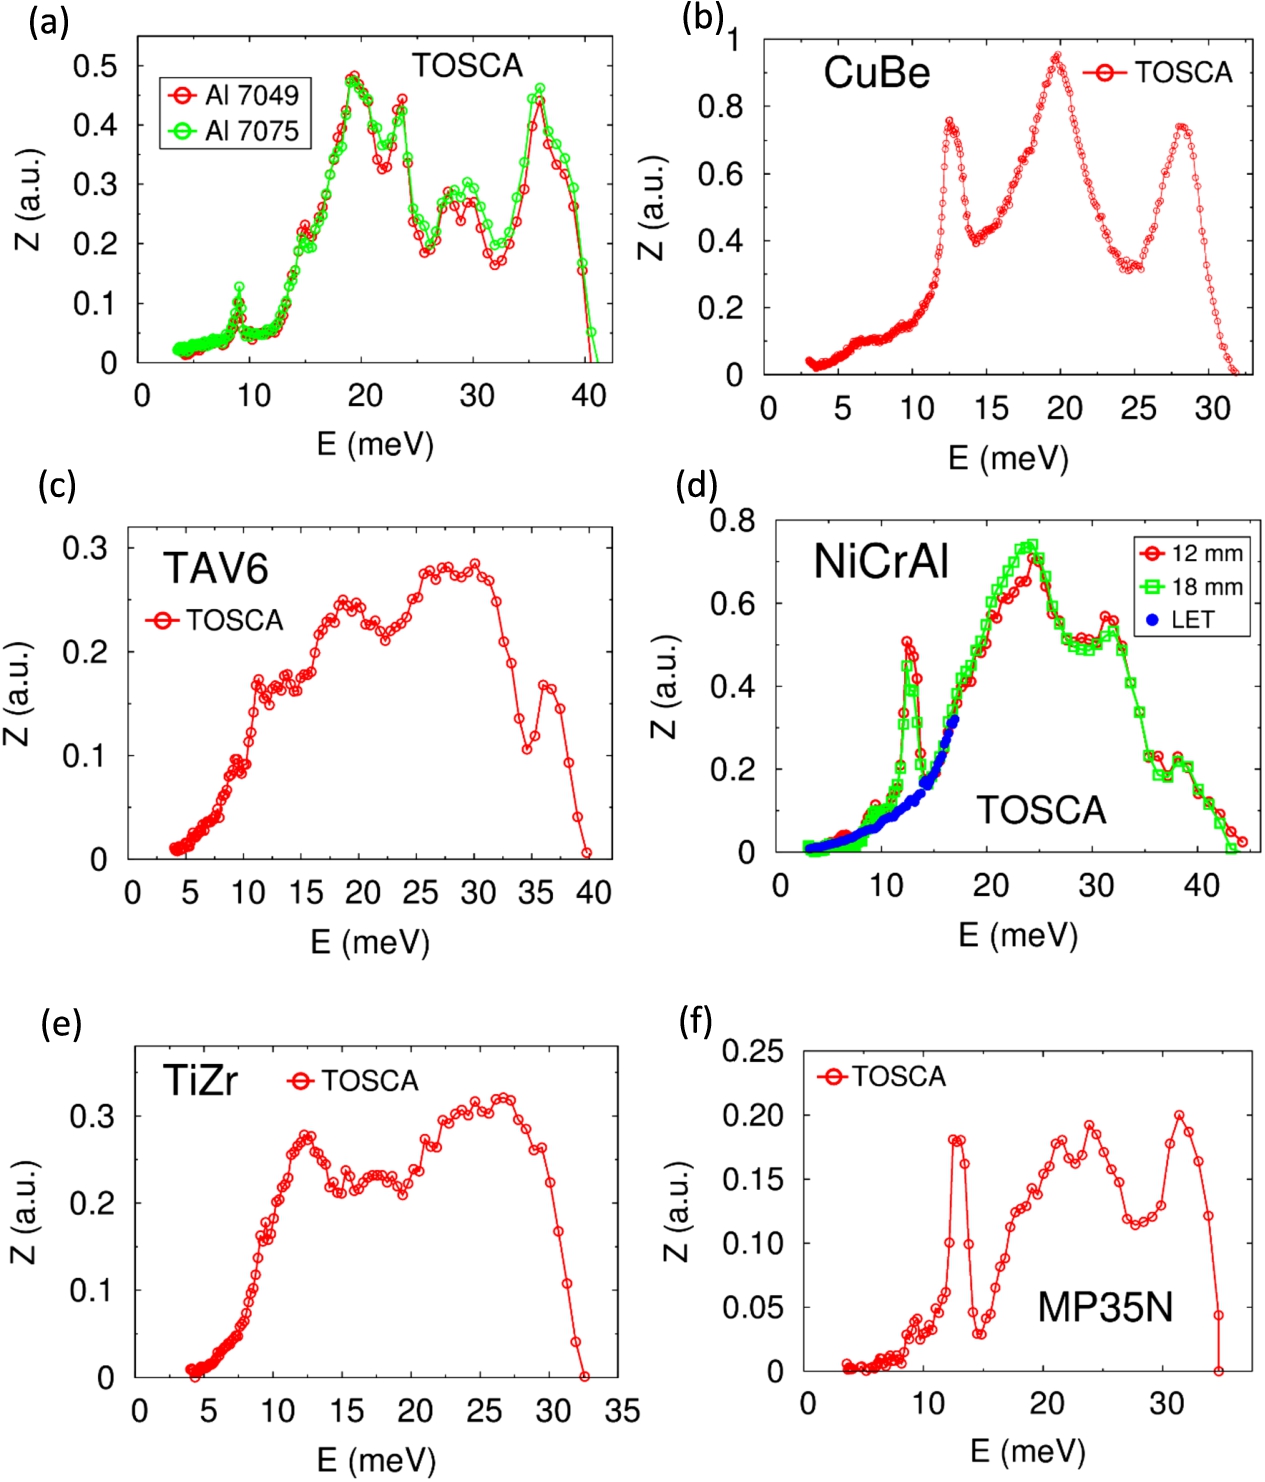
Figure 11 displays the GDoS obtained for vanadium, as a test case. For comparison, the DoS reported in Ref. [19] is also displayed. We see a very good agreement except in the region between 8 and 15 meV. Since vanadium is an incoherent scatterer, the incoherent approximation is exact and the origin of the broad peak between 8 and 15 meV is unclear.
The GDoS of the different alloys are displayed in Fig. 12. The two aluminium alloys show remarkably similar GDoS (Fig. 12-a), which seem not to be affected by the different fabrication processes. The same observation applies to the two NiCrAl alloys (Fig. 12-d). The sharp peaks centred at about 12 meV shown by the GDoS of CuBe, NiCrAl, and MP35N (Figs 12-a, b, and c, respectively) are suspicious, since they are very similar and reminiscent of the broad peak shown by vanadium at the same position. Indeed, a determination of the GDoS for NiCrAl in the region from 3 to 18 meV from the measurements at LET (blue filled circles in Fig. 12-d) shows no signal of such peak, but otherwise agrees nicely with the GDOS obtained from the TOSCA measurements. However, LET measurements are somehow noisy in that dynamic region and therefore we did not use it for the other alloys. In any case, it seems reasonable to remove from the GDoS the peaks around 12 meV. The effective GDoS obtained from the measurements presented in this work seem very reasonable.
Fig. 11.
Phonon DoS of vanadium obtained from the measurements at the TOSCA instrument. The continuous green line is the DoS reported in Ref. [19].
![Phonon DoS of vanadium obtained from the measurements at the TOSCA instrument. The continuous green line is the DoS reported in Ref. [19].](https://content.iospress.com:443/media/jnr/2019/21-3-4/jnr-21-3-4-jnr190115/jnr-21-jnr190115-g011.jpg)
Fig. 12.
Effective phonon GDoS of the different alloys obtained from the measurements at the TOSCA instrument.
5.Magnetic susceptibility
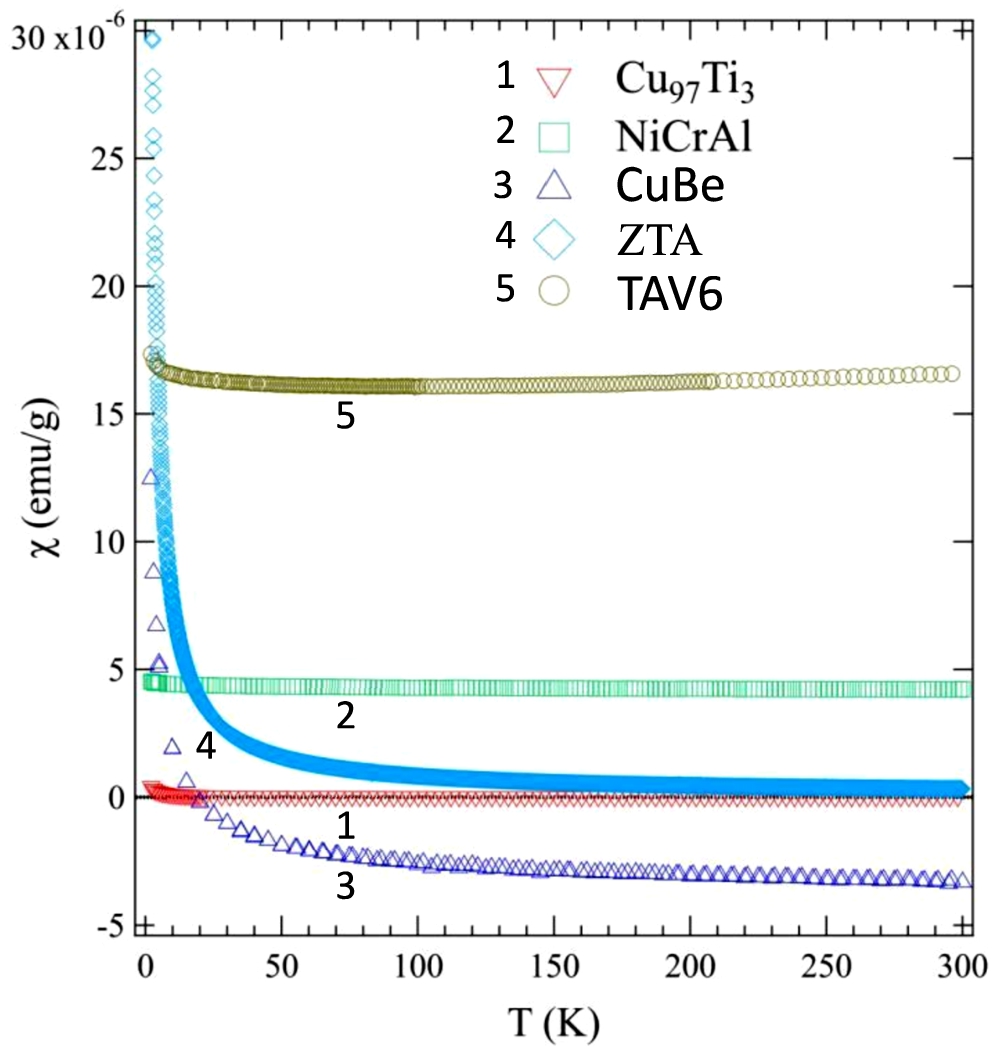
Temperature dependence of the magnetic DC susceptibility measured in constant magnetic field of 100Oe on cooling for some materials commonly used in the construction of high-pressure cells is shown in Fig. 13. The data is presented as mass susceptibility on the same scale for comparison and might be useful as guidance for material selection for high-pressure cells used in particular for muon and inelastic neutron scattering. There is another important aspect of magnetic properties of these materials associated with potential superconducting transitions, but this will require detailed measurements in low-temperature part of the range.
Fig. 13.
Magnetic DC susceptibility measured in constant magnetic field of 100 Oe on cooling for the following materials: Cu97Ti3, NCA4 (NiCrAl), C2 (CuBe), zirconia–toughened alumina (ZTA) and TA2 (TAV6) alloy.
6.Conclusion
The measurements performed at the ISIS facility allows us to estimate the background generated by the different alloys and thus to choose the appropriate material for each instrument. As it follows from the research investigations, TAV6 as a new high-pressure cell material presents to be the best choice. TAV6 is an excellent addition to the existing high-pressure cell material portfolio with combined neutron and mechanic properties and achievable potential gains in respect to reducing material cell cross sections and increased maximum working pressures while obtaining the same sample space as traditional cells. ISIS SE team has had few prototype gas cells designed and tested from TAV6 material. These cells have been successfully used in neutron experiments. The design and manufacture of a clamp cell prototype from TAV6 is underway. The experimental data presented in the paper can be downloaded from the ISIS Neutron and Muon Source Data Journal [6].
The measurements presented here have also been used to characterize the alloys so that they can be modelled in Monte Carlo simulations, with the goal of estimating the background and the signal-to-noise ratio in different situations.
Acknowledgements
We are very grateful to instrument scientists: Svemir Rudic and Jeff Armstrong (TOSCA), Rob Bewley (LET), Winfried Kockelmann (IMAT), Adroja Devashibhai and Helen Walker (MERLIN), Pascal Manuel and Dmitry Khalyavin (WISH) who have managed to find time for our tests in their extremely busy experimental schedules.
 This work was performed within the world class Science and Innovation with Neutrons in Europe 2020 (“SINE 2020”) project, funded by the European Commission, Grant Agreement n°654000.
References
[1] | R.I. Bewley, R.S. Eccleston, K.A. McEwen, S.M. Hayden, M.T. Dove, S.M. Bennington, J.R. Treadgold and R.L.S. Coleman, MERLIN, a new high-count rate spectrometer at ISIS, Physica B 385–386: ((2006) ), 1029–1031. doi:10.1016/j.physb.2006.05.328. |
[2] | R.I. Bewley, J.W. Taylor and S.M. Bennington, LET, a cold neutron multi-disk chopper spectrometer at ISIS, Nuclear Instruments and Methods in Physics 637: ((2011) ), 128. doi:10.1016/j.nima.2011.01.173. |
[3] | S.I. Campbell, M.T.F. Telling and C.J. Carlile, The optimisation of analyser geometry for a near backscattering spectrometer – IRIS on the ISIS pulsed source, Physica B 276–278: ((2000) ), 206. doi:10.1016/S0921-4526(99)01286-7. |
[4] | W.C. Crone, Compositional variation and precipitate structures of copper–beryllium single crystals grown by the Bridgman technique, Journal of Crystal Growth 218: ((2000) ), 381–389. doi:10.1016/S0022-0248(00)00563-7. |
[5] | R. Done, O. Kirichek, B.E. Evans and Z.A. Bowden, High pressure gas vessels for neutron scattering experiments, in: NMI6 – FP7, JRA: Report on Current Inert Gas Pressure Cell Technology, (2010) , arXiv:1007.3135. |
[6] | ISIS Neutron and Muon Source Data Journal, 2019. doi:10.5286/ISIS.E.RB1790346. |
[7] | M.G. Kibble, A.J. Ramirez-Cuesta, C.M. Goodway, B.E. Evans and O. Kirichek, Hydrogen gas sample environment for TOSCA, Journal of Physics: Conference Series 554: ((2014) ), 012006. doi:10.1088/1742-6596/554/1/012006. |
[8] | O. Kirichek, R. Done, C.M. Goodway, M.G. Kibble, B. Evans and Z.A. Bowden, Development of high pressure gas cells at ISIS, Journal of Physics: Conference Series 340: ((2012) ), 012008. doi:10.1088/1742-6596/340/1/012008. |
[9] | S. Klotz, Techniques in High Pressure Neutron Scattering, Taylor & Francis Group, CRC Press, (2012) . ISBN 9781439835623. |
[10] | W. Kockelmann, S.Y. Zhang, J.F. Kelleher, J.B. Nightingale, G. Burca and J.A. James, IMAT a new imaging and diffraction instrument at ISIS, Physics Procedia 43: ((2013) ), 100. doi:10.1016/j.phpro.2013.03.013. |
[11] | V. Laliena et al., this volume. |
[12] | L.F. Mondolfo, Aluminium Alloys: Structure and Properties, Butterworth, London–Boston, (1979) . |
[13] | A. Palmer, D.M. Silevitch, Y. Feng, Y. Wang, R. Jaramillo, A. Banerjee, Y. Ren and T.F. Rosenbaum, Sub-Kelvin magnetic and electrical measurements in a diamond anvil cell with in situ tunability, Review of Scientific Instruments 86: ((2015) ), 093901. doi:10.1063/1.4929861. |
[14] | S.F. Parker, F. Fernandez-Alonso, A.J. Ramirez-Cuesta, J. Tomkinson, S. Rudic, R.S. Pinna, G. Gorini and J. Fernández Castañon, Recent and future developments on TOSCA at ISIS, J. Phys.: Conf. Ser. 554: ((2014) ), 012003. doi:10.1088/1742-6596/554/1/012003. |
[15] | M. Peters, J. Hemptenmacher, J. Kumpfert and C. Leyens, Structure and properties of titanium and titanium alloys, in: Titanium and Titanium Alloys. Fundamentals and Applications, C. Leyens and M. Peters, eds, Wiley-VCH Verlag, Weinheim, (2003) . doi:10.1002/3527602119. |
[16] | D.L. Price and K. Skold, in: Neutron Scattering, K. Skold and D.L. Price, eds, Academic Press, Orlando, (1986) . |
[17] | S. Rols, H. Jobic and H. Schober, Monitoring molecular motion in nano-porous solids, C. R. Physique 8: ((2007) ), 777–788. doi:10.1016/j.crhy.2007.07.007. |
[18] | R. Sadykov, C. Pappas, L.J. Bannenberg, R.M. Dalgliesh, P. Falus, C. Goodway and E. Lelièvre-Berna, 1.5 GPa compact double-wall clamp cell for SANS and NSE studies at low temperatures and high magnetic fields, J. Neutron Res. 20: ((2018) ), 25. doi:10.3233/JNR-180056. |
[19] | V.F. Sears, E.C. Svenson and B.M. Powell, Phonon density of states in vanadium, Can. J. Phys. 73: ((1995) ), 726–734. doi:10.1139/p95-107. |
[20] | SINE2020 material research project report, 2019. |

