
Emotion recognition from multichannel EEG signals using K-nearest neighbor classification
Abstract
BACKGROUND:
Many studies have been done on the emotion recognition based on multi-channel electroencephalogram (EEG) signals.
OBJECTIVE:
This paper explores the influence of the emotion recognition accuracy of EEG signals in different frequency bands and different number of channels.
METHODS:
We classified the emotional states in the valence and arousal dimensions using different combinations of EEG channels. Firstly, DEAP default preprocessed data were normalized. Next, EEG signals were divided into four frequency bands using discrete wavelet transform, and entropy and energy were calculated as features of K-nearest neighbor Classifier.
RESULTS:
The classification accuracies of the 10, 14, 18 and 32 EEG channels based on the Gamma frequency band were 89.54%, 92.28%, 93.72% and 95.70% in the valence dimension and 89.81%, 92.24%, 93.69% and 95.69% in the arousal dimension. As the number of channels increases, the classification accuracy of emotional states also increases, the classification accuracy of the gamma frequency band is greater than that of the beta frequency band followed by the alpha and theta frequency bands.
CONCLUSIONS:
This paper provided better frequency bands and channels reference for emotion recognition based on EEG.
1.Introduction
Human emotion includes not only the psychological reaction of a human being to the external world or self-stimulation but also the physiological reaction to these psychological reactions. Human emotion is a combination of human thinking, feeling and behavior.
The role of emotion is ubiquitous in people’s daily lives and work. Analyzing and estimating emotions has become an important interdisciplinary research topic in the fields of psychology, neuroscience, computer science, cognitive science and artificial intelligence.
In recent decades, researchers in multiple fields have proposed various methods for emotion recognition. They can be divided into three main methods. One is based on the study of non-physiological signals such as facial expressions [1] and speech [2]. The advantage of emotion recognition using non-physiological signals is that it is easy to perform and does not require special equipment. The disadvantage is that people can disguise their true emotional states by disguising their facial expressions and phonetic intonations. Thus, the reliability of emotion recognition is not ensured. Moreover, the non-physiological signal recognition method cannot be used for people with disabilities or special diseases. The second approach is the study of physiological signals such as electroencephalogram (EEG) [3], electromyography (EMG) [4], electrocardiogram (ECG) [5], skin resistance (SR) [6], heart rate, pulse rate [6] and so on. These physiological indicators are intrinsic manifestations that are independent of the individuals’ control. Therefore, they are more appropriate and effective for emotion recognition. Unlike other physiological signals, EEG is a noninvasive technique with good temporal resolution and acceptable spatial resolution. Therefore, EEG may play a major role in detecting emotions directly in the brain at higher spatial and temporal resolutions [7]. The third method is emotion recognition based on multimodal fusion. For example, Busso et al. identify four emotions (sadness, anger, happiness and neutrality) by blending facial expressions and speech. Liu et al. fuse EEG signals and EMG signals with the highest classification accuracy of 91.01% [8]. Koelstra and Patras fuse facial expression and electroencephalogram (EEG) signals in the valence and arousal dimensions for emotion classification and regression. And the valence is the pleasure degree of the individual, and the value of valence is changed from small to large, indicating that the emotion is changed from negative to positive. Arousal indicates the degree of activation of the emotion, and the change of arousal from small to large indicates the change of emotion from calm to excitement.
2.Related research
Although different methods are used in emotion recognition with EEG, the ultimate goals of the research are the same. One of the goals is to find suitable features for emotion recognition through different analytic methods and use an optimized classification model to classify and improve the accuracy of emotion classification. Another goal is to identify the most relevant frequency bands and brain regions for emotion recognition activities and provide a solid physiological basis for EEG-based emotion recognition research. In the study of EEG emotion recognition, the EEG time-domain, frequency-domain and time-frequency-domain features are widely used. Zhang et al. [9] use three methods to select the best channels to classify the four emotions (joy, fear, sadness and relaxation) using SVM classifier, and the best classification accuracy over 19 channels is 59.13%
Although excellent temporal resolution and acceptable spatial resolution make EEG a suitable choice for emotion recognition systems, a few EEG channels have poor spatial resolution which has a significant impact on the accuracy of emotion recognition. To overcome this problem, multi-channel EEG signals are often used. In channel selection, many studies choose channels empirically. Mert and Akan select EEG signals from 18 channels (eight pairs of left and right symmetric channels and two central channels in the frontal lobe) for emotion recognition in the valence and arousal dimensions [10]. Nattapong et al. [13] select the 12-channel EEG signals near the frontal lobe for identifying emotion states. These channels are thought to play a major role in emotion recognition [17]. The EEG channels that are selected in these papers mainly correspond to specific scalp positions with specific functions. Some studies suggest exploring the correspondence between emotional states and the entire brain [18]. However, the traditional research methods usually only explore EEG emotions in either specific scalp positions or the whole brain area. The influence of the number of EEG channels on EEG emotion recognition has not been systematically studied.
Based on the DEAP data set, this paper discussed the influence of the 10-channel, 14-channel and 18-channel EEG signals based on experience selection and the 32-channel EEG signals of the whole brain on emotion recognition accuracy. The EEG signals were divided into multiple time windows. Each time window was transformed into several frequency bands by discrete wavelet transform (DWT). We extracted entropy and energy as features from each frequency band and the KNN classifier was used to identify the emotional states. In addition, the classification effects using different frequency bands were discussed.
The goal of this paper is to explore the influence of the emotion recognition accuracy of EEG signals in different frequency bands (gamma, beta, alpha and theta) and different number of channels (10-channel, 14-channel, 18-channel and 32-channel), to provide better frequency bands and channels reference for emotion recognition based on EEG.
3.Preliminaries
In this section, we systematically describe the model of emotion, the classification method and the selection of time windows.
3.1Model of emotion
The research on emotion classification has been controversial and inconclusive. People’s emotions are ever-changing. Whether each emotion exists independently or there are correlations among different emotions is a question that scholars still discuss.
Two types of models are used to describe the general state of emotion: One is the discrete emotion model, which includes the basic emotions such as sadness, anger, fear, surprise, disgust and happiness. However, there is controversy regarding the selection of basic emotions. Different researchers have different views. The other is a multi-dimensional emotional model. Initially, it is a two-dimensional model of valence and arousal. Valence represents the degree of delight of the individual and varies from negative to positive. Arousal represents the degree of activation of emotions and varies from calm to excitement. Later, a three-dimensional emotional model appears, which include valence, arousal and preference. For example, Xu and Plataniotis [19] identify two categories of emotion in each dimension of a three-dimensional model. Four-dimensional (valence, arousal, dominance and preference) emotional models have also been applied. For example, Liu et al. [8] identify two types of emotion in each dimension of four-dimensional emotion.
3.2KNN classifier
The K-nearest neighbor (KNN) method is a simple statistics-based classification method, which is commonly used in mature classification algorithms. Its core strategy is to identify the K samples that are closest to the unknown sample points and determine the category information of the unknown samples from the majority of the K samples.
3.3Temporal window
The EEG acquisition time is usually longer than the accurate recognition time of the emotional state. To accurately identify the emotional state, EEG signals are usually divided into segments by windows. However, the length of the windows is a controversial topic. Kumar et al. [20] use a window length of 30 s for EEG signals. Thammasan et al. test the emotion recognition performance with 1–8 s EEG windows. The results show that smaller windows (1–4 s) achieve higher performance than larger windows (5–8 s) [13]. Levenson et al. determine that the emotional hold time is to be 0.5–4 s [21]. Mohammadi et al. [23] test window lengths of 2 s and 4 s and find that the window length of 4 s yield a better emotional classification result. Zhang et al. also select the temporal window size of 4 s for classifying the four types of emotion [9].
4.Materials and methods
4.1Data acquisition
![Emotional state: a Valence, b Arousal, c Dominance and d Liking [22, 26].](https://content.iospress.com:443/media/thc/2018/26-S1/thc-26-S1-thc174836/thc-26-thc174836-g001.jpg)
In this paper, we used data from the DEAP dataset that have been post-processed in MATLAB. In this dataset, 32 subjects viewed 40 clips of video that could stimulate various emotions. The length of each video is 60 s. Each subject provided a personal rating in the valence-arousal-dominance-liking four dimensions, ranging from 1 to 9, 1 is the smallest, and 9 is the largest. Emotional states in the four dimensions are shown in Fig. 1. emotional state changes with the increase of personal ratings from left to right, for example, Fig. 1a shows the change of valence (degree of pleasure) from small to large (from negative to positive), and Fig. 1b shows the change of arousal (degree of activation) from small to large (from calm to excited). This dataset recorded seven physiological modalities of the participants, including 32-channel EEG signals and other peripheral physiological signals of 8 channels. During the pre-processing phase, a preparation time of 3 s was added to each video, thereby changing the total time of each video to 63 s. EOG interference was removed from the original signal and a bandpass filter was also applied. The sampling frequency of the original signal was reduced from 512 Hz to 128 Hz. In practice, we removed the first 3 seconds of all data and analyzed the remaining 60 s of data. This paper analyzed the emotion in the valence and arousal dimensions. If an individual’s score is greater than 4.5, the level of arousal/valence is classified as high, whereas if the individual’s score is less than 4.5, the level of arousal/valence is classified as low [22, 23].
4.2Channel selection
This paper discussed the emotional classification of EEG in 10 channels, 14 channels, 18 channels and 32 channels. Of these, 10, 14, and 18 channels were selected based on experience of others and 32 channels used all EEG channels data on the DEAP dataset. According to Mohammadi et al., positive emotions are related to the left frontal area of the brain, and negative emotions are related to the right frontal area of the brain [24]. The positions of our 10 channels in the brain are: FP1-FP2, F3-F4, F7-F8, FC5-FC6 and FC1-FC2 [23]. 14 channels are composed of 10 channels plus AF3-AF4, C3-C4 [11]. Eighteen channels are composed of 14 channels plus T7-T8, Fz and Cz.
4.3Preprocessing
We used the average mean reference (AMR) [23, 24] method to pre-process the EEG data. Then, to eliminate individual differences and channel differences, we normalized the EEG signals for each channel of each person to [0, 1] using the min-max normalization method, thereby reducing the computational complexity.
4.4Feature extraction
In this paper, we used discrete wavelet transform (DWT) to extract EEG features. A series of wavelet coefficients were obtained by stretching and shifting the EEG signals using the mother wavelet function. Different researchers select different mother wavelet functions, and different mother wavelet functions have different emotion classification effects. In our study, the window of 4 s was used for each EEG channel and each window overlaps the previous one by 2 s, for a total of 29 windows. Then, the data of each window were decomposed 4 times by using db4 DWT and extracting all the high frequency components as four frequency bands, namely, gamma, beta, alpha and theta, as listed in Table 1. Finally, the entropy and energy of each frequency band were calculated as features. Thus, there are 2 features in each band for each channel. There are 20 (2
Table 1
Decomposition of EEG signal into different frequency bands using DWT
| Frequency band | Frequency range (Hz) | Frequency bandwidth (Hz) | Decomposition level |
| Theta | 4–8 | 4 | D4 |
| Alpha | 8–16 | 8 | D3 |
| Beta | 16–32 | 16 | D2 |
| Gamma | 32–64 | 32 | D1 |
4.4.1Entropy
Entropy represents the degree of disorder of the signals. The greater the entropy, the higher the degree of disorder of the signals. It can be used to analyze time series signals. The entropy of each band is calculated as follows:
4.4.2Energy
The energy for each band is calculated as follows:
where
4.5Classification
We used KNN to classify the emotion in the valence and arousal dimensions, for 32 subjects, each subject watched 40 videos, and we divided the data generated by viewing each video into 29 windows, and the total number of samples is 37120 (32
5.Results and discussion
5.1Different channel combinations of full frequency bands
We compared the emotion recognition accuracies of 10 channels, 14 channels,18 channels and 32 channels of EEG signals in the valence and arousal dimensions. As shown in Table 2, we find that the valence and arousal dimensions of all channel combinations have similar classification accuracies. In both emotion dimensions, the classification accuracy of the emotional state increases with the increase of the number of channels. The highest classification accuracies of 87.03% (valence) and 87.90% (arousal) were obtained when using 32-channel EEG signals. Paired sample T-tests for different channel combinations are shown in Table 3, and all differences are significant (
Table 2
All frequency bands classification of each channel combination
| Emotion dimensions | No. channels | |||
|---|---|---|---|---|
| 10 | 14 | 18 | 32 | |
| Valence | 82.48% | 84.53% | 85.74% | 87.03% |
| Arousal | 83.27% | 85.26% | 86.46% | 87.90% |
Table 3
Difference verification between different channels in full band (1
| 10 | 14 | 18 | 32 | |
|---|---|---|---|---|
| 10 | 1** | 1** | 1** | |
| 14 | 2** | 1* | 1** | |
| 18 | 2** | 2* | 1** | |
| 32 | 2** | 2** | 2** |
**,
Figure 2.
Accuracies of different EEG frequency bands and different channel combinations in the (a) valence and (b) arousal dimensions.
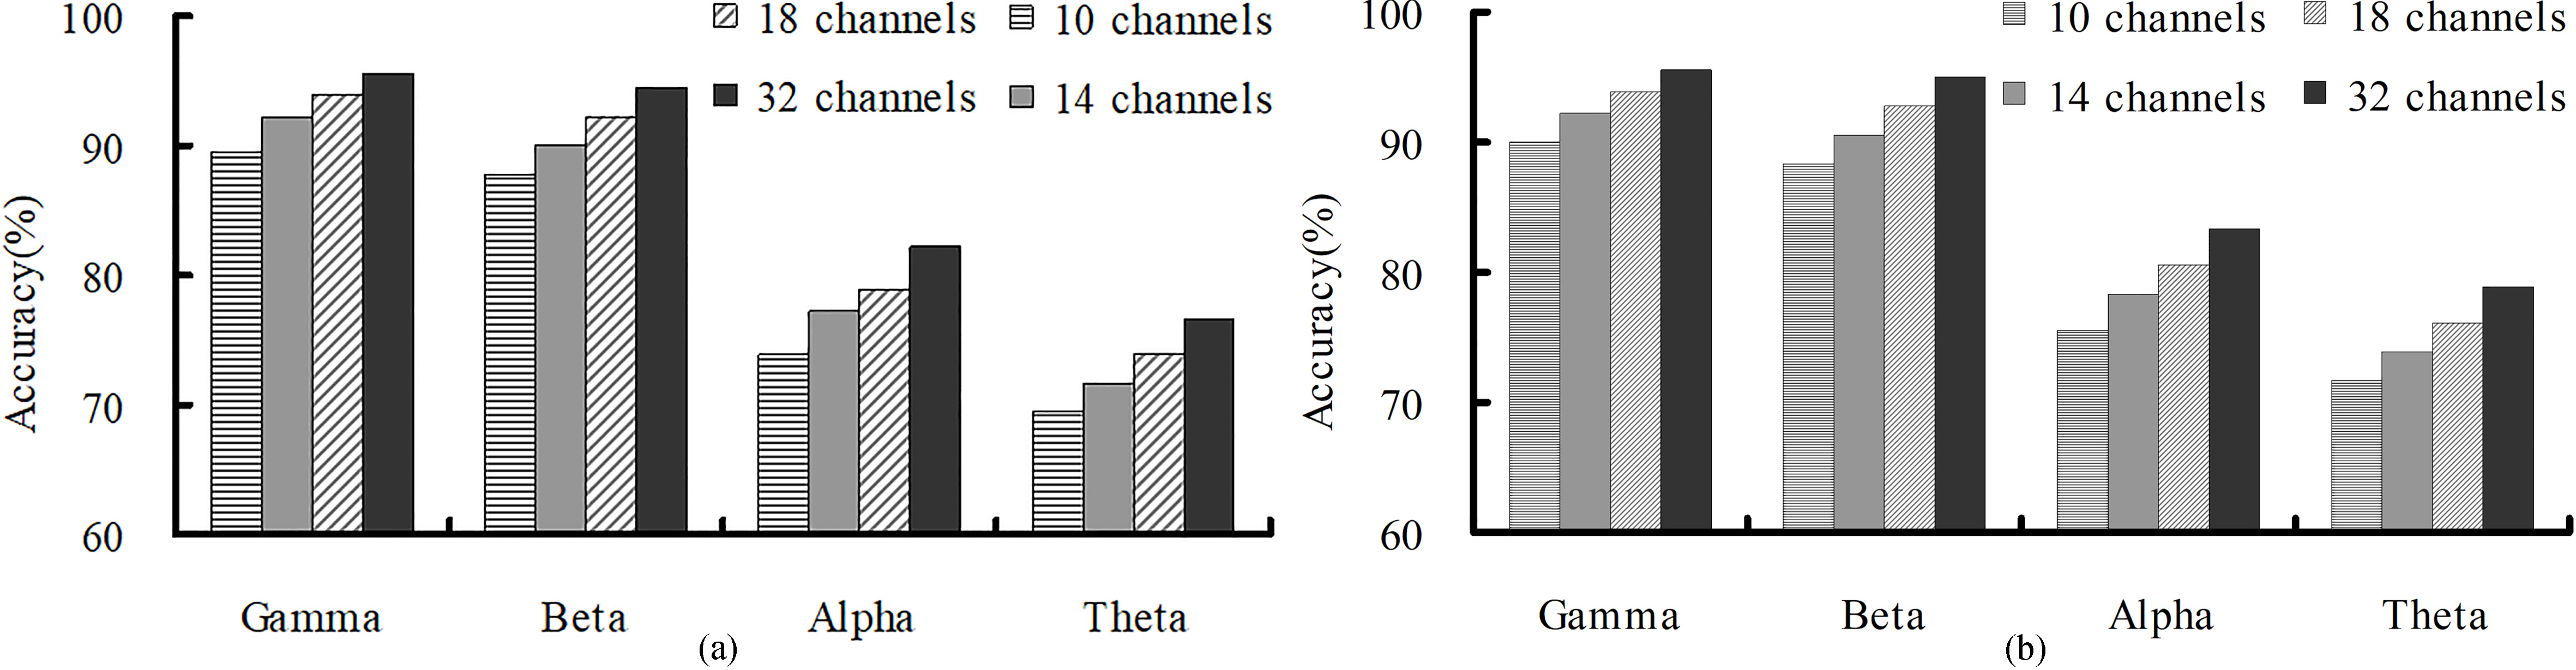
Table 4
Accuracy of different EEG frequency bands and different channel combinations
| Emotion dimensions | Frequency bands | No. channels | |||
|---|---|---|---|---|---|
| 10 | 14 | 18 | 32 | ||
| Valence | Gamma | 89.54% | 92.28% | 93.72% | 95.70% |
| Beta | 87.64% | 90.21% | 92.23% | 94.44% | |
| Alpha | 73.91% | 77.14% | 79.08% | 81.99% | |
| Theta | 69.67% | 71.93% | 74.01% | 76.81% | |
| Arousal | Gamma | 89.81% | 92.24% | 93.69% | 95.69% |
| Beta | 88.17% | 90.67% | 92.59% | 94.98% | |
| Alpha | 75.31% | 78.19% | 80.41% | 83.47% | |
| Theta | 71.52% | 74.16% | 76.05% | 78.92% | |
Table 5
Difference verification between different channel combinations of each frequency band (1
| Gamma | 10 | 14 | 18 | 32 |
|---|---|---|---|---|
| 10 | 1** | 1** | 1** | |
| 14 | 2** | 1* | 1** | |
| 18 | 2** | 2* | 1** | |
| 32 | 2** | 2** | 2** |
| Beta | 10 | 14 | 18 | 32 |
|---|---|---|---|---|
| 10 | 1** | 1** | 1** | |
| 14 | 2** | 1* | 1** | |
| 18 | 2** | 2* | 1** | |
| 32 | 2** | 2** | 2** |
| Alpha | 10 | 14 | 18 | 32 |
|---|---|---|---|---|
| 10 | 1** | 1** | 1** | |
| 14 | 2** | 1* | 1** | |
| 18 | 2** | 2* | 1** | |
| 32 | 2** | 2** | 2** |
| Theta | 10 | 14 | 18 | 32 |
|---|---|---|---|---|
| 10 | 1** | 1** | 1** | |
| 14 | 2** | 1* | 1** | |
| 18 | 2** | 2* | 1** | |
| 32 | 2** | 2** | 2** |
**,
Table 6
Difference verification between different frequency bands of each channel combination (1
| 10 | Gamma | Beta | Alpha | Theta |
|---|---|---|---|---|
| Gamma | 1* | 1** | 1** | |
| Beta | 2** | 1** | 1** | |
| Alpha | 2** | 2** | 1** | |
| Theta | 2** | 2** | 2** |
| 14 | Gamma | Beta | Alpha | Theta |
|---|---|---|---|---|
| Gamma | 1** | 1** | 1** | |
| Beta | 2** | 1** | 1** | |
| Alpha | 2** | 2** | 1** | |
| Theta | 2** | 2** | 2** |
| 18 | Gamma | Beta | Alpha | Theta |
|---|---|---|---|---|
| Gamma | 1** | 1** | 1** | |
| Beta | 2** | 1** | 1** | |
| Alpha | 2** | 2** | 1** | |
| Theta | 2** | 2** | 2** |
| 32 | Gamma | Beta | Alpha | Theta |
|---|---|---|---|---|
| Gamma | 1* | 1** | 1** | |
| Beta | 2** | 1** | 1** | |
| Alpha | 2** | 2** | 1** | |
| Theta | 2** | 2** | 2** |
**,
5.2Varying the EEG frequency bands and channel combinations
We compared the classification accuracies of different frequency bands (gamma, beta, alpha and theta) and channel combinations (10, 14, 18 and 32) in the valence and arousal dimensions. According to Figs 1b and 2a, and Table 4, the classification accuracies of the gamma and beta frequency bands are far higher than those of the alpha and theta frequency bands, regardless of the combination of channels or whether the valence or the arousal dimension is considered. The classification accuracy of the gamma frequency band is higher than that of the beta frequency band and the classification accuracy of the theta frequency band is the lowest. The results show that the higher-frequency band is more closely associated with arousal/valence than the lower-frequency band. For different channel combinations, the classification accuracy increases with -the number of channels, and the highest classification accuracies are 95.70% (valence) and 95.69% (arousal) in the gamma band using 32-channel EEG signals. In different frequency bands, the classification accuracies of EEG in the valence and arousal dimensions still depend on the number of EEG channels. Paired samples T-test for differences between different channel combinations (10, 14, 18, 32) in each band and for the differences between the different frequency bands (Gamma, Beta, Alpha, Theta) for each channel combination are shown in Tables 5 and 6.
5.3Comparison of results
In this section, our results are compared with results of other’s studies on the DEAP dataset. In Table 7, the results of this comparison are listed, which indicate that the classification accuracy of our study on different channel combinations (10, 14, 18 and 32) are superior to results of other studies.
Table 7
Accuracy comparison of different studies
| Reference | DEAP dataset and | Classifier | No. | Accuracy | Accuracy |
|---|---|---|---|---|---|
| feature | channels | (Valence) (%) | (Arousal) (%) | ||
| [25] (2014) | Raw data bandpower feature of 4 frequency bands | SVM (32-fold cross-validation of 32 subjects) | 10 | 64.90 | 64.90 |
| [22] (2016) | Raw data and individula normalization Entropy and Energy of gamma frequency band | KNN (10-fold cross-validation of all samples) | 10 | 86.75 | 84.05 |
| [11] (2016) | Preprocessed data statistical features, band power, Hjorth parameters and fractal dimension | SVM (8-fold cross-validation of all samples) | 14 | 73.14 | 73.06 |
| [10] (2016) | Preprocessed data power ratio, power spectral density, entropy, Hjorth parameters and correlation | ANN (leave-one-out cross- validation of each subject) | 18 | 72.87 | 75.00 |
| [8] (2016) | Preprocessed data PSD and DE | SVM (90% for training and 10% for testing of all samples) | 32 | 85.20 | 80.50 |
| [18] (2016) | Raw data Narrow-band PSD | DBN (5-fold cross-validation of each subject) | 32 | 88.59 | 88.33 |
| Our research (2018) | Preprocessed data and channel normalization Entropy and Energy of gamma frequency band | KNN (10-fold cross-validation all samples) | 10 | 89.54 | 89.81 |
| 14 | 92.28 | 92.24 | |||
| 18 | 93.72 | 93.69 | |||
| 32 | 95.70 | 95.69 |
6.Conclusions
In the emotional classification of EEG, the methods of EEG data preprocessing, the features of EEG, the feature selection method used (if present), the number and location of channels, the classification of EEG data and the choice of classifier affect the correct rate of EEG emotional classification, It is very difficult for us to simply evaluate the effect of a certain factor on the accuracy of EEG classification in different papers unless the treatment of EEG data is exactly the same among other factors. In general, each paper contains a comparison of the effect of one or more of the above factors on the accuracy of EEG classification. We can discuss the impact of a single factors or a combination of multiple factors on the correct rate of affective classification in a paper, for example: reference [25] aims to study various feature extraction techniques for EEG signals, extract bandwidth power and power spectral density (PSD) features of four frequency bands as features, which are trained and tested on SVM with 40-fold cross-validation (for video selection) and 32-fold cross-validation (for person selection), respectively. The results show that the better classification accuracy is obtained by using the bandwidth power of the four frequency bands and 32-fold cross-validation. Different methods of using dataset have an impact on the classification accuracy. The reference [22] compares the window differences between 2 s and 4 s of EEG, the differences of different frequency bands, and the differences between SVM and KNN classifiers, the results show that 4 s window, gamma band, KNN classifier has a good effect on EEG emotion classification. The reference [11] evaluates the accuracy rate of affective classification of EEG signals using different feature selection methods (minimum redundancy maximum relevance mRMR and genetic algorithm (GA) under different SVM parameters, the results show that mRMR results in a higher classification accuracy with fewer features, and SVM has better classification results using RBF kernels and
This paper explores the influence of 10-channel, 14-channel, 18-channel and 32-channel EEG signals on classification accuracy. A normalization method was used to preprocess data from the DEAP dataset. Data from windows of 4 s are divided into four frequency bands (gamma, beta, alpha and theta) using db4 DWT 4-time decomposition. Then, the entropy and energy of each band are calculated as the input features of a KNN classifier. The results show that the classification accuracy of the gamma frequency band is the highest, regardless of the valence or arousal dimension. Based on the gamma frequency band, the classification accuracies of valence of 10, 14, 18, and 32 channels reached 89.54%, 92.28%, 93.72% and 95.70%, respectively, and the classification accuracies of arousal were 89.81%, 92.24%, 93.69% and 95.69%. This shows that the gamma frequency band is more relevant to the emotional state in the valence and arousal dimensions compared to the low frequency band. In addition, it also shows that increasing the number of EEG channels can improve the classification accuracy of emotional states. Our research provides a reference for the selection of EEG channels for emotion recognition.
Acknowledgments
This work is supported by the National Natural Science Foundation of China (61602017), the National Basic Research Programme of China (2014CB744600), ‘Rixin Scientist’ Foundation of Beijing University of Technology (2017-RX(1)-03), the Beijing Natural Science Foundation (4164080), the Beijing Outstanding Talent Training Foundation (2014000020124G039), the National Natural Science Foundation of China (61420106005) , the International Science and Technology Cooperation Program of China (2013DFA32180), the Special fund of Beijing Municipal Science and Technology Commission (Z171100000117004 and Z151100003915117), Beijing Municipal Administration of Hospitals Clinical Medicine Development of Special Funding Support (ZYLX201607), and Beijing Municipal Administration of Hospitals Ascent Plan (DFL20151801).
Conflict of interest
None to report.
References
[1] | Zhu JY, et al., EEG-based emotion recognition using discriminative graph regularized extreme learning machine. in: International Joint Conference on Neural Networks. (2014) . |
[2] | Ang J, et al., Prosody-Based Automatic Detection Of Annoyance And Frustration In Human-Computer Dialog. in Icslp. (2002) . |
[3] | Wang XW, Nie D, Lu BL. Emotional state classification from EEG data using machine learning approach. Neurocomputing, (2014) . 129: (4): 94-106. |
[4] | Witvliet CVO, Vrana SR. Play it again Sam: Repeated exposure to emotionally evocative music polarises liking and smiling responses, and influences other affective reports, facial EMG, and heart rate. Cognition & Emotion, (2007) . 21: (1): 3-25. |
[5] | Cai J, Liu G, Hao M. The Research on Emotion Recognition from ECG Signal. in International Conference on Information Technology and Computer Science. (2009) . |
[6] | Lee C, et al., Using neural network to recognize human emotions from heart rate variability and skin resistance. in International Conference of the Engineering in Medicine & Biology Society. (2005) . |
[7] | Liu Y, Sourina O, Nguyen MK. Real-Time EEG-Based Human Emotion Recognition and Visualization. in: International Conference on Cyberworlds. (2010) . |
[8] | Liu W, Zheng WL, Lu BL. Emotion Recognition Using Multimodal Deep Learning. (2016) . 521-529. |
[9] | Zhang J, et al., ReliefF-Based EEG Sensor Selection Methods for Emotion Recognition. Sensors, (2016) . 16: (10): 1558. |
[10] | Mert A, Akan A. Emotion recognition from EEG signals by using multivariate empirical mode decomposition. Pattern Analysis & Applications. 2016: : 1-9. |
[11] | Atkinson J, Campos D. Improving BCI-based emotion recognition by combining EEG feature selection and kernel classifiers. Expert Systems with Applications. (2016) ; 47: : 35-41. |
[12] | Li M, Lu BL. Emotion classification based on gamma-band EEG. Conf Proc IEEE Eng Med Biol Soc. (2009) : 1323-1326. |
[13] | Thammasan N, Fukui KI, Numao M. Application of deep belief networks in eeg-based dynamic music-emotion recognition. in: International Joint Conference on Neural Networks. (2016) . |
[14] | Li X, et al., Emotion recognition from multi-channel EEG data through Convolutional Recurrent Neural Network. in: IEEE International Conference on Bioinformatics and Biomedicine. (2017) . |
[15] | Cheng B, Liu G. Emotion Recognition from Surface EMG Signal Using Wavelet Transform and Neural Network. Journal of Computer Applications. (2008) ; 28: (2): 1363-1366. |
[16] | Kyamakya K, et al., A novel EEG-based emotion recognition approach for e-healthcare applications. in: ACM Symposium on Applied Computing. (2016) . |
[17] | Koelsch S. Brain correlates of music-evoked emotions. Nature Reviews Neuroscience. (2014) ; 15: (3): 170. |
[18] | Hamann S. Mapping discrete and dimensional emotions onto the brain: controversies and consensus. Trends in Cognitive Sciences. (2012) ; 16: (9): 458-66. |
[19] | Xu H, Plataniotis KN. Affective states classification using EEG and semi-supervised deep learning approaches. in: IEEE International Workshop on Multimedia Signal Processing. (2017) . |
[20] | Kumar N, Khaund K, Hazarika SM. Bispectral Analysis of EEG for Emotion Recognition. in: Procedia Computer Science. (2016) ; 84: : 31-35. |
[21] | Levenson RW, et al., Emotion and autonomic nervous system activity in the Minangkabau of west Sumatra. Journal of Personality & Social Psychology, (1992) . 62: (6): 972-88. |
[22] | Koelstra S, et al., DEAP: A Database for Emotion Analysis; Using Physiological Signals. IEEE Transactions on Affective Computing, (2012) . 3: (1): 18-31. |
[23] | Mohammadi Z, Frounchi J, Amiri M. Wavelet-based emotion recognition system using EEG signal. (2017) : Springer-Verlag. 1-6. |
[24] | Murugappan M, et al., EEG feature extraction for classifying emotions using FCM and FKM, in: Wseas International Conference on Applied Computer and Applied Computational Science, (2008) . |
[25] | Wichakam I, Vateekul P. An evaluation of feature extraction in EEG-based emotion prediction with support vector machines. in International Joint Conference on Computer Science and Software Engineering. (2014) . |
[26] | Verma GK, Tiwary US. Affect representation and recognition in 3d continuous valence – arousal – dominance space. Multimedia Tools and Applications, (2016) : 1-25. |

