
Characterizing Camptocormia in Parkinson’s Disease Using Muscle Ultrasonography
Abstract
Background:
Camptocormia (CC) is the forward-bending of the spine of more than 30 degrees that can be found in Parkinson’s disease (PD) as a disabling complication. Detection of changes in paraspinal lumbar musculature in CC is of value for choosing treatment strategies.
Objective:
To investigate whether these changes can be detected using muscle ultrasonography (mUSG).
Methods:
Age and sex-matched groups comprised 17 PD patients with CC (seven acute, PD-aCC; 10 chronic PD-cCC), 19 PD patients with no CC, and 18 healthy controls (HC). Lumbar paravertebral muscles (LPM) on both sides were assessed using mUSG by two different raters blinded to the group assignment. Groups were compared with regard to the linear measurements of the muscle thickness as well as semi-quantitative and quantitative (grayscale) analyses of muscle echogenicity using a univariate general linear model.
Results:
All assessments showed substantial interrater reliability. The PD-cCC group had significantly thinner LPM compared to groups with no CC (PD and HC). Groups of PD-aCC and PD-cCC differed from the groups of no CC in quantitative and semi-quantitative analyses of LPM echogenicity, respectively.
Conclusion:
Assessment of LPM in PD patients with CC can be reliably performed using mUSG. Also, mUSG may be used as a screening tool to detect CC-related changes in thickness and echogenicity of the LPM in patients with PD.
INTRODUCTION
Camptocormia (CC) is a major complication of advanced Parkinson’s disease (PD), characterized by a non-fixed abnormal thoracolumbar flexion of the spine that resolves in supine position [1]. It can be found in about 8–10% of patients with PD [2]. The International Parkinson and Movement Disorders Society (MDS) Study Group on postural abnormalities defined CC as a forward bending angle of greater than 30° [1].
The etiology of CC is still unknown. Evidence from the literature points in the direction of a centrally caused abnormality in systems regulating trunk posture. [3, 4] However, there is the empirically proven myopathy of the paravertebral muscles, which must also be taken into account and may be interpreted as of secondary origin [5]. This myopathic process demonstrates itself as non-specific but monomorphic pathological findings in electromyography (EMG), magnetic resonance imaging (MRI), and muscle biopsies of the lower back muscles [6]. The myopathic changes revealed in these biopsies include edema and swelling in acute stages, and loss of type-I fibers, atrophy, and fatty degeneration in chronic stages [5, 7]. As a result, these changes immensely disturb the quality of life due to relevant back pain and cause a further deterioration of mobility and autonomy [5].
Even if a secondary myopathy is considered, the changes in the paravertebral muscles are still relevant, as the effect of the pathological process displaying the grade of chronification may have consequences in terms of potential treatment options [5]. In this regard, demonstrating the above-mentioned changes in the paravertebral muscles reflecting the duration and chronification of CC is of critical value [8, 9]. Most of the time, MRI is the diagnostic tool of choice for monitoring the CC-associated muscular changes in the clinical routine despite the considerable cost and the limitation that MRI is not possible in all patients (e.g., due to metal implants, claustrophobia, movement artifacts caused by to dyskinesia, etc.). As an alternative, muscle ultrasonography (mUSG) may be considered for the same purpose which offers a more practical, patient-friendly, and inexpensive assessment opportunity. Moreover, findings of mUSG in several similar conditions, including myopathy and inflammatory muscle diseases, are well-established [10] and numerous studies evaluating paravertebral muscles using mUSG have been published so far [11–14]. These indicate that the employment of mUSG to detect muscle changes in CC is potentially feasible. However, so far no study has been published investigating muscle changes in PD patients with CC using mUSG according to our knowledge. Therefore, we set out to explore whether mUSG is applicable to detect muscular changes of CC in PD.
METHODS
Participants
In this cross-sectional study, patients with PD diagnosed according to the UK Brain Bank diagnostic criteria [15] suffering from CC were recruited from the Department of Neurology, Christian-Albrechts-University of Kiel in Germany. A non-fixed thoracolumbar flexion of the spine more than 30°, assessed as previously suggested [9], was used to define CC. These assessments were either done by evaluation of the photographs of the participants using the suggested online tool (https://www.neurologie.uni-kiel.de/de/axial-posturale-stoerungen/camptoapp), or in most, measuring the flexion at the patient visit. PD patients with CC (PD-CC) were further divided into the groups of acute and chronic CC (aCC, cCC) with a cut-off of 36 months (aCC≤36 months, cCC > 36 months) based on studies examining muscle pathology in CC [3, 6]. For the assessment of CC duration, patient/caregiver reports and medical records were taken into account in detail. Additionally, two other age (±3 years) and sex-matched groups with no CC comprising PD patients and healthy controls (HC) were included. HC were recruited from the relatives of the PD patients and volunteers with no neurodegenerative disease or any disease affecting the spinal musculature according to their medical history and a physical examination. PD and CC-related data, including the duration of CC, the angle of flexion, the presence of back pain, and body mass index (BMI), were noted. Participants with a history of surgery in the lumbar area (such as disc herniation) were excluded. The assessments in the PD groups were done at the drug “on” state. Study data were collected between 2019 and 2021, and the study was approved by the ethical committee of the Medical Faculty of the Christian-Albrechts-University of Kiel (D 402/18). All procedures were in accordance with the Declaration of Helsinki.
Sonographic examination and assessments
Participants in prone or side-lying positions [16] were examined with a high-end ultrasound machine (Mindray DC-8 Expert, Shenzhen, China) using a curved array transducer with a frequency of 3.6–7.2 MHz (Mindray, C7-3E). A pillow was placed under the belly to eliminate lumbar lordosis in the prone position. Examinations were performed by an experienced sonographer (RY) in two steps in a standardized procedure. First, starting from the sacral level, paravertebral muscles between L5-L1 were evaluated by holding the probe parallel to the spine and away from the midline on each side, allowing an evaluation of the lumbar musculature at the sagittal/longitudinal interlaminar plane (Fig. 1). Then, at the level of L3, an axial/cross-sectional image of the multifidus muscle of each side was stored (Fig. 2). In addition to that, the sonographic image of the right biceps brachii muscle at the cross-sectional plane was also stored in each participant to enable a within-subject assessment of muscle echogenicity. In all examinations, the angle of the probe was held constant, perpendicular to the skin. The settings were adjusted to a penetration depth of 8 cm, a gain of 41, and a dynamic range of 110 dB. To allow the comparison of the echo intensities, settings were held constant in all examinations of all participants.
Fig. 1
Longitudinal images of the paravertebral musculature at the interlaminar plane. A) Image of a 62-year-old male participant with no Parkinson’s disease or camptocormia. The thickness of the muscle was assessed by drawing a perpendicular line between the end of the subcutaneous tissue and the lamina of the lumbar vertebra for each vertebral level as shown. B) Image of a 68-year-old female participant with Parkinson’s disease but no camptocormia. C) Image of an 80-year-old male participant with Parkinson’s disease and acute camptocormia with a 45° flexed posture. D) Image of a 70-year-old female participant with Parkinson’s disease and chronic camptocormia with an 80° flexed posture. Note the reduced muscle thickness in the patient with chronic camptocormia (D). Also, increased echogenicity can be seen in patients with acute and chronic camptocormia indicating muscle pathology (C and D).
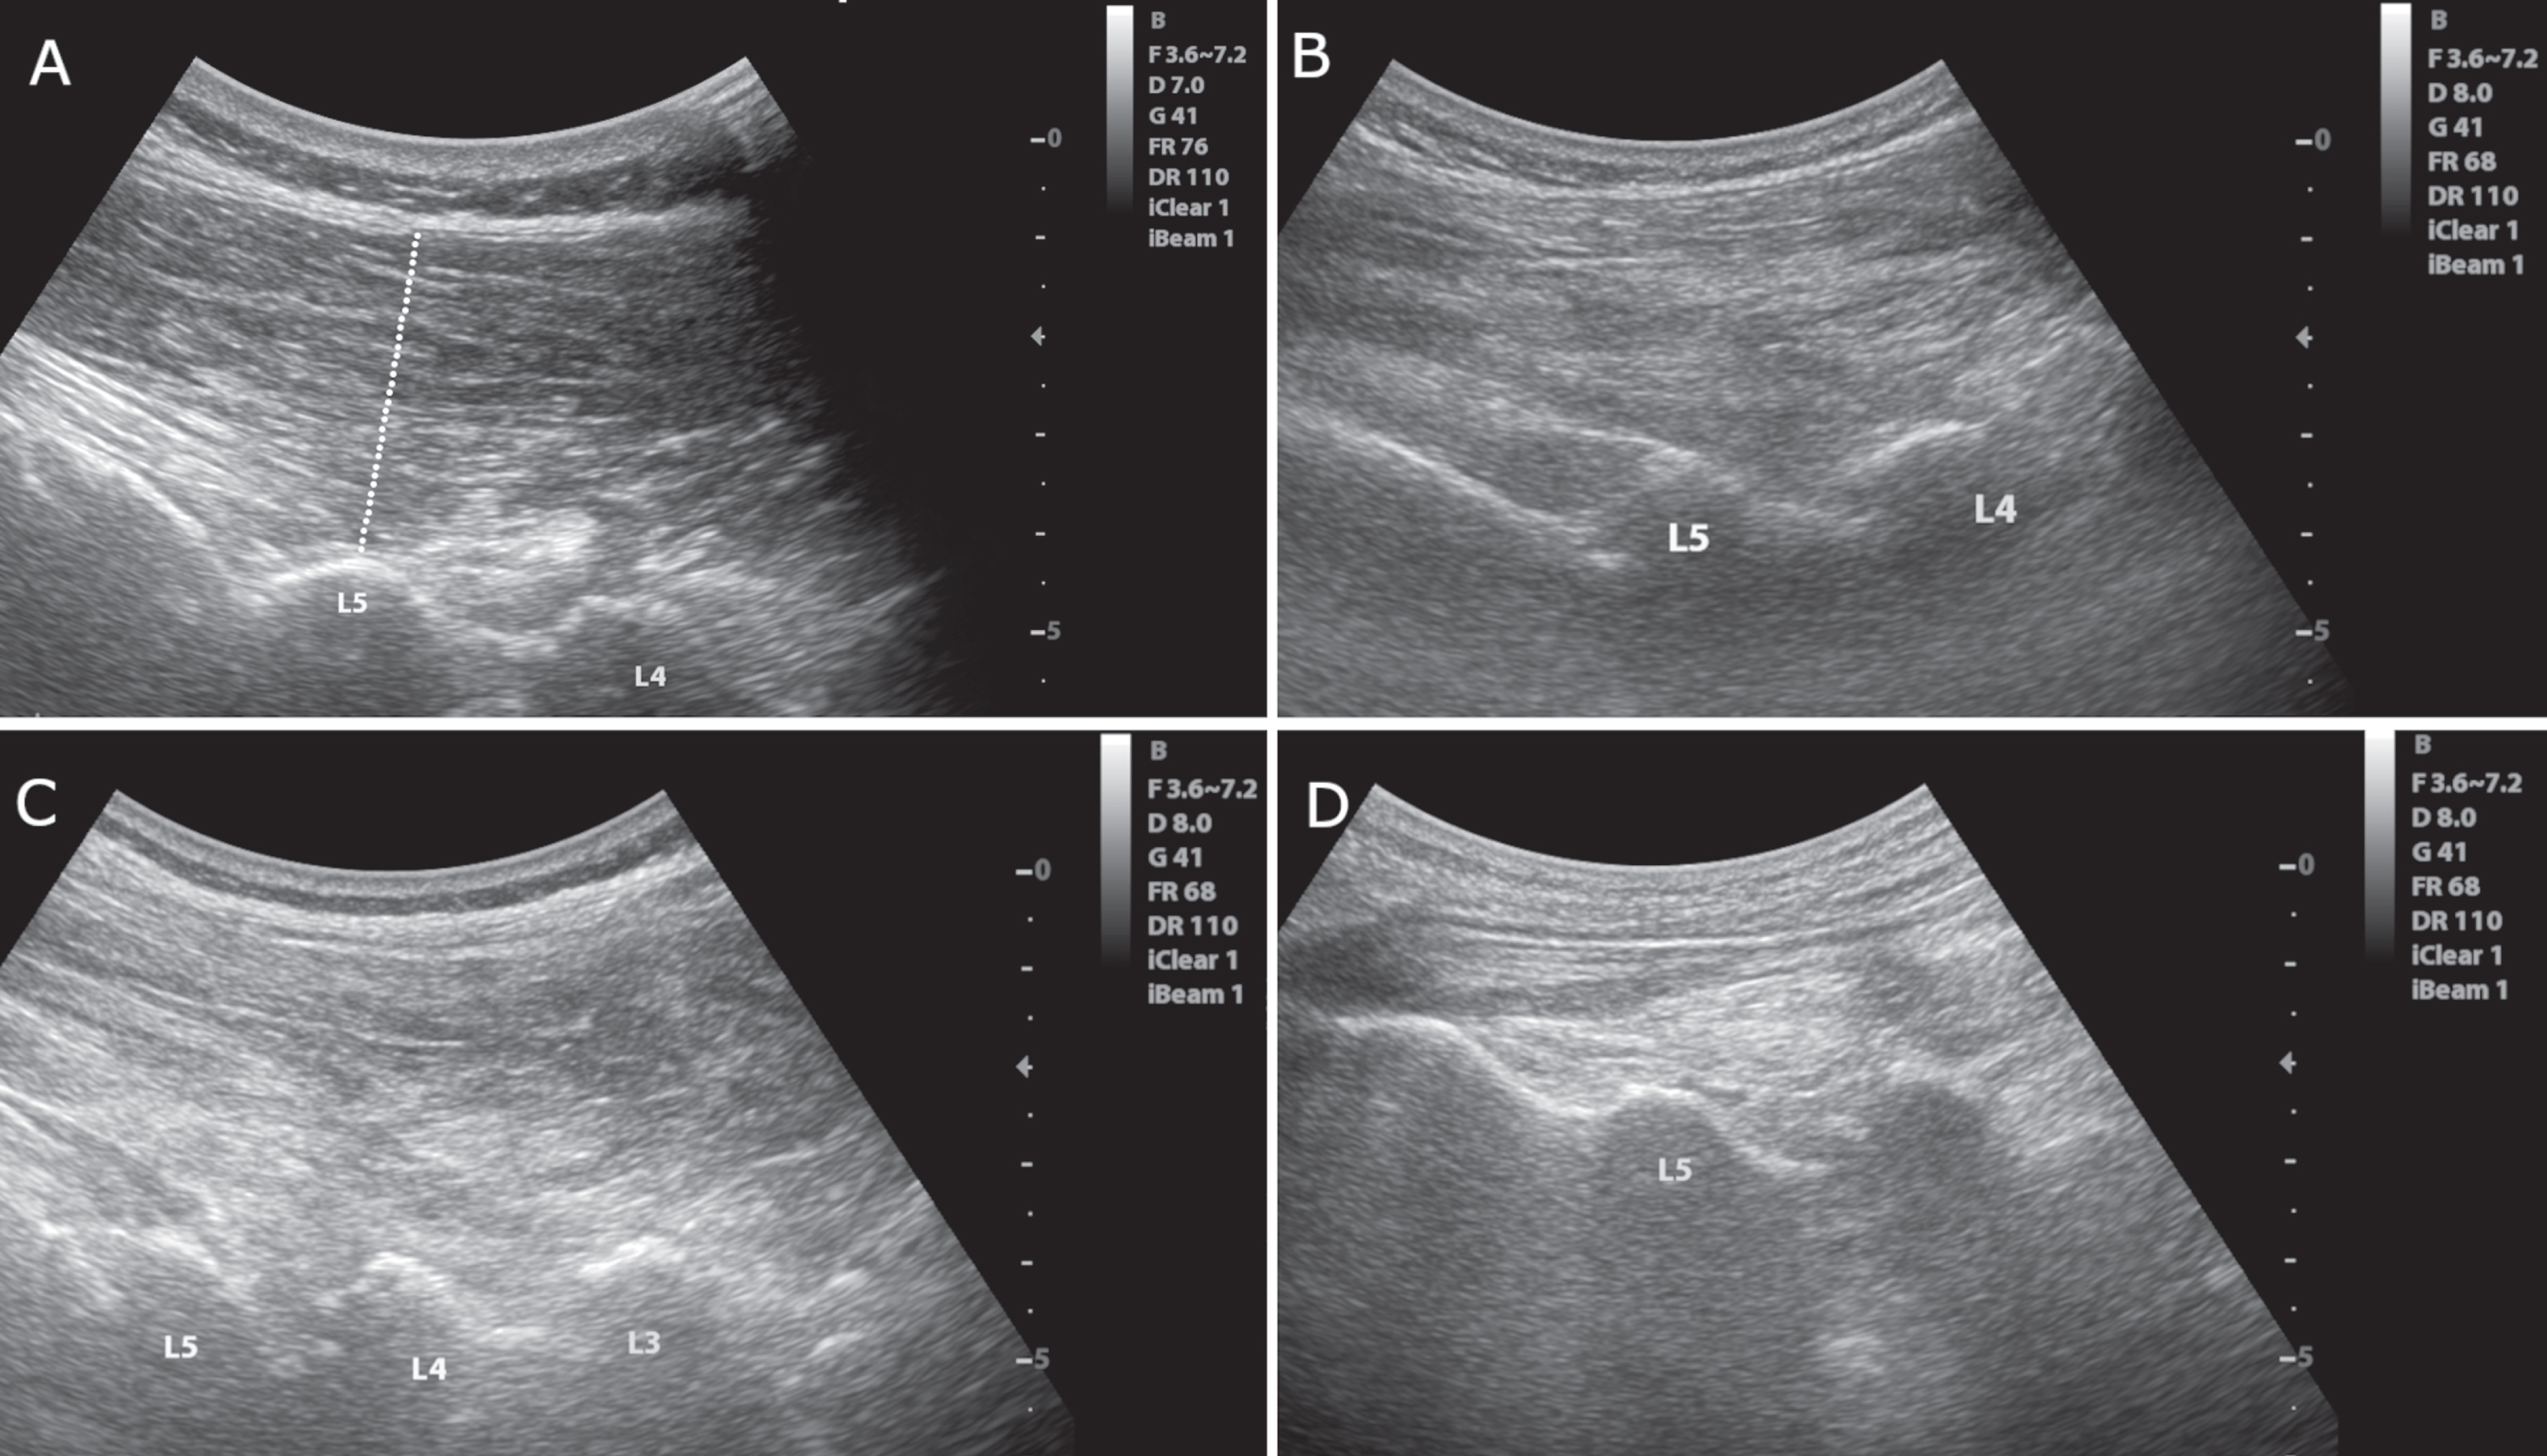
Fig. 2
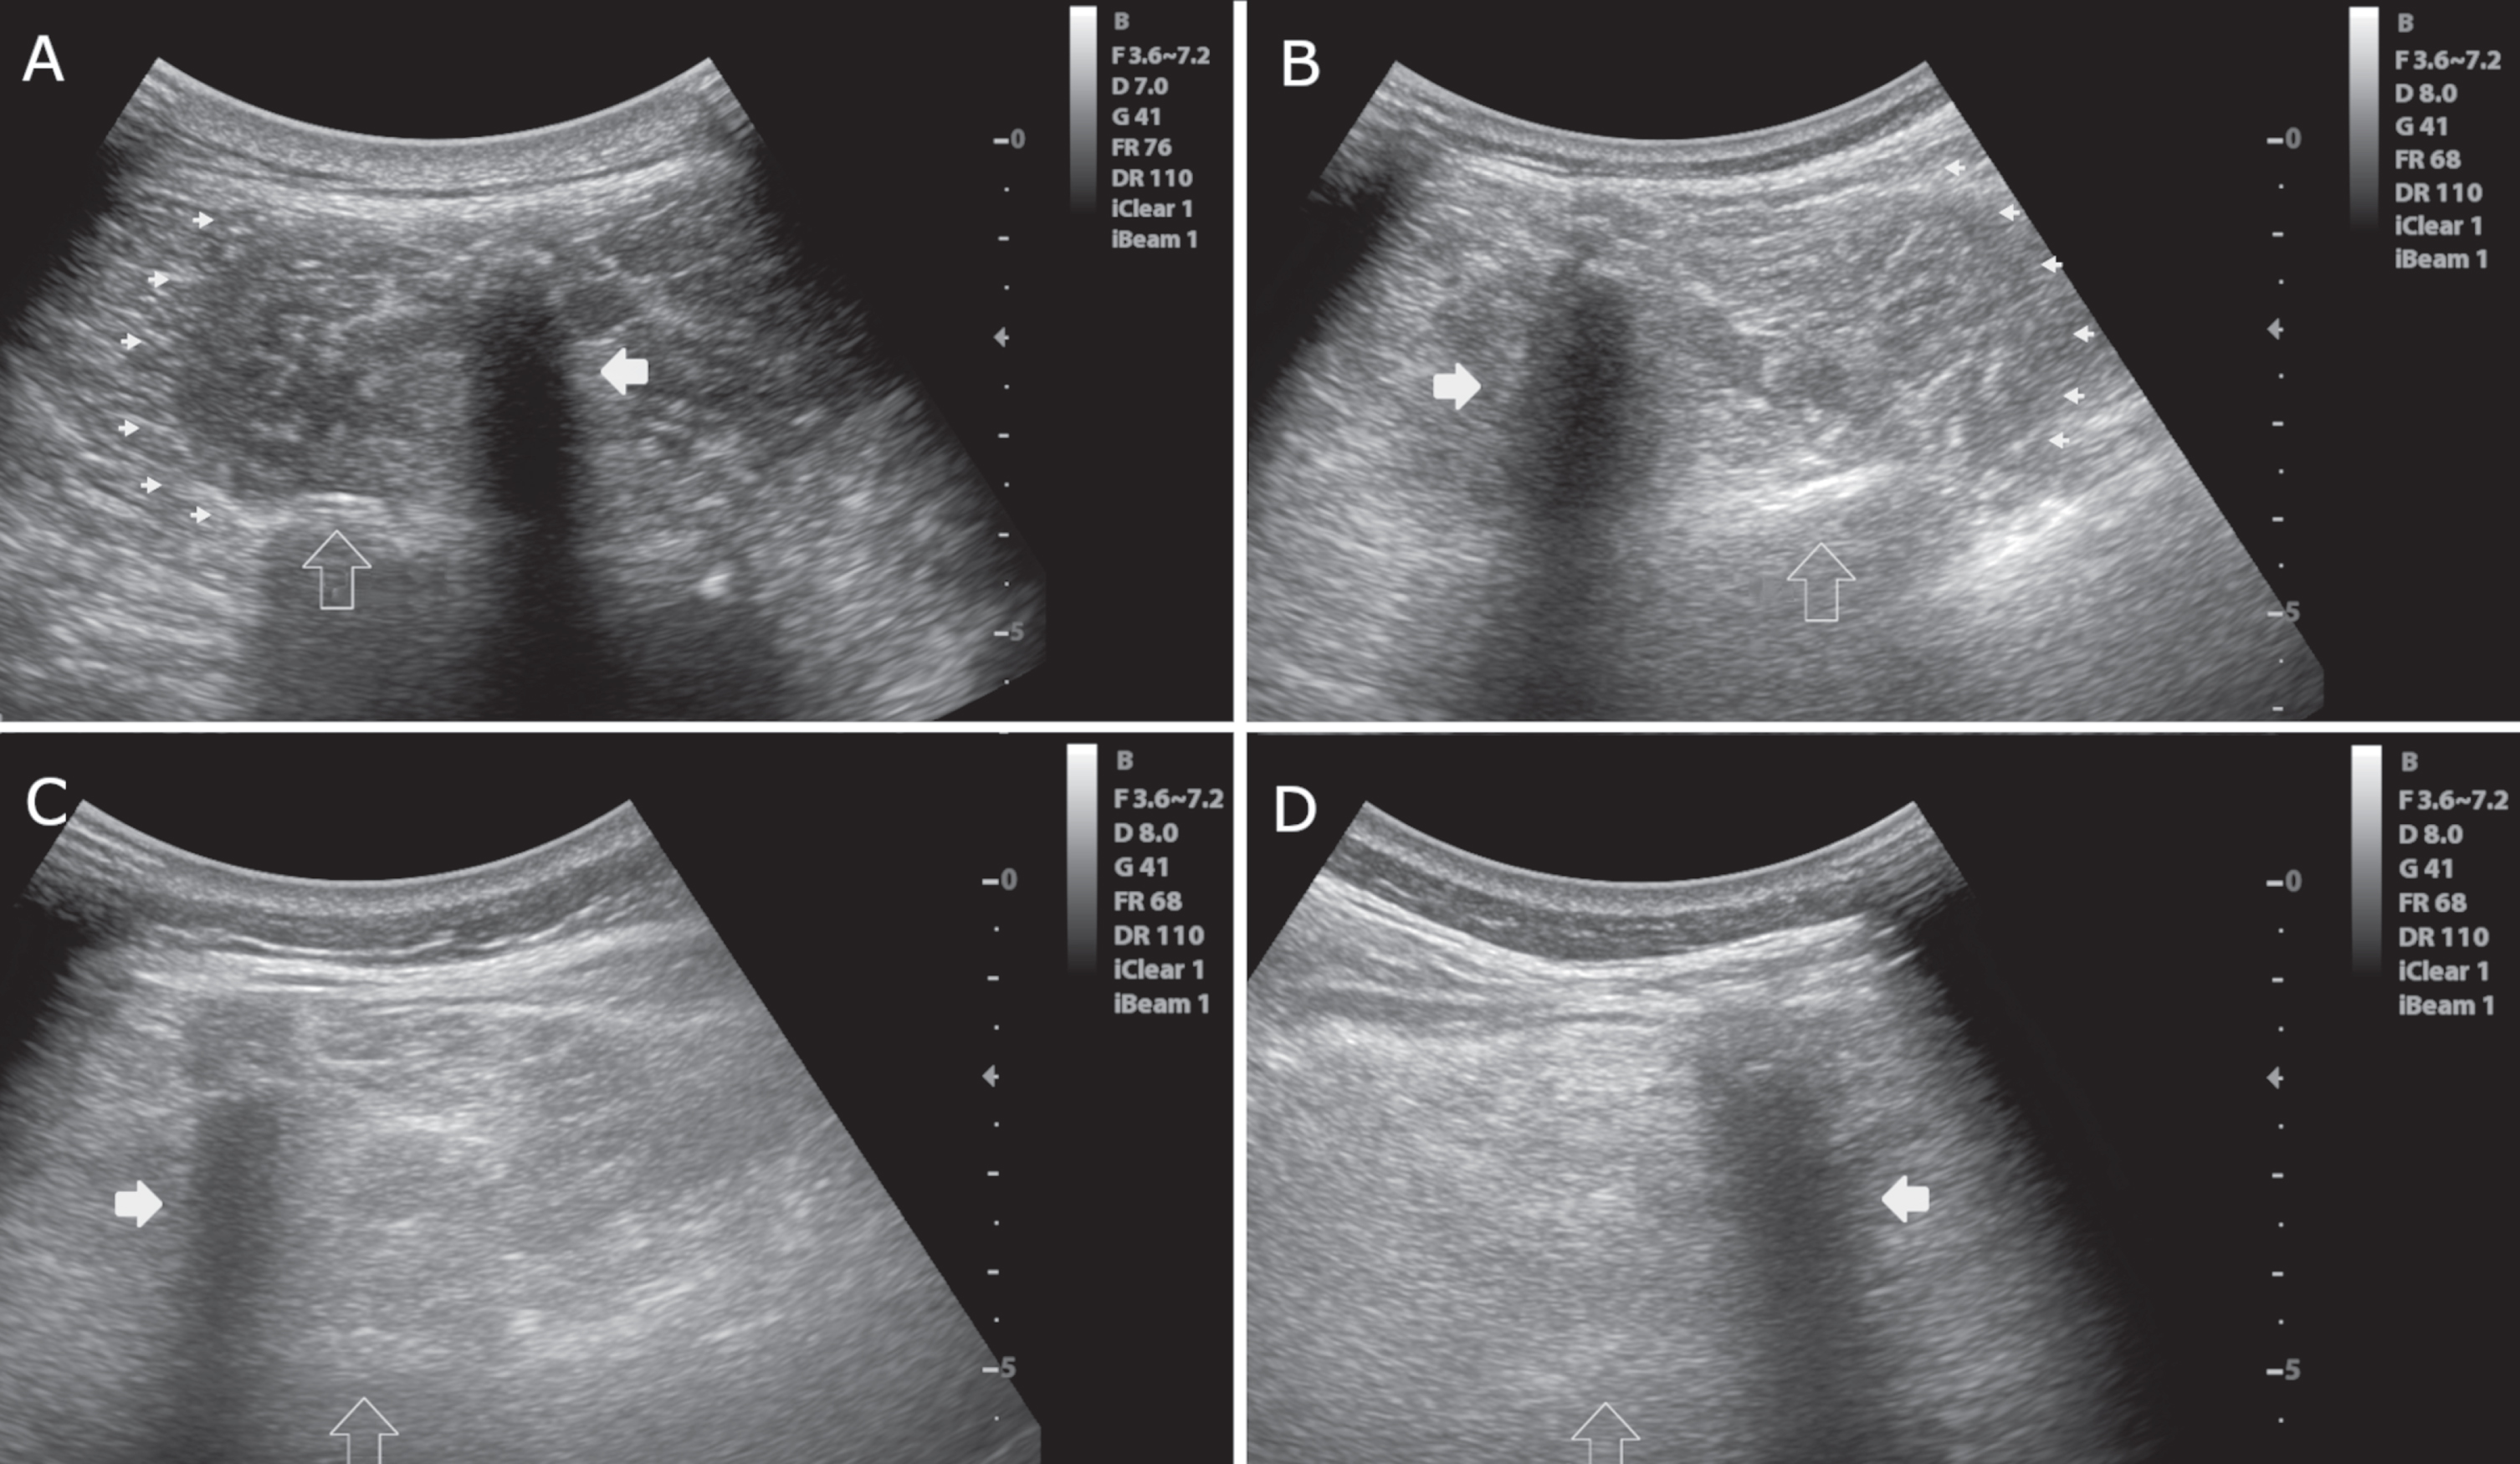
Axial images of the multifidus muscle at the level of L3. A) Normal muscle echogenicity with a “starry night” pattern, clearly visible muscle borders (small arrowheads), a normal bone reflection (empty vertical arrow) and spinal process (white horizontal arrow). Heckmatt score = 1. B) Slightly increased muscle echogenicity. The borders of the muscle (arrowheads) and bone reflection (empty vertical arrow) are still seen. Heckmatt score = 2. C) Markedly increased muscle echogenicity with no clear muscle borders. Bone reflection (empty vertical arrow) is hardly detectable. Heckmatt score = 3. D) Markedly muscle increased echogenicity with no discernible echotexture showing a “rubbed out” pattern. Bone reflection (empty vertical arrow) is lost. Heckmatt score = 4. White horizontal arrow, spinous process; small arrowheads, lateral border of the multifidus; empty vertical arrow, lamina vertebrae.
The thickness of the lumbar paravertebral musculature was assessed in longitudinal images by drawing a perpendicular line between the end of the subcutaneous tissue and the lamina of each lumbar vertebra using the linear measurement function of the ultrasound (Fig. 1A). The mean value of measurements between L1-5 on both sides was calculated, depicting the mean paravertebral muscle thickness of the participant. The thickness of the biceps brachii was also measured to take the overall muscularity of the participant into account. Apart from the linear assessments, the cross-sectional image of the multifidus muscle taken at the level of L3 was evaluated using the Heckmatt scale [17]. The Heckmatt scale is a semi-quantitative scale (from I to IV) for assessing muscle echogenicity in ultrasound at the cross-sectional plane (Fig. 2) [10, 17]. High scores on the Heckmatt scale show a more severe pathology. In addition, a quantitative greyscale analysis was performed on the cross-sectional images of L3-multifidus and biceps muscles. With a standard region of interest (ROI) of 4 cm2, histograms with a mean and standard deviation of echogenicity were taken from the midpoint of the muscle using the ImageJ software (National Institutes of Health, Bethesda, USA). It is to be noted that an image of a healthy muscle in cross-sectional ultrasound is composed of hypo/anechogenic (dark) muscle tissue and hyperechogenic (bright) perimysial septas giving the muscle a heterogenic “starry night” appearance (Heckmatt-I, Fig. 2A). On the other hand, a muscle with diffuse pathology (such as edema, inflammation, or fibrosis/fatty degeneration) causes an increase in echogenicity and displays a “rubbed-out” pattern (Fig. 2D) [10]. In this study, thickness and echogenicity assessments of the lumbar paravertebral musculature were performed in the stored images blinded to the diagnosis of the participants. The measurements were also done by another experienced sonographer (MHS) in a blinded fashion to assess interrater reliability.
Statistical analyses
The distribution of the data is evaluated using P-P plots and the Kolmogorov-Smirnov test. Demographic and disease-related values were compared using One-way ANOVA, Kruskal-Wallis, or Chi-square tests as appropriate. Interrater reliability of the paravertebral muscle thickness measurements was evaluated with two-way mixed, absolute agreement single measures intra-class correlations (ICC). The reliability of Heckmatt scoring between the two raters was measured using Krippendorf’s Alpha estimate. Linear measurements, Heckmatt scoring, and the grayscale analysis of the lumbar musculature were compared with a univariate general linear model (GLM), including sex and group levels as fixed factors, other known or potential confounders as covariates. SPSS Statistics 26.0.0 (SPSS Ltd., Chicago IL) was used for statistical analysis, and p < 0.05 was considered statistically significant.
RESULTS
Clinical data
Twenty patients with PD-CC, 20 PD, and 18 HC were recruited for the study. Four participants were excluded due to previous lumbar surgery. Of the remaining 54, 17 patients were PD-CC (7 PD-aCC and 10 PD-cCC), 19 PD (with no CC), and 18 were HC (see the flowchart in the Supplementary Material). Demographic and disease-related information is given in Table 1. The groups did not differ significantly in age, sex, BMI, and levodopa equivalent daily dose (LEDD). However, one-way ANOVA showed that the groups differed regarding PD duration. F(2,33) = 4.12, p = 0.025, ω= 0.38. Post hoc tests revealed that the PD-cCC group had a significantly longer PD duration than the PD group (LSD p = 0.007). Similarly, UPDRS-III scores revealed significant differences F(2,33) = 3.49, p = 0.042, ω= 0.35. PD-cCC had higher scores compared to PD (post hoc LSD p = 0.013). The angle of the trunk flexion also differed significantly between the groups of CC (p = 0.030). Additionally, the Chi-square followed by subsequent comparisons using Fisher’s exact test showed that the PD-cCC group reported a significantly higher back pain rate than HC and PD groups (p < 0.001).
Table 1
Demographic and disease characteristics of the groups
| HC (n = 18) | PD (n = 19) | PD-aCC (n = 7) | PD-cCC (n = 10) | p | |
| Age, y, mean (SD) | 75.5 (6.4) | 71.5 (9.2) | 77.6 (4.5) | 72.5 (6.8) | 0.196 |
| Male sex, n (%) | 11 (61.1) | 10 (52.6) | 5 (71.4) | 6 (60.0) | 0.849 |
| Body mass index, mean (SD) | 25.3 (4.5) | 25.8 (3.2) | 26.2 (3.6) | 25.0 (5.7) | 0.930 |
| PD duration, y, mean (SD) | – | 7.8 (6.3) | 10.7 (8.4) | 15.5 (6.8) | 0.025 |
| UPDRS-III, mean (SD) | – | 23.0 (9.5) | 24.7 (10.6) | 31.9 (4.6) | 0.042 |
| LEDD, mg/d, mean (SD) | – | 670 (515) | 782 (385) | 806 (223) | 0.679 |
| Duration of CC, months, median (range) | – | – | 25 (2–36) | 69 (41–216) | – |
| Angle of flexion, mean (SD) | – | – | 40.9 (8.2) | 54.2 (12.9) | 0.030 |
| Presence of back pain (NRS 1–10), n (%) | 3 (16.7) | 3 (15.8) | 3 (42.9) | 7 (70) | 0.001 |
HC, healthy controls; PD, Parkinson’s disease; aCC, acute camptocormia; cCC, chronic camptocormia; SD, standard deviation; UPDRS, Unified Parkinson’s Disease Rating Scale; LEDD, levodopa equivalent daily dose; NRS, numerical rating scale.
Lumbar paravertebral muscle thickness
Interrater reliability for the assessments of paravertebral muscle thickness using ICC indicated substantial reliability between the two raters (L1 : 0.88, (95% CI: 0.78–0.93); L2 : 0.85, (95% CI:0.75–0.91); L3 : 0.79, (95% CI: 0.67–0.87); L4 : 0.75, (95% CI: 0.62–0.84); L5 : 0.77, (95% CI: 0.65–0.86); L1-5 mean: 0.83, (95% CI:0.71–0.90)). To demonstrate the effect of group levels on paravertebral muscle thickness with potential covariates (age, sex, BMI, and biceps thickness), a univariate GLM was performed. The model showed equality of variances (Levene’s test p = 0.26), and no significant interactions. There was a significant effect of group membership on lumbar paravertebral muscle thickness after controlling for the effects of the potential covariates, F(3, 29) = 4.31, p = 0.012, partial η2 = 0.31. The post hoc test of LSD revealed that PD-cCC had significantly lower muscle thickness compared to the HC (p = 0.01) and PD (p = 0.001) groups. The comparison of PD-cCC with PD-aCC was at the margin of significance (p = 0.05). No significant differences were detected between other groups (PD-aCC, PD, or HC) regarding paravertebral muscle thickness (Table 2, Fig. 3A). The model also showed significant associations between BMI (F(1,29) = 12.96, p = 0.001, partial η2 = 0.31), and biceps thickness (F(1,29) = 4.58, p = 0.04, partial η2 = 0.14).
Table 2
Assessments of the paravertebral musculature
| HC (n = 18) | PD (n = 19) | PD-aCC (n = 7) | PD-cCC (n = 10) | p | |
| Paravertebral muscle thickness, cm, right/left, mean (SD) | |||||
| L1 | 2.42 (0.7) | 2.49 (0.9) | 2.37 (0.6) | 1.80 (0.8) | – |
| L2 | 2.64 (0.7) | 2.79 (0.7) | 2.69 (0.5) | 2.15 (0.6) | – |
| L3 | 2.84 (0.7) | 3.07 (0.5) | 2.95 (0.4) | 2.43 (0.6) | – |
| L4 | 2.81 (0.7) | 3.32 (0.6) | 3.02 (0.5) | 2.29 (0.6) | – |
| L5 | 2.74 (0.6) | 3.18 (0.7) | 3.00 (0.4) | 2.23 (0.7) | – |
| L1-5 | 2.65 (0.6) | 2.99 (0.6) | 2.80 (0.4) | 2.19 (0.6) | 0.012* |
| Biceps thickness, right, mean (SD) | 2.44 (0.5) | 2.81 (0.7) | 2.56 (0.4) | 2.73 (0.6) | 0.298t |
| L3-multifidus echogenicity, right/left | |||||
| Heckmatt scoring, mean (SD) | 2.5 (0.5) | 2.3 (0.5) | 2.7 (0.6) | 3.1 (0.5) | <0.001* |
| Grayscale, mean (SD) | 79.8 (8.5) | 80.5 (12.3) | 110 (21.9) | 101.7 (21.9) | 0.029* |
| Grayscale –biceps, mean (SD) | 65.5 (21.4) | 82.2 (19.8) | 99.8 (33.5) | 104.3 (27.2) | 0.001t |
HC, healthy controls; PD, Parkinson’s disease; aCC, acute camptocormia; cCC, chronic camptocormia; SD, standard deviation. *p-value of One-way ANOVA. tp-value of the general linear model.
Fig. 3
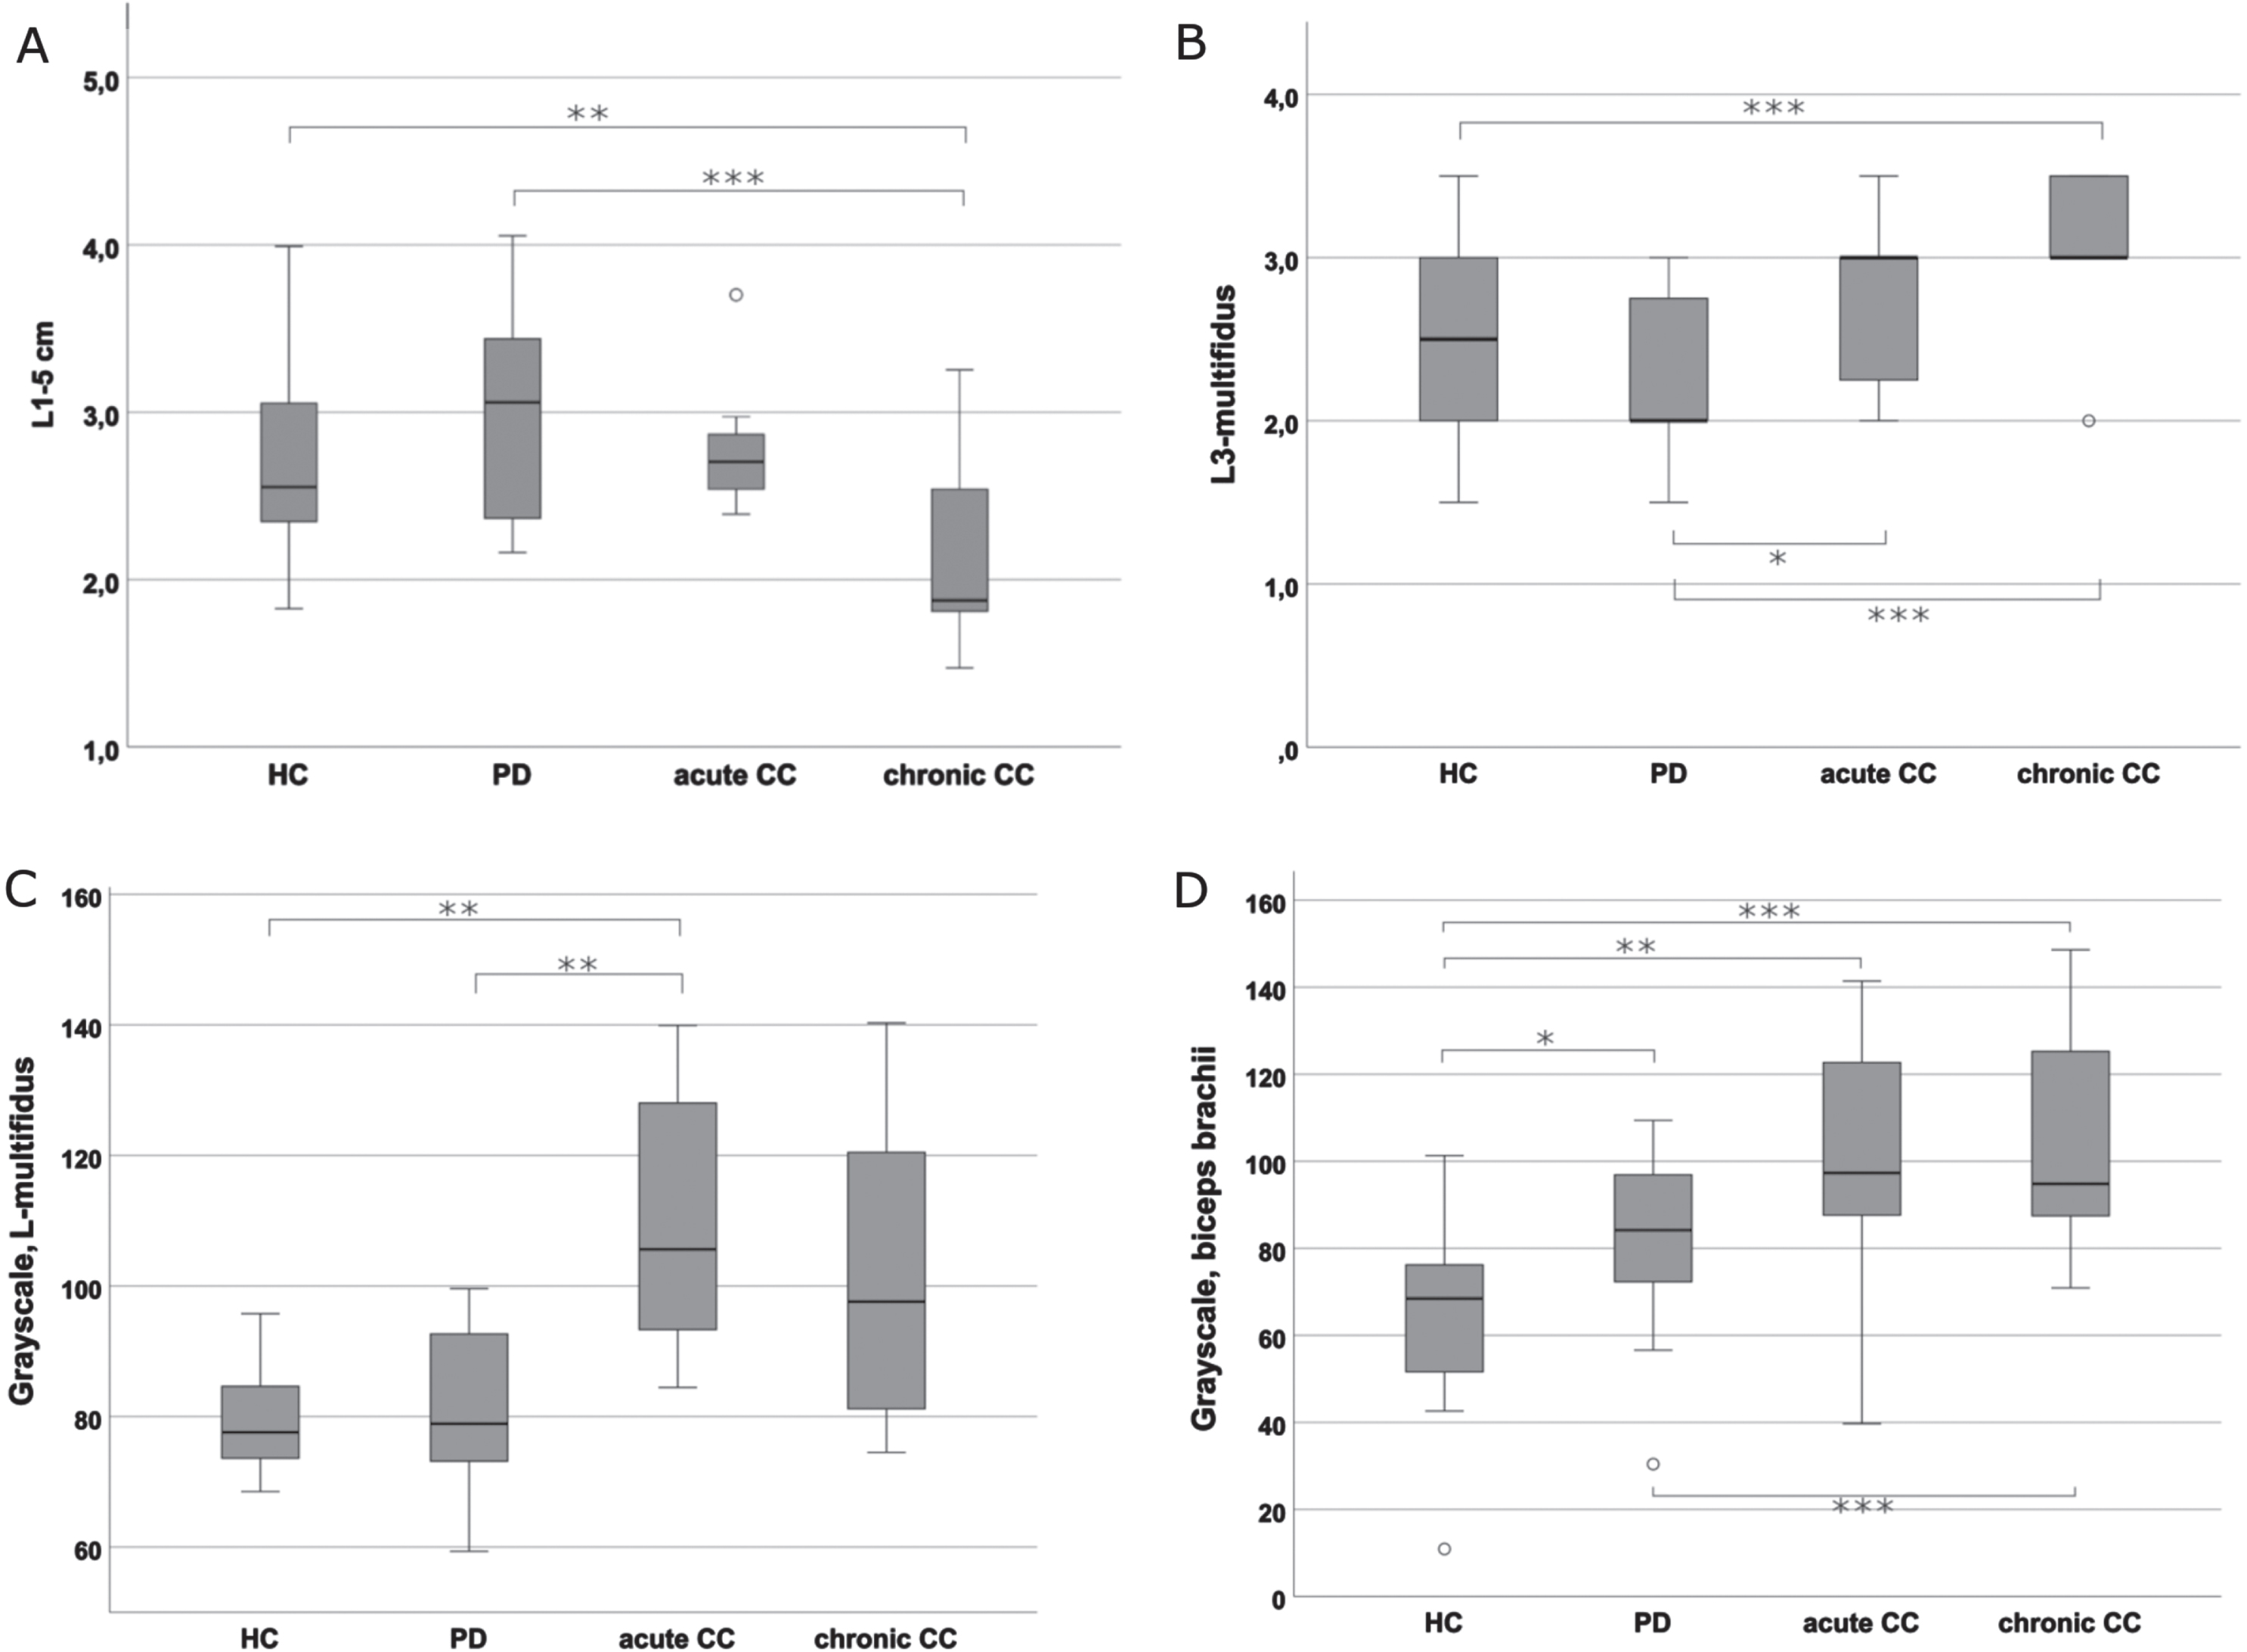
Comparison of the muscle thickness and echogenicity assessments between the groups. A) Mean values of linear measurements of paravertebral muscle thickness of L1-5 on both sides. The figure depicts significant differences in muscle thickness between PD-cCC vs. PD as well as PD-cCC vs. HC. B) Mean Heckmatt scores of cross-sectional L3-multifidus images on both sides. The figure depicts that PD-cCC and PD-aCC groups had significantly higher Heckmatt scores compared to PD group. The difference between PD-cCC and HC was also significant. C) Grayscale analysis of cross-sectional L3-multifidus on both sides. The figure depicts that PD-aCC had significantly brighter muscle echogenicity compared to PD and HC. PD-cCC had also higher scores but the difference was non-significant. D) Grayscale analysis of cross-sectional biceps brachii on the right side. Note the significant increase in biceps echogenicity in all the PD groups compared HC, with PD-cCC the highest echogenicity. *<0.05; **≤0.01; ***≤0.001.
Assessments of muscle echogenicity
Semi-quantitative and quantitative assessments of the muscle tissue were performed using the Heckmatt scale and grayscale analysis, respectively. Reliability of the Heckmatt scoring showed a high value of 0.80 according to Krippendorff’s Alpha. The univariate GLM for comparing the Heckmatt scores of the groups showed no significant differences in variances (Levene’s test p = 0.11) or interactions. According to the model, Heckmatt scores of the groups differed significantly, and were independent of the effects of age, sex, and BMI, (F(3,37) = 8.16, p < 0.01, partial η2 = 0.40). Further analysis revealed that patients with PD-aCC and PD-cCC groups had significantly higher Heckmatt scorings than PD (p = 0.021 and p < 0.001, respectively). Scores of PD-cCC were also higher than HC (p = 0.001). The effect of sex (F(1,37) = 8.76, partial η2 = 0.19) and BMI (F(1,37) = 15.66, partial η2 = 0.30) was also significant (p < 0.01) (Figs. 2 and 3B).
The GLM for investigating the effects on the quantitative grayscale analysis of L3-multifidus also showed a gut fit (Levene’s test p = 0.32), with a similar effect size. The model also showed significant interaction effects with BMI and grayscale assessments of the biceps echogenicity (see the Supplementary Material). Including the interaction effects, the presence of CC still showed a significant effect on grayscale values of the participants (F(3,31) = 3.43, p = 0.029, partial η2 = 0.25). According to the model, only patients with PD-aCC had significantly higher echogenicity scores compared to HC (p = 0.009) and PD (p = 0.002) groups. Scores of PD-cCC were also high but not significantly higher than other groups (Fig. 3C). Other confounders and interactions showed no significant effects. Apart from the L3-multifidus, the echogenicity of the biceps brachii in grayscale analysis also showed significant differences in One-way ANOVA, F(3,47) = 6.60, p = 0.001. All PD groups had significantly higher biceps echogenicity compared to HC. Moreover, PD-cCC also had significantly higher biceps echogenicity compared to PD group (p = 0.033, Table 2, Fig. 3D).
DISCUSSION
Especially in the last two decades, advances in ultrasound technologies have led to a substantial improvement in sonographic image resolution establishing mUSG as an imaging method for muscle pathologies [10, 18, 19]. Currently, mUSG is being used as a surrogate biomarker for aiding diagnosis or monitoring disease progression in various neuromuscular disorders [20, 21], as pathological changes of the muscular tissue such as edema, atrophy, or fibrosis can be detected and displayed with mUSG. Given that such findings are also reported in patients with CC, we attempted to demonstrate the sonographic characterization of PD-CC. Our results demonstrate that an objective and reliable assessment of the paravertebral muscles with mUSG in case of CC is possible. Second, in parallel to more invasive or technically more difficult methods, the loss of muscle thickness with chronification in longer standing camptocormia with an atrophy of the paravertebral muscles may be demonstrated.
Paravertebral muscle thickness
The high interrater reliability values for the measurement of muscle thickness are in accordance with the previous reports [13, 14]. In linear measurements, the results show a significant decrease in muscle thickness in PD-cCC compared to groups with no CC groups (PD and HC) indicating atrophy in lumbar paravertebral muscles, consistent on all lumbar spinal levels (Table 2, Figs. 1 and 3A). Interestingly, the muscle thickness in the PD-aCC group was similar to the two groups of no CC (Fig. 3A), and the difference between PD-cCC and PD-aCC was at the level of significance (p = 0.05). This finding underscores the distinction between the pathological processes of PD-aCC and PD-cCC in line with previous studies indicating that atrophy in lumbar paravertebral musculature starts to occur only after 2-3 years of CC [22, 23], and spinal muscle thickness decreases with increased flexion [12]. In addition to that, the significantly higher rate of back pain in the PD-cCC group is also in parallel to previous studies that reported an association between back pain and lumbar atrophy shown with mUSG or other imaging modalities in non-CC populations [16, 24, 25].
Muscle echogenicity
The echogenicity of the paravertebral multifidus was assessed at the level of L3 because CC-related pathological changes were previously depicted in MRI at this level with good reliability [22]. The echogenicity of the muscle tissue was assessed using two methods: the semi-quantitative Heckmatt scale and the quantitative grayscale analysis. The results showed that both PD-aCC and PD-cCC groups had higher scores on the Heckmatt scale (Table 2, Fig. 2), against PD group, and in PD-cCC against HC (Fig. 3B). The difference between PD-aCC and HC; however, did not reach significance, possibly due to the relatively smaller sample size of PD-aCC. With regard to the grayscale analysis, the PD-aCC group showed significantly higher echogenicity compared to PD and HC. The PD-cCC group also had higher scores of echogenicity, but that did not reach significance when BMI and biceps echo were added to the model (Fig. 3C). Overall, both analyses indicate that PD-CC may display higher muscle echogenicity than groups with no CC (Fig. 2). The higher muscle echo in the PD-cCC group is probably due to fibrosis and fatty degeneration defined in the chronic stages of CC as shown in muscle MRI and biopsy studies [6, 22, 26]. On the other hand, the higher echogenicity values shown in the PD-aCC group may have been caused by muscle edema, considering that the acute stage of CC is associated with edema and swelling rather than atrophy or fibrosis [5]. Previous studies on this issue report that the effect of edema on muscle echo is not uniform [21] and may be decreased or increased according to the nature and duration of the underlying muscle pathology [10, 27]. It may also manifest as a “see-through” or “shine-through” echogenicity, indicating an increased echogenicity without obscuring the underlying bone echo [10], which may explain why the Heckmatt scores of the PD-aCC were relatively lower than PD-cCC in contrast to grayscale analysis. Nevertheless, given that the readout of the grayscale analysis yields automated, quantitative, and relatively objective, it is possibly superior to the Heckmatt scale, which has a sensitivity of around 70% for myopathies [17, 28]. In any case, it can be said that muscle thickness and echogenicity should be evaluated together since echogenicity cannot solely differentiate in both acute and chronic stages of CC as it may be increased in both.
Another issue is that, notably, a greater biceps echogenicity was also found in the PD groups, especially with CC, which was depicted as an interaction effect in the statistical model. This indicates that the relationship between L3-multifidus and biceps echogenicity is not the same in every group. In patients with CC, the echogenicity of the L3-multifidus and biceps was positively correlated in contrast to other groups (see the Supplementary Material). This interesting point suggests a universal increase of muscle echo in PD and may be attributed to increased muscle rigidity with increased disease duration. Indeed, previous mUSG studies in PD reported increased biceps stiffness in PD patients evaluated with USG-elastography [29, 30]. Increased muscle echogenicity is also related to aging [19, 20]. However, this effect can be ruled out in our sample (Table 1). On that account, we argue that mUSG may depict the increased rigidity in PD, at least at group level. Also, we propose that additional muscle assessments should not be treated as confounders in statistical models, given that they reflect the pathological process, and including them may lead to type-II errors eliminating meaningful variance.
Limitations of the current study need to be mentioned. First, in this single-center study, the sample size of the PD-CC was not large, which may affect the generalizability of the findings and may have caused type-II errors, especially regarding the non-significant or borderline results. Second, in contrast to MRI, some muscles involved in CC, such as quadratus lumborum and psoas [22], could not be assessed using mUSG. Third, the potential effects of occupation on the lumbar musculature (such as being a blue-collar worker), comorbidities (other than surgery in the lumbar area such as ankylosing spondylitis, rheumatism), and drugs (such as pramipexole) were not taken into account. The lack of comparison of the mUSG findings with MRI is also an important limitation. On the other hand, the addition of four distinct groups, comprehensive and standardized mUSG examination with blinded evaluations, and calculation of IRR are the strengths of the study. It should also be noted that the area of the L3-multifidus could not be measured as the border between the lumbar multifidus and longissimus could not be distinguished, as expected in our study population of elderly [16, 31].
In conclusion, in this exploratory study, our results show that alterations of the lumbar muscles in patients with CC may be detected with mUSG. Moreover, the process of chronic atrophy in the lumbar paravertebral muscles in CC may be demonstrated using mUSG. To our knowledge, this is the first report of CC assessment using mUSG. mUSG is a unique imaging method with its low cost and simple practicability which can be performed at the bedside or in an out-patient setting and can easily be repeated. The broad implication of the present research is that mUSG may be advantageous as a screening tool for muscle alterations in patients with PD. Of course, these results should be confirmed by independent groups in further studies. Our findings provide a basis for future studies that will be conducted with a larger sample size and longitudinal design to investigate whether mUSG can be applied to distinguish subtypes of CC and to be employed as a screening tool to predict future CC in patients with PD.
CONFLICT OF INTEREST
Daniela Berg is an Editorial Board Member of this journal but was not involved in the peer-review process nor had access to any information regarding its peer-review.
The authors have no conflict of interest to report.
DATA AVAILABILITY
The data supporting the findings of this study are available on request from the corresponding author.
REFERENCES
[1] | Tinazzi M , Geroin C , Bhidayasiri R , Bloem BR , Capato T , Djaldetti R , Doherty K , Fasano A , Tibar H , Lopiano L , Margraf NG , Merello M , Moreau C , Ugawa Y , Artusi CA ((2022) ) Task force consensus on nosology and cut-off values for axial postural abnormalities in parkinsonism. Mov Disord Clin Pract 9: , 594–603. |
[2] | Margraf NG , Granert O , Hampel J , Wrede A , Schulz-Schaeffer WJ , Deuschl G ((2017) ) Clinical definition of camptocormia in Parkinson’s disease. Mov Disord Clin Pract 4: , 349–357. |
[3] | Schulz-Schaeffer WJ , Margraf NG , Munser S , Wrede A , Buhmann C , Deuschl G , Oehlwein C ((2015) ) Effect of neurostimulation on camptocormia in Parkinson’s disease depends on symptom duration. Mov Disord 30: , 368–372. |
[4] | Sakai W , Nakane S , Urasaki E , Toyoda K , Sadakata E , Nagaishi A , Fukudome T , Yamakawa Y , Matsuo H ((2017) ) The cross-sectional area of paraspinal muscles predicts the efficacy of deep drain stimulation for camptocormia. J Parkinsons Dis 7: , 247–253. |
[5] | Margraf NG , Wrede A , Deuschl G , Schulz-Schaeffer WJ ((2016) ) Pathophysiological concepts and treatment of camptocormia. J Parkinsons Dis 6: , 485–501. |
[6] | Margraf NG , Wrede A , Rohr A , Schulz-Schaeffer WJ , Raethjen J , Eymess A , Volkmann J , Mehdorn MH , Jansen O , Deuschl G ((2010) ) Camptocormia in idiopathic Parkinson’s disease: A focal myopathy of the paravertebral muscles. Mov Disord 25: , 542–551. |
[7] | Schulz-Schaeffer WJ ((2016) ) Camptocormia in Parkinson’s disease: A muscle disease due to dysregulated proprioceptive polysynaptic reflex arch. Front Aging Neurosci 8: , 128. |
[8] | Bloch F , Houeto JL , Tezenas Du Montcel S , Bonneville F , Etchepare F , Welter ML , Rivaud-Pechoux S , Hahn-Barma V , Maisonobe T , Behar C , Lazennec JY , Kurys E , Arnulf I , Bonnet AM , Agid Y ((2006) ) Parkinson’s disease with camptocormia. J Neurol Neurosurg Psychiatry 77: , 1223–1228. |
[9] | Margraf NG , Wolke R , Granert O , Berardelli A , Bloem BR , Djaldetti R , Espay AJ , Fasano A , Furusawa Y , Giladi N , Hallett M , Jankovic J , Murata M , Tinazzi M , Volkmann J , Berg D , Deuschl G ((2018) ) Consensus for the measurement of the camptocormia angle in the standing patient. Parkinsonism Relat Disord 52: , 1–5. |
[10] | Albayda J , van Alfen N ((2020) ) Diagnostic value of muscle ultrasound for myopathies and myositis. Curr Rheumatol Rep 22: , 82. |
[11] | Pressler JF , Heiss DG , Buford JA , Chidley JV ((2006) ) Between-day repeatability and symmetry of multifidus cross-sectional area measured using ultrasound imaging. J Orthop Sports Phys Ther 36: , 10–18. |
[12] | Watanabe K , Miyamoto K , Masuda T , Shimizu K ((2004) ) Use of ultrasonography to evaluate thickness of the erector spinae muscle in maximum flexion and extension of the lumbar spine. Spine (Phila Pa 1976) 29: , 1472–1477. |
[13] | Zapata KA , Wang-Price SS , Sucato DJ , Dempsey-Robertson M ((2015) ) Ultrasonographic measurements of paraspinal muscle thickness in adolescent idiopathic scoliosis: A comparison and reliability study. Pediatr Phys Ther 27: , 119–125. |
[14] | Wallwork TL , Hides JA , Stanton WR ((2007) ) Intrarater and interrater reliability of assessment of lumbar multifidus muscle thickness using rehabilitative ultrasound imaging. J Orthop Sports Phys Ther 37: , 608–612. |
[15] | Hughes AJ , Daniel SE , Kilford L , Lees AJ ((1992) ) Accuracy of clinical diagnosis of idiopathic Parkinson’s disease: A clinico-pathological study of 100 cases. J Neurol Neurosurg Psychiatry 55: , 181–184. |
[16] | Stokes M , Hides J , Elliott J , Kiesel K , Hodges P ((2007) ) Rehabilitative ultrasound imaging of the posterior paraspinal muscles. J Orthop Sports Phys Ther 37: , 581–595. |
[17] | Pillen S , van Keimpema M , Nievelstein RAJ , Verrips A , van Kruijsbergen-Raijmann W , Zwarts MJ ((2006) ) Skeletal muscle ultrasonography: Visual versus quantitative evaluation. Ultrasound Med Biol 32: , 1315–1321. |
[18] | Pillen S , Arts IMP , Zwarts MJ ((2008) ) Muscle ultrasound in neuromuscular disorders. Muscle Nerve 37: , 679–693. |
[19] | Arts IMP , Pillen S , Schelhaas HJ , Overeem S , Zwarts MJ ((2010) ) Normal values for quantitative muscle ultrasonography in adults. Muscle Nerve 41: , 32–41. |
[20] | Zaidman CM , Van Alfen N ((2016) ) Ultrasound in the assessment of myopathic disorders. J Clin Neurophysiol 33: , 103–111. |
[21] | Pillen S , van Alfen N ((2011) ) Skeletal muscle ultrasound. Neurol Res 33: , 1016–1024. |
[22] | Margraf NG , Rohr A , Granert O , Hampel J , Drews A , Deuschl G ((2015) ) MRI of lumbar trunk muscles in patients with Parkinson’s disease and camptocormia. J Neurol 262: , 1655–1664. |
[23] | Nakane S , Yoshioka M , Oda N , Tani T , Chida K , Suzuki M , Funakawa I , Inukai A , Hasegawa K , Kuroda K , Mizoguchi K , Shioya K , Sonoda Y , Matsuo H ((2015) ) The characteristics of camptocormia in patients with Parkinson’s disease: A large cross-sectional multicenter study in Japan. J Neurol Sci 358: , 299–303. |
[24] | Freeman MD , Woodham MA , Woodham AW ((2010) ) The role of the lumbar multifidus in chronic low back pain: A review. PM R 2: , 142–146. |
[25] | Danneels L , Vanderstraeten G , Cambier D , Witvrouw E , De Cuyper H ((2000) ) CT imaging of trunk muscles. Eur Spine J 9: , 266–272. |
[26] | Wrede A , Margraf NG , Goebel HH , Deuschl G , Schulz-Schaeffer WJ ((2012) ) Myofibrillar disorganization characterizes myopathy of camptocormia in Parkinson’s disease. Acta Neuropathol 123: , 419–432. |
[27] | McMahon CJ , Wu JS , Eisenberg RL ((2010) ) Muscle edema. Am J Roentgenol 194: , 284–292. |
[28] | van Alfen N , Gijsbertse K , de Korte CL ((2018) ) How useful is muscle ultrasound in the diagnostic workup of neuromuscular diseases? Curr Opin Neurol 31: , 568–574. |
[29] | Du Juan L , He W , Cheng Gang L , Li S , Pan Song Y , Gao J ((2016) ) Ultrasound shear wave elastography in assessment of muscle stiffness in patients with Parkinson’s disease: A primary observation. Clin Imaging 40: , 1075–1080. |
[30] | Gao J , He W , Du LJ , Li S , Cheng LG , Shih G , Rubin J ((2016) ) Ultrasound strain elastography in assessment of resting biceps brachii muscle stiffness in patients with Parkinson’s disease: A primary observation. Clin Imaging 40: , 440–444. |
[31] | Stokes M , Rankin G , Newham DJ ((2005) ) Ultrasound imaging of lumbar multifidus muscle: Normal reference ranges for measurements and practical guidance on the technique. Man Ther 10: , 116–126. |

