
Introduction
Due to the manufacturing tolerance, assembly requirements and hot geometry effects, geometric uncertainty and error of axial compressors arise, especially near the endwall regions. These uncertainties and errors are important reasons for the inconsistency between the CFD predictions and the experimental data (Denton, 2010; Gourdain et al., 2014). Some examples of the endwall geometric error include: (1) the rotor casing pinch, which often has a polyline/curvy shape but can be over-simplified to a straight line; (2) the stator hub cavity, which is often ignored in the CFD model but can have a visible effect on the near-hub flow field. In the following, the effects of casing endwall shape and hub cavity on the compressor performances are briefly reviewed.
Regarding the casing endwall shape, several configurations including casing recess/trench and casing axisymmetric contouring have been studied in previous research. A systematic investigation of recessing the casing over the rotor tips conducted by Wisler and Beacher (1989) indicated that the increase of tip clearances and rotor penetration into the trench will result in loss of efficiency in a four-stage compressor. On the contrary, Thompson et al. (1998) and Beheshti et al. (2004) found that the stepped-tip gaps machined into the rotor casing can improve pressure ratio, efficiency and stall margin in transonic compressors. Sun et al. (2018) studied the influence of various axisymmetric endwall contours on a high-load low-reaction transonic rotor, and both the shock structure and the separation location were found to be sensitive to the endwall meridional configurations. Kröger et al. (2011) investigated the axisymmetric contouring for subsonic compressor rotors with large clearance heights and found that it reduces the tip clearance losses and endwall blockage.
Regarding the hub cavity, extensive studies have been conducted on the loss mechanism of hub leakage flows. For the commonly used open test case NASA Rotor 37, the discrepancy between the measured data and early CFD simulations near 40% span was believed to be caused by neglecting a 0.75 mm gap between the rotor disk and the stationary center body (Moore and Reid, 1980; Denton, 1997; Chima, 2009); more recent CFD simulations confirmed that the axial gap can generate such a deficit even when there is zero net leakage (Shabbir et al., 1997; Castillon et al., 2014; Seshadri et al., 2014). For stators with a hub cavity, detrimental effects of the leakage flow were usually reported: Wellborn and Okiishi (1999) performed a comprehensive investigation of the effect of stator hub leakage flow on the primary passage flow in a four-stage low-speed compressor, and the leakage flow was found to increase blockage, deviation, and thus total pressure loss near the stator hub; Demargne and Longley (2000) experimentally investigated the cavity effect on a linear compressor cascade, and the total pressure loss was found to increase with the leakage mass flow rate. However, cases for which the cavity leakage flow brings beneficial effects do exist: Sohn et al. (2006) found that increasing the tangential velocity of the leakage flow can reduce the secondary flow and therefore the overall loss in a shrouded compressor cascade; Lei et al. (2008) and Zhu et al. (2019) reported that the leakage flow can delay the stall onset in a compressor cascade and in a transonic compressor stage.
After the GPPS first Turbomachinery CFD Workshop, a careful inspection of the TUDa-GLR-OpenStage geometry has been performed, and a rotor casing pinch and a stator hub cavity were found. These geometric uncertainties and errors were not considered in the workshop CFD model, which potentially explains the overprediction of total pressure ratio in the previous validation attempts (He et al., 2023). The goal of this paper is to elaborate on the effects of these geometric uncertainties and errors on the aerodynamic performances of TUDa-GLR-OpenStage. In the following, details of the test compressor, the updated endwall geometries and the numerical methods will be introduced first, followed by the analysis of the rotor casing pinch effects and the stator hub leakage effects. Concretely, the overall performance and the radial profiles will be compared, and the loss mechanisms will be analyzed.
Numerical methodology
Baseline compressor
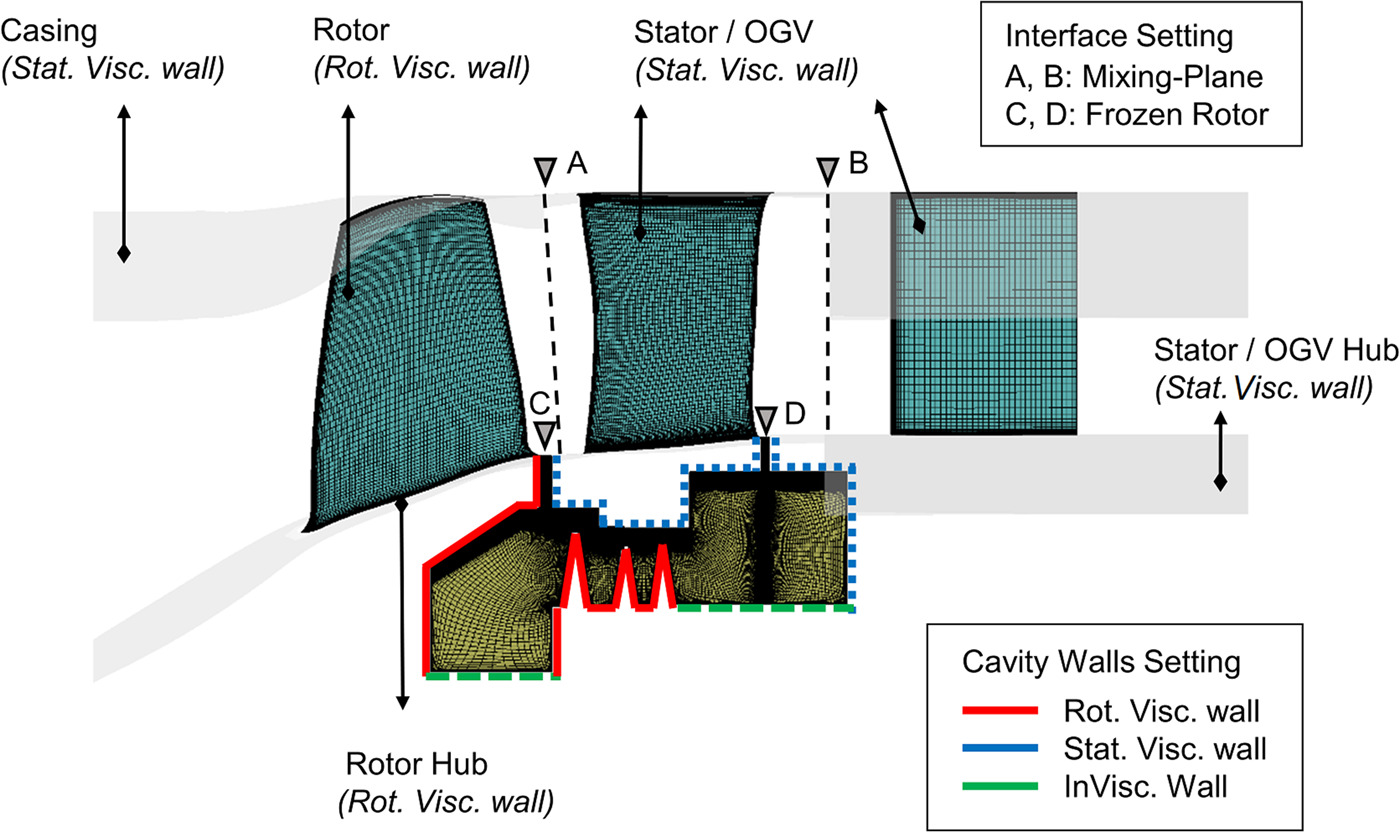
The investigated TUDa-GLR-OpenStage is a single-stage high-speed axial compressor, representing a typical front stage of a high-pressure compressor in a commercial turbofan engine. The compressor stage, as shown in Figure 1, includes a blisk rotor with 16 radially stacked CDA-airfoils, an optimized 3D-shaped stator with 29 blades, and an outlet guide vane (OGV) that straightens the flow. The crucial design parameters of the investigated stage can be found in Klausmann et al. (2022). The rotor was initially designed and tested by MTU in 1994 and has been investigated extensively in a series of research (Hoeger et al., 1999; Bergner et al., 2006; Muller et al., 2011). The rotor blades are highly cambered near the hub and thin near the tip. At the design condition, the rotor running tip gap size is approximately 0.75 mm, and the rotor hub fillet radius is 5 mm. The stator is designed conjointly between GLR and German Aerospace Center (DLR). It was optimized via an automated multi-objective optimization process to suppress the separation size (Bakhtiari et al., 2015). The stator blades have a forward sweep feature near both endwalls and a bow feature towards the pressure surface near the casing. The shapes of the stator fillets at both endwalls are prescribed by a digitized geometry file.

The TUDa-GLR-OpenStage was tested on the transonic compressor rig of GLR, which can measure the steady-state performance, the aerodynamic instabilities, and the blade vibration levels of the compressors. The schematic of the test facility is shown in Figure 1. Before reaching the compressor core, the inlet flow passes through an inlet throttle, a settling chamber and a mass flow measurement section. The pressure and temperature measured in the settling chamber reflect the incoming flow property. At the compressor core inlet section ME15, the total pressure profile of the incoming flow is measured by a boundary layer rake, and the total temperature profile is assumed to be uniform, with its value the same as that measured at the settling chamber (i.e., neglecting the heat transfer effect). The total pressure and total temperature measured at the settling chamber are used to correct the mass flow and the rotational speed to the International Standard Atmosphere (ISA) condition. A DC motor with a gearbox drives the compressor. Shaft input torque and rotor speed is measured using a torque meter. Further details of the experimental setup can be found in Klausmann et al. (2022).
The quantities of interest in the measurement campaign include the rotor exit profile at section ME21, the stator exit profile at section ME30 and the overall performance of the compressor. Among the overall performance quantities, the total pressure ratio
Endwall configuration
After a careful examination of the manufactured compressor geometry, the CAD geometry model and the CFD geometry model, the differences between the measured and the workshop geometries are summarized as follows:
The axial gap between the rotor hub and the stator hub is connected by a smooth curved line in the workshop geometry, whereas from the inspection of the test bench, a polyline is more accurate.
The rotor casing endwall is a smooth straight line in the workshop geometry, but a pinch is found in the test bench, as illustrated in Figure 2.
A leakage cavity is found beneath the stator in the test bench, which was not included in the workshop geometry. Although the leakage passage should have been effectively sealed in the experiment, the exact seal shape and thus the leakage flow rate remains uncertain due to the hot geometry effect. In this research, a self-designed leakage seal geometry shown in Figure 2 is investigated numerically. This seal geometry is similar to the cold geometry used in the experiment in terms of the minimum seal clearance. Due to intellectual property protection, the measured seal geometry is not presented in this research.

CFD solver
The commercial three-dimensional Reynolds-Averaged Navier-Stokes flow solver, Ansys CFX (version 2021), is used to perform the steady simulations in this paper. Ansys CFX uses an element-based finite volume method to discretize the RANS equations based on unstructured meshes. It uses an implicit coupled solver that solves all the hydrodynamic equations as a single system. The linearized equations are solved by the Incomplete Lower Upper (ILU) factorization technique, accelerated by an algebraic multigrid method. A pseudo-time-stepping algorithm with an automatic time scale technique is used for steady-state calculations. For the best practice of turbomachinery simulation, the Menter
Grid topology and boundary conditions
In this work, Numeca AutoGrid5 is used to generate the grids. The main flow region of the rotor, the stator and the OGV are meshed using the O4H-type topology; the rotor tip clearance is meshed using the butterfly topology; the inlet duct, the outlet duct and the leakage path are meshed using the H-type topology. To achieve good resolution in the boundary layer, the area-average
The flow domain and boundary conditions are illustrated in Figure 3. The flow domain contains one blade passage for each blade row, with the periodic boundary condition applied to the side boundaries. The inlet plane is set at the stage inlet section ME15, whose boundary conditions are prescribed by the total pressure and temperature profiles from the experiment at the design speed1 [1]. An outlet duct of 1.5 times the compressor axial length is attached to the OGV outlet. The radial equilibrium backpressure boundary condition is imposed at the outlet, and the difference in the average backpressure between the adjacent operating points is 100 Pa when approaching the stall limit. At the rotor-to-stator and stator-to-OGV interface, the mixing plane boundary condition is used. In the case of the stator hub cavity, the grids of the primary flow passage are the same as that without the cavity. At the rotor-to-cavity and stator-to-cavity interface, the frozen rotor boundary condition is used.
Effects of rotor casing pinch
Overall performance
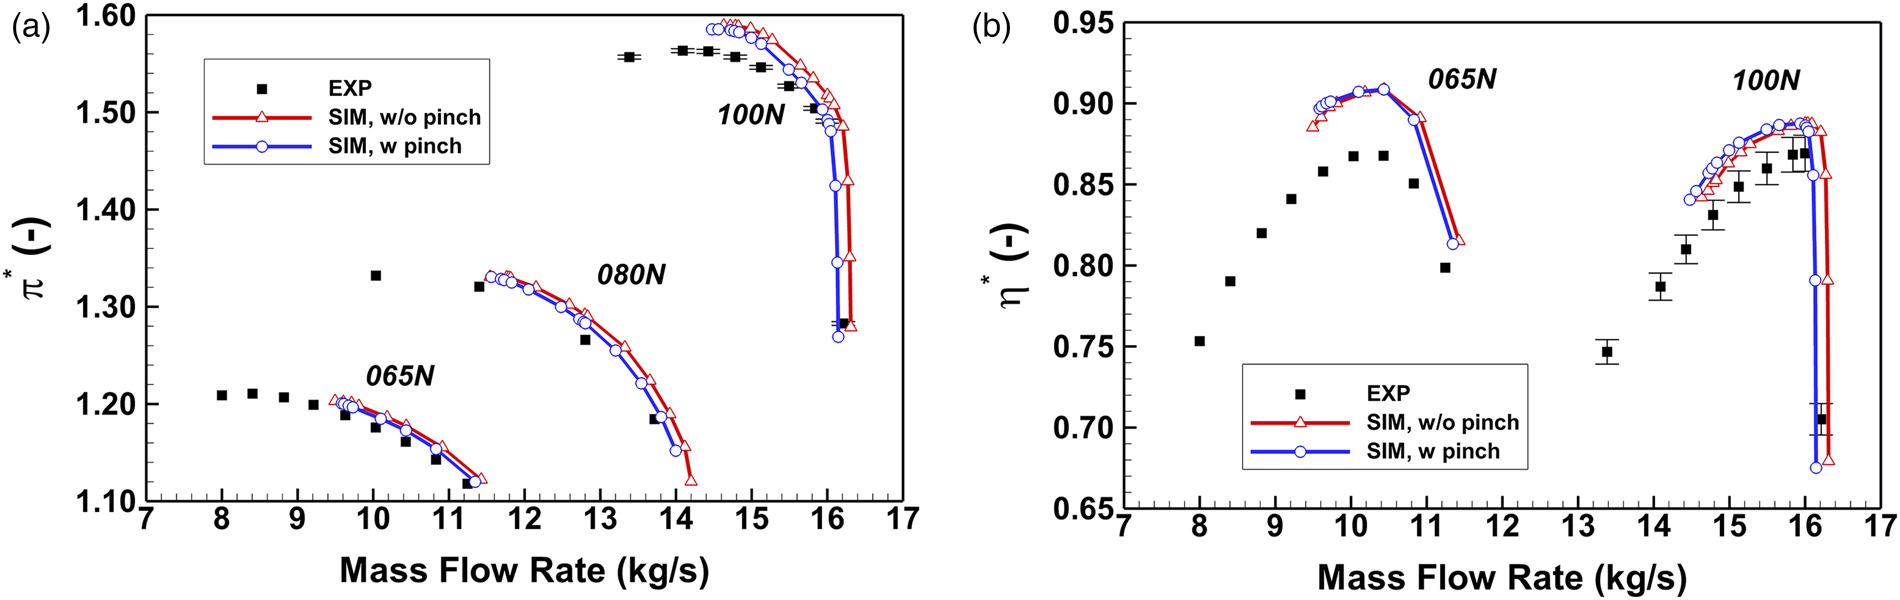
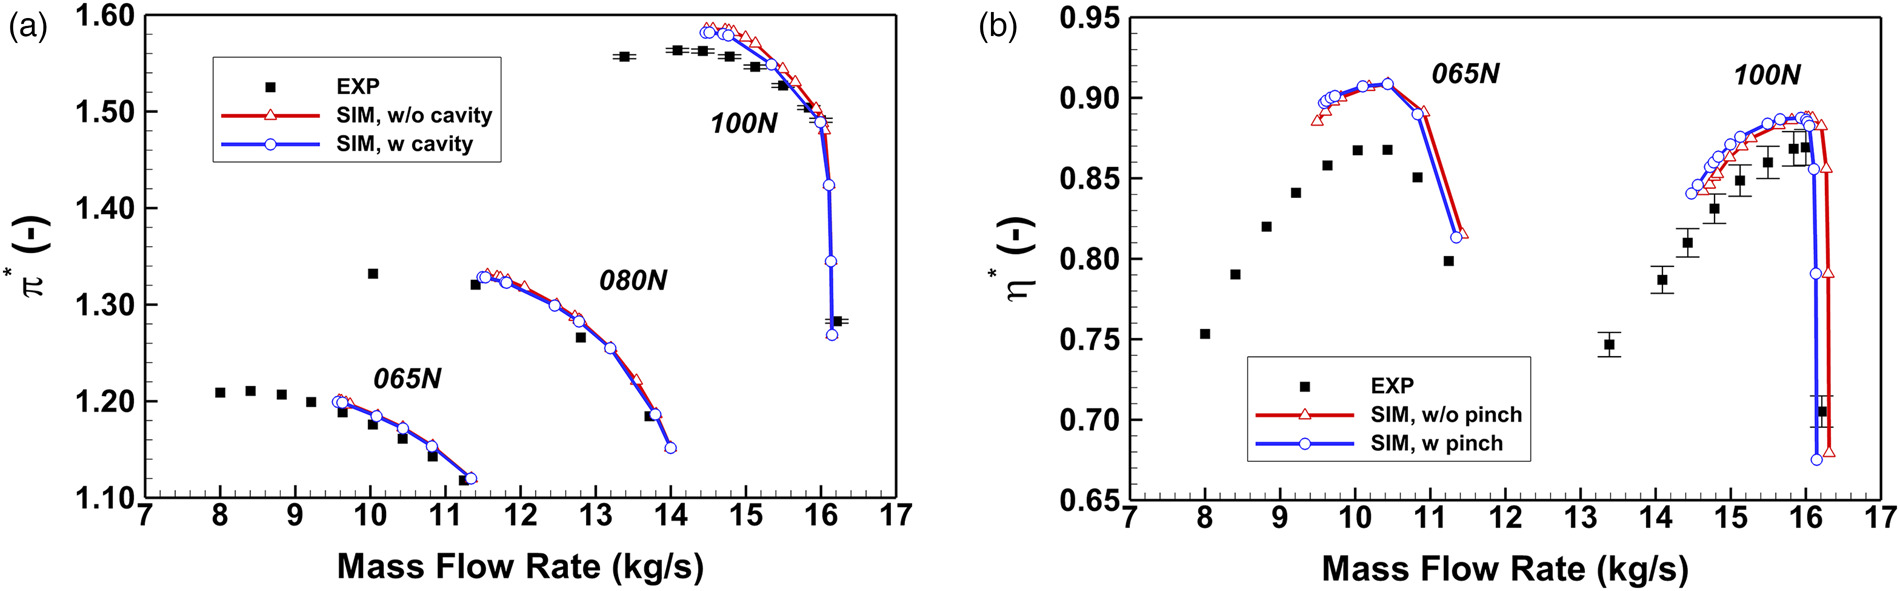
The stage performance characteristics with and without the rotor casing pinch are presented in Figure 4. In these plots, the solid curves with open symbols represent simulation results; the solid squares denote the experimental data; the error bars represent the measurement uncertainty2
[2]. Results show that the trapezoid-shaped pinch moves the
Radial profiles
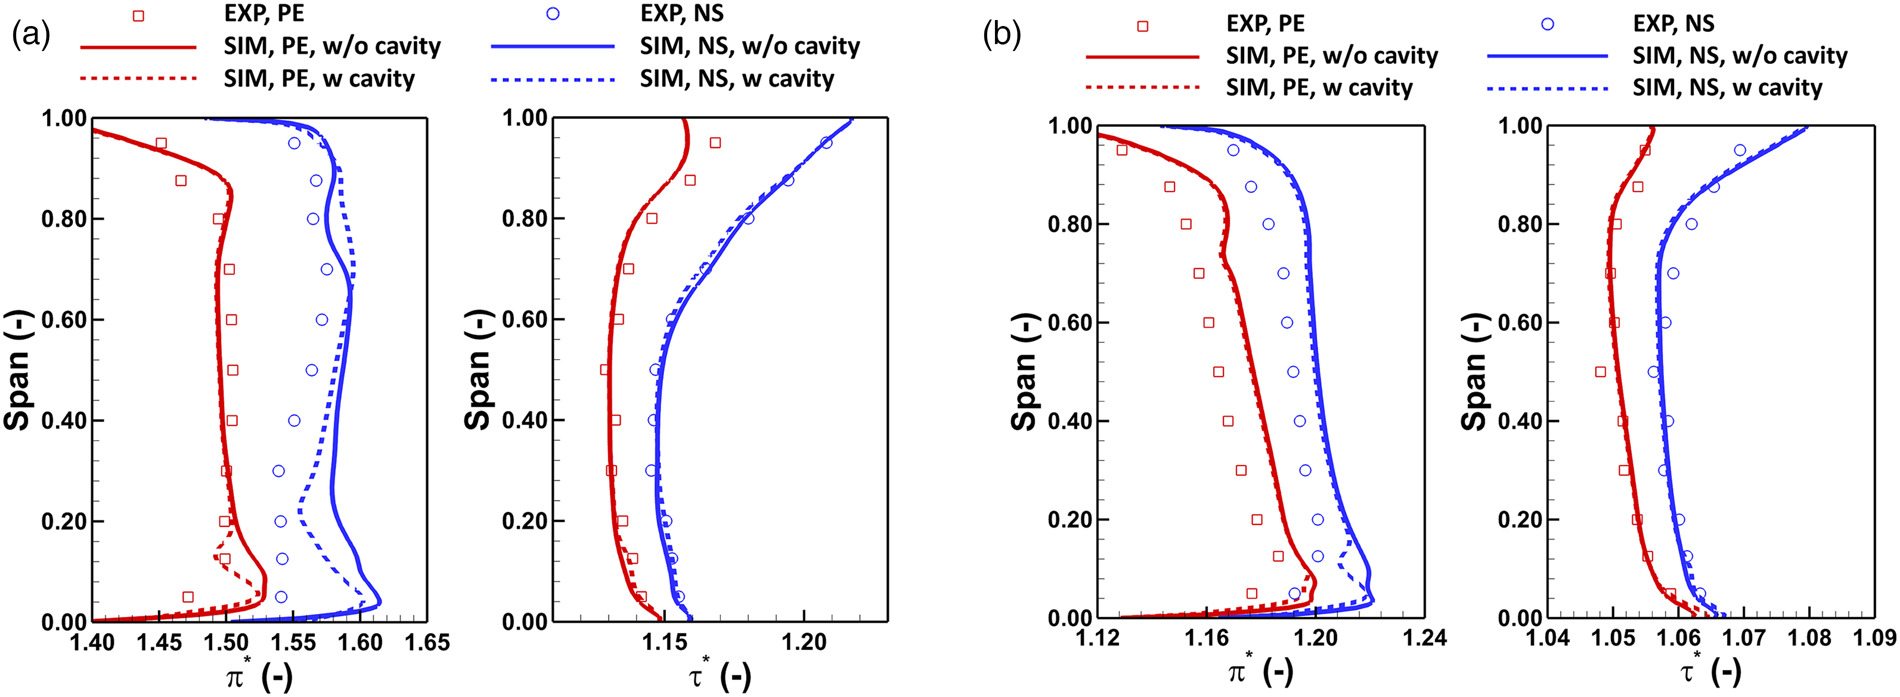
To examine the effect of rotor casing pinch in detail, the circumferentially area-averaged radial profiles downstream of the rotor and the stator are presented in Figure 5. In these plots, the hollow squares and circles denote the experimental results, and the curves represent the simulation results.
Figure 5.
Effect of rotor casing pinch on predicting the circumferentially mass-averaged radial profiles. (a) 100% speed, rotor exit (ME21). (b) 100% speed, stage exit (ME30). (c) 65% speed, rotor exit (ME21). (d) 65% speed, stage exit (ME30).
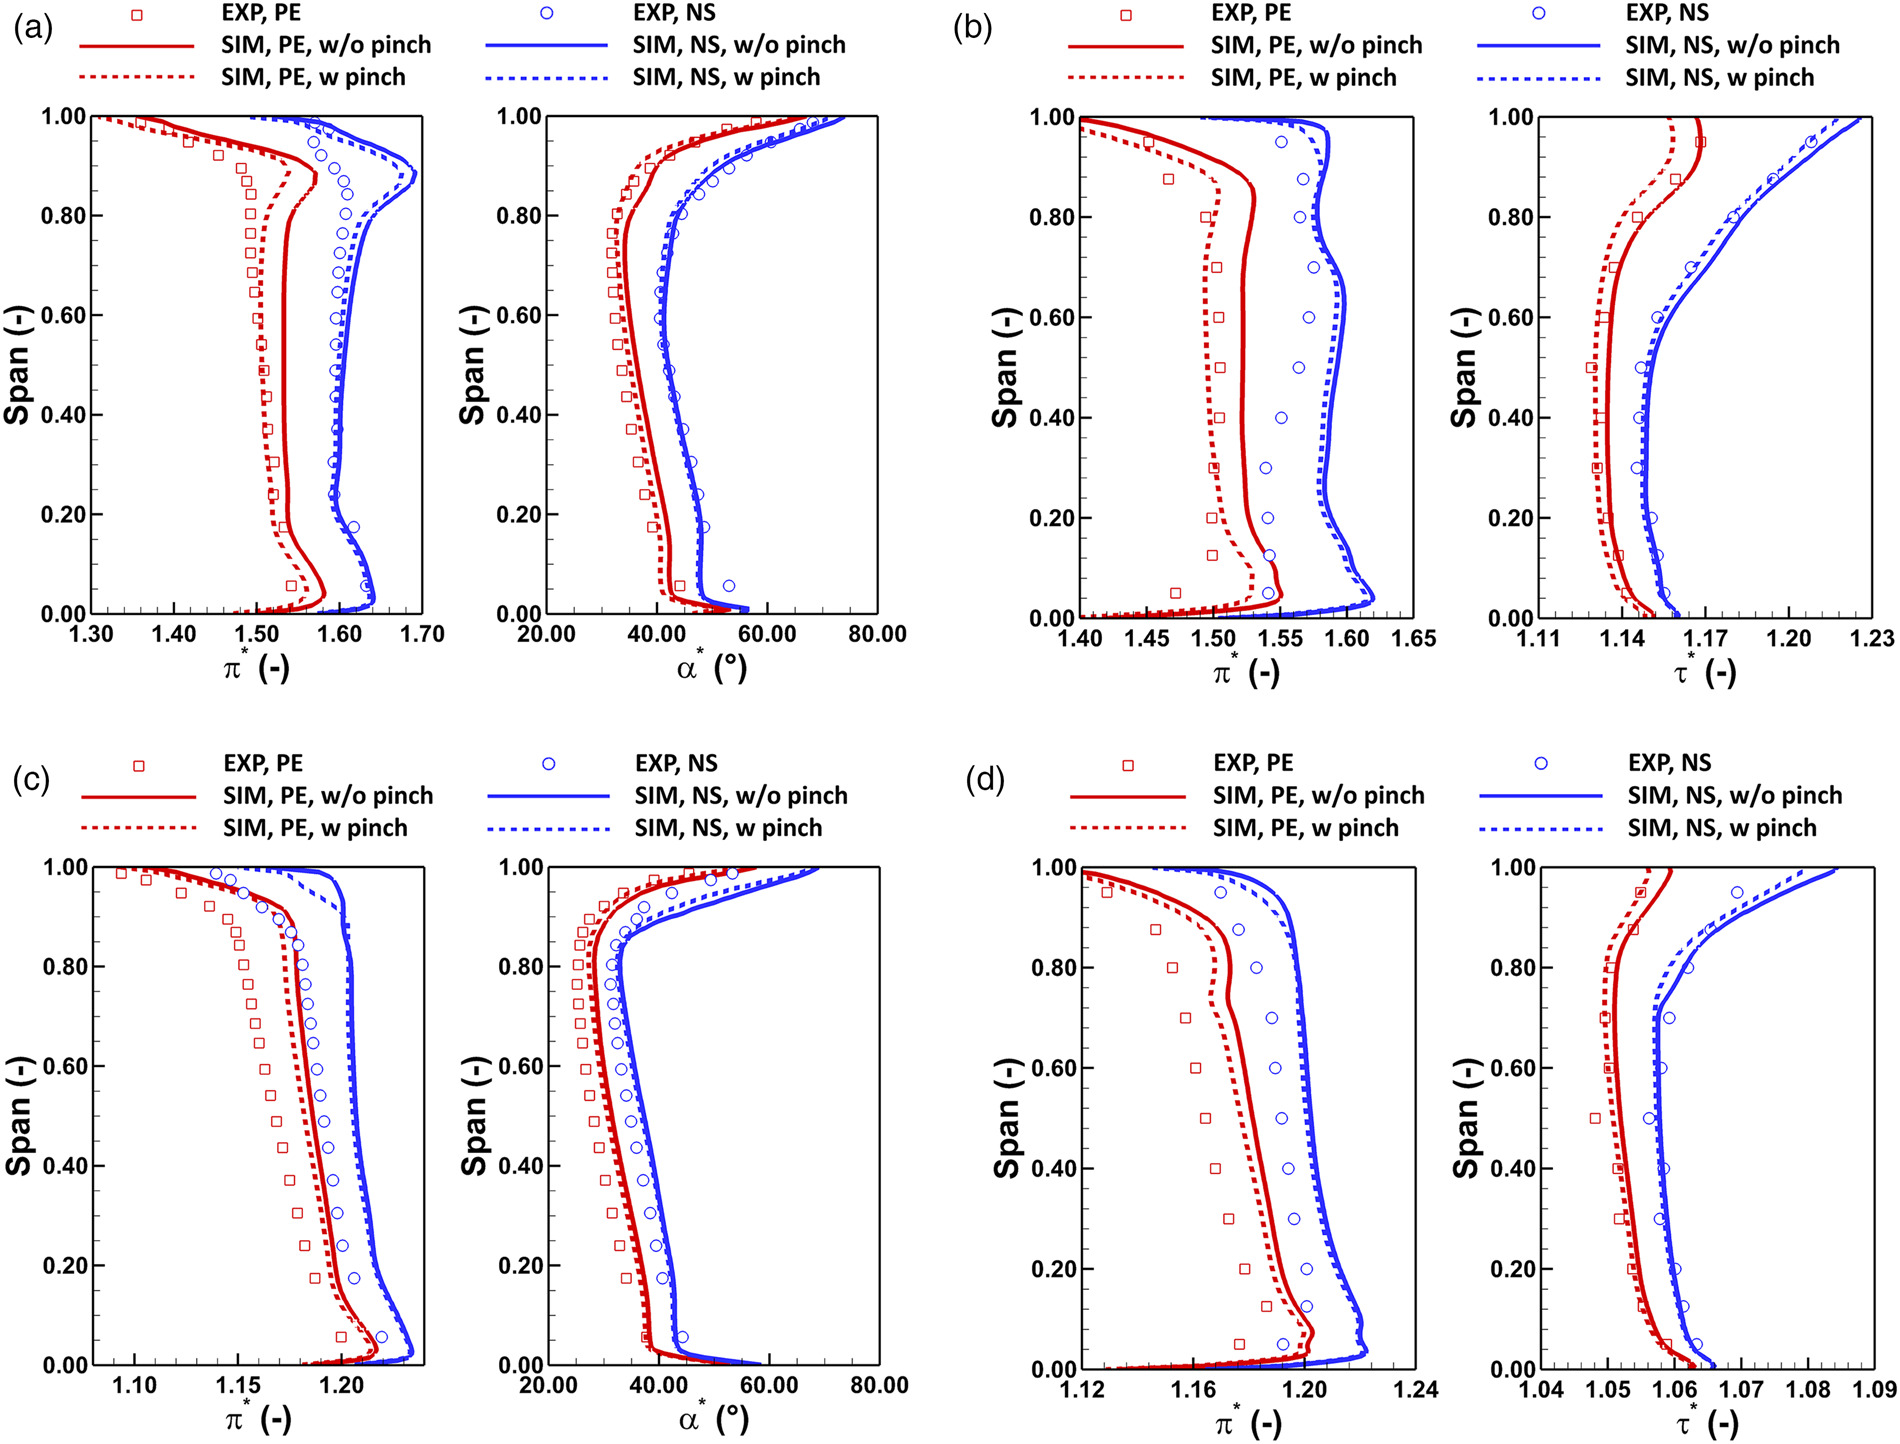
For the rotor exit profiles shown in Figure 5a, the rotor casing pinch reduces total pressure ratio
For the stage exit profiles shown in Figure 5b, the pinch-induced reduction of
To reveal the pinch effect at part speeds, the radial profiles at 65% speed are exhibited in Figure 5c and d. In general, the observations at 65% speed are similar to that at 100% speed: the pinch slightly reduces
Loss mechanism analysis
The rotor casing pinch is expected to change the rotor near-casing flow field and therefore the local entropy production. In this section, the mechanism by which the pinch changes the compressor efficiency is analyzed in detail. The analysis is based on the streamwise efficiency deviation
The streamwise efficiency deviation is plotted against the normalized axial location in Figure 6a. In this plot, solid curves and dashed curves represent the PE condition and the NS condition, respectively. Each of these curves is composed of 58 points in the axial direction, with the
Figure 6.
Distribution of efficiency deviation between cases with and without the rotor casing pinch. (a) Streamwise distribution. (b) Spanwise distribution.
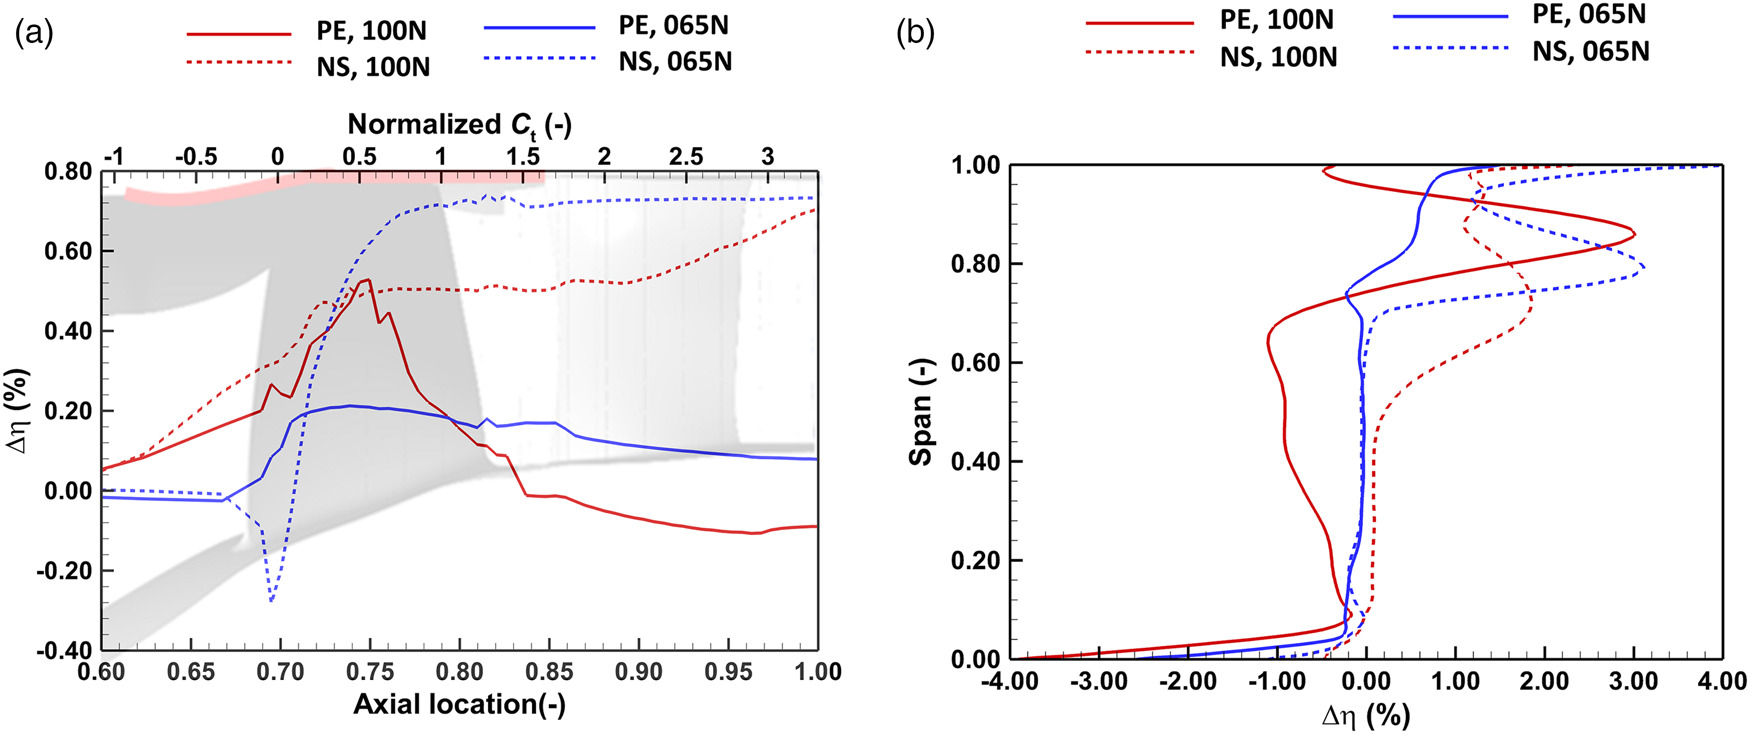
To help pinpoint the change of efficiency further, the spanwise efficiency deviation at the stage exit is illustrated in Figure 6b, where the
Based on the observations in Figure 6, the following regions of flow have evident effects on the compressor efficiency and hence need investigation:
The region between −1.0 and 0.5
The region between 0.5 and 1.5
The region between −1.0 and 0.5
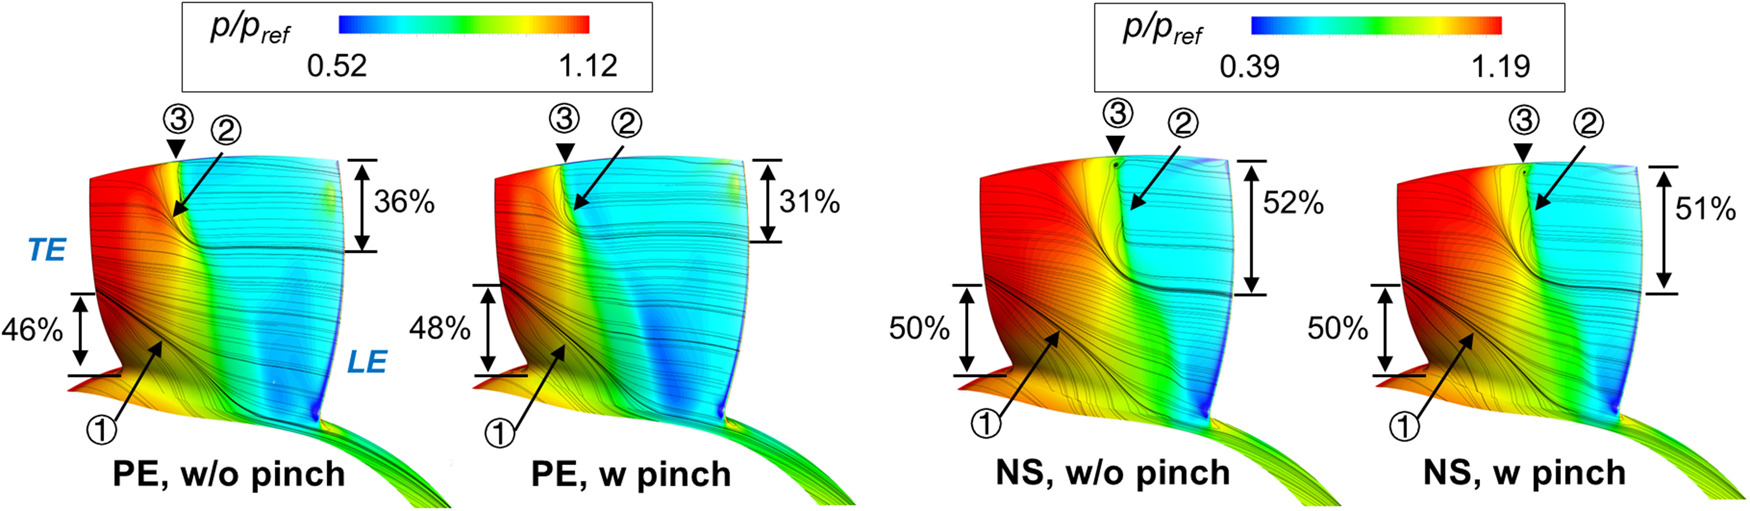
Regarding the PE and NS conditions at 100% speed, the static pressure contours and the limiting streamlines on the rotor suction surface and the rotor hub surface are presented in Figure 7. For all the cases presented, a hub corner separation and a shock-induced tip separation are observed. At the PE condition, the pinch pushes the shock front to a further downstream location, reduces the spanwise regions affected by the tip separation (from 36% to 31% span) and thus reduces the loss near the casing: on the other hand, the pinch also enlarges the hub corner separation size (from 46% to 48% span), which increases the loss near the hub. These competing flow mechanisms are responsible for the bump shape of
Figure 7.
Meridional view of static pressure contour and surface streamlines on the hub surface and the suction surface of the rotor; ➀: corner separation; ➁: shock-induced separation; ➂: shock front.
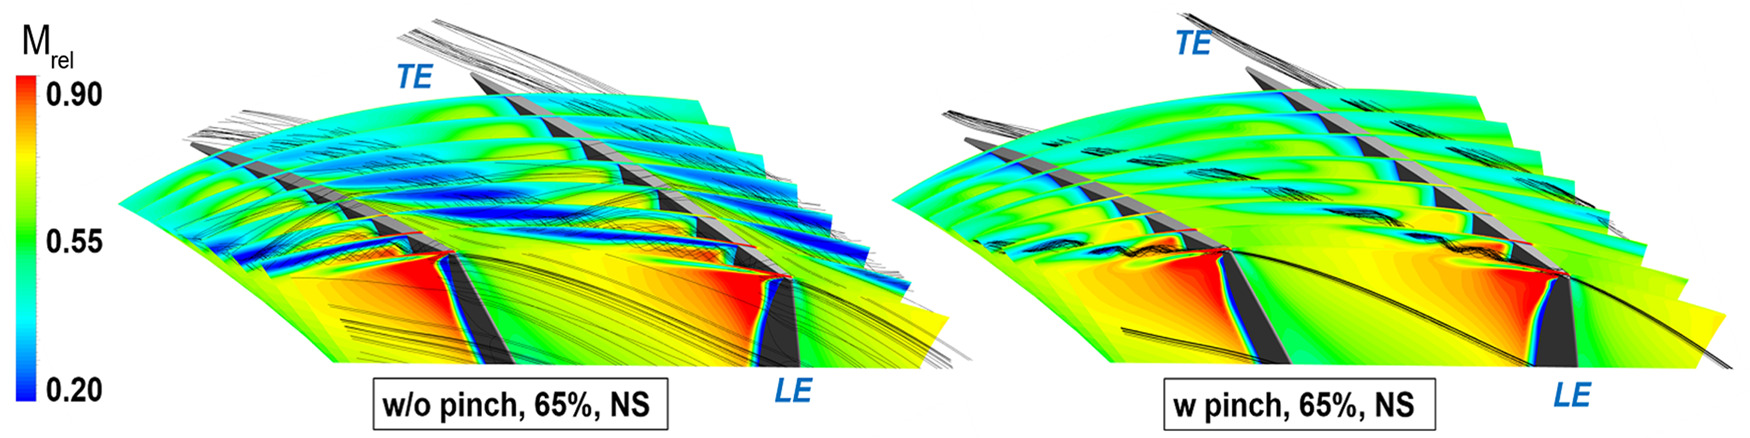
Regarding the NS condition of 65% speed, the relative Mach number contours and the relative streamlines are compared in Figure 8. In both cases, a tip leakage vortex is formed due to the shear between the tip leakage flow and the main flow. The difference is that the blockage cell featured by the low Mach number is smaller in the case with the pinch. Therefore, the pinch reduces the mixing loss associated with the tip blockage cell.
Effects of stator hub cavity
Overall performance
The stage performance characteristics with and without the stator hub cavity are presented in Figure 9, where the simulation results are represented by the solid curves with open symbols and the measured data are represented by the solid squares. From the first glance of Figure 9, there are no visible changes in the global performance characteristics with or without the cavity. Further examinations of the characteristic values of the compressor performance quantities show that the cavity does not change
Figure 9.
Effect of stator hub leakage flow on predicting the TUDa-GLR-OpenStage performance characteristics. (a) total pressure ratio. (b) isentropic efficiency.
The stator hub cavity effect is proportional to the cavity leakage flow rate. In Figure 10, the simulated leakage-to-inlet mass flow ratio is plotted against the inlet mass flow rate. It shows that the investigated cavity seal only allows between 0.15% to 0.25% of leakage-to-inlet mass flow ratio at the PE and NS conditions. According to the previous research (Wellborn and Okiishi, 1999), a leakage mass flow ratio of 0.25% only leads to an efficiency penalty between 0.2% and 0.6% in a multistage compressor, which is consistent with the observations in this work. Although the stator hub cavity investigated in this work does not have an evident effect on the global performance, its effects on the local flow fields still need further check.

Radial profiles
To examine the effect of the stator hub cavity in detail, the circumferentially area-averaged radial profiles downstream of the stator are presented in Figure 11, where the hollow scatters denote the experimental results and the curves represent the simulation results. Results show that the cavity does not affect the distribution of
Loss mechanism analysis
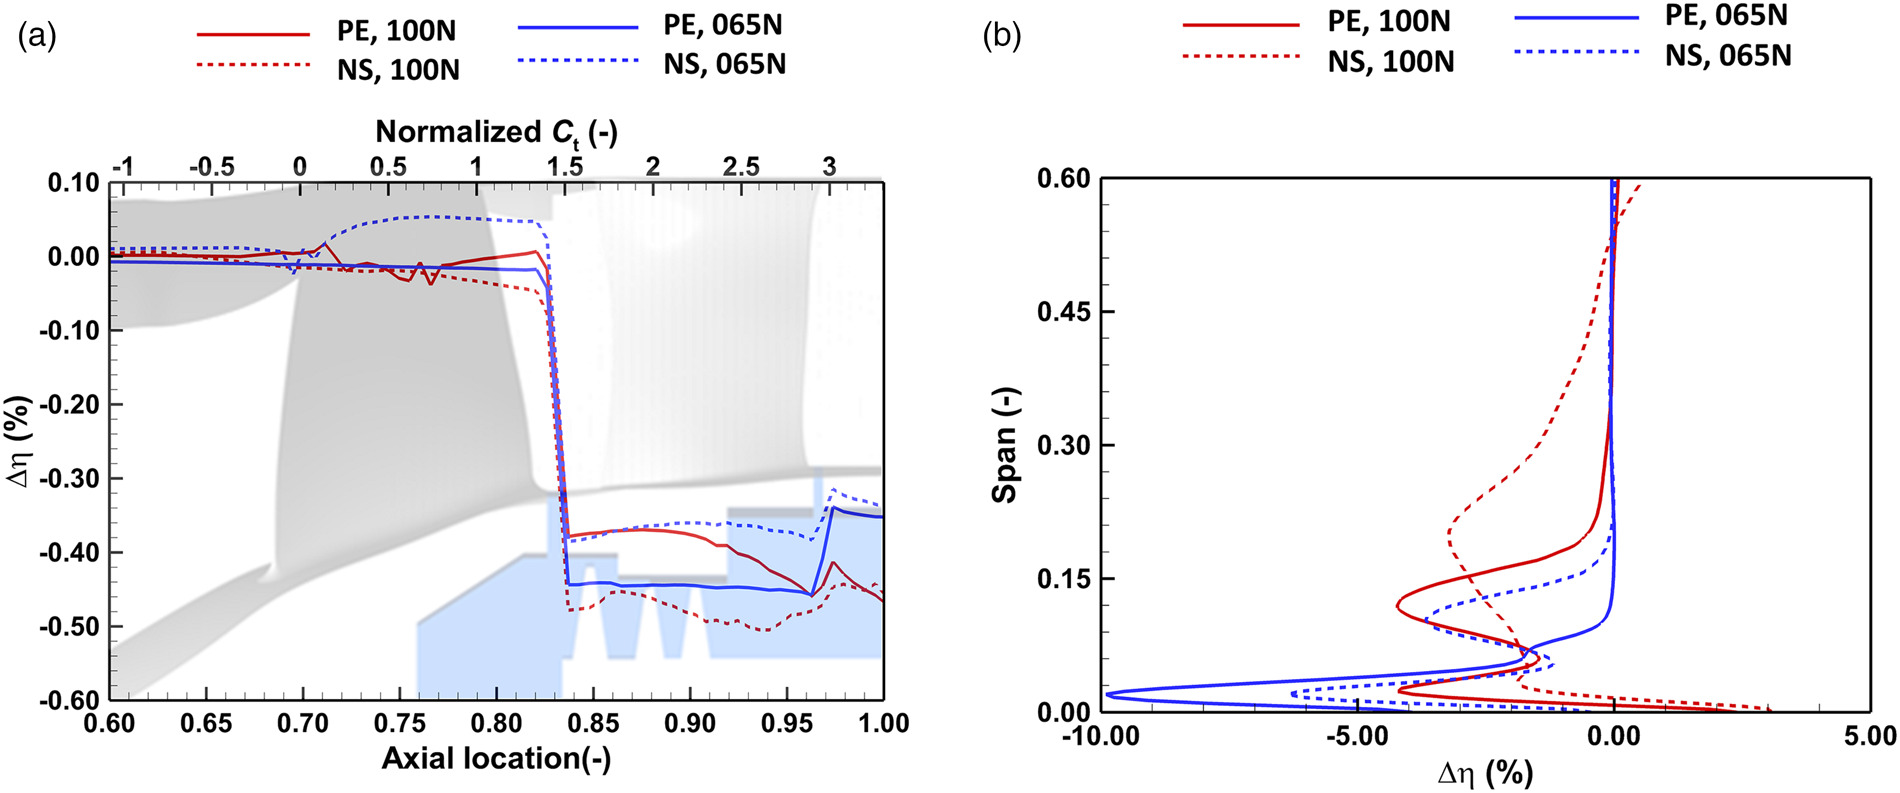
The stator hub cavity is expected to change the stator near-hub flow fields and therefore, the local entropy production. In this section, the mechanism by which the cavity changes the compressor efficiency is analyzed via the streamwise efficiency deviation
For the streamwise development of efficiency deviation shown in Figure 12a,
Figure 12.
Distribution of efficiency deviation between cases with and without the stator hub cavity. (a) Streamwise distribution. (b) Spanwise distribution.
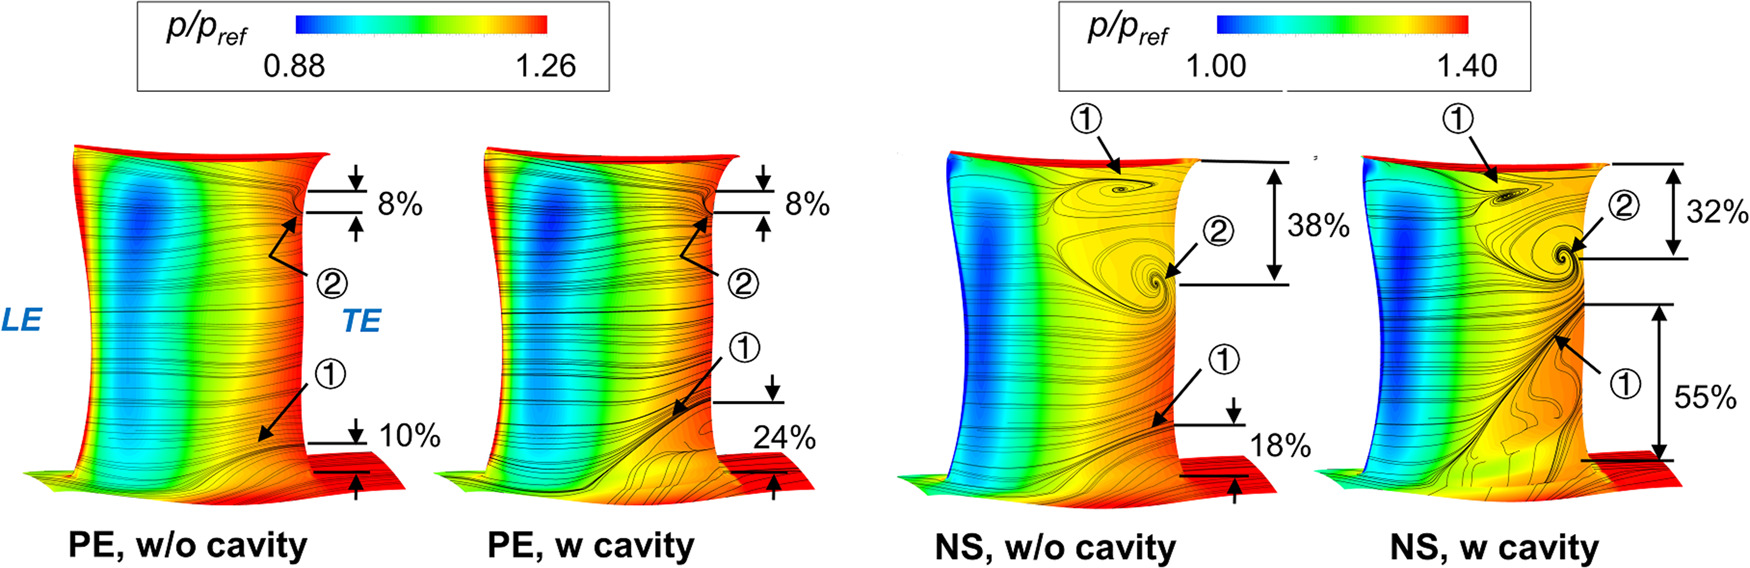
The static pressure contours and the limiting streamlines on the stator suction surface and the stator hub surface are presented in Figure 13. For the PE condition of 100% speed, a hub corner separation and a near-tip trailing edge separation are observed. When considering the stator hub cavity, the hub corner separation size is enlarged (from 10% to 24% span), but the near-tip trailing edge separation is not affected. For the NS condition of 100% speed, a hub corner separation, a mid-span trailing edge separation and a tip corner separation are observed. The cavity again increases the size of hub corner separation (from 18% to 55% span), but the mid-span separation and near-tip separation are barely affected (slightly reduced from 38% to 32% span). The increment of corner separation size at the NS condition is larger than that at the PE condition, which is due to a higher leakage mass flow rate shown in Figure 10. Therefore, it can be concluded that the stator hub cavity leakage enhances the hub corner separation and hence reduces the compressor efficiency and total pressure ratio. Such an effect will become more prominent if the leakage flow ratio increases (i.e., larger seal throat area).
Conclusions
In this paper, the effects of endwall geometric uncertainty and error on the performance of the TUDA-GLR-OpenStage transonic axial compressor have been investigated via numerical simulations. The flow mechanisms behind the changes in compressor performances have been analyzed. The main conclusions are drawn as follows:
The pinched rotor casing translates the rotor characteristics curve towards the low mass flow direction, leading to a reduced choke mass flow and total pressure ratio at all speeds and an increased isentropic efficiency at partial speeds. In terms of the radial profiles, the pinch reduces the total pressure ratio and the work input but increases the isentropic efficiency in the upper 50% span. The underlying flow mechanism leading to the efficiency increase is the reduction of tip blockage size, which is due to the tip unloading effect induced by the pinch.
The stator hub cavity leakage reduces slightly the total pressure ratio and the isentropic efficiency, but it has a neutral effect on the choke mass flow and the work input. In terms of the radial profiles, the reduction of total pressure ratio and isentropic efficiency remains in the lower 30% spans. The underlying flow mechanism leading to the efficiency drop is the enlargement of stator hub corner separation. When the leakage-to-inlet mass flow ratio increases, such phenomena become more prominent and hence the larger reduction of the total pressure ratio and the isentropic efficiency.
After considering the rotor casing pinch and the stator hub cavity in the CFD model, a better agreement between the experiment and CFD is achieved. Specifically, the former improves the accuracy of the global compressor performance characteristics and the local near-tip profiles; the latter improves the accuracy of the local near-hub profiles. However, the visible difference between the experimental data and the CFD still persists. To reduce this difference, further work is required on both the experiment side and the CFD side. Regarding the experiment, a second measurement campaign is in progress, which aims to reproduce the first measurement data with a higher spatial resolution near the endwalls. Regarding the CFD, the effects of the grid quality, the realistic boundary conditions, and scale-resolving simulation methods are under evaluation. The updated measurement data and CFD model will be provided in the GPPS second turbomachinery CFD workshop.