How Low Can You Go: Methane Production of Methanobacterium congolense at Low CO2 Concentrations
 Xihan Chen
 Lars Ditlev Mørck Ottosen
 Michael Vedel Wegener Kofoed
- Section for Biological and Chemical Engineering, Department of Engineering, Aarhus University, Aarhus, Denmark
Autotrophic hydrogenotrophic methanogens use H2/CO2 as sole carbon and energy source. In contrast to H2, CO2 is present in high concentrations in environments dominated by methanogens e.g., anaerobic digesters (AD), and is therefore rarely considered to be a limiting factor. Nonetheless, potential CO2 limitation can be relevant in the process of biomethanation, a power-to-gas technology, where biogas is upgraded by the addition of H2 and ideally reduce the CO2 concentration in the produced biogas to 0–6%. H2 is effectively utilized by methanogens even at very low concentrations, but little is known about the impact of low CO2 concentrations on methanogenic activity. In this study, CO2 consumption and CH4 production kinetics under low CO2 concentrations were studied, using a hydrogenotrophic methanogen, Methanobacterium congolense, as model organism. We found that both cellular growth and methane production were limited at low CO2 concentrations (here expressed as Dissolved Inorganic Carbon, DIC). Maximum rates (Vmax) were reached at [DIC] of 100 mM (extrapolated), with a CO2 consumption rate of 69.2 fmol cell−1 d−1 and a CH4 production rate of 48.8 fmol cell−1 d−1. In our experimental setup, 80% of Vmax was achieved at [DIC] >9 mM. DIC half-saturation concentrations (Km) was about 2.5 mM for CO2 consumption and 2.2 mM for CH4 production. No CH4 production could be detected below 44.4 μM [DIC]. These data revealed that the limiting concentration of DIC may be much higher than that of H2 for a hydrogenotrophic methanogen. However, DIC is not a limiting factor in ADs running under standard operating conditions. For biomethanation, the results are applicable for both in situ and ex situ biomethanation reactors and show that biogas can be upgraded to concentrations of 2% CO2 (98% CH4) while still retaining 80% Vmax at pH 7.5 evaluated from M. congolense. Since DIC concentration can vary significantly with pH and pCO2 during biomethanation, monitoring DIC concentration through pH and pCO2 is therefore important for keeping optimal operational conditions for the biomethanation process.
Introduction
Methanogenic archaea play a key role in the production of biogas from anaerobic digesters (AD), yielding a product gas with 50–75% CH4 and 25–50% CO2 (Plugge, 2017). Methanogenic archaea here produce CH4 from either H2/CO2 (hydrogenotrophic methanogensis, 4H2 + CO2 → CH4 + 2H2O) or acetate (acetoclastic methanogensis, CH3COOH → CH4 + CO2). Hydrogenotrophic methanogens are ubiquitous in natural anaerobic environments other than engineered AD systems, e.g., the gastrointestinal tracts, flooded soils, and anoxic lake and marine sediments (Whitman et al., 2014). In anaerobic environments, H2 is an intermediate produced by fermentative and syntrophic bacteria, where it undergoes rapid turnover and its concentration is extremely low (Lin et al., 2012). Use of H2 as an electron donor is however not restricted to hydrogenotrophic methanogens, but other anaerobic microorganisms, e.g., sulfate reducers and acetogens compete for available H2 with methanogens in anoxic environments (Robinson and Tiedje, 1984; Cordruwisch et al., 1988; Kotsyurbenko et al., 2001). Therefore, many studies have been committed to the understanding of H2 uptake kinetics of hydrogenotrophic methanogens through either pure cultures or the whole microbial community in environmental samples (e.g., Conrad, 1999; Kotsyurbenko et al., 2001; Eecke et al., 2012, 2013).
In an AD, dissolved H2 concentration is usually low [0.5–3 μM, (Frigon and Guiot, 1995)]. Low H2 concentration limits methane production through hydrogenotrophic methanogenesis, which has been verified by many studies devoted to biogas upgrading by injecting H2 directly into the AD (Luo and Angelidaki, 2012; Agneessens et al., 2017). Above studies showed that the addition of H2 to ADs greatly increases methane concentration in the biogas, while decreasing CO2 concentration—a process known as biomethanation.
Through biomethanation the CH4 concentration is increased to as high as natural gas quality (>95%), and thus this process dramatically alters the standard operational conditions in AD because CO2 concentration is correspondingly reduced to lower than 5%. Such low CO2 concentration is rarely seen in natural anaerobic environments where methanogens are present, so it is not clear whether such low CO2 concentration affects the activities of hydrogenotrophic methanogens. However, CO2 is known to be an important substrate for hydrogenotrophic methanogens, as it serves as both electron acceptor for energy production and (sole) carbon source for biosynthesis through the Wood-Ljungdahl pathway (Berg, 2011; Borrel et al., 2016). To the best of our knowledge, there is limited knowledge about CO2 uptake kinetics of methanogens in literature. Nevertheless, understanding CO2 uptake kinetics of methanogens could consequently be crucial when dealing with the concept of biomethanation, which aims at upgrading the CH4 concentrations in biogas to >95% by consuming CO2 to as low concentration as possible.
Previous work gives some insights about limitation of CO2 consumption rate and methanogenic rate at low CO2 concentrations during biomethanation (Luo et al., 2012; Garcia-Robledo et al., 2016; Agneessens et al., 2017). Here it was shown that H2 consumptions rate decreased when headspace CO2 concentrations was lower than 12% during H2 pulse injection batch experiments in bioreactors (Agneessens et al., 2017), while an inhibition of H2 consumption rate was found when CO2 concentration was below 6% in a methanogenic manure samples (Garcia-Robledo et al., 2016). These results thus indicate that CO2 uptake rate and methanogenic rate is limited at low CO2 concentrations with great implications for the limits of the biomethanation technology. However, the exact impact of CO2 on the methanogenic activity was not clearly depicted by those studies, as they were conducted on complex microbial communities that include both CO2 consumers and producers—including homoacetogens that compete with methanogens for H2 and CO2. Therefore, a thorough understanding of methanogenic reaction kinetics at low CO2 concentrations seems necessary in order to find out under which conditions hydrogenotrophic methanogenic rates will be reduced or even inhibited during biomethanation. This will enable us to optimize the efficiency of biomethanation.
In this study, we present the first trial to examine CO2 uptake kinetics of a hydrogenotrophic methanogen, Methanobacterium congolense, by studying its CH4 production and CO2 consumption rates at low CO2 concentrations with surplus of H2. We chose to study a model organism from the genus Methanobacterium because methanogens of this genus were found to increase substantially after pulse H2 injections in reactors with mesophilic sludge (Agneessens et al., 2017). M. congolense was used as test strain because it is a mesophilic methanogen originally isolated from a mesophilic anaerobic digester, and also because it solely utilizes H2 and CO2 as substrates for growth and methane production (Cuzin et al., 2001).
Materials and Methods
Strains and Culture Medium
Type strain Methanobacterium congolense (DSM7095) was purchased from Leibniz-Institut DSMZ-Deutsche Sammlung von Mikroorganismen und Zellkulturen GmbH (DSMZ). The methanogen was cultivated with a H2:CO2 (4:1) gas mixture at 37°C in versatile medium for methanogenic archaea, based on the medium developed by Khelaifia et al. (2013), but adding only acetate, formate and NaHCO3 as carbon source.
For the kinetic studies of CO2 uptake by M. congolense, the versatile medium was prepared (pH 7) without any carbon sources, by omitting the addition of acetate, formate, and NaHCO3 (hereinafter referred to as mineral medium). CO2 gas injected into the headspace at the beginning of incubation was thus the sole carbon source and electron acceptor for M. congolense during all incubations. To minimize pH effects by high amount of CO2, a version of mineral medium with higher buffering capacity, 10 times higher K2HPO4 (5.0 g/L) and 5 times higher KH2PO4 (2.5 g/L) than that of the mineral medium, was employed for cultures with high CO2 concentration (HBC mineral medium, pH 7). M. congolense performed normal growth in either medium or HBC mineral medium as in the versatile medium.
Experimental Setup
Two series of batch culture experiments were carried out for determination of CO2 uptake kinetics of M. congolense: long-term batch culture lasted for about 1 week and short-term batch culture lasted for around 3 h (see details below). For both batch cultures, M. congolense was cultivated in 330 mL serum bottles filled with 150 mL sterile medium and sealed with butyl rubber stoppers. Cultures were transferred several times in either mineral medium or HBC mineral medium before batch culture experiments, in order to make certain that they were adapted to the medium.
Long-Term Batch Culture
A series of 330 mL serum bottles filled with 150 mL mineral medium were prepared aseptically for the long-term batch culture. Firstly, the bottles were flushed thoroughly with sterile H2 gas (0.22 μm filtered) through butyl rubber septa and headspace pressure was kept at around 2 atmospheres eventually. Different volumes of sterile CO2 (0.22 μm-filter filtered), 2, 4, 8, 12, 16, 20, 24, 28, 32, 36, and 40 mL, were subsequently injected into the headspace to reach different CO2 partial pressure in the bottles. The mole fraction of H2:CO2 was higher than 4:1 in all bottles, so H2 was in excess. The bottles were incubated overnight at 37°C with continuous shaking (90 rpm) to allow the partitioning of CO2 between the gas and liquid phases and the dissolution of CO2 in water to be at equilibrium before the experiment started. Following overnight incubation, headspace pressure in each bottle was measured and gas composition was determined by gas chromatography (GC). Based on pressure and gas composition, CO2 partial pressure in the headspace (pCO2) were calculated and used to make a series of standard curves for describing the carbonate system in the bottles with sterile medium (details in Standard Curves).
Each of the long-term bottles was inoculated with 8 mL inoculum from an exponential growth phase culture of M. congolense. The bottles were incubated at 37°C and shaken at 90 rpm for about 1 week. During incubation, headspace pressure was monitored and 1 mL headspace was taken for gas composition analysis at regular intervals. 2 mL of medium was sampled aseptically once a day for optical density at 600 nm (OD600) and pH measurement.
Short-Term Batch Culture Experiment
M. congolense was incubated in either mineral medium or HBC medium with 4:1 H2:CO2 gases in the headspace. When the methanogens reached late exponential growth phase, as indicated by OD600, the short-term batch cultures were flushed thoroughly with sterile H2 gas (0.22 μm filtered) through a needle submerged in the liquid phase. The final pressure of H2 in the headspace was kept at around 2 atmospheres to ensure that H2 was in excess. Different volumes of sterile CO2 gas was subsequently injected into the headspace: 2, 4, 8, 12, 16, 20, 24, 32, and 40 mL for bottles with mineral medium and 4, 12, 14, 20, 28, 32, 40, 60, 80, and 90 mL for bottles with HBC mineral medium. Some of the above setup was repeated to check data reproducibility.
Following CO2 gas injection, the bottles were incubated in a rotary incubator (37°C, 90 rpm) for about 1 h to allow the partitioning of CO2 between the gas and mineral medium and the dissolution of CO2 in the medium to reach equilibrium. The headspace pressure and gas composition (CO2 and CH4) were monitored with an interval of 15–25 min for 1.5–2 h. At the beginning and end of the experiment, 2 mL liquid were removed aseptically from the bottle for OD600 and pH measurement and 2 mL for determination of cell abundance using quantitative PCR (qPCR). OD600 stayed nearly constant during the experiment. pH at the beginning of the experiment varied with CO2 amount injected to the bottle. The maximum pH variation was observed with 40 mL CO2 injected into bottles with mineral medium, where pH dropped to 6.44, compared to pH 7 before adding any CO2. pH dropped to 6.63 with 90 mL CO2 injected into HBC mineral medium bottles.
Analytical Measurements
The pressure of headspace was monitored by gas pressure sensor during the incubation. Headspace gas composition (CO2 and CH4) was determined immediately on a gas chromatograph equipped with a thermal conductivity detector (Shimadzu-2014) and a stainless steel column packed with Poropaq Q column. The carrier gas was helium. OD600 was measured on a Genesys 10 UV-VIS spectrophotometer (ThermoFisher, USA). pH was measured using a pH meter B-71X (Horiba, Kyoto, Japan).
Cell Abundance Estimation
Liquid samples for cell abundance were flash frozen with liquid nitrogen and stored at −20°C until analysis. DNA was extracted by using FastDNA kit (MP Biomedicals, LLC) and quantitative PCR was executed for quantification of cell abundance by using archaeal 16S rRNA primer pair–arc806F and arc915r-mod (Chen et al., 2017). Cell abundances of M. congolense were estimated by dividing the 16S gene copies with a factor of 3, since M. congolense's genome harbors three 16S rRNA gene copies (Tejerizo et al., 2017).
Carbonate System Calculation
Standard Curves
Following the measurements in Long-Term Batch Culture, standard curves were generated with sterile medium for carbonate system calculation. Under gas-liquid equilibrium conditions, CO2 gas injected into the 330 mL bottles with 150 mL sterile mineral medium at the starting time ultimately split into two fractions, CO2 gas in the headspace [CO2(g)] and dissolved inorganic carbon (DIC) in the medium. The latter was composed of three species (dissolved CO2 gas–CO2(aq), and ).
To generate standard curves, pCO2 values at equilibrium [pCO2(eq)] was firstly measured in each bottle receiving different amounts of CO2 (∑CO2). Then pCO2(eq) was plotted against ∑CO2, and the resulting curve was used for the calculation of total CO2 in each bottle during the experiments. Furthermore, [DIC] at equilibrium [[DIC](eq)] were calculated by subtracting CO2(g) from ∑CO2, and both pCO2(eq) and ∑CO2 were plotted with [DIC](eq) to generate standard curves for deduction of [DIC] during experiments.
Standard curves for carbonate system in the HBC mineral medium were generated in a similar fashion.
Carbonate System Calculation During Incubation
During the microbial growth, we assumed that the buffering capacity in the medium changed very little because the uptake of phosphate was minor compared to the amount of phosphate present in the medium. Thus, the carbonate system in bottles with methanogens behaved similarly as in sterile medium without microbial activity. This was supported by the fact that, when CO2 was nearly completely consumed by methanogens at the end of long-term batch culture experiments, medium pH returned to nearly 7, which was the initial sterile medium pH before CO2 injection.
Based on the above assumption, ∑CO2 in the bottle and [DIC] in the medium during the incubation were estimated from measured pCO2 by using the standard curves generated in Standard Curves. Concentrations of three inorganic carbon species in the medium (CO2(aq), and ) were estimated by software CO2SYS (Pierrot et al., 2006) by providing pCO2 and [DIC]. In this study, carbonate is negligible because the pH range was about 6.44–7, so [DIC] ≈ [CO2(aq)] + []. Both CO2(aq) and are bioavailable carbonate species, and they are shown to be utilized by methanogens in different steps in methanogenesis and carbon fixation (Ferry, 2013). Moreover, the enzyme carbonate anhydrase, which can actively transform to CO2 gas or vice versa, is found to be ubiquitous in the culturable methanogens isolated so far, including M. congolense. Therefore, DIC is used as the main parameter for studying the CO2 uptake kinetics here.
Calculation of Kinetic Parameters
Short-Term Batch Culture Experiment
∑CO2 consumption and CH4 production kinetics were estimated from specific ∑CO2 consumption rates (V∑CO2) and specific CH4 production rates (VCH4) in a range of [DIC] in the medium.
[DIC] values were estimated from the CO2 gas volumes injected in the bottles by fitting them to the standard curve of [DIC] and initial CO2 amount injected as mentioned in Standard Curves.
In each incubation, V∑CO2 was calculated by linear fitting of the ∑CO2 concentration as a function of time. The ∑CO2 concentrations in the incubations were estimated as indicated in Standard Curves. Similarly, VCH4 was estimated by linear fitting of the methane concentration in the headspace as function of time in each incubation. We assumed here that the dissolved CH4 was negligible due to its low solubility in water.
Long-Term Batch Culture
During the long-term incubation, specific ∑CO2 consumption rates (V∑CO2) were calculated by dividing ∑CO2 consumed between two sampling points with time and normalized with cell abundance. Specific CH4 production rates (VCH4) were calculated in a same manner. Since V∑CO2 and VCH4 changed with time during incubation, only the maximum V∑CO2 (r∑CO2) and VCH4 (rCH4) from each bottle were taken for kinetic analysis.
The growth yields (Ybiomass) were calculated at the end of incubation when CO2 was nearly consumed. We assumed that the CO2 fraction, which was not converted to CH4, was assimilated into cell biomass. Thus,
Here, CH4(end) refers to total CH4 amount produced by the end of incubation; [∑CO2(initial)] refers to the ∑CO2 amount injected at the beginning of the experiment; [∑CO2(end)] refers to the ∑CO2 amount left in the bottle at the end of the incubation.
During the exponential growth phase, cell numbers were plotted against the volume of ∑CO2 consumed and CH4 produced, respectively. The best-fit linear slopes were taken as the growth yields with respect to CO2 consumed and CH4 produced (YCO2 and YCH4).
Modeling of Kinetics
In summary, we estimated V∑CO2 and VCH4 from three different experiment setups: (1) short-term incubation with versatile mineral medium; (2) short-term incubation with HBC mineral medium; (3) long-term incubation with versatile mineral medium (r∑CO2 and rCH4).
We used the Michaelis-Menten equation to represent the effect of [DIC] on the performance of methanogen's ∑CO2 consumption rate and CH4 production rate, with the consideration of [DIC] threshold [DIC]*:
Where: Vmax−CO2 and Vmax−CH4 are the maximum specific ∑CO2 consumption rate and CH4 production rate, respectively; Km−CO2 and Km−CH4 are the [DIC] giving one-half the maximum specific ∑CO2 consumption rate and CH4 production rate respectively.
By the end of the batch culture experiments, headspace CO2 was depleted to a nearly constant partial pressure without further consumption, even though H2 was still in surplus. This constant CO2 partial pressure remained unchanged over a period even longer than the period of active CO2 uptake. This indicates that there is a CO2 and/or [DIC] threshold for M. congolense. The [DIC]* concentration at which no active CO2 uptake activity could be detected was found to be 44.4 ± 0.4 μM of DIC (N = 7) in this study.
Results
Growth of M. congolense in Long-Term Batch Cultures
Table 1 summarizes cell growth rates, maximum ∑CO2 consumption (r∑CO2) and CH4 (rCH4) production rates and growth yield of M. congolense incubated under different initial ∑CO2 amount and surplus H2. Growth rates, rCH4 and r∑CO2 increased linearly with added ∑CO2. Growth rate increased from <0.02 d−1 with 2 mL CO2 (~0.09 mmol, [DIC] = 0.44 mM) injected to about 1.12 d−1 with 32 mL CO2 (~1.43 mmol, [DIC] = 5.13 mM) injected. Lowest rCH4 and r∑CO2 (0.26 and 0.21 f mol cell−1 d−1, respectively) were found in the bottle receiving least amount of CO2 (2 mL). The bottle receiving 36 mL CO2 showed the highest rCH4 of about 108.99 f mol cell−1 d−1, while the bottle receiving 40 mL CO2 showed the highest r∑CO2 of about 80.90 f mol−1 cell d−1. The growth yield, Ybiomass-carbon assimilated for anabolism with respect to total CO2 assimilated, was in the range of 11–26%, but it did not show a clear trend with ∑CO2 amount injected. Cell specific growth yields with respect to ∑CO2 consumption (YCO2) and CH4 production (YCH4), which were estimated from data acquired during the exponential growth phase, were nearly equivalent in all conditions. YCO2 and YCH4 were consistent at around 0.8–1.8 × 10¹⁴ cells per mole gas consumed or produced, except for the low CO2 conditions (2–8 mL) where cell growth was not observed during incubation. YCO2 and YCH4 estimated in the bottles receiving <8 mL CO2 can be biased due to slow growth, therefore the yields were not used here.
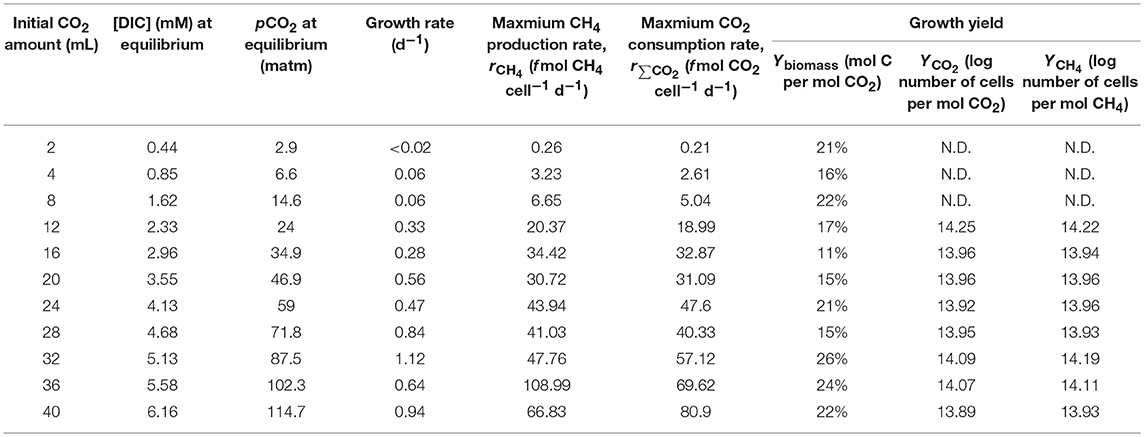
Table 1. Growth parameters of M. congolense under different initial CO2 amounts injected into the bottles.
In this long-term batch culture experiment, both rCH4 and r∑CO2 were of first order kinetics and showed a linear correlation with [DIC] instead of showing Michaelis-Menten kinetics. This implies that the saturation concentration of [DIC] for M. congolense is higher than 6 mM, which was the highest concentration tested in this study (Table 1). Unfortunately, attempts to further increase [DIC] by injecting more CO2 gas (60 mL) with the same setup led to a pH drop from 7 to <6.4 and substantial reduction of methanogenic activity (data not shown).
Kinetics of ∑CO2 Consumption and CH4 Production
Figure 1 gives an example of how V∑CO2 and VCH4 were estimated in short-term batch culture experiments. The CO2 gas in the headspace started to dissolve in the medium right after its injection, and cells started to utilize CO2 and produce CH4. CH4 production rates were low but kept increasing in the first 1–1.5 h during CO2 gas dissolution until CO2 equilibrium between gas and liquid phase reached. After the CO2 gas-liquid equilibrium, CH4 production rate was stable for a few hours (data not shown). To minimize the influence of increasing cell abundance due to growth during experiment, specific CH4 production rates were retrieved within 1–1.5 h after reaching CO2 gas-liquid equilibrium. In CO2-depleted medium M. congolense produced CH4 at extremely low rates in the presence of H2 (data not shown).
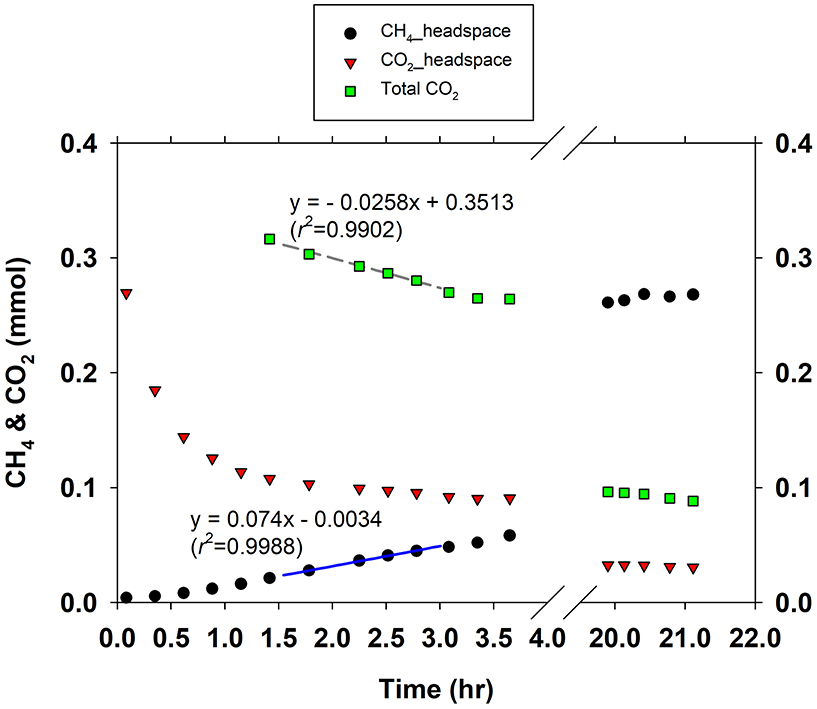
Figure 1. An example for determination of methane production rate and DIC consumption rate in a short-term batch culture.
Figures 2A,B show the estimation of V∑CO2 and VCH4 from three independent experimental setups, respectively: (1) short-term incubation with versatile mineral medium; (2) short-term incubation with HBC mineral medium; (3) long-term incubation with versatile mineral medium. V∑CO2 and VCH4 were both dependent on available [DIC] and followed Michaelis-Menten kinetics. Maximum specific CO2 consumption rate (Vmax−CO2) was estimated to be about 69.2 f mol CO2 cell−1 d−1 and half-saturation concentration of DIC (Km−CO2) was about 2.5 mM. Maximum specific CH4 production rate of M. congolense, Vmax−CH4, was about 48.8 f mol CH4 cell−1 d−1 and half-saturation concentration of DIC (Km−CH4) was estimated to be about 2.2 mM. Reaction speeds of 80% Vmax−CH4 could be reached at 9 mM [DIC]. Extrapolation of the fitted curve in Figure 2B shows that DIC concentrations needed for 90% Vmax−CH4 and 100% Vmax−CH4 would be 22 mM and 100 mM. As these values are outside the range of [DIC] that could be tested in the present setup without inferring changes in media pH, these concentrations could not be verified experimentally and should thus be interpreted with great care.
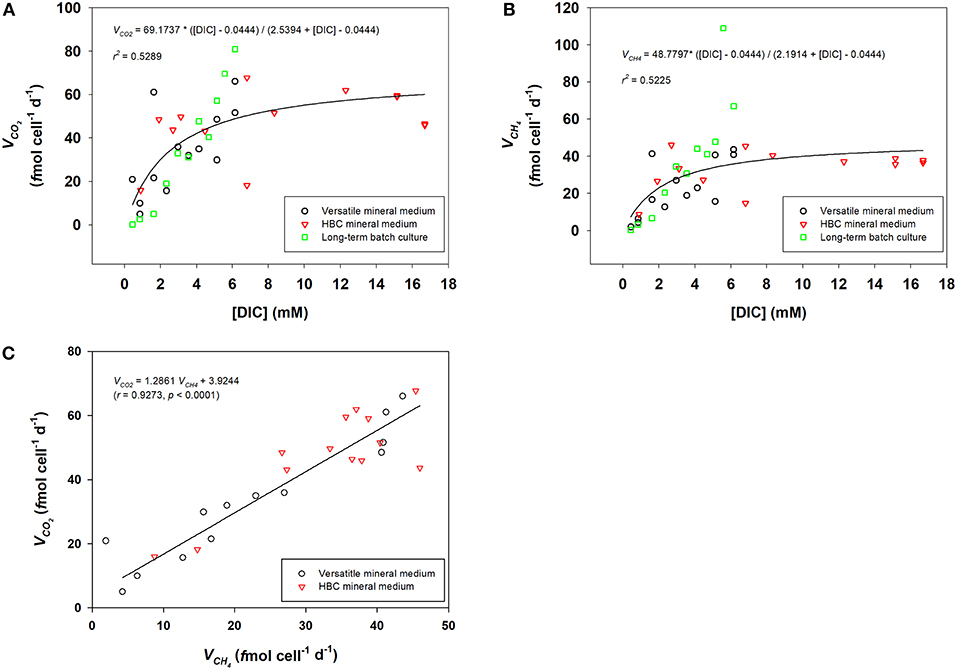
Figure 2. Km and Vm of DIC consumption (A) and methanogenic activity (B) for M. congolense, determined from both short-term and long-term batch cultures by Michaelis-Menten fitting. (C), Correlation between CO2 consumption rate (VCO2) and methane production rate (VCH4) in short-term batch cultures with both versatile mineral medium and HBC mineral medium (N = 25).
Figure 2C shows that there was good correlation between V∑CO2 and VCH4 for cells in late exponential growth phase in the short-term batch culture, where V∑CO2 was about 1.3 times higher than VCH4.
Estimation of Methanogenic Activities Under Various CO2 Headspace Concentrations
Biomethanation aims at decreasing pCO2 in the off-gas, which will directly influence [DIC] in the liquid (slurry) in AD. The [DIC] is furthermore dependent on slurry pH as this determines the CO2/ partitioning. Figure 3A shows the profile of [DIC] with pH in liquid (salinity = 0) under headspace CO2 concentration of 2, 5, 25, and 50%, assuming that the headspace pressure was 1 atmosphere and in equilibrium with slurry and using the growth pH range for M. congolense (5.9–8.2) (Cuzin et al., 2001) for calculation. It can be seen that increased pCO2 in headspace refers to higher [DIC] in the slurry and [DIC] further increases with pH. It can be calculated that [DIC] is tens of mM in the slurry in a normal mesophilic AD, where CO2 gas composes 25–50% of the biogas (Plugge, 2017). The lowest [DIC] is found at the lowest pH tested (5.9), about 9 mM, which can support the methanogenic rate of 80% of Vmax−CH4.
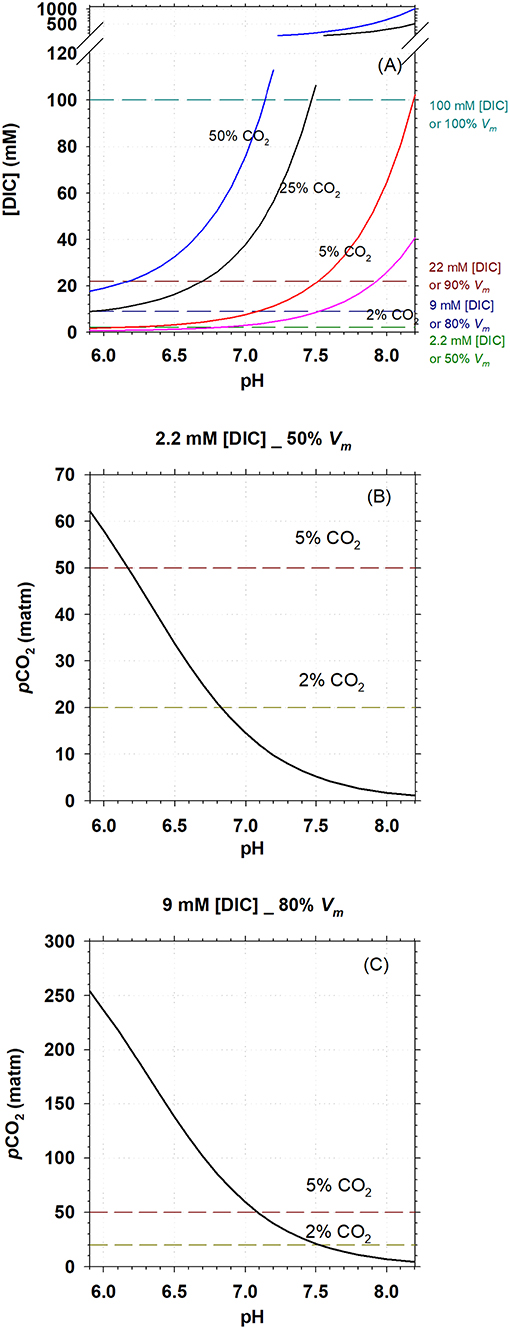
Figure 3. Carbonate systems, methanogenic activity, and pH in mesophilic AD. (A), Calculated DIC concentration in sludge in a mesophilic AD with headspace CO2 concentration of 2, 5, 25, and 50%; pH was set to be within the growth range for M. congolense. (B,C), pCO2 at pH range of 5.9–8.2 in an mesophilic AD, when [DIC] = 2.2 and 6 mM, respectively. Cell specific methanogenic rate for M. congolense is estimated to be 50 and 80% of Vm−CH4 at [DIC] of 2.2 and 9 mM, respectively, following the kinetic modeling from Figure 2B.
For biomethanation, it is critical to know how much pCO2 can be lowered through upgrading CO2 to CH4 but without affecting methanogenic activity. In Figures 3B,C, we model the lowest pCO2 required to maintain 2.2 and 9 mM [DIC] at different pH so as to maintain 50 and 80% of Vmax−CH4 according to the kinetic modeling. It is found that CO2 can be lowered to 5% and 2% at pH >6.2 and pH >6.8, respectively, with a methanogenic rate of 50% Vmax−CH4 (Figure 3B). Correspondingly, with a methanogenic rate of 80% Vmax−CH4, CO2 can be lowered to 5% and 2%, respectively, at pH >7.1 and pH >7.5 (Figure 3C).
Discussion
Using batch-culture experiments, we provided the first estimation of CO2/DIC uptake kinetics of an autotrophic hydrogenotrophic methanogen, M. congolense. We found that the affinity for DIC was dramatically lower than that of H2, the other reactant involved in hydrogenotrophic methanogenesis. With a Km of 2.2–2.5 mM, the affinity for DIC was shown to be a few tens to thousands times lower than the Km of H2, 0.44–66 μM, as previously reported for other hydrogenotrophic methanogens (Kotsyurbenko et al., 2001; Karadagli and Rittmann, 2007). Likewise, DIC threshold of 44.4 μM, at which concentration the methanogenic activity could no longer be detected for M. congolense, was also hundreds to thousands times higher than reported H2 thresholds of 6–70 nM, observed for methanogens (Lin et al., 2012). Such high Km and threshold of DIC might be related to the CO2 fixation pathway used by methanogens. M. congolense utilizes the Wood-Ljungdahl pathway for CO2 fixation, which has previously been shown to have the highest Km of DIC among the six autotrophic inorganic carbon assimilation pathways (Raven et al., 2012). From an evolutionary perspective, poor affinity for DIC is in accordance with the ubiquitous distribution of methanogens in habitats with high CO2 concentrations, such as anaerobic digesters, animal guts and sediments. Maximum CH4 production rate (Vmax−CH4, 48.8 f mol CH4 cell−1 d−1) of M. congolense, estimated from the kinetic model here is comparable to methanogenic rates found for methanogens from other complex environments incubated at a comparable temperature (35°C): 108-135 f mol CH4 cell−1 d−1 in anaerobic reactors (Li and Noike, 1992) and 31.5 f mol CH4 cell−1 d−1 in lake sediments (Lay et al., 1996).
Addition of different amounts of CO2 gas at the beginning of the batch culture experiments caused the decrease of media pH due to the dissolution of CO2 gas into the medium, where pH decreased more in bottles receiving higher amounts of CO2. A further challenge was that the CO2 concentration changed constantly during the incubation, due to continuous CO2 consumption. Therefore, we controlled the amount of CO2 added to keep pH within an optimal range for M. congolense (pH 5.9–8.2) (Cuzin et al., 2001), so that growth and methanogenic activity of M. congolense were not affected during our trials. A previous study on an obligate hydrogenotrophic autotrophic methanogen, Methanocaldococcus strain JH146, showed that pH did not affect methanogenic activity when it was within the range for optimal growth (Eecke et al., 2013). In our experiments, addition of 2–40 mL CO2 lowered pH from 7 to 6.44–6.94 in the mineral medium, which has lower buffering capacity but methanogenic rates kept increasing with CO2 amount and reached a rate of ~44 f mol CH4 cell−1 d−1 with 40 mL CO2 (pH = 6.44). Moreover, specific ∑CO2 consumption rates and CH4 production rates determined from all three different experimental setups here were in good agreement with respect to [DIC], regardless of buffering capacity or incubation time (Figure 2). Thus, pH seems to have little impact on the rates within the experimental range. However, addition of excessive CO2 beyond the buffering capacity was shown to greatly inhibit methanogenic activity: addition of 60 mL CO2 into the mineral medium decreased pH to 6.01 and resulted in a dramatic reduction of methanogenic activity to ~12 f mol CH4 cell−1 d−1.
Our study also shows that DIC concentration influences the microbial growth rate. This is revealed by a clear reduction of growth rate from 1.12 d−1 at 5.13 mM [DIC] to <0.02 d−1 at the lowest DIC concentrations tested (0.44 mM) in the long-term batch culture experiment (Table 1). A previous study showed that the mixotrophic methanogen, Methanosarcina barkeri, has very slow growth and low methanogenic rate when incubated with only H2 but lacking CO2 (Weimer and Zeikus, 1978).
Here we showed that growth of M. congolense was limited when [DIC] was lower than 1.6 mM, although methanogenesis still continued at low rates. Methanogens fix CO2 autotrophically into biomass through the Wood-Ljungdahl pathway, with which its methanogenesis pathway is associated (Berg, 2011). Therefore, whether the lowered growth rate at low [DIC] was due to reduced assimilation of carbon for biomass formation, or due to a reduced energy generation from methanogenesis remains unknown. Nonetheless, cell growth yield at the end of long-term incubation seems to be consistent for all DIC concentration tested: the methanogen converts approximately four moles of CO2 into CH4 for each mole of CO2 incorporated into biomass (Table 1). Similar fraction of CO2 was assimilated into biomass by late exponential growth phase cells during our short-term batch incubation, as ∑CO2 consumption rate was about 1.3 times higher than methane production rate for all bottles (Figure 2C). The ratio of CO2 used in dissimilatory and assimilatory metabolisms were thus independent of the [DIC] concentration.
As pCO2 concentrations in anaerobic digesters is often high (25–50%), our data showed that inorganic carbon availability might not limit methanogenic activity of M. congolense under standard operating conditions of an anaerobic digester. Fermentation processes in the sludge will furthermore supply CO2 to the hydrogenotrophic methanogens and hereby decrease the likelihood of CO2 limitation under standard conditions. This study is of primary importance for biomethanation, a power-to-gas technology used for biogas upgrading to increase CH4 concentration in the produced biogas through reduction of the CO2 concentration. Knowledge on methanogen's CO2/DIC kinetics is relevant as low CO2 concentrations (<2%) are required to fulfill criteria for injection of upgraded biogas to the natural gas grid. If M. congolense is treated as a representative of hydrogenotrophic methanogens, the biogas can be upgraded to >98% CH4 (<2% CO2) at 80% Vmax−CH4 when slurry pH in the reactor is >7.5 (Figure 3C) and 50% Vmax−CH4 at pH >6.8 (Figure 3B). Our result suggests that the availability of bioavailable inorganic carbon under low CO2 concentration might not greatly decrease methanogenic activity during biogas upgrading, but other factors, such as pH, might have greater impact on methanogenic rates.
A decrease in methanogenic activities to 50% of the maximum was shown in previous studies at different CO2 concentrations: 2.9% CO2 (59 mM [DIC] in methanogenic manure samples, Garcia-Robledo et al., 2016) and 10% CO2 (257 mM [DIC] in anaerobic digestate, Agneessens et al., 2017). These [DIC] concentrations were higher than the Km values reported here for M. congolense, which would indicate that the organisms in these studies either had lower affinities for [DIC]/CO2 than M. congolense, or that their methanogenic activities were inhibited by other factors like NH3 or pH. The pH levels of 8.2 (Garcia-Robledo et al., 2016) and 8.3 (Agneessens et al., 2017), were close to the value of 8.5 reported to be inhibitory to the biomethanation process (Angelidaki et al., 2018). As bicarbonate is the dominant buffering system in anaerobic slurries, it is often difficult to separate effects by high pH from effects by low CO2 concentrations here, as these are inversely related. Through the pure culture study on M. congolense reported here, it was possible to separate the direct pH effect from low concentrations of CO2 and hereby elucidate microbial physiological limitations to the process of biomethanation of a methanogenic type strain. The results are applicable to both in situ methanation, where H2 and CO2 are converted by methanogens in the main reactor, and separate ex situ reactor harboring specialized methanogenic communities.
Conclusions
Although CO2 affinity of M. congolense is many times higher than H2 affinity, CO2 concentrations will only become severely limiting for biomethanation at very low [DIC] concentrations. Experiments were only carried out on a single methanogenic strain here and further testing of other methanogens will reveal if they elicit a similar affinity for CO2.
Author Contributions
XC performed the experiments and drafted the manuscript. All authors designed the study, interpreted the data and wrote the manuscript.
Funding
This study was funded by the Innovation Fund Denmark, project Electrogas (grant number 4106-333 00017B).
Conflict of Interest Statement
The authors declare that the research was conducted in the absence of any commercial or financial relationships that could be construed as a potential conflict of interest.
Acknowledgments
We acknowledge Felix Beulig and Kai Finster from the Section of Microbiology, Department of Bioscience, Aarhus University for giving instructive suggestions on methanogen cultivation techniques and thank their section for providing lab facilities to perform DNA extraction and quantitative PCR. We would also like to thank technicians, Janni Ankerstjerne Sørensen and Britt Amby Malthesen, from Department of Engineering, Aarhus University for their help in setting up the gas chromatographic equipment. We would furthermore like to thank Mads Borgbjerg Jensen and Alastair James Ward from the Department of Engineering, Aarhus University, for their constructive feedback to the manuscript.
References
Agneessens, L. M., Ottosen, L. D. M., Voigt, N. V., Nielsen, J. L., De Jonge, N., Fischer, C. H., et al. (2017). In-situ biogas upgrading with pulse H2 additions: the relevance of methanogen adaption and inorganic carbon level. Bioresource Technol. 233, 256–263. doi: 10.1016/j.biortech.2017.02.016
Angelidaki, I., Treu, L., Tsapekos, P., Luo, G., Campanaro, S., Wenzel, H., et al. (2018). Biogas upgrading and utilization: current status and perspectives. Biotechnol. Adv. 36, 452–466. doi: 10.1016/J.BIOTECHADV.2018.01.011
Berg, I. A. (2011). Ecological aspects of the distribution of different autotrophic CO2 fixation pathways. Appl. Environ. Microb. 77, 1925–1936. doi: 10.1128/AEM.02473-10
Borrel, G., Adam, P. S., and Gribaldo, S. (2016). Methanogenesis and the wood-ljungdahl pathway: an ancient, versatile, and fragile association. Genome Biol. Evol. 8, 1706–1711. doi: 10.1093/gbe/evw114
Chen, X. H., Andersen, T. J., Morono, Y., Inagaki, F., Jorgensen, B. B., and Lever, M. A. (2017). Bioturbation as a key driver behind the dominance of Bacteria over Archaea in near-surface sediment. Sci. Rep. 7:2400. doi: 10.1038/s41598-017-02295-x
Conrad, R. (1999). Contribution of hydrogen to methane production and control of hydrogen concentrations in methanogenic soils and sediments. FEMS Microbiol. Ecol. 28, 193–202. doi: 10.1111/j.1574-6941.1999.tb00575.x
Cordruwisch, R., Seitz, H. J., and Conrad, R. (1988). The capacity of hydrogenotrophic anaerobic-bacteria to compete for traces of hydrogen depends on the redox potential of the terminal electron-acceptor. Arch. Microbiol. 149, 350–357. doi: 10.1007/BF00411655
Cuzin, N., Ouattara, A. S., Labat, M., and Garcia, J. L. (2001). Methanobacterium congolense sp. nov., from a methanogenic fermentation of cassava peel. Int. J. Syst. Evol. Micr. 51, 489–493. doi: 10.1099/00207713-51-2-489
Eecke, H. C. V., Akerman, N. H., Huber, J. A., Butterfield, D. A., and Holden, J. F. (2013). Growth kinetics and energetics of a deep-sea hyperthermophilic methanogen under varying environmental conditions. Environ. Microbiol. Rep. 5, 665–671. doi: 10.1111/1758-2229.12065
Eecke, H. C. V., Butterfield, D. A., Huber, J. A., Lilley, M. D., Olson, E. J., Roe, K. K., et al. (2012). Hydrogen-limited growth of hyperthermophilic methanogens at deep-sea hydrothermal vents. Proc. Natl. Acad. Sci. U.S.A. 109, 13674–13679. doi: 10.1073/pnas.1206632109
Ferry, J. G. (2013). Carbonic anhydrases of anaerobic microbes. Bioorgan. Med. Chem. 21, 1392–1395. doi: 10.1016/j.bmc.2012.12.005
Frigon, J. C., and Guiot, S. R. (1995). Impact of liquid-to-gas hydrogen mass transfer on substrate conversion efficiency of an upflow anaerobic sludge bed and filter reactor. Enzyme Microb. Tech. 17, 1080–1086. doi: 10.1016/0141-0229(95)00040-2
Garcia-Robledo, E., Ottosen, L. D. M., Voigt, N. V., Kofoed, M. W., and Revsbech, N. P. (2016). Micro-scale H-2-CO2 dynamics in a hydrogenotrophic methanogenic membrane reactor. Front. Microbiol. 7:1276. doi: 10.3389/fmicb.2016.01276
Karadagli, F., and Rittmann, B. E. (2007). Thermodynamic and kinetic analysis of the H2 threshold for Methanobacterium bryantii M.o.H. Biodegradation 18, 439–452. doi: 10.1007/s10532-006-9073-7
Khelaifia, S., Raoult, D., and Drancourt, M. (2013). A versatile medium for cultivating methanogenic archaea. PLos ONE 8:e61563. doi: 10.1371/journal.pone.0061563
Kotsyurbenko, O. R., Glagolev, M. V., Nozhevnikova, A. N., and Conrad, R. (2001). Competition between homoacetogenic bacteria and methanogenic archaea for hydrogen at low temperature. FEMS Microbiol. Ecol. 38, 153–159. doi: 10.1111/j.1574-6941.2001.tb00893.x
Lay, J. J., Miyahara, T., and Noike, T. (1996). Methane release rate and methanogenic bacterial populations in lake sediments. Water Res. 30, 901–908. doi: 10.1016/0043-1354(95)00254-5
Li, Y. Y., and Noike, T. (1992). Upgrading of anaerobic-digestion of waste activated-sludge by thermal pretreatment. Water Sci. Technol. 26, 857–866. doi: 10.2166/wst.1992.0466
Lin, Y. S., Heuer, V. B., Goldhammer, T., Kellermann, M. Y., Zabel, M., and Hinrichs, K. U. (2012). Towards constraining H-2 concentration in subseafloor sediment: a proposal for combined analysis by two distinct approaches. Geochim. Cosmochim. Acta 77, 186–201. doi: 10.1016/j.gca.2011.11.008
Luo, G., and Angelidaki, I. (2012). Integrated biogas upgrading and hydrogen utilization in an anaerobic reactor containing enriched hydrogenotrophic methanogenic culture. Biotechnol. Bioeng. 109, 2729–2736. doi: 10.1002/bit.24557
Luo, G., Johansson, S., Boe, K., Xie, L., Zhou, Q., and Angelidaki, I. (2012). Simultaneous hydrogen utilization and in situ biogas upgrading in an anaerobic reactor. Biotechnol. Bioeng. 109, 1088–1094. doi: 10.1002/bit.24360
Pierrot, D., Lewis, E., and Wallace, D. W. R. (2006). MS Excel Program Developed for CO2 System Calculations. ORNL/CDIAC-105a. Carbon Dioxide Information Analysis Center & U.S.D.O.E (Oak Ridge, TN: Oak Ridge National Laboratory).
Raven, J. A., Giordano, M., Beardall, J., and Maberly, S. C. (2012). Algal evolution in relation to atmospheric CO2: carboxylases, carbon-concentrating mechanisms and carbon oxidation cycles. Philos. Trans. R. Soc. B 367, 493–507. doi: 10.1098/rstb.2011.0212
Robinson, J. A., and Tiedje, J. M. (1984). Competition between sulfate-reducing and methanogenic bacteria for H2 under resting and growing conditions. Arch. Microbiol. 137, 26–32. doi: 10.1007/BF00425803
Tejerizo, G. T., Kim, Y. S., Maus, I., Wibberg, D., Winkler, A., Off, S., et al. (2017). Genome sequence of Methanobacterium congolense strain Buetzberg, a hydrogenotrophic, methanogenic archaeon, isolated from a mesophilic industrial-scale biogas plant utilizing bio-waste. J. Biotechnol. 247, 1–5. doi: 10.1016/j.jbiotec.2017.02.015
Weimer, P. J., and Zeikus, J. G. (1978). One carbon metabolism in methanogenic bacteria. Cellular characterization and growth of Methanosarcina barkeri. Arch. Microbiol. 119, 49–57. doi: 10.1007/Bf00407927
Keywords: methanogenesis, hydrogen, carbon dioxide, biomethanation, CO2 threshold, CO2 kinetics, biogas upgrading
Citation: Chen X, Ottosen LDM and Kofoed MVW (2019) How Low Can You Go: Methane Production of Methanobacterium congolense at Low CO2 Concentrations. Front. Bioeng. Biotechnol. 7:34. doi: 10.3389/fbioe.2019.00034
Received: 02 November 2018; Accepted: 05 February 2019;
Published: 07 March 2019.
Edited by:
S. Venkata Mohan, Indian Institute of Chemical Technology (CSIR), IndiaCopyright © 2019 Chen, Ottosen and Kofoed. This is an open-access article distributed under the terms of the Creative Commons Attribution License (CC BY). The use, distribution or reproduction in other forums is permitted, provided the original author(s) and the copyright owner(s) are credited and that the original publication in this journal is cited, in accordance with accepted academic practice. No use, distribution or reproduction is permitted which does not comply with these terms.
*Correspondence: Michael Vedel Wegener Kofoed, mvk@eng.au.dk