Development of a Multi Criteria Decision Analysis Model for Pavement Maintenance at the Network Level: Application of the MACBETH Approach
 Pedro Marcelino
 Maria de Lurdes Antunes2
  Eduardo Fortunato
 Marta Castilho Gomes
- 1National Laboratory for Civil Engineering, Transportation Department, Lisbon, Portugal
- 2National Laboratory for Civil Engineering, Board of Directors, Lisbon, Portugal
- 3Instituto Superior Técnico, CERIS, CESUR, Lisbon, Portugal
This paper proposes the application of the MACBETH approach for the development of a multi criteria value model to enable the prioritization of maintenance and rehabilitation interventions in the pavements of road networks according to technical, economic, and social aspects. A case-study design considering the Portuguese network was undertaken to illustrate the proposed approach. Using an interactive structuring process developed with the decision-maker, a set of five evaluation criteria related to maintenance costs, traffic, pavement condition, safety, and social equity were defined. The MACBETH approach was then used to build value functions and establish relative weights for the criteria. An application of the resulting model was made to a portfolio of possible intervention projects, prioritizing them according to the principle of benefit/cost maximization. The case-study demonstrated the application of the MACBETH approach and its suitability to solve the decision-making problem, thus proving the usefulness of this approach for road agencies with pavement management responsibilities.
Introduction
Road infrastructure belongs to the set of assets that play an essential role in our societies. Due to its exposition to several deterioration processes, roads tend to degrade over time. As a consequence, it is important to manage these assets in a rational way so that they can last longer (Uddin et al., 2013).
One of the responsibilities of the road network manager is to decide which maintenance and rehabilitation interventions should be carried out so that the infrastructure continues to fulfill its purpose. These decisions are often taken in a context constrained by technical, economic, financial and social restrictions. Accordingly, the decision process occurs in a complex system that should be dealt with a structured approach.
Decisions in pavement management usually refer to one of two generalized levels: the network-level and the project-level. At the network-level, the goal is to optimize the use of available resources for the development of nationwide maintenance and rehabilitation programs. On the other hand, the project level focus on the study of alternative maintenance or rehabilitation interventions for a particular road section (or project) within the overall program. In this study, only decisions at the network-level are considered.
The use of multi criteria models is commonplace in complex decision-making, such as those related to the maintenance management of road infrastructures at the network-level (Deluka-Tibljaš et al., 2013). Multi criteria models take into account the various criteria that influence the decision process of groups or individuals and uses them to evaluate each of the available options (Belton and Stewart, 2002). In the context of pavement maintenance, multi criteria models arise as a scientific process that evaluates different possible interventions considering road sections characteristics.
A common assumption in multi criteria decisions processes is that none of the available options are expected to be better than all of the others in an absolute way (Belton and Stewart, 2002). Consequently, the performance of each option in the different criteria should be considered to achieve a balanced solution. A weighting process should be performed for options evaluation, considering that a better performance in one criterion can compensate a worse performance in another criterion (or vice-versa). Models that take this situation into account are known as additive value models.
In the field of pavement maintenance, the analytic hierarchy process (AHP) (Saaty, 1980) is commonly used to build additive value models (Smith and Tighe, 2006; Farhan and Fwa, 2009; Li et al., 2018). This process allows for the definition of value functions and weights through an interactive process of qualitative evaluations (Belton and Stewart, 2002). Accordingly, AHP can be applied to quantify the benefit/attractiveness of different possible maintenance and rehabilitation interventions in the road network.
However, despite its popularity, the AHP has often been criticized by several authors, from different perspectives. For example, Belton and Stewart (2002) question the additive hierarchical composition of AHP, showing that it can lead to Rank Reversal (changes in the rank ordering due to the addition of an irrelevant option). Other authors like Pérez et al. (2006) question the AHP behavior when an indifferent criterion (criterion in which all options perform equally well) is added, arguing that an independence property is lacking so that such criterion addition does not alter the results. Finally, Bana e Costa and Vansnick (2008) challenge the meaning of the priority vector resulting from the eigenvalue method used in AHP.
This paper explores the use of MACBETH (Measuring Attractiveness by a Categorical Based Evaluation Technique) as an alternative to AHP. The MACBETH approach has been widely used in multi criteria decision processes, such as airport management, credit scoring, and strategic town planning (Bana e Costa et al., 2005). As AHP, MACBETH is based on qualitative pairwise comparisons. However, its mathematical foundations differ from those of AHP, intending to overcome some of the AHP shortcomings (Bana e Costa et al., 2005).
The additive value model resulting from the MACBETH approach can be used to solve multi criteria resource allocation problems. A common solution for these problems is the application of the benefit/cost principle in which the available decision options are prioritized according to their benefit in financial terms (overall benefit divided by cost) (Phillips and Bana e Costa, 2007). This solution is rather interesting for pavement maintenance problems due to limited annual maintenance budgets meaning road agencies can hardly satisfy all the maintenance and rehabilitation needs (Labi and Sinha, 2005). Accordingly, it is necessary to establish intervention priorities and optimize the pavement maintenance strategy.
The primary objective of this paper is to show that a multi criteria model based on the MACBETH approach is suitable to support decisions on pavement maintenance at the network level. A case-study based on the Portuguese network was developed to demonstrate the applicability of the proposed approach. In this case study, the decision-making problem was structured around the context and the decision-maker. A total of four evaluation criteria relating to traffic, safety, pavement condition, and social equity were defined. The MACBETH approach was used to build value functions and weights for these criteria. A portfolio of possible intervention projects was evaluated according to the resulting additive value model. Finally, a benefit/cost analysis was performed to prioritize and select interventions from the mentioned portfolio.
Aspects of the Decision Analysis Process
A decision analysis process is a systematic way to reason about complex problems and make informed decisions (Clemen and Reilly, 2001). An important aspect of decision analysis is that it generally allows for the integration of feelings and beliefs. As a result, decision analysis provides a structured way to think about problems and decisions within which a decision-maker can integrate subjective judgments and improve the quality of their decisions. Figure 1 summarizes the decision-analysis process.
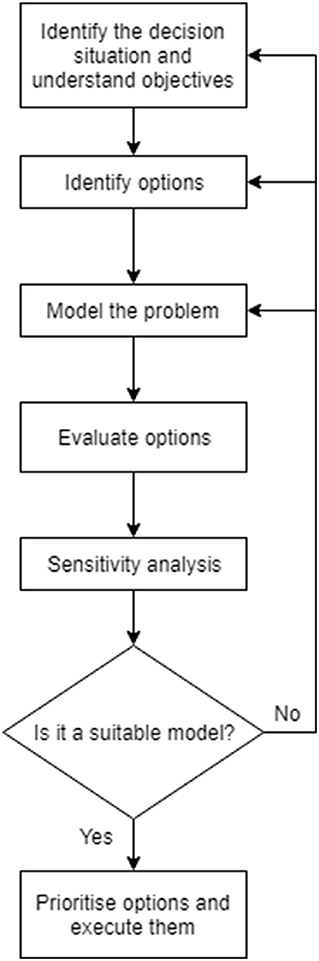
Figure 1. Decision analysis process (adapted from: Clemen and Reilly, 2001).
As can be seen, the process begins with the identification of the decision context and the understanding of its objectives. These objectives should be (Franco and Montibeller, 2011):
• Essential, considering the motivations and concerns of the decision problem;
• Understandable, with clear and unambiguous meaning;
• Operational, allowing the quantification and evaluation of performances;
• Succinct, there is no redundancy of objectives;
• Concise, considering as few goals as possible;
• Preferably independent, which means that the performance evaluation in one objective does not depend on the assessments in the other.
This first step will shape the decision problem and determine the options to be evaluated so that it plays an essential role (Hammond et al., 1999).
In the next step, options are identified; knowledge about the objectives will help to identify options. Also, it often happens that a detailed analysis of the objectives leads to the identification of options that had not already been recognized from the outset.
The third step is modeling and it is a critical step in decision analysis. In this step, it is necessary that the performance descriptors are defined. Performance descriptors are the set of attributes that measure the performance of the possible options, according to the objectives of the decision-maker (Bana e Costa et al., 2008). Following this, the evaluation model itself is defined. If a simple additive value model is considered, the definition of the evaluation model implies the construction of value functions for the performance descriptors and the determination of weights. The construction of value functions allows for the determination of value scales for performance descriptors, while the attribution of weights seeks to quantify the importance of the criteria in the decision process (Bana e Costa et al., 2008).
Once the model is defined, it is possible to evaluate the options taking into account the assumptions of the model. This evaluation classifies the possible options in terms of their global attractiveness.
After that, a sensitivity analysis is performed. Such analysis tests the suitability of the model (e.g., Phillips, 1982). Thus, different scenarios should be suggested and the corresponding modifications to the value functions and/or weights should be made. If the model proves to be sensitive to small modifications, the decision-maker may want to reconsider those points to which the decision is sensitive.
The process ends with the prioritization and selection of options from a portfolio of possible options. This selection should optimize the benefit and respect the existing restrictions. Since there are limited resources in the decision context, it is natural that the decision-maker will be unable to carry out all the desired interventions; accordingly, a coherent process of prioritization should be followed to efficiently allocate the existing resources. To address this need, a multi-criteria analysis of the portfolio of possible interventions using the benefit/cost maximization principle was considered in this work (Phillips and Bana e Costa, 2007). This principle prioritizes projects according to the benefit/cost relationship, instead of only considering the benefit. As a result, efficient portfolios can be determined, guaranteeing a maximization of the benefit obtained by the available resources (Phillips and Bana e Costa, 2007).
MACBETH Approach
General Aspects
MACBETH is an approach that helps a decision-maker to quantify the attractiveness of different options based on qualitative judgments about differences of attractiveness (Bana e Costa and Chagas, 2004). This approach uses an iterative questioning procedure that involves pairwise comparisons. At each comparison, a qualitative preference judgment is requested to the decision-maker. The answers provided by the decision-maker are introduced into the MACBETH decision support system and its consistency is verified. When the preferences are not consistent, the decision-maker is notified and modifications are suggested. A numerical scale that is representative of the decision-makers judgments is generated and a similar process is followed to generate weighted scales for criteria. Additional details on the mathematical processes behind MACBETH can be found in Bana e Costa et al. (2005).
The MACBETH approach is applicable to additive value models, accordingly, it can be used to define value functions and to determine weights (Bana e Costa et al., 2012). Value functions and weights are an essential part of additive values models. In this context, value functions are necessary to evaluate the performance of the possible options in each criterion (partial evaluation), while weights transform partial scores into global scores (global evaluation).
In the following sections, it is described how to build an additive value model with MACBETH. This description assumes that the M-MACBETH software (Bana E Costa and Vansnick, 1999) is used to apply the MACBETH approach. Besides the implementation of the MACBETH approach, this software also has tools to perform different types of sensitivity analyses.
Performance Descriptors
The process begins with the definition of the performance descriptors in the M-MACBETH software. Performance descriptors are defined according to the decision maker's objectives and provide a way to operationalize them. A discrete or continuous set of performance levels (either quantitative or qualitative) is associated with these descriptors to measure to what degree the objective has been reached. A comprehensive discussion on how to build performance descriptors can be found in Bana e Costa and Beinat (2005).
Two reference levels should be defined for each descriptor, corresponding to a “neutral” and a “good” performance level (Bana e Costa and Chagas, 2004). Although it is not mandatory, the definition of these performance levels is important for the construction of quantitative interval scales because it provides an important reference for the decision-maker during the pairwise comparisons. A reduction of the frequency of inconsistencies will result from the definition of these performance levels.
Value Functions Definition
Using the MACBETH approach, it is possible to define value functions that measure the attractiveness of each performance level. These numeric functions result from qualitative judgments on the differences in attractiveness reported by the decision-maker.
To define the value functions, two performance levels—“neutral” and “good”—should be considered and used as anchors from the outset. An arbitrary value of 0 and 100, respectively, should be assigned to these two performance levels. For each criterion, the decision-maker evaluates the difference in attractiveness between pairs of performance levels according to the following qualitative judgments: “none,” “very weak,” “weak,” “moderate,” “strong,” “very strong,” “extreme.”
The following sequence should then be considered to compare the attractiveness of the different performance levels using the qualitative judgments mentioned before:
• Comparison between the “good” and the “neutral” performance level;
• Comparison between the most attractive performance level and the least attractive one, followed by the comparison between the second most attractive performance level and the least attractive performance level, and so on;
• Comparison between the most attractive performance level and all the other performance levels, in order of increasing attractiveness;
• Comparison between the most attractive performance level and the second most attractive one, followed by the comparison between the second most attractive performance level and the third, and so on;
• Comparison of the remaining performance levels.
During this process, the M-MACBETH software automatically verifies judgment consistency, pointing out all the detected inconsistencies and suggesting ways to solve it. Once the matrix of judgments is filled, M-MACBETH is able to create the value functions.
The value functions should be validated by the decision-maker. Consequently, all funct ions should be discussed and adjusted until they reflect the opinion of the decision-maker.
Weights Determination
Weights determination aims to define weights that can convert local evaluations (relative to each criterion) into global evaluations (relative to all criteria). Since additive value models are compensatory, weights play an essential role because they reflect the importance of one criterion relative to others.
The weights determination process is similar to that followed for the definition of value functions. To determine weights, the following sequence should be considered:
• Ask the decision-maker to organize the criteria in ascending order of attractiveness;
• Since all the performance scales had “good” and “neutral” performance levels, ask the decision-maker how he would qualify, in terms of attractiveness, an option that would improve the performance level of a criterion from “neutral” to “good.” This question is repeated for all the criteria. The possible answers are: “very weak,” “weak,” “moderate,” “strong,” and “very strong”;
• Doing a pairwise comparison between the different criteria, the decision-maker has to qualify the degree of attractiveness of each performance level improvement from “neutral” to “good.” This means that the decision-maker needs to classify, in a qualitative way, how an improvement of Criteria A from “neutral” performance level to “good” compares with an improvement of Criteria B from the “neutral” performance level the “good” performance level. As before, these questions are repeated until all the criteria have been compared to each other. The possible qualitative answers are: “very weak,” “weak,” “moderate,” “strong,” and “very strong.”
During the weights determination process, as in the value functions definition, judgments consistency is automatically verified. When judgments are inconsistent, the M-MACBETH software presents possible solutions.
In the end, the decision-maker should check and validate the obtained weights, to ensure that they reflect his opinion.
Case Study
General Aspects
This work follows a case-study design to demonstrate how the MACBETH approach can be used for pavement maintenance decision-making at the network level. The case-study refers to the definition of priorities for maintenance and rehabilitation interventions in pavements of the Portuguese road network, considering different criteria and budget constraints.
The decision-maker is an expert in Pavement Engineering with enough technical knowledge and experience to hold decision-making responsibilities regarding the interventions to be carried out on a national road network.
Considering the steps of the decision analysis process, the following sections detail the assessment of the decision maker's objectives, the modeling process using the MACBETH approach, and the prioritization and selection of maintenance and rehabilitation interventions.
Objectives Definition
The decision situation is described by a decision maker whose primary responsibility is to manage a road network so that it satisfies the needs of society. In the context of a decision analysis process, it is necessary to understand how the decision maker intends to do so. Thus, the first step is to understand the decision maker's objectives, by asking him to express his objectives assuming no economic and financial restrictions. The mentioned objectives are recorded. When necessary, additional questions are made to gather more information and to ensure that the objectives are essential, comprehensible, operational, succinct, concise and preferably independent (Franco and Montibeller, 2011).
The following list of objectives resulted from the interaction with the decision-maker:
• Improve roads that have more traffic–interest in ensuring an adequate condition on the roads with more traffic, to take into account the importance of roads in the life of people and businesses;
• Ensure safe circulation of vehicles–interest in guaranteeing interventions in areas where there is a deficit of safety, according to established traffic safety parameters;
• Ensure adequate pavement condition–interest in fostering interventions where the functional and structural performance of the pavement is at risk, considering pavement condition from a technical perspective;
• Maintenance and rehabilitation interventions in an equitable way–interest in spreading interventions according to equity principles.
Performance Descriptors
Table 1 shows the performance descriptors defined for this study. The rationale behind each performance descriptor is given in the following sub-sections.
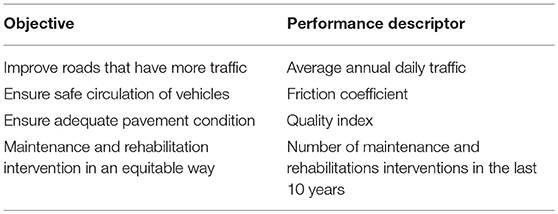
Table 1. Objectives and performance descriptors.
Average Annual Daily Traffic
In order to benefit the largest number of people, goods, and services, the decision-maker considered that it was important to have a criterion related to the actual use of the road, that is, a traffic-related criterion.
Thus, the Average Annual Daily Traffic (AADT) was used as a performance descriptor. The AADT is the total volume of vehicle traffic on a road for a year divided by 365 days. As suggested by the decision-maker, the performance levels of this descriptor were defined based on the specifications presented by the [Portuguese Road Administration (JAE), 1995]. Table 2 shows, in descending order of attractiveness, the different performance levels of the interventions.
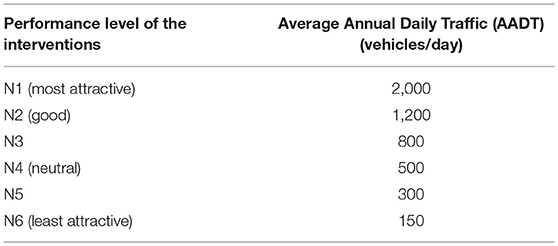
Table 2. Performance scale of the interventions relative to traffic.
The construction of quantitative interval scales requires the definition of two reference points to which values are assigned (Belton and Stewart, 2002). Since the MACBETH approach was used to construct the interval scale, the “good” and the “neutral” performance levels were used as a reference. It was considered by the decision maker that interventions in cases with AADT equal to 1200 were attractive (“good” performance level), whereas interventions in cases with AADT equal to 500 were considered neutral in terms of attractiveness (“neutral” performance level).
Friction Coefficient
The safe circulation of vehicles is related to the pavements capacity to provide a rolling surface that, at any time, guarantees an adequate tire/road interface (Hall et al., 2009). It is usual to consider the friction coefficient value (Henry, 2000) as a measure of how safe the circulation of vehicles on that road is as it translates to the skid resistance characteristics of the pavement. Inadequate skid resistance (low friction coefficient) may lead to higher accident rates (Pardillo Mayora and Jurado Piña, 2009). In this study, the performance levels are related to the attractiveness/need of intervention, so pavements with a lower friction coefficient are more attractive from the perspective of the intervention needed.
Considering this, the friction coefficient value–as measured by the Sideway-force Coefficient Routine Investigation Machine (SCRIM), which is commonly used by the Portuguese Road Administration (Marcelino et al., 2018)–was defined as the performance descriptor of the criterion referring to the safe circulation of vehicles. Lower values of the friction coefficient correspond to a lower skid resistance (unsafe pavements).The regulation defined by the Portuguese road authorities imposes minimal values for the friction coefficient. Thus, the decision-maker defined a performance scale based on this information. Following the procedure of the MACBETH approach, the decision-maker was asked to define a “good” performance level and a 'neutral' performance level. The decision-maker indicated that a pavement with a friction coefficient of 35 would be a pavement with a high degree of attractiveness (“good”). In turn, the decision-maker considered interventions in pavements with a friction coefficient of 45 (“neutral”) as indifferent.
The decision-maker was then invited to add any other performance levels that were plausible and necessary. Consequently, two other levels were included, corresponding to friction values of 20 and 50. Table 3 presents the resulting performance scale. The different performance levels are presented in descending order of attractiveness.
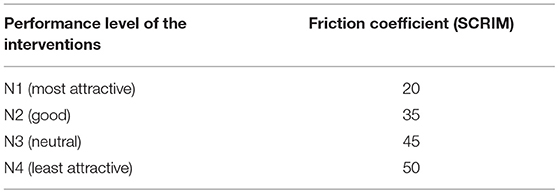
Table 3. Performance scale of the interventions relative to friction coefficient.
Quality Index
To ensure adequate pavement condition, it is necessary to take into account two aspects:
• Functional performance, which evaluates the pavement in terms of safety and ride comfort;
• Structural performance, which evaluates the capacity of the pavement to last over time, considering the expected loads and climate actions that it is subjected to.
In Portugal, the Quality Index (QI) is commonly used for the evaluation of pavement condition. This index is based on the work developed by Ferreira et al. (2011) and it combines a set of technical parameters, such as the International Roughness Index (IRI), rut depth, and cracking [Permanent International Association of Road Congresses (PIARC), 2016].
Since the decision-maker decided to use the QI as a descriptor of pavement condition. the performance levels were defined according to this index. It was defined that pavements in very bad condition would have value 0. Also, it was established that pavements in very good condition would have value 5. Table 4 presents the different performance levels in descending order of attractiveness.
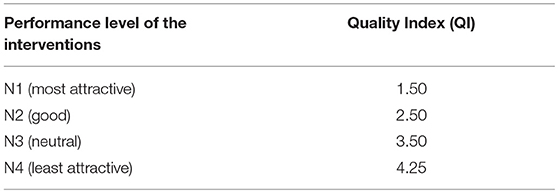
Table 4. Performance scale of the interventions relative to pavement condition.
Since the decision-maker intends to keep the network at least at reasonable levels (QI equal to or greater than 2.50) and preferably at good levels (QI higher than 3.50), it was considered that interventions on pavements with QI equal to 2.50 were attractive ('good' performance level), while interventions on pavements with QI equal to 3.50 were indifferent ('neutral' performance level).
Number of Maintenance and Rehabilitation Interventions in the Last 10 Years
Maintenance and rehabilitation interventions aim to restore or improve pavement condition. Since these interventions imply significant construction works, it is not desirable that roads are repaired repeatedly. Furthermore, in a national road network, an equal distribution of interventions over the network is expected to promote a feeling of social equity.
Considering this, the number of maintenance and rehabilitation interventions in the last 10 years was considered as a performance descriptor of the interventions. The length of time considered was chosen by the decision-maker.
The construction of the performance scales followed the same procedure as before. A “good” performance level was defined by the decision-maker for the pavements without any intervention (pavements on which interventions had never been performed were seen as attractive). In turn, pavements, where only one intervention occurred, were seen as “neutral” (pavements that had had one maintenance or rehabilitation intervention were seen as indifferent). When asked about the need for other performance levels, the decision-maker decided to add a performance level for the two interventions scenario. Table 5 shows the performance levels described in descending order of attractiveness.
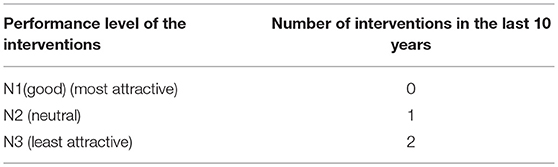
Table 5. Performance scale of the interventions relative to the number of interventions in the last 10 years.
Evaluation Model
The case study illustrates a decision analysis process that works for scenarios in which, due to budget limitations, only a set of maintenance and rehabilitation interventions can be performed. In this context, it is necessary to prioritize and select the interventions that should be done. From the set of selected interventions, the maximum benefit, in terms of the preferences of the decision-maker, should be derived.
In order to provide a practical demonstration of the approach proposed in this study, a portfolio of possible interventions in the road network was created through a simulation process. The simulation process was based on existing records and previous interventions made in the road network. Average network conditions were considered to allow the comparison of intervention options. Table 6 presents the portfolio of possible intervention options considered in this case study. For example, intervention “I01” refers to an intervention that costs 403 100€, takes places in the road identified as “01,” which has an AADT of 2 792 vehicles per day, a measured friction coefficient of 35 and a calculated quality index of 1.27. This road had no interventions in the last 10 years.
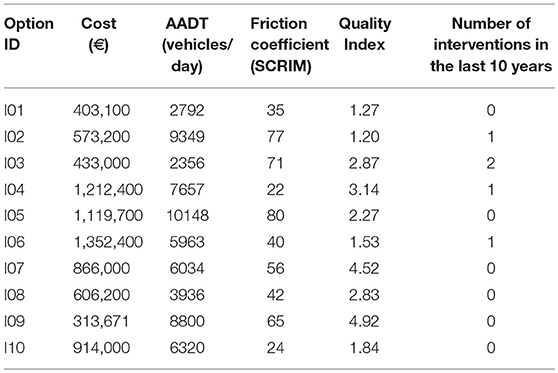
Table 6. Possible intervention options.
A simple additive value model was used to evaluate each intervention option. This model provides a measure for the global attractiveness/benefit of each possible intervention option, for further selection. Equation (1) defines the simple additive value model.
where,
V(a)- is the global score of option a;
λi - is the weight of criterion i;
vi(a)- is the partial score of option a in criterion i.
The MACBETH approach was used to build the value functions and to determine the weights, which corresponds to the computation of the variables vi(a) and λi, respectively.
Following the procedures described in sections Performance descriptors and Value functions definition, a total of four value functions and weights were determined (one per each criterion). An example of a resulting value function is provided in Figure 2. This value function refers to the friction coefficient. The figure shows a function that decreases with increasing friction coefficient values. This means that interventions in road sections with high friction coefficient values are less attractive then interventions in road sections with low friction coefficient values. Moreover, it can be seen that, for friction coefficient values higher than 45, the function has negative values. This means that interventions in road sections with such friction coefficient values are seen as undesired, reflecting that the decision-maker believes that no interventions are necessary when the friction coefficient is higher than 45. The analysis of the friction coefficient value functions shows how the MACBETH approach enables quantitative evaluations from qualitative judgments.
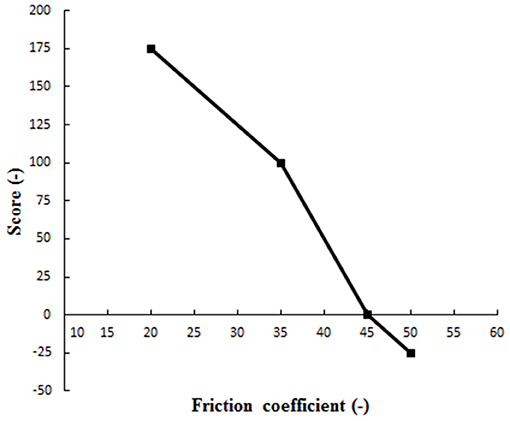
Figure 2. Friction coefficient value function.
Regarding weights, the resulting coefficients were: 0.33 (Quality Index), 0.33 (friction coefficient), 0.29 (Annual Average Daily Traffic), 0.05 (number of interventions in the last 10 years). In the MACBETH approach, the weight of a criterion reflects how important performance changes in that criterion are. Accordingly, since the weight of “Quality Index” and “friction coefficient” is higher than the weight of “Annual Average Daily Traffic” and “number of interventions in the last 10 years,” it can be said that the decision-maker values more interventions that improve road sections performance in pavement condition and safety, than in traffic and equity-related criteria. Once more, the MACBETH approach used the decision-makers value judgments to quantify its preferences. Such approach as the advantage of avoiding direct numerical evaluations of the weights, which are usually harder for the decision-maker to make.
A sensitivity analysis was performed at the end of the process; this analysis intended to verify the susceptibility of the model to changes in weights and the consequences of these changes. The sensitivity analysis was performed in an interactive way, taking advantage of the potential of the M-MACBETH software. Despite the analysis made, the decision-maker felt no need to make any changes.
Results
Evaluation of Interventions
Table 7 shows the results obtained from the application of the developed additive value model. The results show that considering the criteria and preferences of the decision-maker, the three most attractive interventions are I10, I04, and I02. These three interventions have the highest benefit values, which means that they are the interventions perceived as more valuable. For example, intervention I10 corresponds to a case where the road section has a low friction coefficient (24, as shown in Table 6) and it also has a low Quality Index value (1.84). As mentioned before, these are the two criteria with higher weight (0.33), meaning that interventions that lead to performance improvements in these criteria are highly appreciated by the decision-maker. Accordingly, I10 is an intervention that corresponds to what the decision-maker believes should be done to maintain the road network. As can be seen, the approach followed in this study was able to incorporate the objectives of the decision-maker and identify which interventions are most attractive.
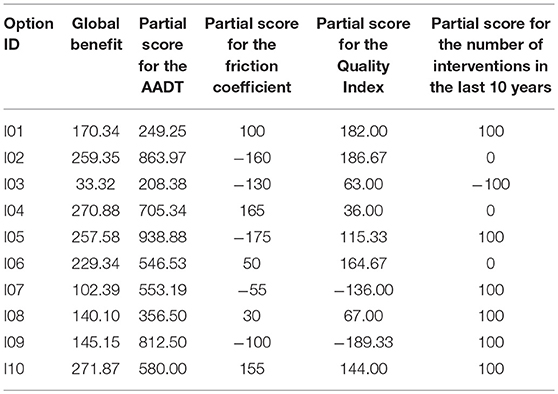
Table 7. Model results.
By contrast, the less attractive interventions are I08, I07, and I03. The benefit of these interventions is, in some cases, a half less than the benefit of interventions I10, I04, and I02. For example, the intervention I03 almost brings no benefit. From the data in Table 6, it is apparent that this intervention corresponds to a case in which: the friction coefficient is high (71); the Quality Index value is not high (2.87) but, when compared to the other Quality Index values, it is not one of the lowest; and the Average Annual Daily Traffic is the lowest one (2,356). Consequently, it is not surprising that intervention I03 has low benefit. It corresponds to an intervention where, according to the decision-maker criteria and compared to the other options, the road section is already performing well.
Prioritization of Interventions
The evaluation process allows for the assessment of the individual benefit resulting from each intervention, as shown in Figure 3. However, in a context with financial restrictions, it is probably not possible to implement all the interventions. Thus, the decision-maker needs to select a portfolio of interventions that, for the given financial restrictions, provides the best value for money. A prioritization and selection step that optimizes the benefit taking into account the existing restrictions should then be performed. In this study, two competing strategies were considered to do so: one that maximizes the benefit/cost relationship; and another that maximizes the benefit.
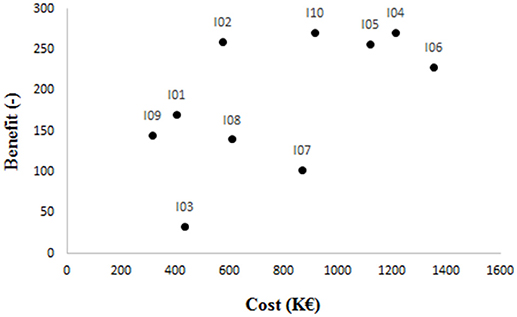
Figure 3. Evaluation of possible intervention options.
Figure 4 shows the cumulative benefit (y-axis) and the cumulative cost (x-axis) for the mentioned strategies. Each point in Figure 4 represents an intervention option that was selected by the respective strategy. This selection is sequential and cumulative. As the interventions are selected, their benefit and cost are added to the benefit and cost resulting from the interventions previously selected. The strategy that maximizes the benefit/cost relationship selects the interventions with the highest benefit/cost value first, while the strategy that maximizes the benefit gives priority to the interventions with the highest benefit value. Finally, each selection strategy is evaluated according to its (accumulated) benefit and cost values.
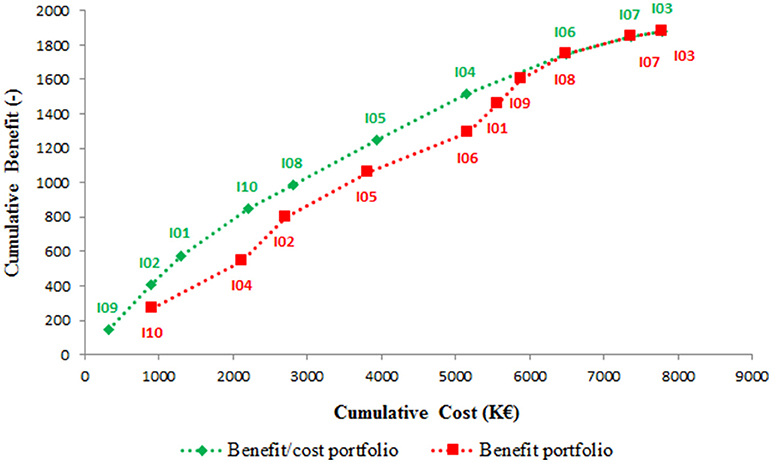
Figure 4. Prioritization of the intervention projects.
As can be seen, the line corresponding to the benefit/cost strategy is always above the line that corresponds to the maximum benefit strategy. This means that whatever the amount of investment might be, it is always preferable to follow the benefit/cost strategy because interventions selected by this strategy optimize the cumulative benefit to the road network. For example, if the budget is restricted to 4,000,000 €, the benefit/cost strategy would prioritize interventions in the following way: I09, I02, I01, I10, I08, and I05. This would result in a cumulative benefit of around 1200. By contrast, the maximum benefit strategy would sequentially select I10, I04, I02, and I05, for a cumulative benefit lower than 1,000. Thus, for the same budget, the benefit/cost strategy provides a higher benefit. This result shows that the process described in this work can help road agencies and its decision-makers to select and prioritize interventions at the network-level so that their objectives are preserved and the best of use of the available resources is made.
Conclusions
The maintenance management of road infrastructures at the network level is a multi criteria decision problem. As a complex decision problem, a structured approach is needed to take into account the diverse criteria that matter to the decision process.
A case-study design was followed to show the application of the MACBETH approach on pavement maintenance decision-making at the network level. Four performance descriptors—including aspects such as traffic, safety, pavement condition, and social equity—were defined to operationalize the objectives of the decision-maker. The MACBETH approach was used to build value functions and to determine weights. An additive value model was defined to evaluate a set of possible maintenance and rehabilitation interventions, and an optimization process was followed to select and prioritize these interventions according to economic and financial restrictions.
This study demonstrates that the MACBETH approach is a useful tool for decision-making processes on pavement maintenance at network-level. Through a structured process, the decision-maker was able to understand and organize a complex problem. The process provides a way to evaluate the attractiveness of a set of possible maintenance and rehabilitation interventions by considering the decision-maker criteria and value judgments. This ensures that the preferences of the decision-maker can be justified in contexts where intervention projects are proposed by different people and departments.
The results of this study also reveal that an optimal prioritization of the possible interventions is guaranteed by the process described. In particular, it was found that the prioritization of interventions according to the maximization of the benefit/cost relationship results in greater benefit than the prioritization according only to the benefit. Taken together, the findings of this study support the application of the MACBETH approach in pavement maintenance decision-making.
Decisions at the project-level are not discussed in this study. It was assumed that possible interventions, its associated costs, and the corresponding road section characteristics, would be available from prior analysis. Accordingly, the process described in this work is limited to network-level decisions, in which project-level inputs are provided.
Further research might explore the application of the MACBETH approach to larger decision problems. This may include project-level decisions or the development of multi criteria decision analysis models for pavement maintenance problems with more intervention options and additional criteria. Moreover, due to the complexity of pavement maintenance decision-making, it would also be interesting to study a fuzzy extension of the MACBETH approach.
Author Contributions
PM: full research paper; MA and EF: pavement maintenance expertise; MG: multi criteria decision analysis expertise.
Funding
This work was supported by Fundação para a Ciência e a Tecnologia (FCT) [grant number SFRH/BD/129907/2017].
Conflict of Interest Statement
The authors declare that the research was conducted in the absence of any commercial or financial relationships that could be construed as a potential conflict of interest.
References
Bana e Costa, C. A., and Beinat, E. (2005). Model-Structuring in Public Decision-Aiding. Available online at: http://eprints.lse.ac.uk/22716/1/05079.pdf
Bana e Costa, C. A., and Chagas, M. P. (2004). A career choice problem: an example of how to use MACBETH to build a quantitative value model based on qualitative value judgments. Eur. J. Oper. Res. 153, 323–331. doi: 10.1016/S0377-2217(03)00155-3
Bana e Costa, C. A., Corte, J. M., and Vansnick, J. C. (2005). “On the mathematical foundations of MACBETH,” in Multiple Criteria Decision Analysis: State-of-the-art Surveys, eds J. Figueira, S. Greco and M. Ehrgott (New York, NY: Springer), 409–442.
Bana e Costa, C. A., Corte, J. M., and Vansnick, J. C. (2012). MACBETH. Int. J. Inf. Tech. Decis. 11, 359–387. doi: 10.1142/S0219622012400068
Bana e Costa, C. A., Lourenço, J. C., Chagas, M. P., and Bana e Costa, J. C. (2008). Development of reusable bid evaluation models for the Portuguese electric transmission company. Decis. Anal. 5, 22–42. doi: 10.1287/deca.1080.0104
Bana E Costa, C. A., and Vansnick, J. C. (1999). “The MACBETH approach: Basic ideas, software, and an application,” in Advances in Decision Analysis. Mathematical Modelling: Theory and Applications, Vol. 4, eds N. Meskens and M. Roubens (Dordrecht: Springer), 131–157.
Bana e Costa, C. A., and Vansnick, J. C. (2008). A critical analysis of the eigenvalue method used to derive priorities in AHP. Eur. J. Oper. Res. 187, 1422–1428. doi: 10.1016/j.ejor.2006.09.022
Belton, V., and Stewart, J. (2002). Multiple Criteria Decision Analysis: An Integrated Approach. Dordrecht: Springer Science + Business Media Dordrecht.
Clemen, R. T., and Reilly, T. (2001). Making Hard Decisions with DecisionTools. Mason, IA: Duxbury Thomson Learning.
Deluka-Tibljaš, A., Karleuša, B., and Dragičević, N. (2013). Review of multi criteria-analysis methods application in decision making about transport infrastructure. Gradevinar 65, 619–631.
Farhan, J., and Fwa, T. F. (2009). Pavement maintenance prioritization using analytic hierarchy process. Transp. Res. Rec. 2093, 12–24. doi: 10.3141/2093-02
Ferreira, A., Picado-Santos, L., Wu, Z., and Flintsch, G. (2011). Selection of pavement performance models for use in the Portuguese PMS. Int. J. Pavement Eng. 12, 87–97. doi: 10.1080/10298436.2010.506538
Franco, L. A., and Montibeller, G. (2011). Problem structuring for multicriteria decision analysis interventions. Wiley Encyclopedia Operat. Res. Manage. Sci. doi: 10.1002/9780470400531.eorms0683
Hall, J. W., Smith, K. L., Titus-Glover, L., Wambold, J. C., Yager, T. J., and Rado, Z. (2009). Guide for Pavement Friction. Available online at: http://citeseerx.ist.psu.edu/viewdoc/download?doi=10.1.1.464.9481&rep=rep1&type=pdf
Hammond, J. S., Keeney, R. L., and Raiffa, H. (1999). Smart Choices: A Practical Guide to Making Better Decisions. Cambridge: Harvard Business School Press.
Henry, J. J. (2000). Evaluation of Pavement Friction Characteristics. Available online at: http://onlinepubs.trb.org/onlinepubs/nchrp/nchrp_syn_291.pdf
Labi, S., and Sinha, K. C. (2005). Life-cycle evaluation of flexible pavement preventive maintenance. J. Trans. Eng. 131, 744–751. doi: 10.1061/(ASCE)0733-947X(2005)131:10(744)
Li, H., Ni, F., Dong, Q., and Zhu, Y. (2018). Application of analytic hierarchy process in network level pavement maintenance decision-making. Int. J. Pavement Res. Technol. 11, 345–354. doi: 10.1016/j.ijprt.2017.09.015
Marcelino, P., Antunes, M. L., and Fortunato, E. (2018). Comprehensive performance indicators for road pavement condition assessment. Struct. Infrastruct. Eng. 14, 1433–1445. doi: 10.1080/15732479.2018.1446179
Pardillo Mayora, J. M., and Jurado Piña, R. (2009). An assessment of the skid resistance effect on traffic safety under wet-pavement conditions. Accid. Anal. Prev. 41, 881–886. doi: 10.1016/j.aap.2009.05.004
Pérez, J., Jimeno, J. L., and Mokotoff, E. (2006). Another potential shortcoming of AHP. Top 14, 99–111. doi: 10.1007/BF02579004
Permanent International Association of Road Congresses (PIARC) (2016). State of the Art in Monitoring Road Condition and Road/Vehicle Interaction. Report 2016R17EN, Paris.
Phillips, L. D. (1982). Requisite decision modelling: a case study. J. Oper. Res. Soc. 33, 303–311. doi: 10.1057/jors.1982.71
Phillips, L. D., and Bana e Costa, C. A. (2007). Transparent prioritisation, budgeting and resource allocation with multi-criteria decision analysis and decision conferencing. Ann. Oper. Res. 154, 51–68. doi: 10.1007/s10479-007-0183-3
Portuguese Road Administration (JAE) (1995). Manual de Concepção de Pavimentos para a Rede Rodoviária Nacional. Lisbon: Estradas de Portugal.
Smith, J. T., and Tighe, S. L. (2006). Analytic hierarchy process as a tool for infrastructure management. Transp. Res. Rec. 1974, 2–9. doi: 10.1177/0361198106197400101
Keywords: multi criteria decision analysis, MACBETH, prioritization algorithm, road & highways, maintenance & rehabilitation, decision-making, pavement management system (PMS)
Citation: Marcelino P, Antunes MdL, Fortunato E and Gomes MC (2019) Development of a Multi Criteria Decision Analysis Model for Pavement Maintenance at the Network Level: Application of the MACBETH Approach. Front. Built Environ. 5:6. doi: 10.3389/fbuil.2019.00006
Received: 16 November 2018; Accepted: 11 January 2019;
Published: 24 January 2019.
Edited by:
Sanjay Shrawan Nimbalkar, University of Technology Sydney, AustraliaReviewed by:
Prabir K. Kolay, Southern Illinois University Carbondale, United StatesRasa Ušpalyte-Vitkuniene, Vilnius Gediminas Technical University, Lithuania
Copyright © 2019 Marcelino, Antunes, Fortunato and Gomes. This is an open-access article distributed under the terms of the Creative Commons Attribution License (CC BY). The use, distribution or reproduction in other forums is permitted, provided the original author(s) and the copyright owner(s) are credited and that the original publication in this journal is cited, in accordance with accepted academic practice. No use, distribution or reproduction is permitted which does not comply with these terms.
*Correspondence: Pedro Marcelino, pmarcelino@lnec.pt