Damage Probability Matrices and Empirical Fragility Curves From Damage Data on Masonry Buildings After Sarpol-e-zahab and Bam Earthquakes of Iran
 Mahnoosh Biglari
 Antonio Formisano
- 1Civil Engineering Department, Faculty of Engineering, Razi University, Kermanshah, Iran
- 2Department of Structures for Engineering and Architecture, School of Polytechnic and Basic Sciences, University of Naples Federico II, Naples, Italy
The weakness of tensile strength and high weight in masonry structures under the dynamic loads of earthquakes has always led to structural damage, financial losses, injuries, and deaths. In spite of cheap and affordable masonry materials, their use has been very limited in constructions over the past three decades. However, common masonry materials are still found in monumental and historical structures, deteriorated texture, and rural buildings. Identifying the seismic behavior and the probability of the structural damage is vital for pre-earthquake seismic risk reduction of urban areas and the rapid post-earthquake assessment. The earthquake event that occurred in Ezgeleh on 2017 November 12 with Mw = 7.3 triggered the greatest damage in Sarpol-e-zahab city at a distance of about 37 km from the epicenter. Post-earthquake reconnaissance, microtremor analysis, and rapid visual inventory of structural damages in different zones were performed by research teams. In the present study, the strong ground motion and the peak ground acceleration, and its corresponding intensity distribution, which are based on the site response analysis in different parts of the city, are introduced. Afterward, damage probability matrices of different types of masonry buildings, namely unreinforced masonry and confined masonry buildings, are determined for both bins of peak ground accelerations and intensities. Finally, the fragility curves of two types of masonry structures are extracted based on the RISK-UE level 1 (LM1) method by assuming a beta distribution to estimate the probability distribution function of the damage. These curves are useful in assessing pre-earthquake possible damages in masonry structures with similar construction methods and similar materials to reduce seismic risks.
Introduction
Masonry structures have been used extensively for many years due to easy access to primary materials such as soils and rocks, energy saving, and low construction cost in different parts of the desert and mountainous regions of Iran. The weak tensile strength and high weight of masonry structures have always led to structural damage, financial losses, injuries, and deaths in large earthquakes, such as the 1962 Buin-zahra earthquake (Mw = 7.1 with 12,225 deaths) (United States Geological Survey, 2009), the 1978 Tabas earthquake (Mw = 7.4 with 15,000–25,000 deaths) (Ambraseys et al., 2005), the 1990 Manjil–Rudbar earthquake (Mw = 7.4 with 40,000 deaths) (Berberian et al., 1992), the 2003 Bam earthquake (Mw = 6.6 with 40,000 deaths) (Khatam, 2006), and recently, the 2017 Sarpol-e-zahab earthquake (Mw = 7.3 with 620 deaths). Over the past three decades, cheap and affordable masonry materials had limited use in constructions designed according to the Iranian standard seismic code (standard No. 2800). However, common masonry materials are still found in monumental and historical structures, deteriorated textures, and rural buildings. Two types of masonry buildings are mostly found in Iran: (i) unreinforced masonry buildings (URM) without vertical and/or horizontal ties and (ii) confined masonry (CM) buildings with both vertical and horizontal ties, which are basically made of brick walls with jack arch slab consisting of shallow brick arches spanning between steel floor beams. Ties are made of steel or reinforced concrete profiles, which lay on walls as horizontal elements or are placed either at the wall junctions or around door and windows as vertical elements. Post-earthquake survey data have shown that, if the confinement elements (vertical ties, horizontal ties, and floors) of CM structures are well-connected, they can effectively prevent the collapse of masonry walls. Hence, the confinement elements can reduce the earthquake vulnerability of masonry structures.
Identifying the seismic behavior and the probability of the structural damage is vital for pre-earthquake seismic risk reduction of urban areas and the rapid post-earthquake assessment for formulating and evaluating the economic impact of earthquakes. Fragility curves can help to formulate earthquake vulnerability of buildings in terms of different damage levels, from the no-damage level to destruction. It identifies the boundary of each damage level for any type of structures by the lognormal or beta distribution of the damage. Indeed, both empirical and theoretical fragility curves are well-suited for assessing earthquake damages on single buildings or whole cities. Calvi et al. (2006) have reviewed seismic vulnerability assessment methodologies in three classes: (i) empirical/direct methods, which need to determine damage probability matrices (DPMs) (Whitman et al., 1973; Braga et al., 1982; Corsanego and Petrini, 1990; Cardona and Yamin, 1997; Fah et al., 2001; Veneziano et al., 2002; Dolce et al., 2003; Di Pasquale et al., 2005; Del Gaudio et al., 2016; Chieffo and Formisano, 2019a,b; Chieffo et al., 2019a) and their corresponding vulnerability functions (Benedetti and Petrini, 1984; JBDPA, 1990; GNDT, 1993, 2000; Grünthal, 1998; Sabetta et al., 1998; Faccioli et al., 1999; Giovinazzi and Lagomarsino, 2001; Ozdemir et al., 2005; Formisano, 2017; Formisano et al., 2017; Chieffo et al., 2019b; Mosoarca et al., 2019); (ii) analytical/mechanical methods, which tend to feature more detailed and transparent vulnerability assessment algorithms with direct physical meaning; several researchers have been involved in developing methods for deriving analytical fragility curves (Park and Ang, 1985; Singhal and Kiremidjian, 1996; Kircher et al., 1997; Calvi, 1999; National Institute of Building Science (NIBS), 1999; Fajfar, 2000; Pinho et al., 2002; Antoniou and Pinho, 2004; Crowley et al., 2004, 2006; Ramos and Lourenço, 2004; Restrepo-Vélez and Magenes, 2004; Cosenza et al., 2005; Giovinazzi, 2005; Modena et al., 2005; Rossetto and Elnashai, 2005; Wen and Ellingwood, 2005; Pagni and Lowes, 2006; Asteris, 2008; Lagaros, 2008; D'Ayala et al., 2010; Milani and Venturini, 2011; Cattari and Lagomarsino, 2012; Kazantzi et al., 2015; Asteris et al., 2019); and (iii) hybrid methods, which combine post-earthquake damage statistics with simulated damage analyses from a mathematical model of building typologies under consideration. Both the empirical and analytical methods can be used in hybrid methods. Benedetti et al. (1988), Kappos et al. (1995), Barbat et al. (1996), Cherubini et al. (2000), Pagnini et al. (2011), Formisano et al. (2011), and Formisano et al. (2015) presented some of the applications of the hybrid method.
Despite the large damages caused by previous catastrophic earthquakes in Iran, the only seismic damage data detected were those related to the 1990 Manjil–Rudbar and 2003 Bam earthquakes. The earthquake disaster survey data after the 1990 Manjil–Rudbar earthquake are very limited, being only used to assess the vulnerability of URM masonry buildings. Meanwhile, considerably more extensive data exist for the 2003 Bam earthquake (Hisada et al., 2004; Mostafaei and Kabeyasawa, 2004). In the survey performed by Hisada et al. (2004), damages to 839 buildings around Bam City were investigated, and seismic intensities using the 1998 European Macroseismic Scale (EMS-98) (Grünthal, 1998) were estimated. They classified damages of buildings into five grades and building types in six classes, namely, adobe, simple masonry, masonry with steel frame, masonry with RC frame, steel frame, and RC frame. From these data, 440 buildings belong to simple masonry, 177 buildings belong to masonry with steel frame, and 20 buildings belong to masonry with RC frame classes. Furthermore, a limited number of studies have been published related to the development of vulnerability functions for Iranian buildings. The studies conducted by JICA (2000), Mansouri et al. (2010), Omidvar et al. (2012), and Azizi et al. (2016) reflect different methods in mapping damages to Iranian buildings.
On 2017 November 12th at 21:48 (local time), an earthquake with Mw = 7.3 occurred on Ezgeleh, Salas-e babajani county, Kermanshah province of Iran, and triggered the greatest damage in Sarpol-e-zahab city at a distance of about 37 km from the epicenter. Post-earthquake reconnaissance, microtremor analysis, and rapid visual inventory of structural damages in different zones were performed by collaborative research teams of Razi University and the International Institute of Earthquake Engineering and Seismology (IIEES) (Haghshenas et al., 2018; Hashemi et al., 2018). In this study, the strong ground motion and the peak ground acceleration (PGA) and its corresponding intensity distribution, which are based on the ground motion prediction equations (GMPEs) and site response analysis in different parts of the affected areas of Kermanshah province, as well as Sarpol-e-zahab city, are illustrated. Afterward, the damage probability matrices of different types of masonry buildings (URM and CM) are determined for both bins of PGAs and intensities. Finally, the fragility curves of investigated masonry structures, which are based on the RISK-UE level 1 (LM1) method (Milutinovic and Trendafiloski, 2003) by assuming a beta distribution to estimate the damage probability distribution function, are extracted.
Strong Ground Motion and Peak Ground Acceleration
According to the Iranian Seismological Center (IRSC), the earthquake epicenter had coordinates of 34.77°N and 45.76°E, while the focal depth was of about 18 km (Tatar et al., 2018). The closest residential area was the Ezgeleh one, with a population of 1,500 persons, which was located about 10 km northwest of the epicenter. Other cities affected by the earthquake were Tazeabad (about 15,000 inhabitants), placed at about 35 km east of the epicenter, and Sarpol-e-zahab (about 56,000 inhabitants), located at 37 km south of the epicenter. Sarpol-e-zahab was the most affected city, so that the earthquake was named the Sarpol-e-zahab seism. The concentration of the earthquake damages toward south of the epicenter was assigned to forward directivity effects of rupture mechanisms (Tatar et al., 2018). The event was attributed to a known fault zone named Mountain Front Fault (MFF) that extends almost north to south along the Iran–Iraq border with the strike direction of northwest to southeast. The focal mechanism of the event was thrust with a low dip angle of about 10° and some slip component.
The event was recorded by 97 Stations of Road, Housing, & Urban Development Research Center (BHRC). Thirty-two stations were available in the Kermanshah province, but, due to technical issues, the event was recorded only by 13 stations, namely SPZ (Sarpol-e-zahab city), KRD (Kerend city), ELA (Eslam-abad city), MHD (Mahidasht city), KRM1&2 (Kermanshah city), JAV (Javanroud city), RVN (Ravansar city), GRS (Gor-e-sefid), SUM (Sumar city), BIS (Bistoon city), KNG (Kangavar city), and SNI (Sahneh city).
PGAs are provided from ground motion shakemaps in two scales: (i) GMPEs-derived shakemap, which covers the whole earthquake shock-affected region presented by Firuzi et al. (2018), and (ii) site-specific response analysis-derived shakemap for Sarpol-e-zahab city (Memari, 2020).
Definition of Damage Classes and Damage Survey Data
The earthquake damage data collection at the rapid assessment level was led by IIEES after the earthquake (Kalantari et al., 2019). Surveys were done by house-to-house filling pre-prepared forms arranged according to the information provided by the EMS-98 European Macroseismic Scale (Grünthal, 1998). The data for masonry structures used in this research include GIS position, the number of stories, the presence of ties (wooden, concrete, or steel), and the percentage evaluation of structural and non-structural damages.
According to the EMS-98 (Grünthal, 1998) method, masonry buildings are classified into two typologies as follows:
• Unreinforced masonry (URM): Vulnerability class B, which is the second weakest type of structures made of manufactured bricks and cement mortar, without vertical and/or horizontal ties, without box behavior, and with jack arch slab.
• Confined masonry (CM): Vulnerability class C, which is a building made of manufactured bricks and cement mortar, with steel or reinforced concrete vertical and horizontal ties, which are well-connected to each other to provide box behavior, and with jack arch or reinforced concrete joists.
Building damages are classified into six grades according to the EMS-98 (Grünthal, 1998) classification as follows:
• Grade 0 (D0): No damage.
• Grade 1 (D1): Negligible to slight damages. Hairline cracks in very few walls. Fall of small pieces of plaster only. Fall of loose stones from the upper parts of buildings in very few cases.
• Grade 2 (D2): Moderate damages. Cracks in many walls. Fall of fairly large pieces of plaster. Partial collapse of chimneys.
• Grade 3 (D3): Substantial to heavy damages. Large and extensive cracks in most walls. Roof tiles detach. Chimneys fracture at the roof line. Failure of individual non-structural elements (partitions, gable walls).
• Grade 4 (D4): Very heavy damages. Serious failure of walls. Partial structural failure of roofs and floors.
• Grade 5 (D5): Destruction. Total or near total collapse.
The investigated buildings are 138 URM and 136 CM constructions. Figures 1a–e present sample photos from URM damaged structures with damage grades from 2 to 5, while Figures 1f–i present sample photos of CM damaged structures with damage grades from 1 to 4. Figures 2A,B report the frequency and cumulative percentage of the buildings as a function of the number of stories for URM and CM building classes, respectively. It is observed that all of the buildings have 1 to 3 stories, so they are categorized as low rise buildings.
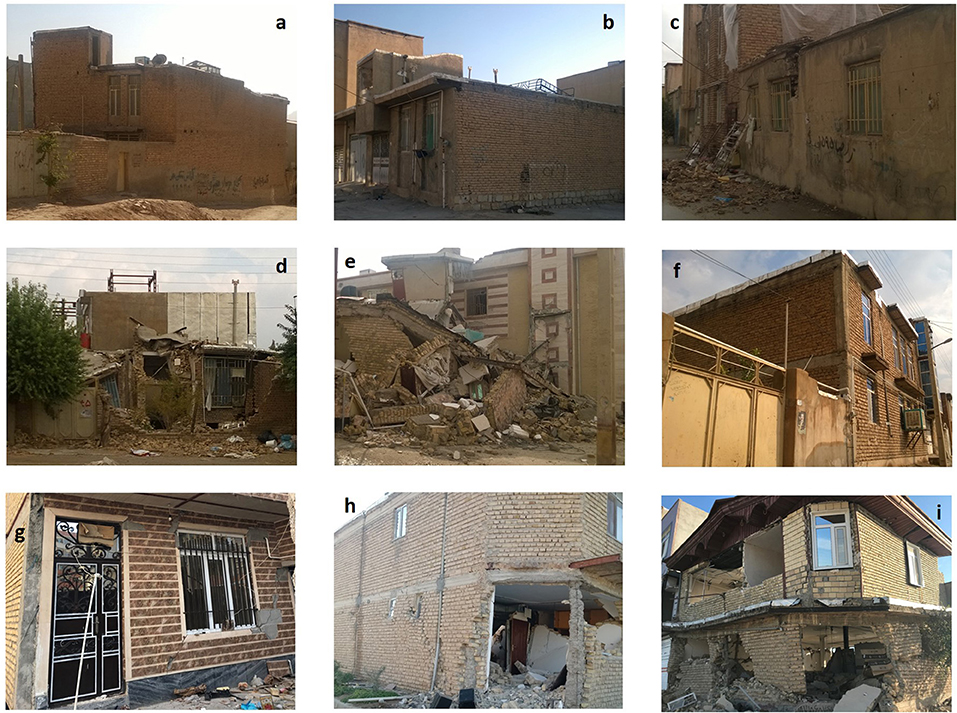
Figure 1. Damaged Sarpol-e-zahab masonry building samples (a) URM D1, (b) URM D2, (c) URM D3, (d) URM D4, (e) URM D5, (f) CM D1, (g) CM D2, (h) CM D3, and (i) CM D4 (original).
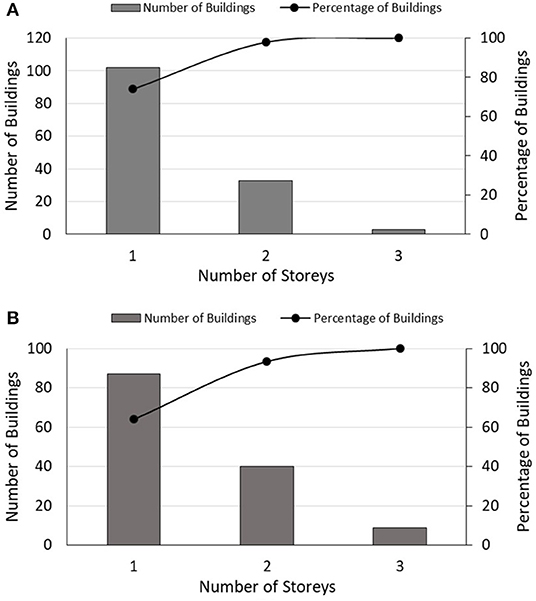
Figure 2. Frequency and cumulative percentage of the buildings as a function of the number of stories for (A) URM buildings and (B) CM buildings (original).
Figure 3 presents the cumulative percentage of each damage grade for both URM and CM buildings. For URM buildings, the most recurrent damage grade is D4 (23% of occurrence), whereas for CM buildings, the most repeated damage grade is D0 (30% of occurrence).
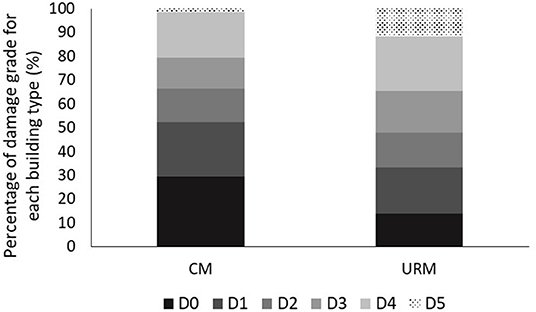
Figure 3. Cumulative percentage of URM and CM buildings as a function of damage level (D) (original).
Correlation of PGA With Intensity (I)
An analysis of PGA/intensity (I) correlations has been carried out using the Sarpol-e-zahab database for all masonry building data. It has been found that the semilogarithmic correlation equation between PGA (in cm/s2) and EMS-98 intensity (I) (Grünthal, 1998) best describes the trends of 274 gathered data. The database covers PGA from 50 to 900 cm/s2 gathered from shakemaps of affected zones during the Sarpol-e-zahab earthquake for each individual structure. The corresponding intensities are independently derived by adapting the damage grade of each building with EMS-98 (Grünthal, 1998) intensities. According to EMS-98 (Grünthal, 1998), Class B was assigned to the URM buildings and Class C was assigned to the CM buildings. Finally, for each individual structure, its PGA has been mapped vs. its corresponding intensity. The best fitted equation for all data is presented as follows:
where PGA is expressed in cm/s2 and I is expressed according to EMS-98 (Grünthal, 1998).
This new equation is used to determine corresponding intensities from PGAs. Figure 4 shows differences in the relationships proposed by Gutenberg and Richter (1942); Gutenberg and Richter (1956), Neumann (1954), Hershberger (1956), Medvedev and Sponheuer (1969), Ambraseys (1974), Trifunac and Brady (1975), Murphy and O'Brien (1977), Guagenti and Petrini (1989), and Margottini et al. (1992), and the proposed equation produced results that are similar to those provided by Trifunac and Brady (1975) and Margottini et al. (1992).
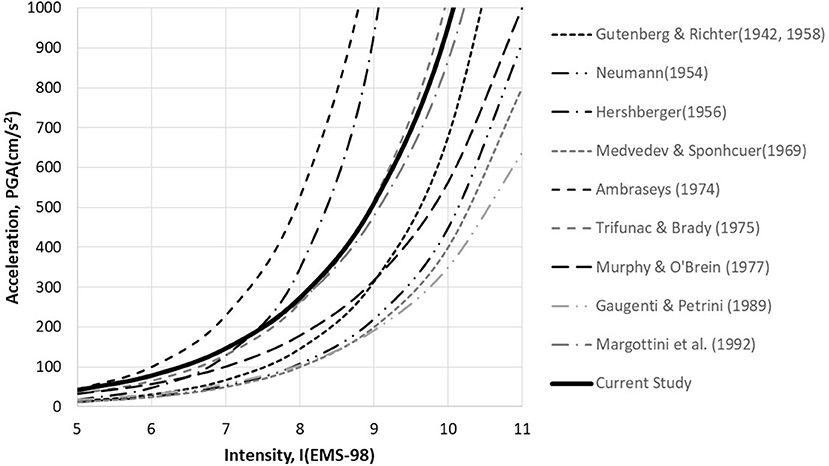
Figure 4. Relationships proposed for PGA/I (original).
Damage Probability Matrix and Vulnerability Index (VI)
The empirical fragility curves are based on damage probability matrixes (DPMs). According to Whitman et al. (1973), DPM is a matrix where each number expresses the probability that a building will experience a particular level of damage when exposed to a given intensity or ground shaking. Since these matrices are directly defined from post-earthquake survey data, they are directly related to the structural vulnerability at a specific hazard level. Based on earthquake shakemap data and survey of damaged buildings, DPMs are derived for both URM and CM building types, as shown in Table 1. Furthermore, the PGAs are converted into the corresponding intensities by Equation (1) and, consequently, the DPMs are presented in Table 2 for both URM and CM buildings.
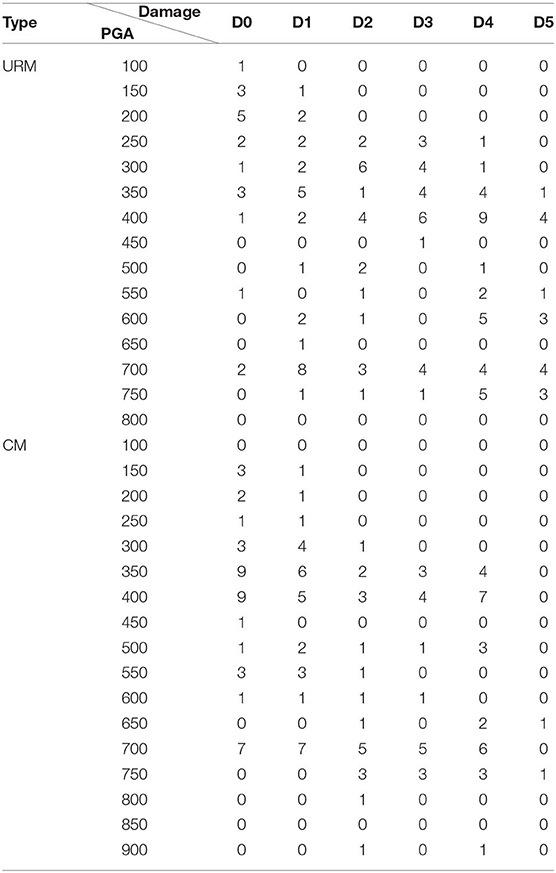
Table 1. Damage probability matrix for buildings hit by the Sarpol-e-zahab earthquake: damage level vs. PGA.
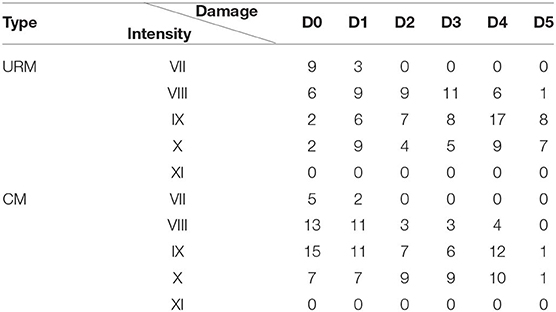
Table 2. Damage probability matrix for buildings hit by the Sarpol-e-zahab earthquake: damage level vs. Intensity (EMS-98).
A specific PGA or intensity should cause a different damage grade in each of the considered buildings because of their specific seismic behavior. Consider that the seismic damage grades that occurred to the buildings as provided by DPMs led to the definition of the mean damage grade (μD), which represents a continuous parameter accounting for the damage distribution to the building set. According to the RISK-UE LM1 method (Milutinovic and Trendafiloski, 2003), the mean damage ratio of URM and CM buildings can be calculated by the following equation:
where pk is the probability of experiencing in a set of buildings a damage grade equal to k.
The mean damage grades are calculated for each level of PGA or intensity of DPMs. The corresponding points are shown in Figures 5, 6 with rounded black solid markers. Figure 5 presents mean damage grades (μD) as a function of PGAs for URM and CM buildings. The best fitted power curve formulation between μD and PGA for each building type is shown on the chart, which is used for driving the fragility curve.
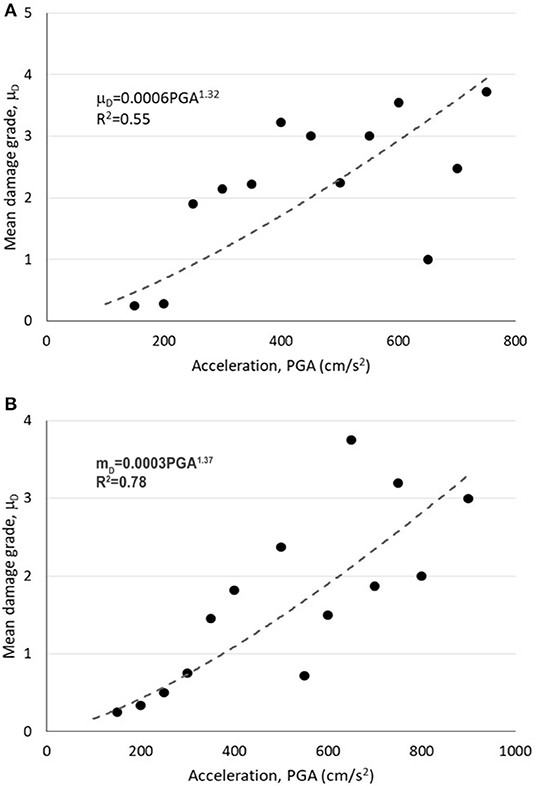
Figure 5. Mean damage grade as a function of peak ground acceleration for (A) URM and (B) CM buildings (original).
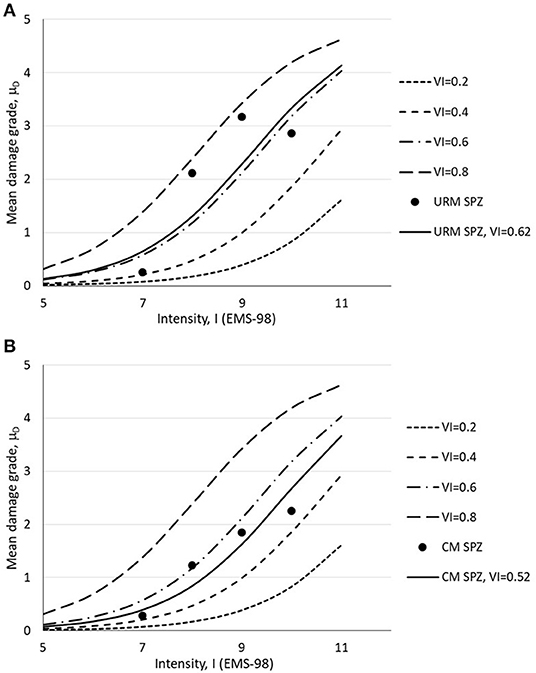
Figure 6. Mean damage grade as a function of intensity from damage survey detected for (A) URM buildings and (B) CM buildings under the Sarpol-e-zahab earthquake (original).
The vulnerability index is a score that quantifies the seismic behavior of building types. The vulnerability index ranges between 0 and 1, where, according to Milutinovic and Trendafiloski (2003), values close to 1 represent the most vulnerable buildings, while values close to 0 are representative of structures designed according to the most recent antiseismic standards. The RISK-UE (LM1) method (Milutinovic and Trendafiloski, 2003) defines a mean semi-empirical vulnerability function, which correlates the mean damage grade μD with both the EMS-98 intensity (I) and the vulnerability index VI as follows:
Figure 6 shows the mean damage grade as a function of intensity for URM and CM buildings. Furthermore, using Equation (3), vulnerability curves for a set of VI are derived. Lastly, the mean value offer VI for each type of buildings is derived, and the best fit vulnerability curve is plotted with a black solid line in Figure 6 for URM and CM buildings. The mean value of the vulnerability index of URM and CM buildings is equal to 0.62 and to 0.52, respectively. This clearly shows the highest vulnerability of the URM buildings compared to the CM ones.
Fragility Curves
The fragility curves give the probability of attaining damage grades as a function of each level of the seismic hazard parameter (PGA/I). According to the RISK-UE (LM1) method (Milutinovic and Trendafiloski, 2003), these curves can be defined from the beta distribution of the mean damage grade. Equations (4–7) presented by Milutinovic and Trendafiloski (2003) show adequate formulations for deriving the damage distribution using the beta distribution.
where , with a, b, t, and r the parameters of the distribution and x is the continuous variable, which varies between a and b.
The discrete beta density probability function is calculated from the probabilities associated to damage grades k and k+1 (k = 0, 1, 2, 3, 4, and 5) as follows:
The fragility curve defining the probability of reaching or exceeding certain damage grades is obtained directly from the cumulative probability beta distribution as follows:
Based on the described RISK-UE (LM1) methodology, two sets of fragility curves, one as a function of PGA (Figure 7) and the other as a function of EMS-98 intensity (Figure 8), are derived from the Sarpol-e-zahab damage survey for both URM and CM buildings.
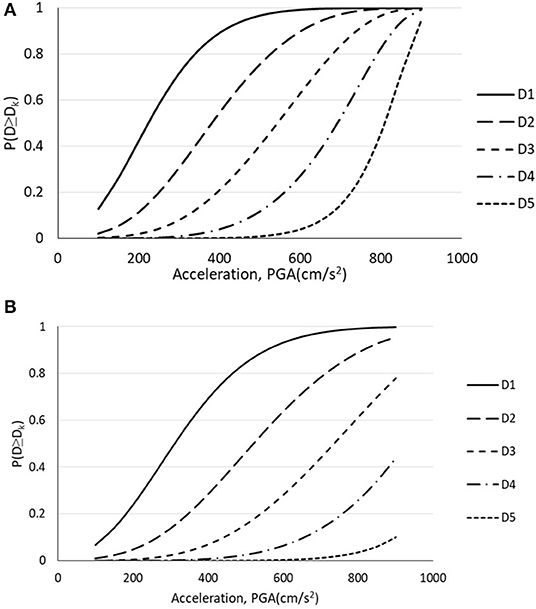
Figure 7. Fragility curves as a function of peak ground acceleration for (A) URM and (B) CM buildings surveyed after the Sarpol-e-zahab earthquake (original).
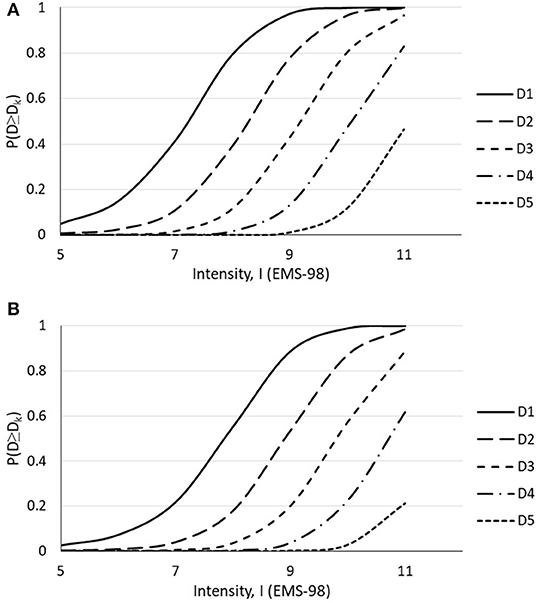
Figure 8. Fragility curves as a function of intensity for (A) URM and (B) CM buildings surveyed after the Sarpol-e-zahab earthquake (original).
DPM, VI, and Fragility Curves for URM and CM Buildings From Sarpol-e-zahab and Bam Earthquakes
Hisada et al. (2004) reported damage survey data for 440 URM buildings and 197 CM buildings subjected to the Bam earthquake. In this study, in addition to the fragility curves for URM and CM buildings under the Sarpol-e-zahab earthquake, mean vulnerability index values for URM and CM buildings under the Bam earthquake are derived from Hisada et al. (2004). The calculated mean vulnerability index values for URM and CM buildings under the Bam earthquake are equal to 0.67 and 0.58, respectively. These values are slightly greater than the corresponding values obtained for buildings under the Sarpol-e-zahab earthquake. This could be due to several reasons, including differences in construction methodology and base materials, as well as differences in the age of buildings. Experience of 1979 to 1987 Iran–Iraq war in the west part of Iran, including the Kermanshah province, led to the renovation of buildings after the war. Therefore, generally, the buildings in west cities are younger than the buildings with the same typology in central cities of Iran, like Bam.
Finally, to provide general vulnerability indexes and fragility curves for whole buildings affected by both Bam and Sarpol-e-zahab earthquakes, 578 URM and 333 CM buildings are studied. Table 3 presents the DPM for whole data as a function of EMS-98 intensity for URM and CM buildings. Consequently, mean damage grades of both building types are defined and plotted in Figure 9 for whole data. In this case, the mean vulnerability index is VI = 0.64 for URM buildings and VI = 0.54 for CM buildings. These values are between those achieved for buildings subjected to Sarpol-e-zahab and Bam earthquakes. Table 4 summarizes the vulnerability indexes derived from Sarpol-e-zahab and Bam earthquakes, as well as the whole data for URM and CM buildings.
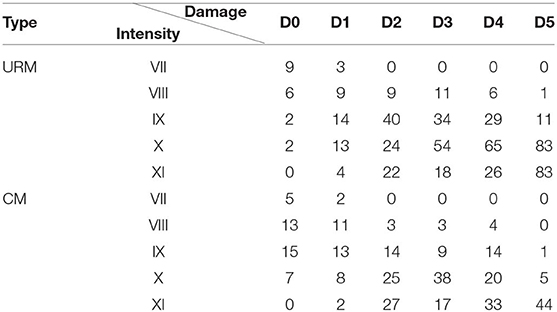
Table 3. Damage probability matrix surveyed after Sarpol-e-zahab and Bam earthquakes: damage level vs. Intensity (EMS-98).
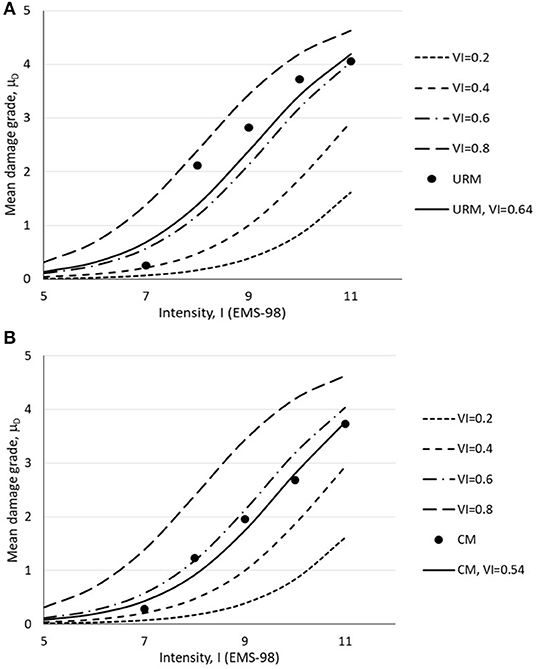
Figure 9. Mean damage grade as a function of intensity from damage survey detected for (A) URM buildings and (B) CM buildings under Sarpol-e-zahab and Bam earthquakes (original).
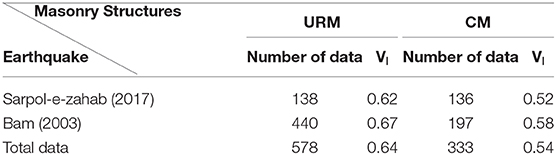
Table 4. Vulnerability indexes for Iranian masonry buildings.
Finally, fragility curves, which show the probability of the damage grade distribution as a function of the EMS-98 intensity, are presented in Figures 10, 11 for URM and CM constructions, respectively.
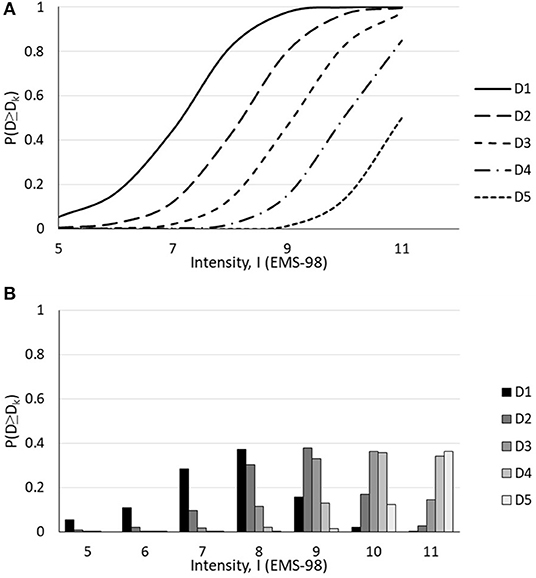
Figure 10. (A) Fragility curves and (B) damage distribution as a function of intensity for Sarpol-e-zahab and Bam URM buildings (original).
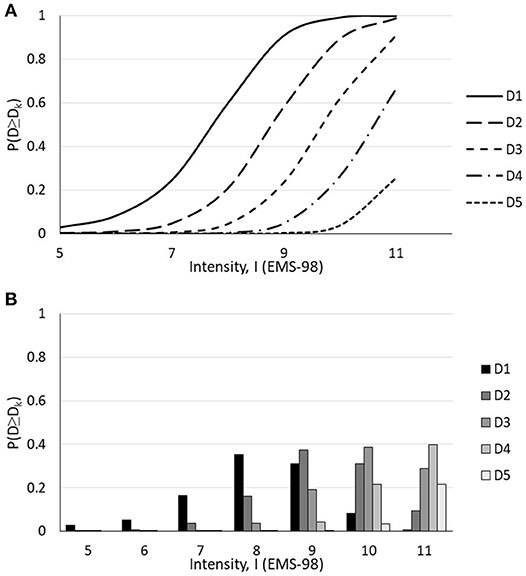
Figure 11. (A) Fragility curves and (B) damage distribution as a function of intensity for Sarpol-e-zahab and Bam CM buildings (original).
Conclusions
Assessment of hazard and vulnerability of structures is a key element prior to implementing risk reduction programs. Fragility curve is one of the essential parts of the vulnerability assessment. Empirical fragility curves that are adapted by the Iranian masonry buildings have been presented in this study of earthquake survey data gathered after the 2017 Sarpol-e-zahab Mw = 7.3 earthquake for 274 masonry buildings from the affected areas within the Kermanshah province. Masonry buildings have been categorized into two groups, namely unreinforced masonry (URM) constructions without vertical and/or horizontal ties and confined masonry (CM) constructions with ties. Damage probability matrices have been presented for Sarpol-e-zahab earthquake data as a function of PGA and EMS-98 intensity. Furthermore, the mean damage grade and vulnerability indexes have been derived for each damage level and affected masonry buildings of the Sarpol-e-zahab earthquake similar to the building types under the 2003 Bam earthquake. The vulnerability indexes of buildings hit by the Sarpol-e-zahab earthquake are very consonant with those of the buildings under the Bam earthquake. It is shown that in western Iran, masonry buildings are a little bit less vulnerable than those in central Iran, since the former is younger than the latter. Finally, the fragility curves and the damage distribution for masonry buildings both from the Sarpol-e-zahab database and the whole available trustworthy data of two Iranian earthquakes are presented. These curves are useful in forecasting possible earthquake damages in masonry structures with construction methods and materials similar to those herein examined. Therefore, the interpretation of these curves will allow to individuate the most vulnerable buildings so as to provide a guide toward retrofitting the intervention priority to reduce seismic risk.
Data Availability Statement
All datasets generated for this study are included in the article/supplementary material.
Author Contributions
MB analyzed the data and wrote the manuscript. AF provided critical feedback and helped shape the research, analysis, and manuscript. All authors discussed the results and contributed to the final manuscript.
Conflict of Interest
The authors declare that the research was conducted in the absence of any commercial or financial relationships that could be construed as a potential conflict of interest.
Acknowledgments
MB wishes to forward special thanks to Dr. Iman Ashayeri for his effective contribution in providing the shakemap of Sarpol-e-zahab city and Dr. Hashemi, Dr. Kalantari, and Mr. Farshchi for providing the damage data survey for buildings affected by the Sarpol-e-zahab earthquake.
References
Ambraseys, N. N. (1974). “The correlation of intensity with ground motion,” in Proceedings of the 14th Assembly. European Seismic Committee, Trieste, Vol. 1, 335–341.
Ambraseys, N. N., Melville, C. P., and Adams, R. D. (2005). The Seismicity of Egypt, Arabia and the Red Sea: A Historical Review. Cambridge University Press, 204.
Antoniou, S., and Pinho, R. (2004). Development and verification of a displacement-based adaptive pushover procedure. J. Earthq. Eng. 8, 643–661. doi: 10.1080/13632460409350504
Asteris, P. G. (2008). On the structural analysis and seismic protection of historical masonry structures. Open Construct. Build. Technol. J. Bentham Sci. Publish. 2, 124–133. doi: 10.2174/1874836800802010124
Asteris, P. G., Moropoulou, A., Skentou, A. D., Apostolopoulou, M., Mohebkhah, A., Cavaleri, L., et al. (2019). Stochastic vulnerability assessment of masonry structures: concepts, modeling and restoration aspects. Appl. Sci. 9:243. doi: 10.3390/app9020243
Azizi, H., Mendes, N., Lourenço, P. B., and Sadeghi, N. (2016). Empirical seismic vulnerability analysis for masonry buildings based on school buildings survey in Iran. Bull. Earthq. Eng. 14, 3195–3229. doi: 10.1007/s10518-016-9944-1
Barbat, A. H., Yépez Moya, F., and Canas, J. A. (1996). Damage scenarios simulation for seismic risk assessment in urban zones. Earthq. Spectra 12, 371–394. doi: 10.1193/1.1585889
Benedetti, D., Benzoni, G., and Parisi, M. A. (1988). Seismic vulnerability and risk evaluation for old urban nuclei. Earthq. Eng. Struct. Dyn. 16, 183–201. doi: 10.1002/eqe.4290160203
Benedetti, D., and Petrini, V. (1984). On the seismic vulnerability of masonry buildings: an evaluation method. L'Industria Costruzioni. 149, 66–74.
Berberian, M., Qorashi, M., Jackson, J. A., Priestley, K., and Wallace, T. (1992). The rudbar-tarom earthquake of 20 June 1990 in NW Persia: preliminary field and seismological observations, and its tectonic significance. Bull. Seismol. Soc. Am. 82, 1726–1755.
Braga, F., Dolce, M., and Liberatore, D. (1982). “A statistical study on damaged buildings and an ensuing review of the MSK-76 scale,” in Proceedings of the Seventh European Conference on Earthquake Engineering, (Athens), 431–450.
Calvi, G. M. (1999). A displacement-based approach for vulnerability evaluation of classes of buildings. J. Earthq. Eng. 3, 411–438. doi: 10.1080/13632469909350353
Calvi, G. M., Pinho, R., Magenes, G., Bommer, J. J., Restrepo-Vélez, L. F., and Crowley, H. (2006). Development of seismic vulnerability assessment methodologies over the past 30 years. J. Earthq. Technol. 472, 43, 75–104.
Cardona, O. D., and Yamin, L. E. (1997). Seismic microzonation and estimation of earthquake loss scenarios: integrated risk mitigation project of Bogotà, Colombia. Earthq. Spectra 13, 795–814. doi: 10.1193/1.1585981
Cattari, S., and Lagomarsino, S. (2012). “Performance-based approach to earthquake protection of masonry cultural heritage,” in Proceedings of the Structural Analysis of Historical Constructions, DWE, ed J. Jasien'ko (Wrocław: SAHC, 15–17.
Cherubini, A., Di Pasquale, G., Dolce, M., and Martinelli, A. (2000). “Vulnerability assessment from quick survey data in the historic centre of Catania,” in The Catania Project: Earthquake Damage Scenarios for High Risk Area in the Mediterranean, eds E. Faccioli and V. Pessina (Rome: CNR—National Group Against Earthquake), 213–225.
Chieffo, N., and Formisano, A. (2019a). Geo-hazard-based approach for the estimation of seismic vulnerability and damage scenarios of the old city of Senerchia (Avellino, Italy). Geosciences 9:59. doi: 10.3390/geosciences9020059
Chieffo, N., and Formisano, A. (2019b). The influence of geo-hazard effects on the physical vulnerability assessment of the built heritage: an application in a district of Naples. Buildings 9:26. doi: 10.3390/buildings9010026
Chieffo, N., Formisano, A., and Miguel Ferreira, T. (2019a). Damage scenario-based approach and retrofitting strategies for seismic risk mitigation: an application to the historical centre of Sant'Antimo (Italy). Eur. J. Environ. Civil Eng. 1–20. doi: 10.1080/19648189.2019.1596164
Chieffo, N., Mosoarca, M., Formisano, A., and Apostol, I. (2019b). Seismic vulnerability assessment and loss estimation of an urban district of Timisoara. IOP Confer. Ser. Mater. Sci. Eng. 471:102070. doi: 10.1088/1757-899X/471/10/102070
Corsanego, A., and Petrini, V. (1990). “Seismic vulnerability of buildings—work,” in Progress, Proceedings of the Workshop II on Seismic Risk Vulnerability and Risk Assessment (Trieste), 577–598.
Cosenza, E., Manfredi, G., Polese, M., and Verderame, G. M. (2005). A multi-level approach to the capacity assessment of existing RC buildings. J. Earthq. Eng. 9, 1–22. doi: 10.1080/13632460509350531
Crowley, H., Pinho, R., and Bommer, J. J. (2004). A probabilistic displacement-based vulnerability assessment procedure for earthquake loss estimation. Bull. Earthq. Eng. 2, 173–219. doi: 10.1007/s10518-004-2290-8
Crowley, H., Pinho, R., Bommer, J. J., and Bird, J. F. (2006). Development of a Displacement-Based Method for Earthquake Loss Assessment, Report 2006/01. Pavia: European School for Advanced Studies in Reduction of Seismic Risk (ROSE School).
D'Ayala, D. F., Jaiswal, K. S., Wald, D. J., Porter, K., and Greene, M. (2010). “Collaborative effort to estimate collapse fragility for buildings worldwide, the WHE-PAGER project,” in Proceedings of the 9th US National and 10th Canadian Conference on Earthquake Engineering, Including Papers from the 4th International Tsunami Symposium (Toronto, ON), 25–29.
Del Gaudio, C., De Martino, G., Di Ludovico, M., Manfredi, G., Prota, A., Ricci, P., et al. (2016). Empirical fragility curves from damage data on RC buildings after the 2009 L'Aquila earthquake. Bull. Earthq. Eng. 15, 1425–1450. doi: 10.1007/s10518-016-0026-1
Di Pasquale, G., Orsini, G., and Romeo, R. W. (2005). New developments in seismic risk assessment in Italy. Bull. Earthq. Eng. 3, 101–128. doi: 10.1007/s10518-005-0202-1
Dolce, M., Masi, A., Marino, M., and Vona, M. (2003). Earthquake damage scenarios of the building stock of potenza (Southern Italy) including site effects. Bull. Earthq. Eng. 1, 115–140. doi: 10.1023/A:1024809511362
Faccioli, E., Pessina, V., Calvi, G. M., and Borzi, B. (1999). A study on damage scenarios for residential buildings in Catania city. J. Seismol. 3, 327–343. doi: 10.1023/A:1009856129016
Fah, D., Kind, F., Lang, K., and Giardini, D. (2001). Earthquake scenarios for the city of Basel. Soil Dyn. Earthq. Eng. 21, 405–413. doi: 10.1016/S0267-7261(01)00023-9
Fajfar, P. (2000). A nonlinear analysis method for performance-based seismic design. Earthq. Spectra 16, 573–592. doi: 10.1193/1.1586128
Firuzi, E., Ansari, A., Rashidabadi, M., and Amini-Hosseini, K. (2018). Developing ground motion shaking map for sarpol-e zahab, Iran (2017) Earthquake. J. Seismol. Earthq. Eng. 20, 45–55.
Formisano, A. (2017). Local- and global-scale seismic analyses of historical masonry compounds in san pio delle camere (L'Aquila, Italy). Nat. Hazards. 86, 465–487. doi: 10.1007/s11069-016-2694-1
Formisano, A., Chieffo, N., and Mosoarca, M. (2017). Seismic vulnerability and damage speedy estimation of an urban sector within the municipality of San Potito Sannitico (Caserta, Italy). Open Civil Eng. J. 11, 1106–1121. doi: 10.2174/1874149501711011106
Formisano, A., Florio, G., Landolfo, R., and Mazzolani, F. M. (2011). “Numerical calibration of a simplified procedure for the seismic behaviour assessment of masonry building aggregates,” in Proceedings of the Thirteenth International Conference on Civil, Structural and Environmental Engineering Computing, eds B. H. V. Topping and Y. Tsompanakis (Crete: Civil-Comp Press).
Formisano, A., Florio, G., Landolfo, R., and Mazzolani, F. M. (2015). Numerical calibration of an easy method for seismic behaviour assessment on large scale of masonry building aggregates. Adv. Eng. Softw. 80, 116–138. doi: 10.1016/j.advengsoft.2014.09.013
Giovinazzi, S. (2005). The vulnerability assessment and the damage scenario in seismic risk analysis (Ph.D. thesis). Technical University Carolo-Wilhelmina at Braunschweig, Braunschweig, Germany and University of Florence, Florence, Italy.
Giovinazzi, S., and Lagomarsino, S. (2001). “Una metodologia per l'analisi di vulnerabilità sismica del costruito,” in Proceedings of the X Congresso Nazionale on L'Ingegneria Sismica in Italia (Potenza-Matera), 121.
GNDT (1993). “Rischio sismico di edifici pubblici, parte i: aspetti metodologici,” in Proceedings of CNR-Gruppo Nazionale per la Difesa dai Terremoti (Roma).
GNDT (2000). “The catania project: earthquake damage scenarios for a high risk area in the Mediterranean,” in Proceedings of CNR-Gruppo Nazionale per la Difesa dai Terremoti (Roma).
Grünthal, G., (ed.). (1998). Cahiers du Centre Européen de Géodynamique et de Séismologie: Volume 15 – European Macroseismic Scale 1998. Luxembourg: European Center for Geodynamics and Seismology.
Guagenti, E., and Petrini, V. (1989). “The case of old buildings: towards a new law – intensity damage,” in Proceedings of the 4th National Conference of Seismic Engineering (Milan), 145–153.
Gutenberg, B., and Richter, C. F. (1942). Earthquake magnitude, intensity, energy and acceleration. Bull. Seismol. Soc. Am. 32:163–191.
Gutenberg, B., and Richter, C. F. (1956). Earthquake magnitude, intensity, energy and acceleration. Bull. Seismol. Soc. Am. 46:105.
Haghshenas, E., Ashayeri, I., Moosavi, M., and Biglari, M. (2018). Geotechnical Phenomena, Reconnaissance of 12th Nov. 2017 Sarpol-e-zahab, Kermanshah Province Earthquake, 5th Edn. Tehran: IIEES (in Persian).
Hashemi, B. H., Mansouri, B., Kalantari, A., Sarvghad-Moghadam, A., and Farshchi, H. R. (2018). Structure and Life Lines, Reconnaissance 12th Nov. 2017 Sarpol-e-zahab, Kermanshah Province Earthquake, 5th Edn. Tehran: IIEES (in Persian).
Hershberger, J. (1956). A comparison of earthquake accelerations with intensity ratings. Bull. Seismol. Soc. Am. 46:317.
Hisada, Y., Shibaya, A., and Ghayamghamian, M. R. (2004). Building damage and seismic intensity in bam city from the 2003 Iran, bam, earthquake. Bull. Earthq. Res. Inst. Univer. Tokyo 79, 81–93.
JBDPA (1990). Standard for Seismic Capacity Assessment of Existing Reinforced Concrete Buildings, Japanese Building Disaster Prevention Association, Ministry of Construction. Tokyo.
JICA (2000). The Study on Seismic Microzoning of the Greater Tehran Area in the Islamic Republic of Iran. Final Report, Tehran, Iran.
Kalantari, A., Hashemi, B. H., and Farschi, H. R. (2019). “Buildings damage data gathering after 2017 Sarpol-e-zahab earthquake,” in 8th International Conference on Earthquake Engineering and Seismology (Tehran), 11–13.
Kappos, A. J., Pitilakis, K., and Stylianidis, K. C. (1995). “Cost-benefit analysis for the seismic rehabilitation of buildings in Thessaloniki, based on a hybrid method of vulnerability assessment,” in Proceedings of the Fifth International Conference on Seismic Zonation (Nice), 406–413.
Kazantzi, A. K., Vamvatsikos, D., and Porter, K. (2015). “Analytical seismic vulnerability assessment for a class of modern low-rise steel frames,” in Proceedings of the 12th International Conference on Applications of Statistics and Probability in Civil Engineering, ICASP (Vancouver, BC), 12–15.
Khatam, A. (2006). The destruction of bam, its reconstruction following the earthquake of december. Cities 23, 462–464. doi: 10.1016/j.cities.2006.08.008
Kircher, C. A., Nassar, A. A., Kustu, O., and Holmes, W. T. (1997). Development of building damage functions for earthquake loss estimation. Earthq. Spectra 13, 663–682. doi: 10.1193/1.1585974
Lagaros, N. (2008). Probabilistic fragility analysis: a tool for assessing design rules of RC buildings. Earthq. Eng. Eng. Vibrat. 7, 45–56. doi: 10.1007/s11803-008-0823-x
Mansouri, B., Ghafory-Ashtiany, M., Amini-Hosseini, K., Nourjou, R., and Mousavie, M. (2010). Building seismic loss model for tehran. Earthq. Spectra 26, 153–168. doi: 10.1193/1.3280377
Margottini, C., Molin, D., and Serva, L. (1992). Intensity versus ground motion: a new approach using Italian data. Eng. Geol. 33, 45–58. doi: 10.1016/0013-7952(92)90034-V
Medvedev, A. V., and Sponheuer, W. (1969). “Scale of seismic intensity,” in Proceeding of World Conference Earthquake Engineering, 5th edn (Santiago).
Memari, M. A. (2020). Investigation of the site effects on structure vulnerability in Aban 21st (Nov. 12) Ezgeleh earthquake (M.Sc. thesis). Razi University, Kermanshah, Iran (in press- in Persian).
Milani, G., and Venturini, G. (2011). Automatic fragility curve evaluation of masonry churches accounting for partial collapses by means of 3D FE homogenized limit analysis. Comp. Struct. 89, 1628–1648. doi: 10.1016/j.compstruc.2011.04.014
Milutinovic, Z. V., and Trendafiloski, G. S. (2003). “RISK-UE,” An Advanced Approach to Earthquake Risk Scenarios With Applications to Different European Towns, WP4: Vulnerability of current buildings, Contract: EVK4-CT-2000-00014.
Modena, C., Lourenço, P. B., and Roca, P., (eds.). (2005). Structural Analysis of Historical Constructions – Possibilities of Numerical and Experimental Techniques. London: Taylor and Francis.
Mosoarca, M., Onescu, I., Azap, B., Onescu, E., Chieffo, N., and Szitar-Sirbu, M. (2019). Seismic vulnerability assessment for the historical areas of the Timisoara city, Romania. Eng. Fail. Anal. 101, 86–112. doi: 10.1016/j.engfailanal.2019.03.013
Mostafaei, H., and Kabeyasawa, T. (2004). Investigation and analysis of damage to buildings during the 2003 Bam earthquake. Bull. Earthq. Res. Inst. Univer. Tokyo 79, 107–132.
Murphy, J. R., and O'Brien, L. J. (1977). The correlation of peak ground acceleration amplitude with seismic intensity and other physical parameters. Bull. Seismol. Soc. Am. 67, 877–915.
National Institute of Building Science (NIBS) (1999). HAZUS99 Technical Manual. Developed by the Federal Emergency Management Agency Through Agreements With the National Institute of Building Sciences. Washington, DC: NIBS.
Omidvar, B., Gatmiri, B., and Derakhshan, S. (2012). Experimental vulnerability curves for the residential buildings of Iran. Nat. Hazards 60, 345–365. doi: 10.1007/s11069-011-0019-y
Ozdemir, P., Boduroglu, M. H., and Ilki, A. (2005). “Seismic safety screening method,” in Proceedings of the International Workshop on Seismic Performance Assessment and Rehabilitation of Existing Buildings (SPEAR) (Ispra), 23.
Pagni, C. A., and Lowes, L. N. (2006). Fragility functions for older reinforced concrete beam– column joints. Earthq. Spectra 22, 215–38. doi: 10.1193/1.2163365
Pagnini, L. C., Vicente, R., Lagomarsino, S., and Varum, H. (2011). A mechanical model for the seismic vulnerability assessment of old masonry buildings. Earthq. Struct. 2, 25–42. doi: 10.12989/eas.2011.2.1.025
Park, Y. J., and Ang, A. H. S. (1985). Mechanistic seismic damage model for reinforced concrete. J. Struct. Eng. 111, 722–739. doi: 10.1061/(ASCE)0733-9445(1985)111:4(722)
Pinho, R., Bommer, J. J., and Glaister, S. (2002). A simplified approach to displacement-based earthquake loss estimation analysis,” in Proceedings of the 12th European Conference on Earthquake Engineering (London), 738.
Ramos, L., and Lourenço, P. B. (2004). Modeling and vulnerability of historical city centers in seismic areas: a case study in Lisbon. Eng. Struct. 26, 1295–1310. doi: 10.1016/j.engstruct.2004.04.008
Restrepo-Vélez, L. F., and Magenes, G. (2004). “Simplified procedure for the seismic risk assessment of unreinforced masonry buildings,” in Proceedings of the 13th World Conference on Earthquake Engineering (Vancouver, BC), Paper No. 2561.
Rossetto, T., and Elnashai, A. (2005). A new analytical procedure for the derivation of displacement-based vulnerability curves for populations of rc structures. Eng. Struct. 7, 397–409. doi: 10.1016/j.engstruct.2004.11.002
Sabetta, F., Goretti, A., and Lucantoni, A. (1998). “Empirical fragility curves from damage surveys and estimated strong ground motion,” in Proceedings of the 11th European Conference on Earthquake Engineering (Paris), 1–11.
Singhal, A., and Kiremidjian, A. S. (1996). Method for probabilistic evaluation of seismic structural damage. J. Struct. Eng. ASCE 122, 1459–1467. doi: 10.1061/(ASCE)0733-9445(1996)122:12(1459)
Tatar, M., Ghaemmaghamian, M. R., Yaminifard, F., Hesamiazar, K., Ansari, A., and Firouzi, E. (2018). Seismological Aspects, Reconnaissance of 12th Nov. 2017 Sarpol-e-zahab, Kermanshah Province Earthquake, 5th ed. Vol. 1, Tehran: IIEES (in Persian).
Trifunac, M. D., and Brady, A. G. (1975). On the correlation of seismic intensity scales with peaks of recorded strong ground motion. Bull. Seismol. Soc. Am. 65, 139–162.
United States Geological Survey (2009). Historic Worldwide Earthquakes, January 29, 2009. Archived From the original on February 21, 2009. Retrieved February 21, 2009.
Veneziano, D., Sussman, J. M., Gupta, U., and Kunnumkal, S. M. (2002). “Earthquake loss under limited transportation capacity: assessment, sensitivity and remediation,” in Proceedings of the Seventh US National Conference on Earthquake Engineering (Boston, MA).
Wen, Y. K., and Ellingwood, B. R. (2005). The role of fragility assessment in consequence-based engineering. Earthq. Spectra 21, 861–77. doi: 10.1193/1.1979502
Keywords: unreinforced masonry, confined masonry, damage probability matrix, empirical fragility curves, damage analysis
Citation: Biglari M and Formisano A (2020) Damage Probability Matrices and Empirical Fragility Curves From Damage Data on Masonry Buildings After Sarpol-e-zahab and Bam Earthquakes of Iran. Front. Built Environ. 6:2. doi: 10.3389/fbuil.2020.00002
Received: 08 November 2019; Accepted: 09 January 2020;
Published: 19 February 2020.
Edited by:
Arturo Tena-Colunga, Autonomous Metropolitan University, MexicoReviewed by:
Panagiotis G. Asteris, School of Pedagogical & Technological Education, GreeceMichele Betti, University of Florence, Italy
Khan Shahzada, University of Engineering & Technology Peshawar, Pakistan
Copyright © 2020 Biglari and Formisano. This is an open-access article distributed under the terms of the Creative Commons Attribution License (CC BY). The use, distribution or reproduction in other forums is permitted, provided the original author(s) and the copyright owner(s) are credited and that the original publication in this journal is cited, in accordance with accepted academic practice. No use, distribution or reproduction is permitted which does not comply with these terms.
*Correspondence: Mahnoosh Biglari, m.biglari@razi.ac.ir; mahnooshbiglari@yahoo.com