Detection of Personal Protective Equipment (PPE) Compliance on Construction Site Using Computer Vision Based Deep Learning Techniques
 Venkata Santosh Kumar Delhi
 R. Sankarlal
 Albert Thomas
- Construction Technology and Management Division, Civil Engineering Department, Indian Institute of Technology Bombay, Mumbai, India
Construction safety is a matter of great concern for practitioners and researchers worldwide. Even after risk assessments have been conducted and adequate controls have been implemented, workers are still subject to safety hazards in construction work environments. The need for personal protective equipment (PPE) is important in this context. Automatic and real-time detection of the non-compliance of workers in using PPE is an important concern. Developments in the field of computer vision and data analytics, especially using deep learning algorithms have the potential to address this challenge in construction. This study developed a framework to sense in real-time, the safety compliance of construction workers with respect to PPE, which is intended to be integrated into the safety workflow of an organization. The study makes use of the Convolutional Neural Networks model, which was developed by applying transfer learning to a base version of the YOLOv3 deep learning network. Taking into account the presence of hardhat and safety jackets, the model predicts compliance in four categories such as NOT SAFE, SAFE, NoHardHat, and NoJacket. A data set of 2,509 images was collected from video recordings from several construction sites and this web-based collection was used to train the model. The model reported an F1 score of 0.96 with an average precision and recall rate at 96% on the test data set. Once a non “SAFE” category is detected by the model, an alarm and a time-stamped report are also incorporated to enable a real-time integration and adoption on the construction sites. Overall, the study provides evidence on the feasibility and utility of computer vision-based techniques in automating the safety-related compliance processes at construction sites.
Introduction
Historically, the construction sector has suffered from very high accident rates compared to other sectors (Somavia, 2005). The safety of construction workers has been a primary cause of concern for project managers for a long time. In India, the construction sector employs around 10 million people, next only to the agriculture sector (CIDC, 2014), and the track record of construction workers’ safety is alarming. India has one of the highest accident rates in the world, with 15.8 incidents per 1,000 workers/year (Patel and Jha, 2014). Even though construction site safety is regarded as an area of paramount importance, the lack of adequate mechanisms for data gathering and monitoring construction safety complicates this problem further (Mahalingam and Levitt, 2007). Achieving safe environments for workers poses a huge challenge to this sector globally, as well as in an Indian scenario.
High injury rates in the construction sector are often attributed to the inherently dangerous nature of this industry, even though this assumption has been contested strongly by researchers (Levitt and Samelson, 1993; Hinze, 1997; Mahalingam and Levitt, 2007). Studies have shown that adopting proactive measures has reduced accident rates in countries such as the United States and Japan to a great extent (Rowlinson, 2004). Such measures include incorporating worker safety from the design stage throughout the life-cycle of the project (Gambatese and Hinze, 1999). Providing construction workers with personal protective equipment (PPE) is one such crucial measure. PPE, which includes but is not limited to hard hats, shoes, vests, harnesses is often the last line of defense against accidents.
Despite its effectiveness, worker compliance and use of PPE is not always guaranteed (Cavazza and Serpe, 2009) and a number of research studies have listed non-usage as a significant factor that adversely affects construction safety (Tam et al., 2004; Chi et al., 2005; Choudhry and Fang, 2008; de Oliveira et al., 2018b). Thus, efficient monitoring mechanisms to identify unsafe working conditions – including the absence of PPE for workers – is a crucial part of construction safety management (Toole, 2002). Monitoring for safety compliance is an important area of research, as mechanisms and processes complete the feedback cycle to construction managers, enabling them to understand the efficacy of the safety policies and processes implemented on a construction site (Hinze and Wiegand, 1992; Gambatese and Hinze, 1999). Such mechanisms can provide valuable data that can then be analyzed to characterize worker behavior (Mohamed, 2002) and understand the safety climate and culture on a construction site (Levitt and Samelson, 1993; Teo et al., 2005). However, implementing such monitoring mechanisms involving human agents, are not fail-safe and there are numerous challenges associated with accuracy, timeliness, and transparency (Seo et al., 2015). In response to this, automated ways of monitoring and detecting unsafe conditions are increasingly attracting the attention of researchers. Reliable and real-time automated systems that monitor safety can be of great benefit to this area (Cheng and Teizer, 2013). Advances in the fields of machine learning and computer vision-based techniques mean there is a renewed research interest in automated ways of detection and early warning systems for construction safety.
Recent advances in the field of computer vision and machine intelligence offer efficient ways to tackle the challenge of accurate safety monitoring in construction sites. Application of advances in Artificial Intelligence and Machine Learning to construction safety is gathering pace (Wang et al., 2019; Yu et al., 2019). However, although very promising, research in these areas is still in nascent phases. This study adds and complements this research by making use of deep learning enabled computer vision based techniques, to build a framework for PPE compliance detection and monitoring.
Thus, the objective of this study is to develop a scalable computer vision based deep learning framework to detect PPE compliance. The study achieved this objective using the context of hard hats and safety jacket detection on the construction site. Similarly, the related sub-objectives of this study were to demonstrate the functioning of the Deep Learning based CV algorithm to detect hard-hats and safety jacket compliance on site. The study will also demonstrate the use of transfer learning as a means to extend the trained CV algorithm to incorporate new classes depending on the objective of safety monitoring on the site. The model so trained and developed demonstrated robustness in terms of detecting compliance in various contexts and performed quasi-real-time detection on video streams from construction sites. To achieve this objective, the study utilizes convolutional-neural networks – a class of deep learning computer vision algorithms that process the data, develop, train, and validate the model.
Research Background
Computer Vision in Construction Management
Research in construction management has benefitted immensely from parallel developments in the field of computer science, especially those related to information management and processing. Paradigms such as Building Information Modelling (BIM), which aim at providing a seamless information management model for the construction process, have changed the way construction is managed across the world. Similarly, recent advances in interfacing technologies such as Augmented Reality (AR) and Virtual Reality (VR) when combined with BIM offer the promise of accurate visualization as well as virtualization of construction management processes. These advances in the field of machine learning offer potential avenues to effectively analyze information, particularly when used in conjunction with BIM, to provide timely business intelligence to managers. Such methods usually rely on accurate and large amounts of data to produce any meaningful intelligence. This need translates to the use of various sensors (e.g., Radio Frequency IDs or RFID technologies) that gather data. While there is a need to gather different kinds of data from the field, video feeds and images offer rich visual data records of activity on-site, and computer vision-based techniques help understand such visual data. In essence, computer vision (CV) aims to solve the problem of understanding the information from visual data points, for example, an image or video sequence from the perspective of a human eye (Szeliski, 2010). Research and application of vision-based techniques in construction management have closely followed advances in the field of computer vision and deep learning.
Early attempts to process vision inputs in construction management used algorithms such as Structure from Motion (Golparvar-Fard et al., 2009b, 2012) to identify the progress of construction work on sites. Early research endeavored to use techniques of image processing to identify relief features of architecture from sparse images, using view dependent texture mapping and model based stereo (Debevec et al., 1996; Lee et al., 2012). Similarily, vision based techniques in combination with information paradigms such as BIM are being adopted to automate monitoring mechanisms in construction management research in the areas of progress monitoring, productivity measurement, object identification, and activity tracking of workers and equipment on-site (Wang et al., 2019). Augmented reality models (Golparvar-Fard et al., 2009a,b), time-lapsed photographs (Son and Kim, 2010), and 4D-CAD based models (Kim et al., 2013) were used for monitoring progress on construction sites. These studies used image processing based techniques used color and depth cues to monitor progress (Golparvar-Fard et al., 2009b; Kim et al., 2013). Attempts were also made to capture 3D data about the site using ranging sensors such as laser scans (Bosche et al., 2009). Further, IFC-based BIM models were used and updated to monitor progress (Golparvar-Fard et al., 2012). Creation and updating BIM models using CV techniques also received attention. Attempts were made to integrate BIM with sensors to build navigation systems for equipment on sites (Yang et al., 2012). Finally, Laser scanned point clouds combined with images (stereovision) were also used to automatically generate BIM models of existing buildings (Tang et al., 2010; Lee et al., 2012). Therefore several such studies have shown the efficiency and accuracy that is achievable in CV based studies.
CV in Construction Safety Management
A fundamental step in construction safety-related research using CV is to identify objects on a construction site. These objects usually refer to workers, equipment, obstacles, or any other item of interest to safety researchers. To enable this, a large amount of reliable visual data is necessary. Other studies in the past have included the collection of data using site videos (Teizer and Vela, 2009; Park et al., 2011; Wang et al., 2019), surveillance video feeds (Yang et al., 2012) stereo cameras (Harville and Li, 2004; Park et al., 2011), point clouds from LIDAR (Light Detection and Ranging) (Chi et al., 2009) depth sensors (like Kinect, etc.) (Han et al., 2012; Ray and Teizer, 2012) to identify and track objects like workers and equipment on site. As the data becomes available, the CV based algorithms should accurately identify the objects in a given image or video frame. Early research in this area was directed at extracting the right features from a visual data point to identify relevant objects on a construction site. Consequently, studies concentrated on sets of features to distinguish certain classes of objects from one another. However, studies using classic computer vision techniques have some key limitations. The first limitation involves in-context identification. Context identification would involve recognizing what is happening on a construction site (e.g., working at heights, tower crane movement, equipment used, and safety barrier provision) (Seo et al., 2015; de Oliveira et al., 2019a). Classic computer vision techniques fell short on performance, particularly in identifying objects situated in different contexts. The use of feature extraction in these studies usually adopted trained machine learning classifier algorithms – multiclass classifiers (Han et al., 2012) or large margin classifiers like Support Vector Machines (Harville and Li, 2004) to classify and detect objects and activities based on certain sets of identified features. However, having the right set of features to detect an object can be challenging. Furthermore, the training of object detection algorithms requires it to process massive amounts of data. A way of addressing the large data requirements of construction safety management research is to employ deep learning advances in the field of computer vision.
Recent advances in this field aim at utilizing the availability of processing power to process large datasets and use deep learning frameworks to meet various sensing related challenges on construction sites. While several studies attempted to use vision in the areas of progress monitoring, few studies have concentrated on domains of worker safety and posture. In terms of construction safety, recent studies make use of a combination of vision-based techniques for various objectives of safety. To ensure safety, research has tried to detect the dynamic workspaces of workers on foot on construction sites (Luo et al., 2019). They also attempted to use vision based techniques to detect the likelihood of falls from a height resulting from safety hazards (Fang Q. et al., 2018).
Studies have also made use of IoT based technologies and RFID to detect whether people comply with instructions to wear hard hats on construction sites (Zhang et al., 2019). Mneymneh et al. (2019) utilized an aggregate channel-feature based object detector to identify hard hats in a construction site. In addition, platforms such as Cognitive Platform for Hazard Control (CVP-HC) aim to bring together knowledge engineering with a vision based cognitive systems to detect unsafe activities and improve decision making processes in workplaces (de Oliveira et al., 2019b). Overall, these studies have advanced knowledge of the applicability of CV techniques in construction management. The use of deep learning techniques using CV based algorithms proved beneficial in construction safety related research.
Recent developments in this field have also identified the use of deep learning CV algorithms such as Convolutional Neural Networks (CNN) as particularly beneficial (de Oliveira et al., 2018b; Fang W. et al., 2018; Wang et al., 2019). The detection of objects such as hard hats and safety jackets is a major step forward in monitoring the process of encouraging workers to automatically comply with PPE. This detection raises classification problems in the domain of machine learning and artificial intelligence. A classification problem is described as a function f:ℝn→{1,…,k}, where the algorithm classifies into k classes/categories. The classification problem is at the core of the Convolutional Neural Networks (CNNs), which aim to learn to recognize images as a way of detecting and classifying particular objects in images. CNNs were first introduced around 1989. Earlier applications of CNN involved face recognition (Lawrence et al., 1997) and digit recognition (Niu and Suen, 2012). Convolutional neural networks are large and deep neural networks with several convolutional and fully connected layers followed by a classifier layer. CNNs have proved very efficient in processing large image databases for supervised learning (Krizhevsky et al., 2012). The success of CNNs can be attributed to the availability of larger datasets, increased computational power, and improved regularization techniques (Zeiler and Fergus, 2013). CNNs are especially useful in detecting PPE and crucial in safety related research (de Oliveira et al., 2018a). Researchers have tried and tested various Neural Network Architectures and faster R-CNN, as well as Single Shot Detection (SSD) algorithms, have been used to detect PPE (de Oliveira et al., 2018a). Faster R-CNN was also used to detect workers and equipment on construction sites to predict collision probabilities (Wang et al., 2019). Such studies have given the effectiveness of using deep learning algorithms and knowledge-based systems to move toward real-time, automated, and intelligent safety and hazard detection platforms.
The search for a suitable architecture of the deep learning algorithm is ongoing. Research is still exploring the ability to perform incremental training on already trained algorithms to add new functionalities, often referred to as transfer learning. This ability will help in scaling the algorithms for deployment on construction sites. Furthermore, construction sites in countries such as India are more labor-intensive and congested. This poses difficulties for the CV algorithms, as it makes accurate prediction more difficult because there are occlusions and overlapping frames of objects in images of construction sites.
This study complements and augments the existing studies discussed above. We experimented with a robust CNN based algorithm called YOLO (You only look once), which is comparable to Faster R-CNN and SSD algorithms. Since YOLO has a faster prediction rate, it is a good potential candidate for real-time prediction of safety hazards on construction sites. Transfer learning was tested on an already trained YOLO model to customize it to construction safety. The PPE detection was restricted to a hard hat and safety jacket as these are the most commonly used PPE on construction sites in India. The algorithm was validated on video feeds from Indian construction sites to understand the applicability of such techniques in an Indian scenario. The next section introduces the YOLO algorithm in brief.
YOLO
A cutting-edge algorithm that utilizes the principles of CNN, the You only look once (YOLO) algorithm is an object detection system targeted for real-time processing (Redmon et al., 2016). YOLO divides the input image into an S × S grid. Each grid cell predicts only one object and a fixed number of boundary boxes. For each grid cell, it predicts B boundary boxes and each box has one box confidence score. Then, it detects one single object, regardless of the number of boxes B. Finally, it predicts C conditional class probabilities (one per class for the likeliness of the object class). Each boundary box contains 5 elements: (x, y, w, h) and a box confidence score. The confidence score reflects how likely the box is to contain an object, objectness in terms of YOLO authors, and how accurate the boundary box is. We normalized the bounding box width w and height h by the image width and height. x and y are offsets to the corresponding cell. Hence, x, y, w, and h are between 0 and 1. The class confidence score for each prediction box is computed as:
YOLOv2 and YOLOv3 were an improvement over YOLO which introduced batch normalization, high-resolution classifiers, convolutions with anchor boxes, multi-scale training, and joint classification and detection. YOLOv3 uses softmax based prediction and enables multi-label classification. It utilizes a 53-lkayer Darknet-53 architecture as a feature extractor from images. YOLOv3 is an advanced CNN architecture whose mean AP (Accuracy precision) metric is comparable to other similar architectures like Faster R-CNN, SSD513, RetinaNet, and DSSD (Redmon and Farhadi, 2018), but offers a faster prediction rate when compared to other algorithms. YOLOv3 has proved to be effective at detecting multiple workers on construction sites (Luo et al., 2019). Thus, YOLOv3 was chosen as the base CNN architecture for the present study.
Research Method
This study chose to implement the model using YOLOv3 network architecture using keras backend. Keras is a high-level neural network API written in Python which enables the seamless implementation of algorithms using the Tensorflow framework, offering an easy way to implement deep learning algorithms and quickly experiment with the results. Figure 1 indicates the research method for this study, which follows the standard method for deep learning models. The key processes involved are setting up the algorithm, dataset preparation, training, and validation of the models. The following sections describe these processes in detail.
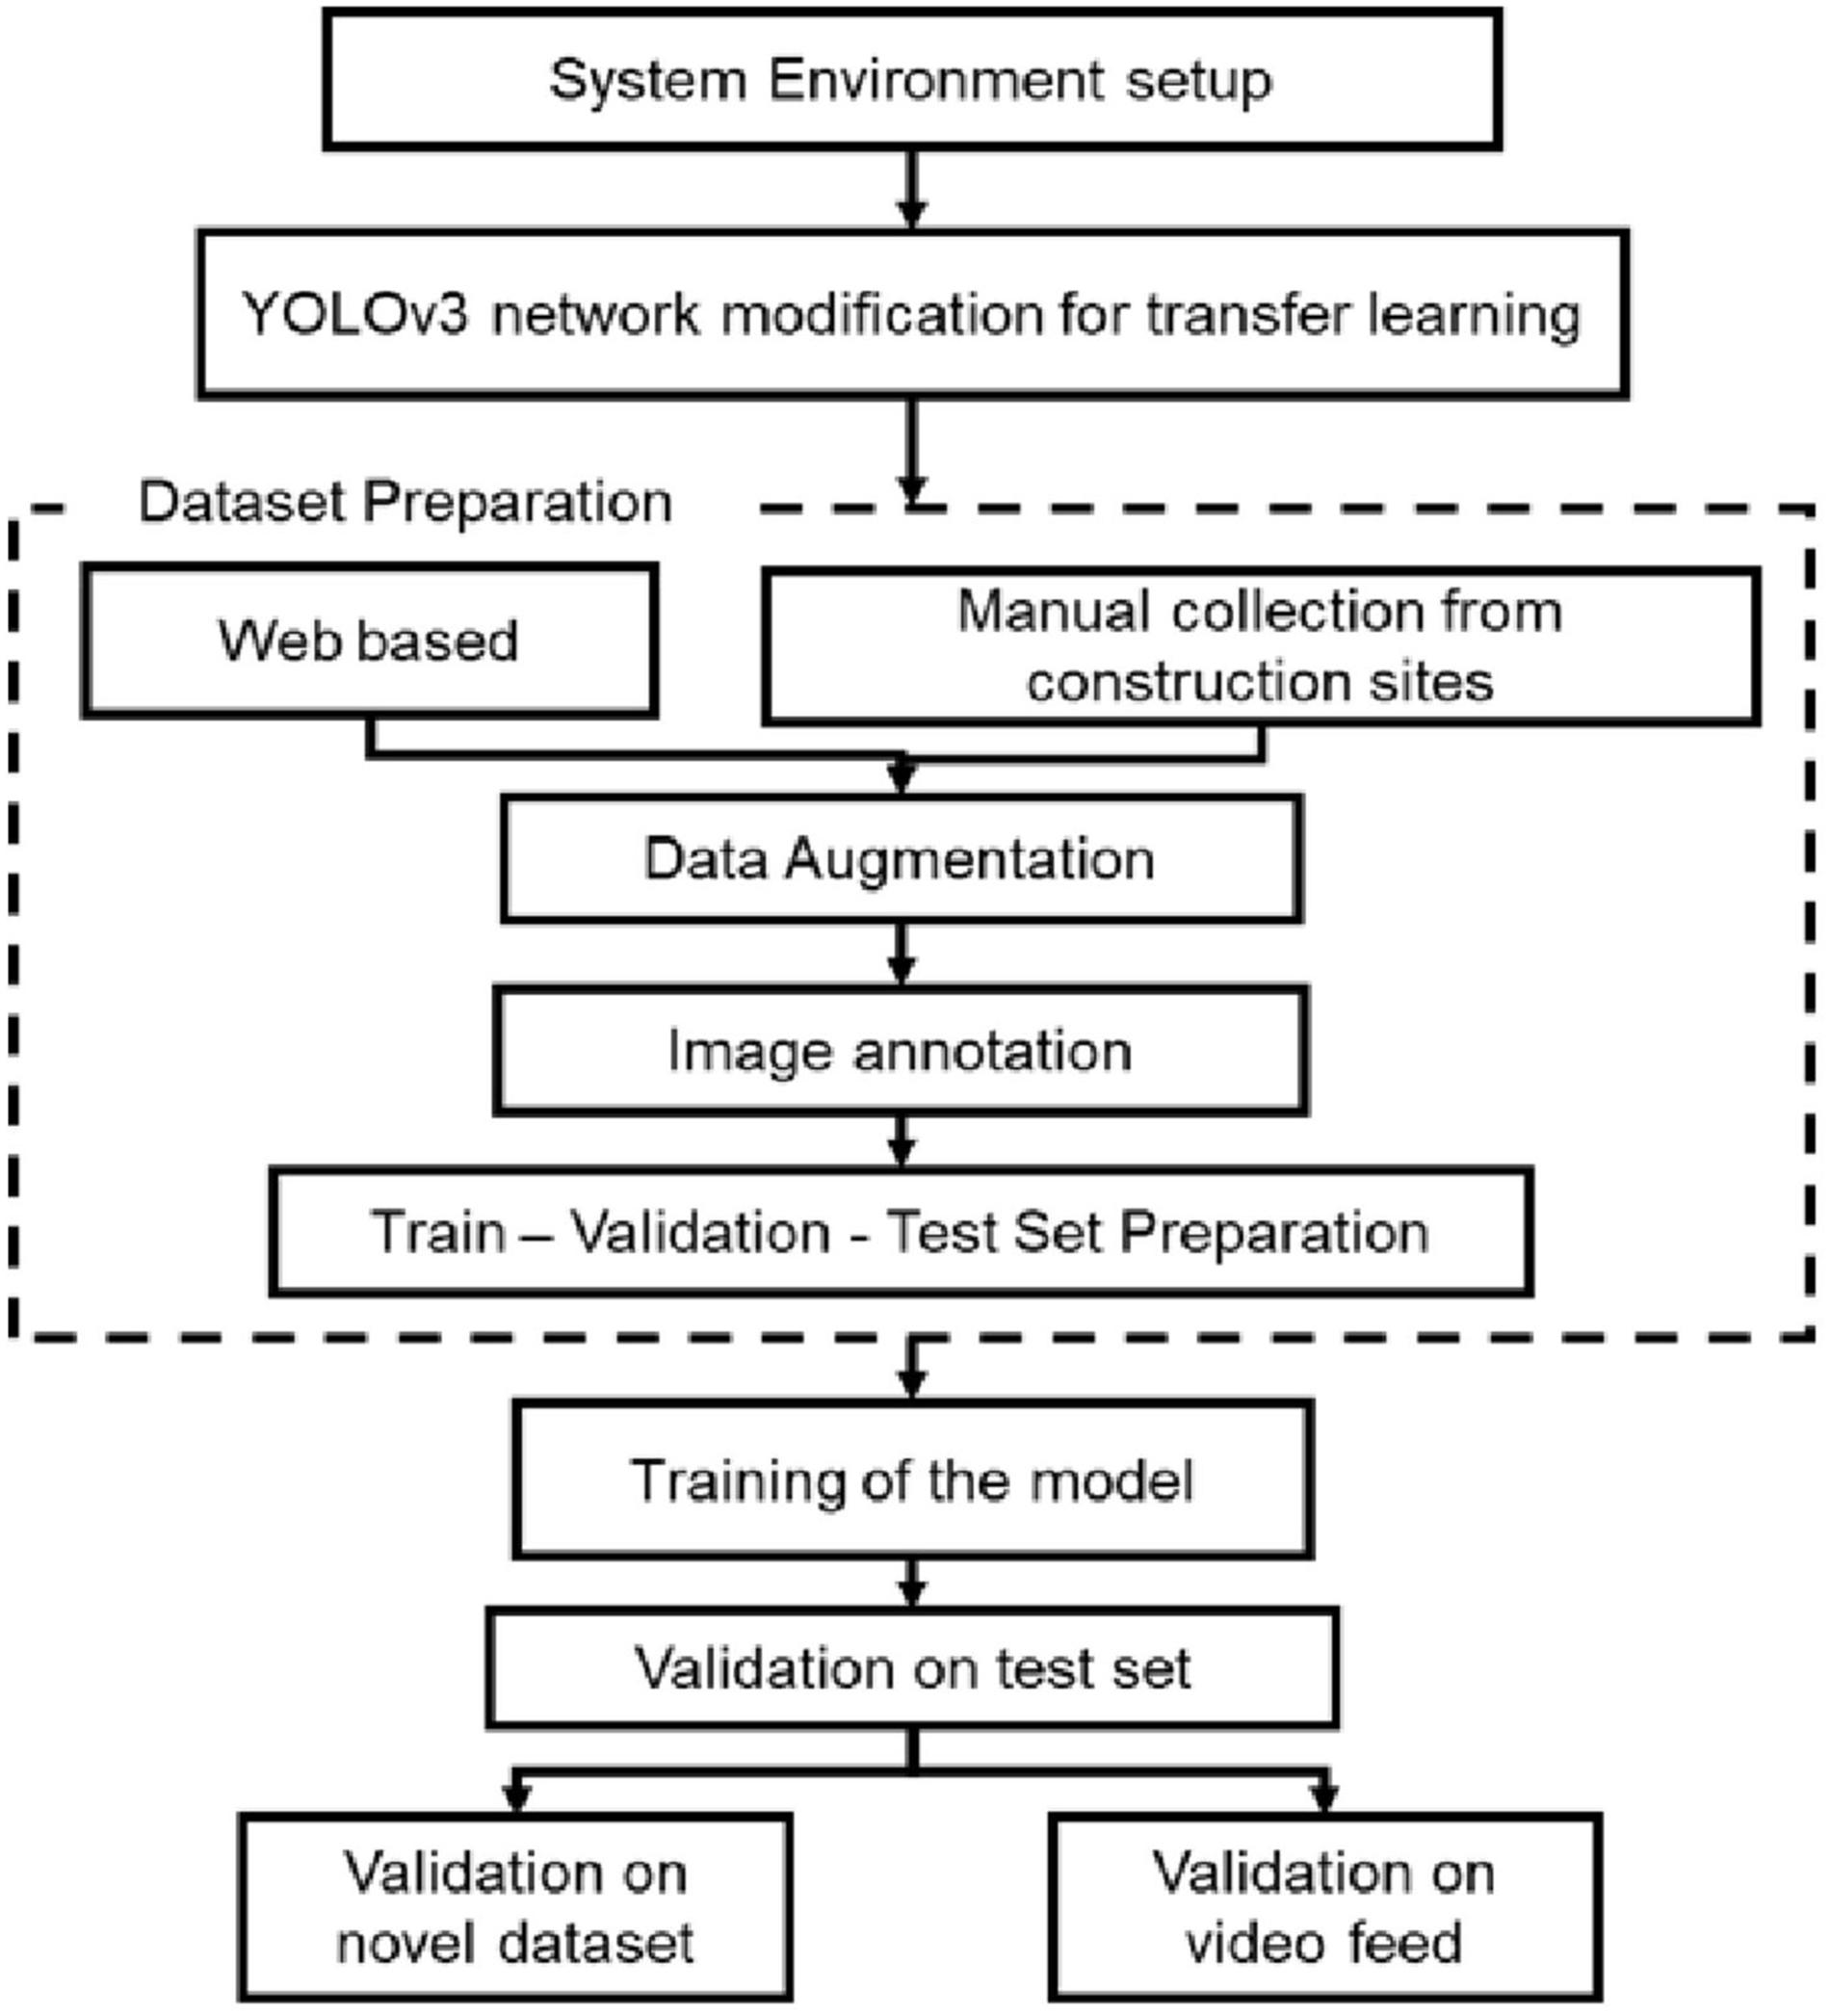
Figure 1. Research methods used for the study.
Environment Setup
The hardware for the system was utilized to test the real-time processing of the algorithm on the field data. It consisted of an Intel Core i7-4790@3.60GHz ∗8 CPU and Intel HD Graphics GPU with a RAM of 8GB 1,600 MHz. The basic environment consists of python3, pip, OpenCV, Tensorflow, and Keras on Ubuntu 16.04 operating system. The image annotation is done using the lableImage-master software tool which is open-source software available on GitHub. The development was done on a jupyter notebook and utilized atom text editor. The YOLOv3 model is used for transfer learning in the keras framework. The final output layer is modified to output 4 classes namely – NOTSAFE, SAFE, NoJacket, NoHelmet - by changing the filter sizes. The trained weights of the YOLOv3 are used as an initial set of weights for the CNN network and the convolutional and fully connected layers are all opened up for training with the data from construction sites. In addition to the above, a code to generate alarms and reports in cases of non-compliance was developed, to increase the utility of the algorithm on construction sites.
Data Set Preparation
The important part of training the machine learning algorithm was the collection and preparation of data to aid the validation of the model. The preparation of the dataset is the most time-consuming and critical component as it enabled efficient training and accurate detection by the algorithm. Data is collected by both manual collection and image scraping online. Firstly, for manual collection, data was collected from multiple construction sites where the videos of ongoing works are recorded. The frames from the videos are later extracted as images. The image capturing was done at an interval of 3 s and a total of 260 images were collected. The purpose of this data is to have a close approximation of the CCTV video data used by the algorithm to predict non-compliance in real-time. Secondly, images are scraped from the internet using web-crawlers developed in python using the google_images-download library to gather 2,000 images. The images were then manually checked for relevance to the study. This filtering involved discarding images with watermarks, synthetically generated images, and images not on construction sites. However, a few of the images with backgrounds different from the usual construction sites were retained to induce variety into the training data. After this process, 1500 images were selected for the dataset. The dataset consisted of examples of all four different classes. Data augmentation was performed on 1,760 images that were collected through standard augmentations such as flipping, rotating 30 degrees right, and 30 degrees left. The final data set had a total of 2,509 images and 4,132 data points for the study. Once the dataset was collected, the data was labeled using labelImg-master, a graphical image annotation tool. The images were labeled according to the four cases NOTSAFE, NoHardhat, NoJacket, and SAFE with bounding boxes. Annotations were saved as XML files.
The final data set had a total of 2,509 images and 4,132 data points. We adopted a train-validation-test set with a random split of 90:8:2 for training. The training set consisted of 2,217 images, 238 images in the validation set and the test set had a total of 54 images. The class-wise separation of each data set is shown in Table 1. We ensured that there was adequate representation of all four classifications in each of the datasets. The generated datasets had annotations in the XML file for the four classifications for each image. The XML files were finally collated into a text file to a code readable format for training and validation purposes.
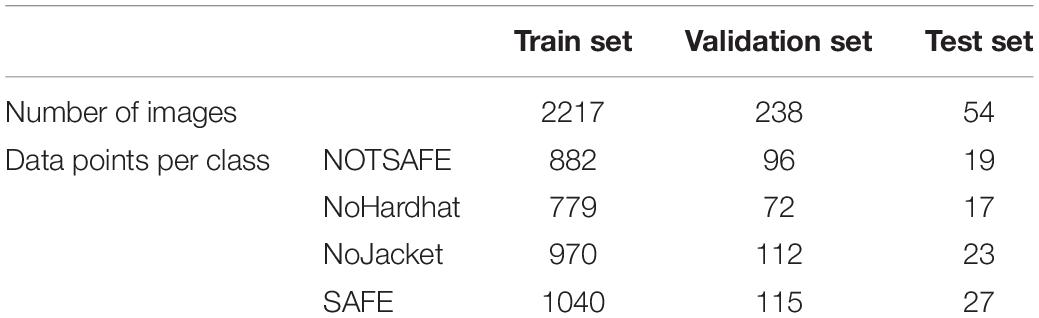
Table 1. Data point distribution among train-validation-test datasets.
Training
The training was done in three stages. The first stage has an epoch of 500 before and after unfreezing all layers. Later ones had 50 epochs each before and after unfreezing all layers. The final model from previous training was used as the initial model for subsequent training. The first model for training was made by combining the cfg file and weights file of yolov3. An h5 model file was generated, which had 252 layers. The model layers include 23 adding layers, 72 batch normalization layers, 75 2D convolutional layers, 72 leaky relu layers, five 2D zero padding layers, two each concatenate and up-sampling layers, and a YOLO loss layer. The data after all epochs before unfreezing all layers and three epochs after unfreezing all layers in training was stored as a new model. Tensorboard callbacks were added to the code for visualization of training loss. For better training, reducing the learning rate of a change in validation loss was not less than 0.1, considering the last three epochs were incorporated in the code. To avoid overfitting, early stopping of a change in validation loss is nil for the last ten epochs used. During training, only the last ten layers were trainable for the first part, and in the second part, all layers were trainable. The batch size for the first stage of training is 8 and 4 for the first and second parts. The later stages had batch sizes of 4 and 2 for the first and second parts, respectively. Adam optimizer, with an initial learning rate of 0.001, was used for training. As early stoppage was used, with the first training stopped after 509 epochs, the second one after 92 epochs, and the last one after 70 epochs.
The training progress of a network was monitored using any of the two parameters, namely loss, and accuracy. In this model, a new loss function named YOLO loss was used to monitor the training. After the first stage the loss was 21.88, after the second it came to 12.87 and the final loss is 12.06. The loss versus the number of epochs curve is as shown in Figure 2.
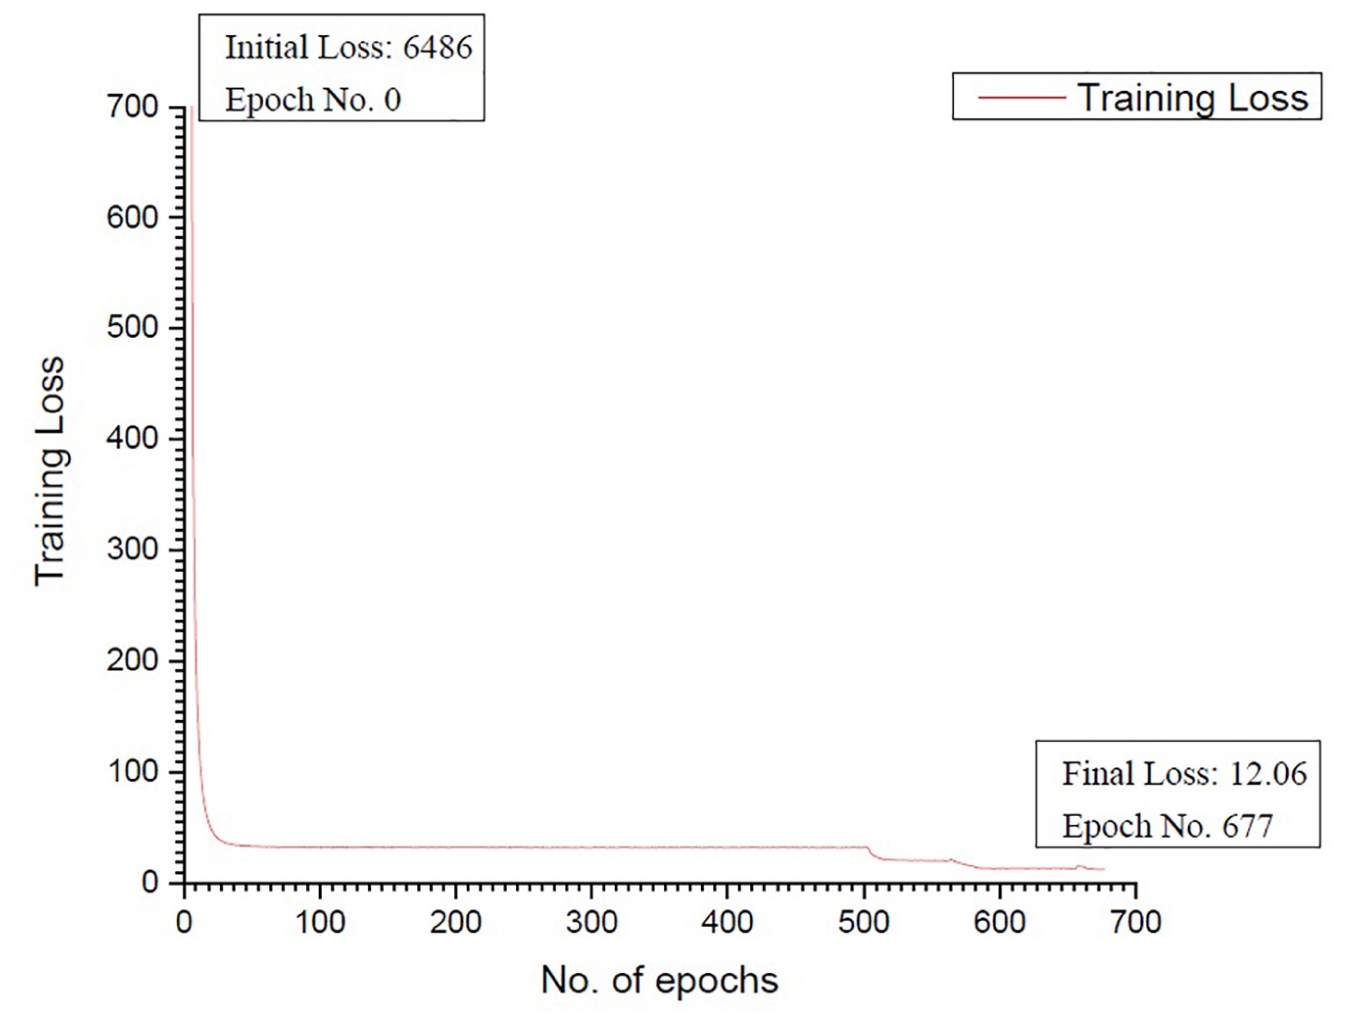
Figure 2. Training loss vs. Epoch number.
Results
The final loss of the network was 12.06 after the three stages of training. A confusion matrix was created for validation and testing the dataset, and the accuracy of the model was calculated as the number of true predictions over the total number of predictions. Furthermore, an entirely new dataset with a variety of contexts and backgrounds was created using video footage of people wearing PPE. The trained model was then tested both on the image as well as video files to assess the performance of the algorithm.
Performance on Image Datasets
Each image was processed at speeds of between 2 images per second and 1 image per second, irrespective of the number of the classes/bounding boxes detected in the image. A confusion matrix was used to understand the performance of the trained model, in which human interpretations and model predictions were counted and marked on a table. Accuracy and the F1 score were the parameters used to assess the model performance. For this, True Positive (TP), True Negative (TN), False Positive (FP), and False Negative (FN) values of each class were counted and tabulated. The accuracy of the model was the sum of TP over the Total number of data points. Precision was: given a class prediction from the classifier model; how likely is to be correct; and calculated as TP over the sum of TP and FP. The recall was: given a class; will the classifier model detect it; and calculated as TP over the sum of TP and FN. The F1 score was the harmonic mean of precision and recall and was calculated as two times the product of precision and recall over the sum of precision and recall.
Validation Dataset
Table 2 shows the confusion matrix, as predicted by the trained model, after processing the images in the validation data set.
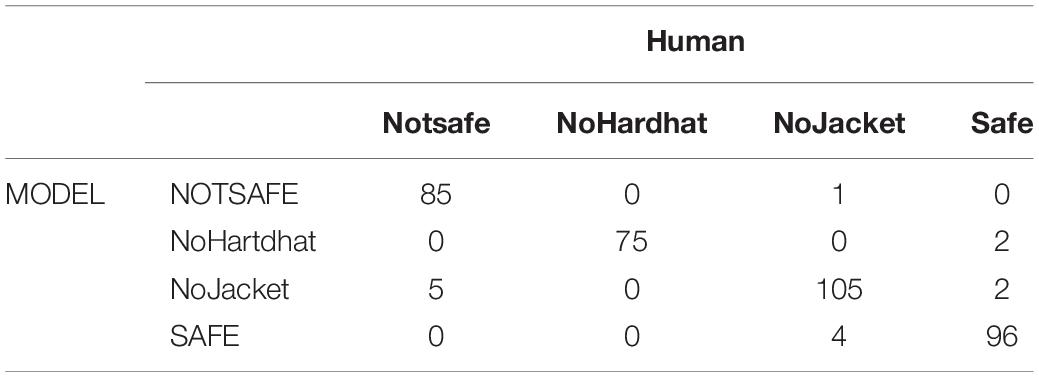
Table 2. Confusion matrix for the validation set.
The outputs showed an overall accuracy of 96.27%. The cells marked in green are the ones with the maximum number of detections. As can be seen, the maximum number of results match, indicating that the model was predicting well on the validation data set. The classification report, which includes TP, TN, FP, and FN of each class, precision, recall, and F1 score of the model on the validation of the data set, is indicated by Table 3. The accuracy of the model is 96.27%, with average precision and recall both 0.96 and an F1 score of 0.96. These results suggest that the model was predicting with an accuracy of 96% on the validation data set.
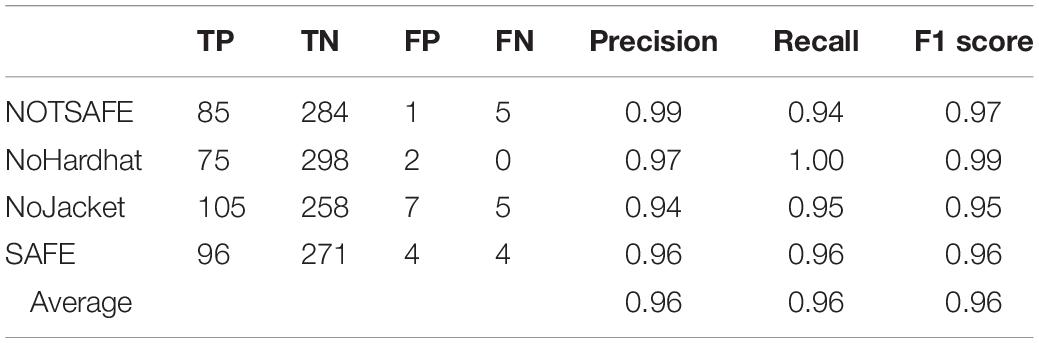
Table 3. Classification report for the validation set.
Test Dataset
Table 4 shows a confusion matrix, which was made after processing the images in the validation data set. The outputs showed an overall accuracy of 96.51%.
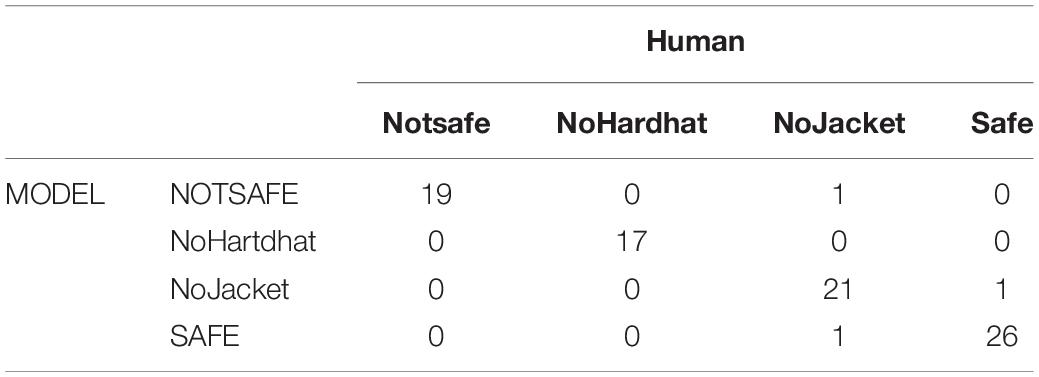
Table 4. Confusion matrix for the test set.
The classification report includes TP, TN, FP, and FN of each class, precision, recall, and F1 score of the model on the test data set, shown in Table 5.
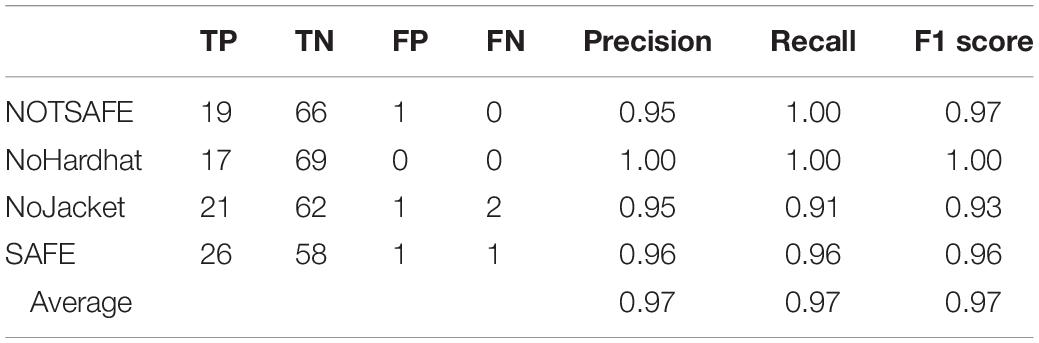
Table 5. Classification report for the test dataset.
The accuracy of the model is 96.51%, average precision and recall are both 0.97 and the F1 score is 0.97. These results indicate that the model was predicting with an accuracy of 96% on the test data set. This result in the validation data set was also obtained for the test set, meaning that the model was performing consistently and predicting images with an accuracy of overall 96%. The sample output predictions are demonstrated in Figure 3.
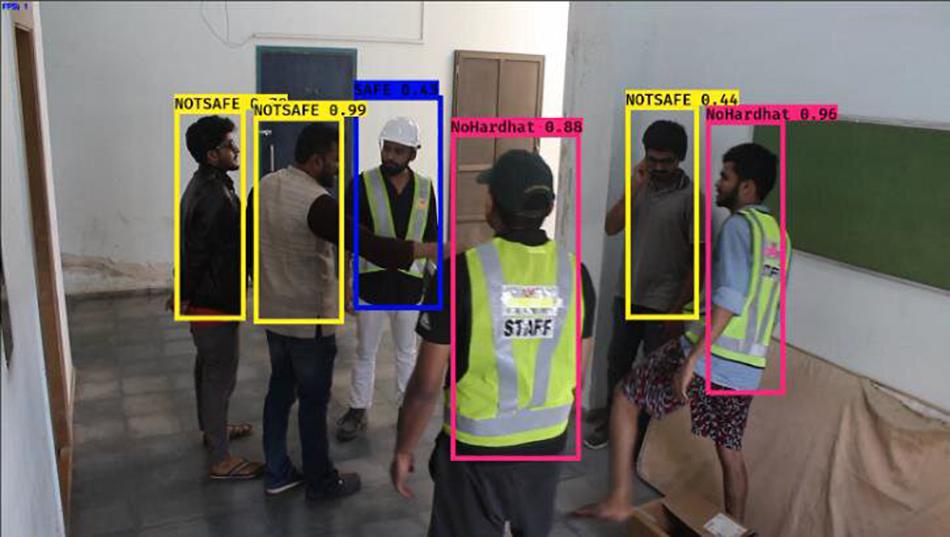
Figure 3. Frames of video output, demonstrating change of classification.
Prediction on Novel Datasets
Computing the performance of the model to analyze a novel data set, gives insights into the real-world performance of the model. The new data set was designed to be a set of images that use different kinds of safety jackets or hardhats, other than those that the model was trained to recognize. A data set that was completely new to the model, that matched the PPE characteristics of the test data set, was developed by manual collection and image scraping. The detection model is run on the novel data set and results are obtained and the confusion matrix was made, as shown in Table 6.
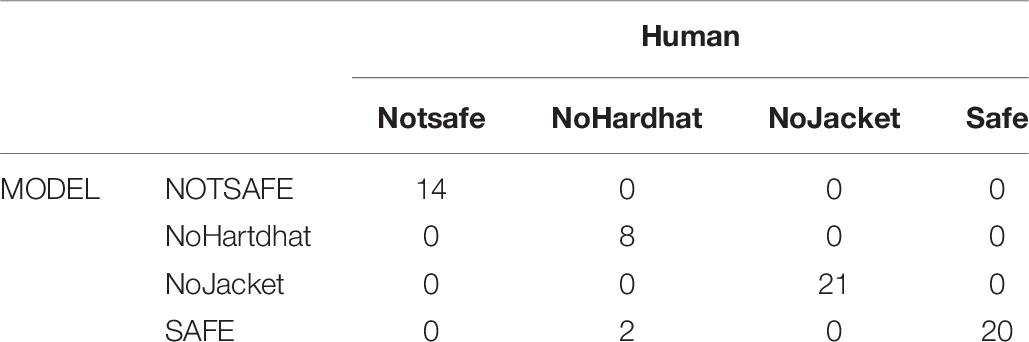
Table 6. Confusion matrix for the novel dataset.
The classification report includes TP, TN, FP, and FN of each class, precision, recall, and the F1 score of the model on the test data set is shown in Table 7. The accuracy of the model was 96.92%, average precision was 0.98, the recall was 0.95, and the F1 score was also 0.96. Taking this into account, the model was predicting with an accuracy of 96% on the novel data set. The accuracy of the present model can be compared to models that were developed earlier using R-CNN and SSD algorithms in earlier studies (de Oliveira et al., 2018a, 2020). The detection rate is also comparable to earlier models developed for equipment detection using a faster R-CNN network (Wang et al., 2019).
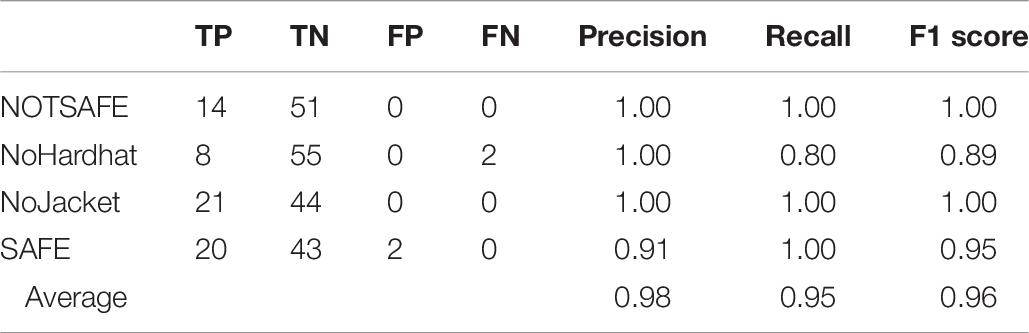
Table 7. Classification report for the novel dataset.
Performance of the Video File
To test the robustness of the trained model, the model was used to predict a video file generated from CCTV video footage in mp4 format. The processing was done at a rate of 2 frames per second. This reduced speed is due to the limited computational resources of the system. The predicted model performed well in detecting a person through frames. Furthermore, the algorithm successfully classified the person as unsafe when there was a change in the PPE they were wearing, for example when they removed a hard hat or jacket. Similarly, an unsafe person was reclassified as SAFE when PPE compliance was found. This dynamic is demonstrated in Figure 4.
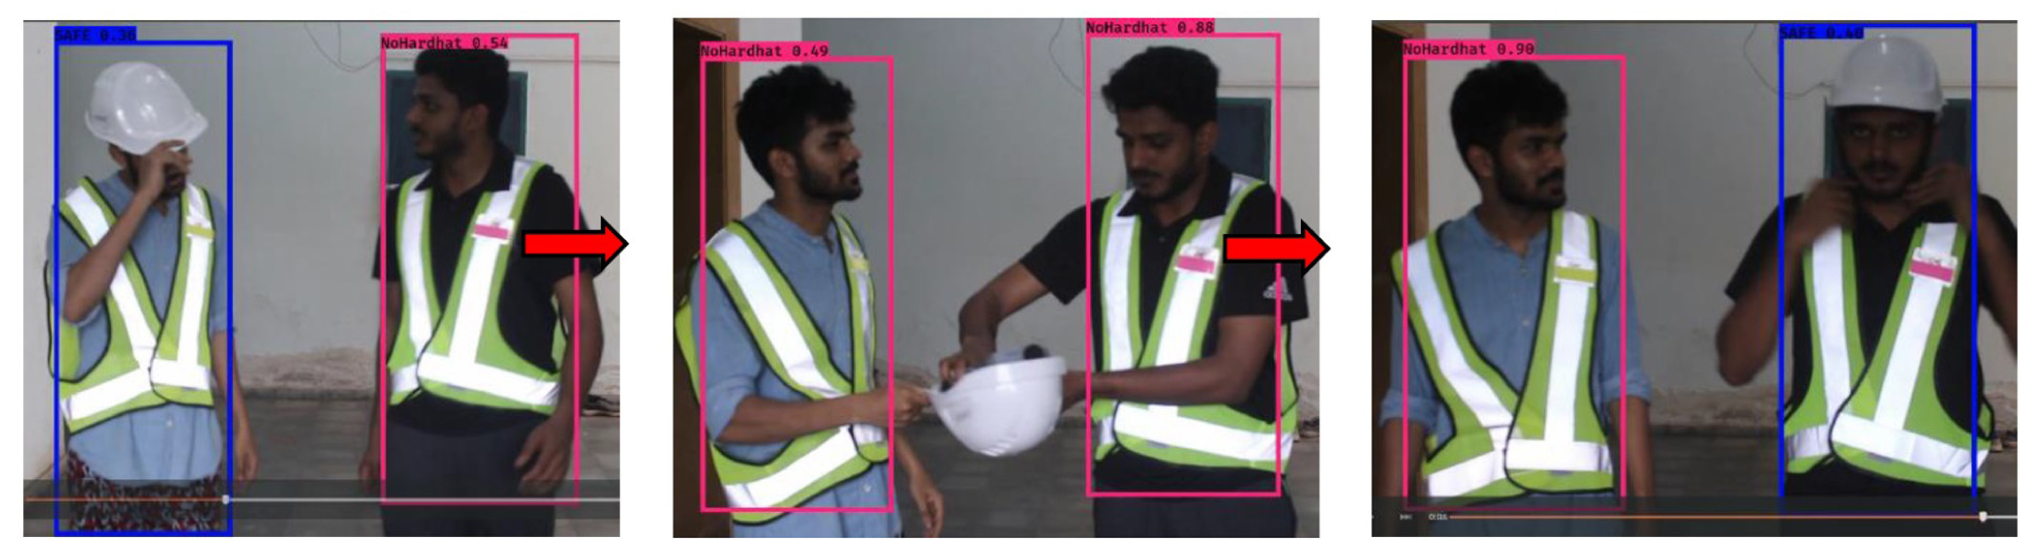
Figure 4. Sample demonstration of the prediction of the developed model.
Thus, the developed and trained CNN model based on the YOLOv3 network structure performed well in terms of precision and recall with regards to the detection of PPE worn by construction workers.
Conclusion and Future Research
This study used deep learning-based computer vision algorithms in the automated detection of the key processes that sustain construction safety and on-site management. Using YOLOv3, a state of art object detection algorithm, this study demonstrates how safety compliance can be automatically detected by using a trained model to examine data from sites. The study demonstrated the deployment of such algorithms on construction sites to aid near real-time detection of safety violations. Systems such as this could be used to deploy similarly trained algorithms to process CCTV video footage from construction sites, generating a dashboard for real-time monitoring. The model developed in this study could be used in frameworks for regularly reporting non-compliance with safety regulations.
This study demonstrated the usefulness of deep learning-based CV frameworks in the accurate monitoring of safety on construction sites. Furthermore, a small module could also be added to this framework to generate a regular report with screenshots of instances of non-compliance. These could be automated and sent out as daily/regular reports, enabling construction managers to escalate and address non-compliance and ensure on-site safety. The study also demonstrated the use of transfer learning in trained algorithms as a way to customize them to particular contexts. Techniques such as this are important in ensuring the scalability and application of the framework, enabling it to incorporate new functionalities such as detecting new classes of PPE, for example, should a job require new or more specialist equipment.
There are some limitations to this study concerning the algorithm, which would benefit from a faster frame rate to enable real-time prediction. The frame rate for processing the video images is about 2 fps which could be improved further by fine-tuning the hyperparameters of the algorithm. Moreover, the capacity for prediction suffers from the usual problems of occlusion and some color mismatching (especially for hard hats) which could be refined by using larger datasets in the future. The study also used supervised machine learning techniques, and future research would benefit from a combination of supervised and unsupervised techniques to generate more intelligent systems. The development of this business intelligence is an ongoing effort. The present models form one piece of larger frameworks, which could be evolved to completely automate safety monitoring without manual interventions. Such frameworks might use sensing technologies beyond vision to create an ability to understand the safety conditions in a more comprehensive manner. Future applications and technologies might make use of techniques such as the Internet of Things (IoT) and other big data to completely automate responses to hazards. These research directions present exciting opportunities for enhancing safety in the construction industry. This study has presented a cutting edge deep learning-based computer vision algorithm with substantial implications and applications that opens up possibilities for incorporating machine intelligence that can automatically predict and monitor safety.
Data Availability Statement
The datasets generated for this study are available on request to the corresponding author.
Ethics Statement
Written informed consent was obtained from the individual(s) for the publication of any potentially identifiable images or data included in this article.
Author Contributions
VD, RS, and AT were all actively involved in the research and in writing the manuscript. RS performed the basic coding for the study. VD and AT performed the idea generation, data collection and help in advanced coding. All authors contributed to the article and approved the submitted version.
Funding
This study forms part of a research project financially supported by the Indian Institute of Technology, Bombay (15IRCCSG001). The authors are sincerely thankful for this support.
Conflict of Interest
The authors declare that the research was conducted in the absence of any commercial or financial relationships that could be construed as a potential conflict of interest.
References
Bosche, F., Haas, C. T., and Akinci, B. (2009). Automated recognition of 3D CAD objects in site laser scans for project 3D status visualization and performance control. J. Comput. Civil Engin. 23, 311–318. doi: 10.1061/(ASCE)0887-3801(2009)23:6(311)
Cavazza, N., and Serpe, A. (2009). Effects of safety climate on safety norm violations: exploring the mediating role of attitudinal ambivalence toward personal protective equipment. J. Safe. Res. 40, 277–283. doi: 10.1016/j.jsr.2009.06.002
Cheng, T., and Teizer, J. (2013). Real-time resource location data collection and visualization technology for construction safety and activity monitoring applications. Automat. Construct. 34, 3–15. doi: 10.1016/j.autcon.2012.10.017
Chi, C.-F., Chang, T.-C., and Ting, H.-I. (2005). Accident patterns and prevention measures for fatal occupational falls in the construction industry. Appl. Ergonom. 36, 391–400. doi: 10.1016/j.apergo.2004.09.011
Chi, S., Caldas, C. H., and Kim, D. Y. (2009). A methodology for object identification and tracking in construction based on spatial modeling and image matching techniques. Comput. Aided Civil Infrastruct. Engin. 24, 199–211. doi: 10.1111/j.1467-8667.2008.00580.x
Choudhry, R. M., and Fang, D. (2008). Why operatives engage in unsafe work behavior: Investigating factors on construction sites. Safe. Sci. 46, 566–584. doi: 10.1016/j.ssci.2007.06.027
CIDC. (2014). Safety of Construction Work Force. Construction Industry Development Council Publication. New Delhi: CIDC
de Oliveira, C. S., Sanin, C., and Szczerbicki, E. (2018a). Flexible Knowledge–Vision–Integration Platform for Personal Protective Equipment Detection and Classification Using Hierarchical Convolutional Neural Networks and Active Leaning. Cybernet. Sys. 49, 355–367. doi: 10.1080/01969722.2017.1418714
de Oliveira, C. S., Sanin, C., and Szczerbicki, E. (2018b). “Video Classification Technology in a Knowledge-Vision-Integration Platform for Personal Protective Equipment Detection: An Evaluation,” in Asian Conference on Intelligent Information and Database Systems, (Berlin: Springer) 443–453. doi: 10.1007/978-3-319-75417-8_42
de Oliveira, C. S., Sanin, C., and Szczerbicki, E. (2019a). “Context-Aware Indexing and Retrieval for Cognitive Systems Using SOEKS and DDNA,” in International Conference on Information Systems Architecture and Technology, (Berlin: Springer) 7–16. doi: 10.1007/978-3-030-30440-9_2
de Oliveira, C. S., Sanin, C., and Szczerbicki, E. (2019b). “Towards knowledge formalization and sharing in a cognitive vision platform for hazard control (CVP-HC),” in Asian Conference on Intelligent Information and Database Systems, (Cham: Springer) 53–61. doi: 10.1007/978-3-030-14799-0_5
de Oliveira, C. S., Sanin, C., and Szczerbicki, E. (2020). “Image Representation for Cognitive Systems Using SOEKS and DDNA: A Case Study for PPE Compliance,” in Asian Conference on Intelligent Information and Database Systems, (Cham: Springer) 214–225. doi: 10.1007/978-3-030-41964-6_19
Debevec, P. E., Taylor, C. J., and Malik, J. (1996). “Modeling and rendering architecture from photographs: a hybrid geometry-and image-based approach,” in Proceedings of the 23rd Annual Conference on Computer Graphics and Interactive Techniques, 11–20.
Fang, Q., Li, H., Luo, X., Ding, L., Luo, H., and Li, C. (2018). Computer vision aided inspection on falling prevention measures for steeplejacks in an aerial environment. Automat. Construct. 93, 148–164. doi: 10.1016/j.autcon.2018.05.022
Fang, W., Ding, L., Zhong, B., Love, P. E. D., and Luo, H. (2018). Automated detection of workers and heavy equipment on construction sites: A convolutional neural network approach. Adv. Engin. Inform. 37, 139–149. doi: 10.1016/j.aei.2018.05.003
Gambatese, J., and Hinze, J. (1999). Addressing construction worker safety in the design phase: Designing for construction worker safety. Automat. Construct. 8, 643–649. doi: 10.1016/S0926-5805(98)00109-5
Golparvar-Fard, M., Peña-Mora, F., Arboleda, C. A., and Lee, S. (2009a). Visualization of construction progress monitoring with 4D simulation model overlaid on time-lapsed photographs. J. Comput. Civil Engin. 23, 391–404. doi: 10.1061/(ASCE)0887-3801(2009)23:6(391)
Golparvar-Fard, M., Peña-Mora, F., and Savarese, S. (2009b). D4AR–a 4-dimensional augmented reality model for automating construction progress monitoring data collection, processing and communication. J. Inform. Technol. Construct. 14, 129–153.
Golparvar-Fard, M., Peña-Mora, F., and Savarese, S. (2012). Automated progress monitoring using unordered daily construction photographs and IFC-based building information models. J. Comput. Civil Engin. 29:04014025. doi: 10.1061/(ASCE)CP.1943-5487.0000205
Han, S., Lee, S., and Peña-Mora, F. (2012). Vision-based detection of unsafe actions of a construction worker: Case study of ladder climbing. J. Comput. Civil Engin. 27, 635–644. doi: 10.1061/(ASCE)CP.1943-5487.0000279
Harville, M., and Li, D. (2004). “Fast, integrated person tracking and activity recognition with plan-view templates from a single stereo camera. Computer Vision and Pattern Recognition, 2004. CVPR 2004,” in Proceedings of the 2004 IEEE Computer Society Conference On, 2, II–398, (New York: IEEE).
Hinze, J., and Wiegand, F. (1992). Role of designers in construction worker safety. J. Construct. Engin. Manag. 118, 677–684. doi: 10.1061/(ASCE)0733-9364(1992)118:4(677)
Kim, C., Kim, B., and Kim, H. (2013). 4D CAD model updating using image processing-based construction progress monitoring. Automat. Construct. 35, 44–52. doi: 10.1016/j.autcon.2013.03.005
Krizhevsky, A., Sutskever, I., and Hinton, G. E. (2012). Imagenet classification with deep convolutional neural networks. Adv. Neural Inform. Proc. Sys. 60, 1097–1105.
Lawrence, S., Giles, C. L., Tsoi, A. C., and Back, A. D. (1997). Face recognition: A convolutional neural-network approach. IEEE Transac. Neural Net. 8, 98–113. doi: 10.1109/72.554195
Lee, G., Cho, J., Ham, S., Lee, T., Lee, G., Yun, S.-H., et al. (2012). A BIM-and sensor-based tower crane navigation system for blind lifts. Automat. Construct. 26, 1–10.
Levitt, R. E., and Samelson, N. M. (1993). Construction safety management. New Jersey: John Wiley & Sons.
Luo, X., Li, H., Wang, H., Wu, Z., Dai, F., and Cao, D. (2019). Vision-based detection and visualization of dynamic workspaces. Automat. Construct. 104, 1–13. doi: 10.1016/j.autcon.2019.04.001
Mahalingam, A., and Levitt, R. E. (2007). Safety issues on global projects. J. Construct. Engin. Manag. 133, 506–516. doi: 10.1061/(ASCE)0733-9364(2007)133:7(506)
Mneymneh, B. E., Abbas, M., and Khoury, H. (2019). Vision-Based Framework for Intelligent Monitoring of Hardhat Wearing on Construction Sites. J. Comput. Civil Engin. 33:813. doi: 10.1061/(ASCE)CP.1943-5487.0000813
Mohamed, S. (2002). Safety climate in construction site environments. J. f Construct. Engin. Manag. 128, 375–384. doi: 10.1061/(asce)0733-9364(2002)128:5(375)
Niu, X.-X., and Suen, C. Y. (2012). A novel hybrid CNN–SVM classifier for recognizing handwritten digits. Patt. Recogn. 45, 1318–1325. doi: 10.1016/j.patcog.2011.09.021
Park, M.-W., Koch, C., and Brilakis, I. (2011). Three-dimensional tracking of construction resources using an on-site camera system. J. Comput. Civil Engin. 26, 541–549. doi: 10.1061/(asce)cp.1943-5487.0000168
Patel, D. A., and Jha, K. N. (2014). Neural Network Approach for Safety Climate Prediction. J. Manag. Engin. 31:5014027.
Ray, S. J., and Teizer, J. (2012). Real-time construction worker posture analysis for ergonomics training. Adv. Engin. Inform. 26, 439–455. doi: 10.1016/j.aei.2012.02.011
Redmon, J., Divvala, S., Girshick, R., and Farhadi, A. (2016). “You only look once: Unified, real-time object detection,” in Proceedings of the IEEE Conference on Computer Vision and Pattern Recognition, (Cornell: Cornell University), 779–788.
Redmon, J., and Farhadi, A. (2018). Yolov3: An incremental improvement. ArXiv Preprint ArXiv 1804.02767. Washington: University of Washington.
Seo, J., Han, S., Lee, S., and Kim, H. (2015). Computer Vision techniques for construction safety and health monitoring. Adv. Engin. Inform. 29, 239–251. doi: 10.1016/j.aei.2015.02.001
Son, H., and Kim, C. (2010). 3D structural component recognition and modeling method using color and 3D data for construction progress monitoring. Automat. Construct. 19, 844–854. doi: 10.1016/j.autcon.2010.03.003
Szeliski, R. (2010). Computer vision: algorithms and applications. Berlin: Springer Science & Business Media.
Tam, C. M., Zeng, S. X., and Deng, Z. M. (2004). Identifying elements of poor construction safety management in China. Safe. Sci. 42, 569–586. doi: 10.1016/j.ssci.2003.09.001
Tang, P., Huber, D., Akinci, B., Lipman, R., and Lytle, A. (2010). Automatic reconstruction of as-built building information models from laser-scanned point clouds: A review of related techniques. Automat. Construct. 19, 829–843. doi: 10.1016/j.autcon.2010.06.007
Teizer, J., and Vela, P. A. (2009). Personnel tracking on construction sites using video cameras. Adv. Engin. Inform. 23, 452–462. doi: 10.1016/j.aei.2009.06.011
Teo, E. A. L., Ling, F. Y. Y., and Chong, A. F. W. (2005). Framework for project managers to manage construction safety. Int. J. Project Manag. 23, 329–341. doi: 10.1016/j.ijproman.2004.09.001
Toole, T. M. (2002). Construction site safety roles. J. Construct. Engin. Manag 128, 203–210. doi: 10.1061/(ASCE)0733-9364(2002)128:3(203)
Wang, M., Wong, P., Luo, H., Kumar, S., Delhi, V., and Cheng, J. (2019). “Predicting Safety Hazards Among Construction Workers and Equipment Using Computer Vision and Deep Learning Techniques,” in ISARC. Proceedings of the International Symposium on Automation and Robotics in Construction, (Netherland: Elsevier), Vol. 36, 399–406.
Yang, J., Vela, P., Teizer, J., and Shi, Z. (2012). Vision-based tower crane tracking for understanding construction activity. J. Comput. Civil Engin. 28, 103–112. doi: 10.1061/(ASCE)CP.1943-5487.0000242
Yu, Y., Li, H., Umer, W., Dong, C., Yang, X., and Skitmore, M. (2019). Automatic Biomechanical Workload Estimation for Construction Workers by Computer Vision and Smart Insoles. J. Comput. Civil Engin. 33:04019010. doi: 10.1061/(ASCE)CP.1943-5487.0000827
Zeiler, M. D., and Fergus, R. (2013). Visualizing and understanding convolutional networks (2013). ArXiv Preprint ArXiv 1311.2901. Netherland: Springer.
Keywords: construction safety, personal protective equipment, deep learning, object recognition, convolutional neural networks, computer vision
Citation: Delhi VSK, Sankarlal R and Thomas A (2020) Detection of Personal Protective Equipment (PPE) Compliance on Construction Site Using Computer Vision Based Deep Learning Techniques. Front. Built Environ. 6:136. doi: 10.3389/fbuil.2020.00136
Received: 05 March 2020; Accepted: 24 July 2020;
Published: 24 September 2020.
Edited by:
Dryver R. Huston, University of Vermont, United StatesReviewed by:
Edward Szczerbicki, The University of Newcastle, AustraliaRuoyu Jin, London South Bank University, United Kingdom
Copyright © 2020 Delhi, Sankarlal and Thomas. This is an open-access article distributed under the terms of the Creative Commons Attribution License (CC BY). The use, distribution or reproduction in other forums is permitted, provided the original author(s) and the copyright owner(s) are credited and that the original publication in this journal is cited, in accordance with accepted academic practice. No use, distribution or reproduction is permitted which does not comply with these terms.
*Correspondence: Venkata Santosh Kumar Delhi, venkatad@iitb.ac.in