Multidimensional Psychological Evaluation of Air Conditioner Sounds and Prediction via Correlation Parameters
 Yoshiharu Soeta1*
  Ei Onogawa2
- 1Biomedical Research Institute, National Institute of Advanced Industrial Science and Technology (AIST), Osaka, Japan
- 2Research and Innovation Center, Mitsubishi Heavy Industries, Aichi, Japan
Air conditioners are regarded as a major source of noise in built environments. Although noise control technology has reduced the sound produced by air conditioners to a comparatively low level, some people may still feel that certain aspects of the sound quality lead to discomfort. Indeed, both the sound level and the sound quality of an air conditioner can affect user’s acoustic comfort. The aim of this study was to determine the factors that significantly influence the subjective response to the sound of air conditioners. We assessed the A-weighted equivalent continuous sound pressure level (LAeq) and factors extracted from the autocorrelation function (ACF) and interaural cross-correlation (IACF). Subjective loudness, sharpness, and annoyance were evaluated using a paired comparison method. Multiple regression analyses were performed using a linear combination of LAeq, the ACF factors, IACF factors, and assessment of their standard deviations. The multiple regression analyses indicated that LAeq, the delay time of the first maximum peak, the width of the first decay of the ACF, and the magnitude and width of the IACF could predict subjective responses to air conditioner sounds.
Introduction
Electrical appliances and mechanical equipment such as air conditioners, refrigerators, and washing machines are regarded as main noise sources in built environments. Air conditioners are widely used in residential houses and offices and are generally in operation for long periods. Therefore, many efforts have been focused on reducing the sound pressure level (SPL) of these devices during operation. As a result, the SPLs of the devises are now relatively low (Ayr et al., 2001; Tang and Wong, 2004). However, some people may still feel annoyed by certain aspects of the sound quality, even when the SPL of simulated noises in residential houses is low (Oliva et al., 2017; Hongisto et al., 2019). Therefore, both the SPL and sound quality of an air conditioner are important for acoustic satisfaction.
Techniques for evaluating noise in built environments have been developed with an emphasis on frequency characteristics. Sound communication (SC) curves have been proposed to evaluate office noise including that created by air conditioners (Beranek, 1956). Similar to SC curves, noise criteria (NC) curves have also been developed (Beranek, 1957). The curves include octave bands from 63 to 8,000 Hz and are still widely used. Balanced noise criterion (NCB) curves have been proposed as a modified version of NC curves that consider spectral imbalances (Beranek, 1989). Room criteria (RC) curves and the revised version, termed RC Mark II curves, have also been developed to assess the spectrum balance and low-frequency vibrations of noise produced by heating, ventilating, and air conditioning systems (Blazier, 1981; Blazier, 1997). Room noise criterion (RNC) curves, which have been proposed to fill the gap between NCB and RC, consider the effect of temporal variations in low frequency sounds (Schomer, 2000). Noise measurements and questionnaire surveys in offices indicated that, when compared with several other indices, including the NC, NCB, RC Mark II, and RNC, the A-weighted equivalent SPL (LAeq) is the best index for evaluating subjective auditory sensations (Ayr et al., 2003).
The proposed noise indices mainly focus on the energy of sounds in terms of the frequency characteristics. Considering the characteristics of the human auditory system and the results of a large number of psychoacoustic experiments, psychoacoustic factors, such as loudness, sharpness, and roughness have been proposed for evaluating noise (Zwicker and Fastl, 1999). Previous studies have evaluated the relationships between psychoacoustic factors and subjective responses to air conditioner noises in a built environment (Lee et al., 2017; Soeta and Shimokura, 2017; Lee and Wang, 2018; Lee and Wang, 2020) and a vehicle (Leite et al., 2009; Yoon et al., 2012; Nakasaki et al., 2013; Wagner et al., 2014; Soeta et al., 2016). The results indicated that psychoacoustic factors are significant predictors of subjective responses.
As with other psychoacoustic factors, autocorrelation function (ACF) and interaural cross-correlation (IACF) factors have been proposed based on the results of psychological and physiological experiments (Soeta and Ando, 2015). The results indicated that ACF factors were significantly correlated with subjective preference and annoyance ratings for air conditioner noises in a built environment (Soeta and Shimokura, 2017) and a vehicle (Soeta et al., 2016). Analytical approaches using the ACF and IACF are advantageous in that they are based on human cerebral function, describe basic temporal sensations, such as loudness and pitch (Ando, 2009; Soeta and Ando, 2015), and have predictive power that is equivalent to that of psychoacoustic factors (Soeta et al., 2016; Soeta and Shimokura, 2017).
Tonal noises generated by air conditioners can be annoying (Landström, et al., 1991; Landström, et al., 1994; Ryherda and Wang, 2008). Several indices, such as the prominence ratio and tonal audibility, have been proposed to quantify the prominence, or tonality, of a tone (Lee et al., 2017; Lee and Wang, 2018; Lee and Wang, 2020). The analytical approach using the ACF can be used to quantify the perception of tonality. The peak amplitude of the ACF, ϕ1, is related to the bandwidth of a sound. The envelope decay of the ACF, τe,, reflects the degree to which a sound has repetitive components.
The semantic differential method has been widely used to measure affective content (Osgood et al., 1957). In many cases, three main dimensions can be obtained regardless of the object type and the cultural background of the participants (Osgood, 1960). A systematic literature review confirmed that the three main dimensions of sound are Evaluation, Potency, and Activity (Ma et al., 2018). Evaluation refers to general human judgment, Potency is the degree of sensitivity to magnitude, and Activity is the sensation of the temporal and spectral patterns of a sound. When the three perceptual dimensions of air conditioner noise were extracted (Susini et al., 2004), they correlated with the spectral contents, subjective loudness, and spectral centroid.
The aim of this study was to determine the ACF and IACF factors that were most dominant in the subjective responses to air conditioner sounds. We dealt with three main perceptual dimensions of sound: loudness as Potency, sharpness as Activity, and annoyance as Evaluation. The ACF and IACF are analysis methods based on the processing of temporal patterns of neural activities in the auditory system (Cariani and Delgutte, 1996; Saberi et al., 1998). This method could be helpful in improving the sound quality of air conditioners during the manufacturing process because it can be used to obtain information about problematic noise pitches and the spectral centroid of noise.
Methods
Analysis of Air Conditioner Sounds
We used a binaural microphone (BHS I, HEAD Acoustics) to measure sounds generated by three outlet units and one inlet unit of split-type air conditioners in an anechoic room. The number of compressor revolutions was set to 0–106 revolutions per second. The number of fan revolutions was set to 225–1,170 revolutions per minute. The outdoor unit was placed on the floor. The indoor unit was placed at a height of 1.8 m. The microphone was installed at a height of 1.6 m and a distance of 1.0 m for the outdoor unit and 3.3 m for the indoor unit. The experimental setup is shown in Figure 1. For all measurements, the generated sound was recorded via an analog-to-digital converter (SQuadrigaII, HEAD Acoustics) with a sampling rate of 48kHz and a resolution of 32 bits.
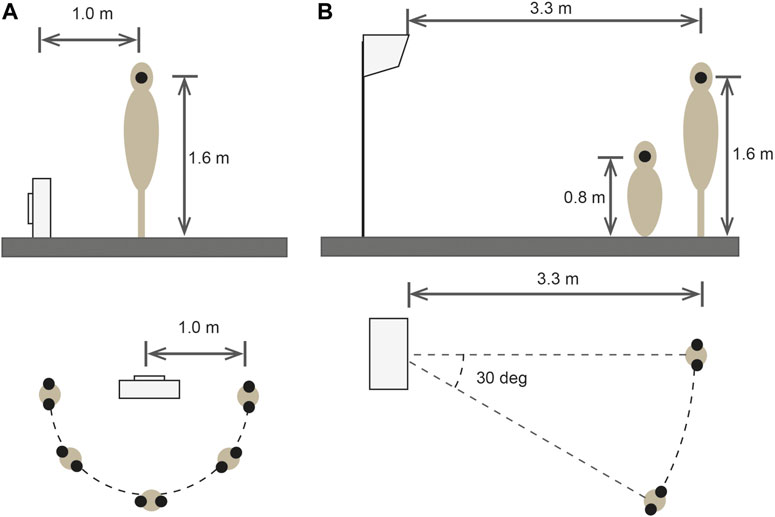
FIGURE 1. Installation of (A) outlet and (B) inlet air conditioner units in an anechoic room. The binaural microphone was placed at the ear position on the mannequin.
Factors determined from the ACF and IACF have been proposed for evaluating environmental noise and sound quality (Ando, 2009; Soeta and Ando, 2015). To determine the ACF and IACF factors in the present study, the normalized IACF of the signals recorded at the microphones representing the left and right ears, pl(t) and pr(t), respectively, as a function of the running step, s, was defined by
where
When the signal recorded at one ear was used, Eq. 1 defines the normalized ACF. 2T is the integration interval and p’(t) = p(t)*se(t). se(t) is the ear sensitivity, which, for convenience, represents the impulse response of an A-weighted filter (Ando, 2009; Soeta and Ando, 2015). The normalized ACF and IACF were calculated using the geometric mean of the energy at s and the energy at s+τ.
LAeq was determined from the A-weighted p(t) as a function of the running step, s. LAeq was calculated using
This indicates that the ACF includes LAeq as one of its factors. The other ACF factors determined from the normalized ACF are shown in Figure 2A. τ1 is defined as the delay time of the first maximum peak and related to the perceived pitch. ϕ1 is defined as the amplitude of the first maximum peak and related to the perceived pitch strength (Ando 2009; Soeta and Ando 2015). Higher values of τ1 and ϕ1 mean that the pitch of the sound is lower and stronger, respectively. The ϕ1 value is related to the bandwidth of a sound and increases as the bandwidth of a sound narrows. The effective duration of the ACF, τe, was defined by the ten-percentile delay of the envelope of the normalized ACF and represents a repetitive component including the sound source itself (Ando, 2009). The τe values for a pure tone and white noise are ∞ and almost zero, respectively. Sharply filtered bandpass noises have been found to have larger τe values compared with loosely filtered bandpass noises (Soeta et al., 2004). The other ACF factor, the width of the first decay, Wϕ(0), was defined using the delay time interval at a normalized ACF value of 0.5. Wϕ(0) is equivalent to the spectral centroid (Soeta and Ando, 2015). Higher values of Wϕ(0) mean that the sound contains more low frequency components.
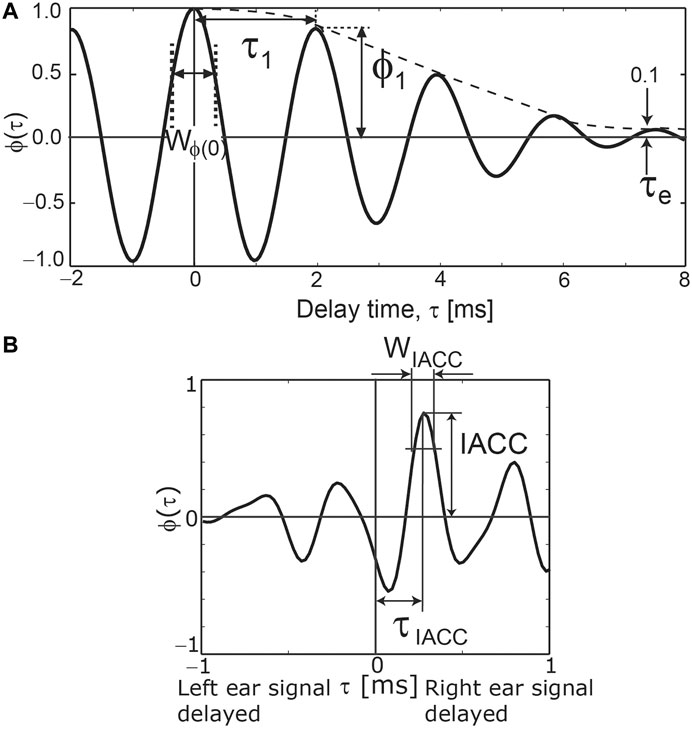
FIGURE 2. (A) Definitions of the ACF factors, τ1, ϕ1, τe, and Wϕ(0). (B) Definitions of the IACF factors, IACC, τIACC, and WIACC.
The interaural cross-correlation coefficient (IACC) is linked to the subjective diffuseness and apparent source width (Ando, 2009), and was defined by.
When the IACC is higher, a listener perceives a narrower sound image. The other IACF factors determined from the normalized IACF are shown in Figure 2B. τIACC is the interaural delay time at which IACC was defined and related to the sense of direction at low frequencies (Ando 2009). WIACC is the width of the IACF defined by the interval of the delay time at a value of δ below the IACC. WIACC depends on the frequency composition of the signals and is related to the apparent source width (Ando 2009).
To evaluate the noise characteristics both quantitatively and qualitatively, we calculated LAeq, τ1, ϕ1, Wϕ(0), τe, IACC, τIACC, and WIACC as a function of time. The integration interval, 2T, was 500 ms and the running step, s, was 1 ms in all calculations. The analysis was performed with A Matlab-based analysis program (Mathworks, Natick, MA).
Subjective Assessments
Fifteen stimuli were selected from the measured air conditioner noise samples based on the distribution of the ACF and IACF factors. Table 1 summarizes the mean ACF and IACF factors for the fifteen selected stimuli. Figures 3, 4 show the one-third octave band spectra and A-weighted sound pressure level with an integration time of 125 ms for the stimuli used in this study. The stimuli were presented to participants binaurally using a headphone amplifier (HDVD800, Sennheiser, Germany) and headphones (HD800, Sennheiser, Germany). Each stimulus was 2.0 s long and included a 0.1 s rise and fall ramp. Previous studies have indicated that participants can judge the loudness (Wright, 1947), sharpness (Hoechstetter et al., 2016), and annoyance (Hiramatsu et al., 1978) for sounds that are only 100 ms in duration. Thus, we considered 2 s to be sufficient for evaluating loudness, sharpness, and annoyance. The participants listened to the stimuli while sitting in a soundproof room with an ambient temperature of 22–25 degrees. All stimuli were presented at the same LAeq ± 0.2dB as the actual measured noises. LAeq was verified using a dummy head microphone (KU100, Neumann, Germany) and a sound calibrator (Type 4,231, Brüel and Kjær, Denmark).

TABLE 1. Range of mean ACF and IACF values obtained from air-conditioner sounds used in the subjective assessments.
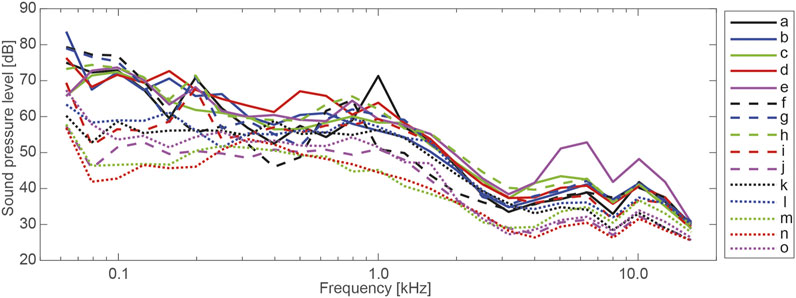
FIGURE 3. Measured one-third octave band spectra for 15 sounds used in the subjective assessments.
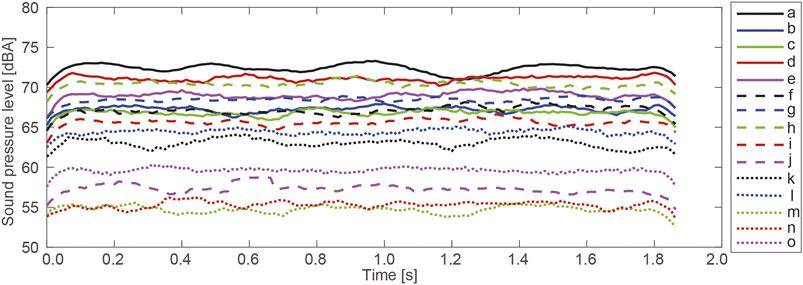
FIGURE 4. Measured A-weighted sound pressure level [dB] with an integration time of 125 ms for 15 sounds used in the subjective assessments.
We selected subjective loudness as Potency, subjective sharpness as Activity, and subjective annoyance as Evaluation to reflect the three perceptual dimensions (Ma et al., 2018). Subjective loudness, sharpness, and annoyance caused by air conditioner sounds were evaluated to clarify the effects of the ACF and IACF factors on each subjective response. Participants between 20 and 54 years of age (median age of 23.0 years) with normal hearing and no history of neurological diseases took part in the experiments. Fifteen participants (11 men) took part in the sharpness and annoyance experiment. Eight out of the fifteen (6 men) participated in the loudness experiment. Seven participants (4 men) took part in the loudness experiment only. According to our previous studies, we considered the involvement of at least ten participants to be necessary to ensure sufficient statistical power (Soeta et al., 2016; Soeta and Shimokura 2017; Soeta and Kagawa 2020). The normality of the scale values of loudness, sharpness, and annoyance was tested using the Shapiro-Wilk test (Shapiro and Wilk 1965). The results indicated scale values of loudness, sharpness, and annoyance except for one stimulus (f) were normally distributed. Informed consent was obtained from each participant after the key elements of the study was explained. The study protocol was approved by the ethics committee of the National Institute of Advanced Industrial Science and Technology (AIST) of Japan.
In Scheffé's method (Scheffé, 1952), one combination is assigned to each participant for comparison. In the modified Scheffé’s method, a pairwise comparison is performed between one iteration with one participant and another iteration with a different participant (Sato, 1985; Nagasawa, 2002). In our experiment, all combinations of pairs (i.e., 105 pairs (N(N−1)/2, N = 15) were presented in random order for each participant, and the presentation order within each pair was randomized. The silent interval between the stimuli was 1.0 s long. After the presentation of each pair, the participants were asked to judge which stimulus from each pair was louder, sharper, or more annoying using a seven-point scale. Judgements were made using one of seven statements. For example, in the case of loudness, participants were asked to select one of the following: I perceived sound i as strongly louder than sound j (3 points); I perceived i as moderately louder than j (2 points); I perceived i as slightly louder than j (1 point); I perceived the loudness of the two sounds to be equal (0 point); I perceived j as slightly louder than i (−1 point); I perceived j as moderately louder than i (−2 points); I perceived j as strongly louder than i (−3 points). The averaged values were calculated and defined as scale values (SVs) of loudness. An analysis of variance (ANOVA) was then carried out on the results of the paired comparison experiments (Sato, 1985; Nagasawa, 2002).
To calculate the effects of ACF and IACF characteristics on participant loudness, sharpness, and annoyance, multiple regression analyses were carried out using a linear combination of the mean ACF and IACF factors and their standard deviations (SDs) as predictive variables. The outcome variables were the SVs of loudness, sharpness, and annoyance for all participants. Stepwise selection of the predictive variables was applied by successively adding or removing variables. The step criteria applied for entry and removal were based on the statistical significance level of the F-value, which was set at 0.05 and 0.10, respectively. Predictive variables with a variance inflation factor of 3.0 or more were excluded to avoid multicollinearity. The analyses were performed with SPSS software (SPSS version 22.0, IBM Corp., NY).
Results
The ANOVA for the scale values revealed that the main effect (i.e., the differences between the stimuli) was statistically significant (F (14, 2,834) = 581.22, p < 0.001, for loudness, F (14, 2,834) = 586.84, p < 0.001, for sharpness, and F (14, 2,834) = 390.80, p < 0.001, for annoyance). Figure 5 shows the scale values for loudness, sharpness, and annoyance. Loudness and annoyance exhibited a similar tendency. The correlation coefficients among loudness, sharpness, and annoyance are shown in Table 2. Loudness was highly correlated with sharpness and annoyance although they are proposed as independent psychological dimensions (Ma et al., 2018). This might have been caused by the relatively narrow range of physical parameters produced by a small number of air conditioners (three outlet units and one inlet unit).
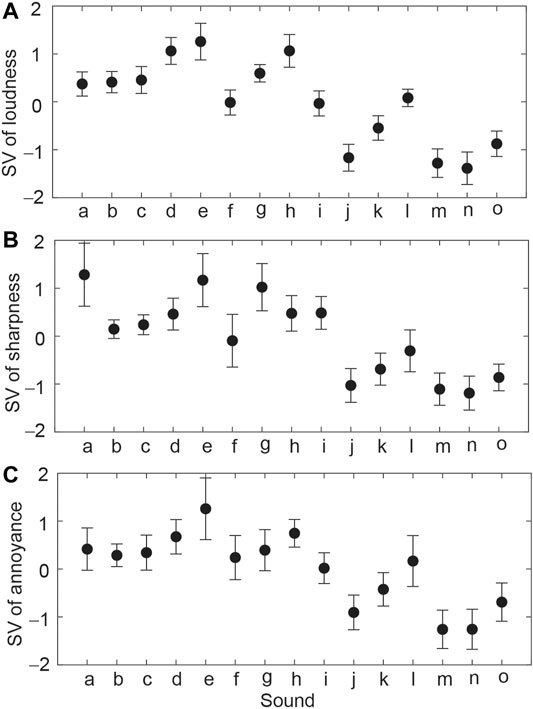
FIGURE 5. Scale values of (A) loudness, (B) sharpness, and (C) annoyance for each participant. The symbols indicate the mean values and the error bars indicate the standard deviations.
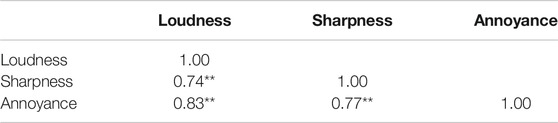
TABLE 2. Correlation coefficients among subjective loudness, annoyance, and sharpness.
Figures 6–8 show the relationship between each ACF/IACF factor and loudness, sharpness, and annoyance scores, respectively. Scale values of loudness were highly correlated with LAeq (r = 0.84, p < 0.01), τ1 (r = 0.55, p < 0.01), ϕ1 (r = 0.52, p < 0.01), and the SD of τ1 (r = −0.55, p < 0.01). Scale values of sharpness were highly positively correlated with LAeq (r = 0.79, p < 0.01), ϕ1 (r = 0.70, p < 0.01), and τe (r = 0.69, p < 0.01). Scale values of annoyance were highly positively correlated with LAeq (r = 0.79, p < 0.01) and ϕ1 (r = 0.52, p < 0.01).
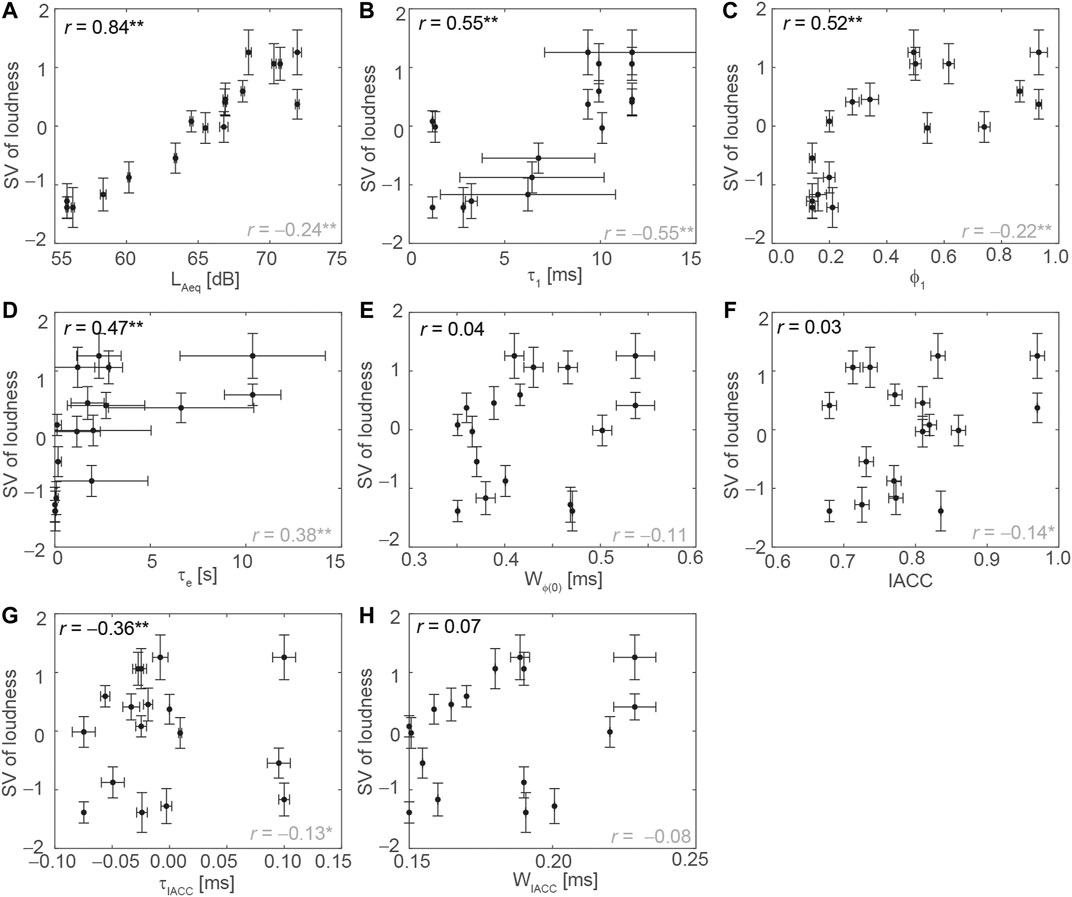
FIGURE 6. Relationship between correlation parameters and the scale values of loudness. (A)LAeq, (B)τ1, (C)ϕ1, (D)τe, (E)Wϕ(0), (F) IACC, (G)τIACC, and (H)WIACC. The symbols indicate the mean values and the error bars indicate the SDs. The correlation coefficients of the mean and SDs are shown in black and gray, respectively. Asterisks represent the level of significance, i.e., **p < 0.01, *p < 0.05.
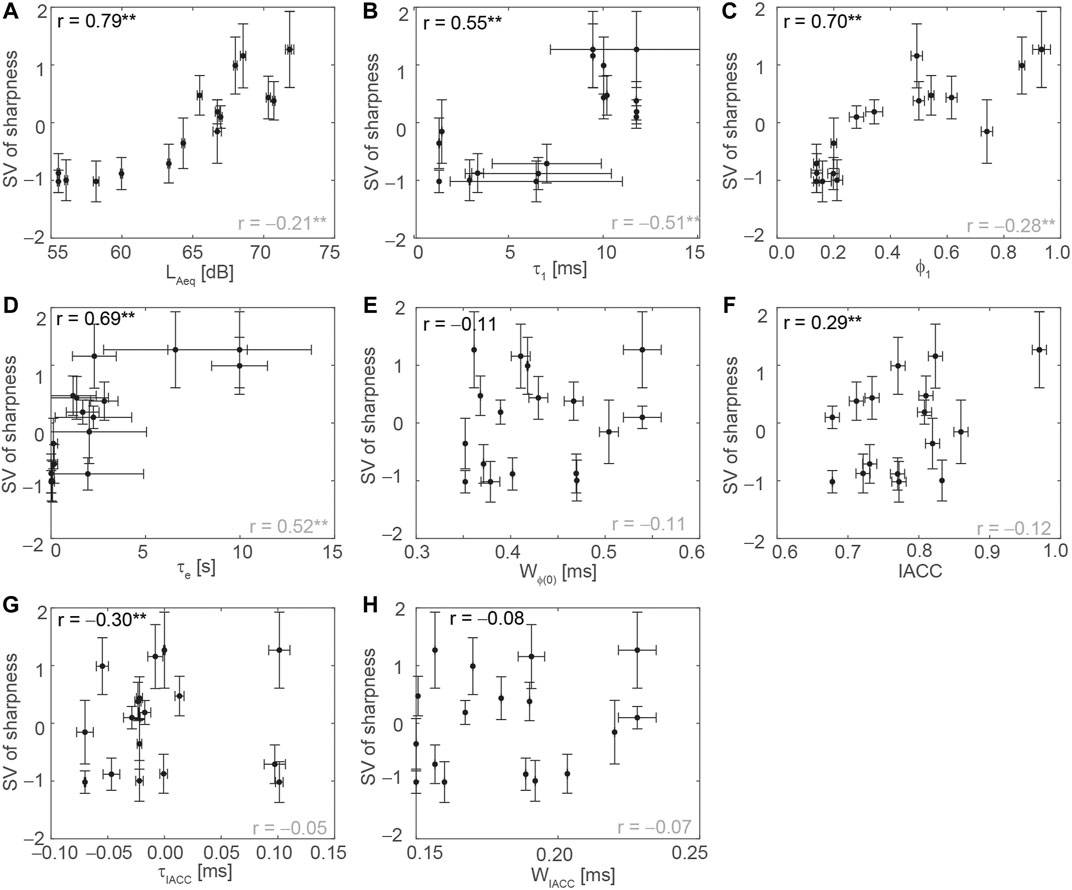
FIGURE 7. Relationship between correlation parameters and the scale values of sharpness. (A)LAeq, (B)τ1, (C)ϕ1, (D)τe, (E)Wϕ(0), (F) IACC, (G)τIACC, and (H)WIACC. The symbols indicate the mean values and the error bars indicate the SDs. The correlation coefficients of the mean and SDs are shown in black and gray, respectively. Asterisks represent the level of significance, i.e., **p < 0.01, *p < 0.05.
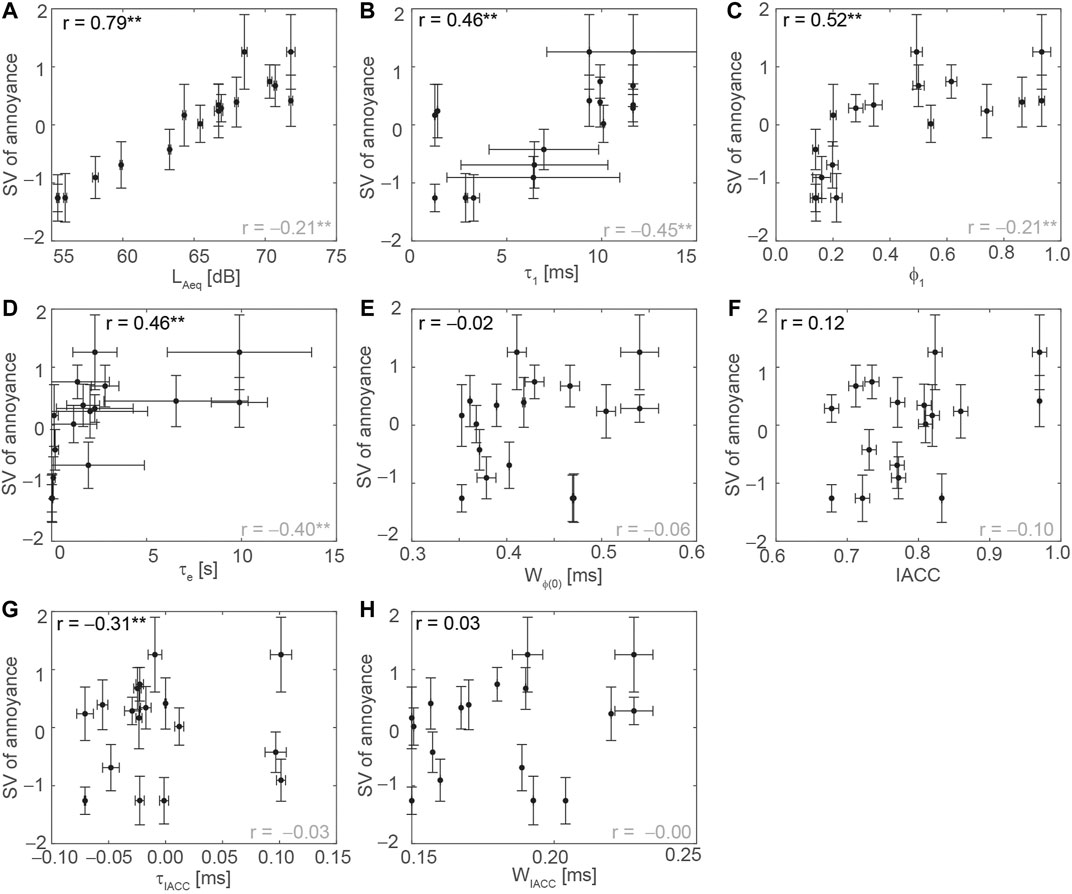
FIGURE 8. Relationship between correlation parameters and the scale values of annoyance. (A)LAeq, (B)τ1, (C)ϕ1, (D)τe, (E)Wϕ(0), (F) IACC, (G) τIACC, and (H)WIACC. The symbols indicate the mean values and the error bars indicate the SDs. The correlation coefficients of the mean and SDs are shown in black and gray, respectively. Asterisks represent the level of significance, i.e., **p < 0.01, *p < 0.05.
The final models of the multiple linear regression analysis and the standardized partial regression coefficients were as follows:
The model was statistically significant (F (4, 220) = 269.97, p < 0.001, for loudness (F (5, 219) = 121.80, p < 0.001, for sharpness, F (2, 222) = 224.49, p < 0.001, for annoyance), and the adjusted coefficient of determination, R2, was 0.83 for loudness, 0.73 for sharpness, and 0.67 for annoyance.
Discussion
LAeq has been found to be a consistently significant factor influencing annoyance of air conditioner sounds (Ayr et al., 2001; Ayr et al., 2003). The multiple linear regression analysis showed that the energy-index of LAeq was the significant factor influencing the perception of loudness, sharpness, and annoyance of air conditioner sounds. The regression coefficients were all positive, suggesting that higher LAeq values are associated with louder, sharper, and more annoying sounds. A previous study indicated that ϕ1 was a significant factor and LAeq was not a significant factor influencing annoyance (Soeta and Shimokura, 2017), which is not consistent with the present finding. A possible reason for this discrepancy might be the differing LAeq range between the two studies. Specifically, the present study had a higher and broader range of LAeq values. The effect of LAeq may have been much greater than that of ϕ1 in the present study.
The temporal variation in the energy-index of LAeq, denoted as the SD of LAeq, was also a significant factor in predicting loudness and annoyance. This is consistent with previous findings regarding loudness (Soeta and Kagawa, 2020) and annoyance (Fujii et al., 2002; Sato et al., 2007; Jeon and Sato, 2008; Gille et al., 2017; Soeta and Kagawa, 2020), and confirms that not only LAeq, but also the temporal variation of LAeq, has a large influence on subjective response. Although the partial coefficients for the SD of LAeq were positive in previous studies, they were negative in this study. Further, the SDs of LAeq were much smaller than those in previous studies (Fujii et al., 2002; Jeon and Sato, 2008; Gille et al., 2017; Soeta and Kagawa, 2020). The large differences in temporal variation might have an influence on the subjective responses.
The sharpness of a sound is determined by the balance of high frequency and low frequency components (Zwicker and Fastl, 1999), such that sounds with more high frequency components are perceived to be sharper. We expected that the Wϕ(0) would be negatively correlated with subjective sharpness in the present study, and found this to be the case. This indicates that Wϕ(0) is a significant predictor of characteristics in the Activity dimension, which is consistent with previous findings regarding airplane noise (Soeta and Kagawa, 2020). The ACF factor, τe, shows the degree to which a sound has repetitive components. In this study, τe was a significant factor in predicting sharpness with a positive partial coefficient, suggesting that the sharpness of the frequency bandwidth might determine whether sounds are perceived as sharp.
The binaural index, IACC, was a significant factor in predicting loudness, with a negative regression coefficient. This suggests that air conditioner sounds with lower IACC values, which have wider sound images (Ando, 2009), could be perceived as louder. This is consistent with the previous findings regarding airplane noise (Soeta and Kagawa, 2020). In addition, previous studies have indicated that IACC is a significant predictor of annoyance for floor impact sounds (Jeon and Sato, 2008; Jeon et al., 2009). This suggests that IACC could be a significant predictor of subjective evaluations of sounds.
Conclusion
We analyzed multidimensional psychological responses to air conditioner sounds to determine the factors that significantly influence subjective perceptions of loudness, sharpness, and annoyance in this context. The results indicated that the LAeq, τ1, and the temporal variation of τ1, among other factors, significantly influenced subjective responses. This indicates that factors influencing the ACF and IACF are useful indices for the evaluation of air conditioner sounds.
Data Availability Statement
The raw data supporting the conclusions of this article are available on request to the corresponding author.
Ethics Statement
The studies involving human participants were reviewed and approved by The ethics committee of the National Institute of Advanced Industrial Science and Technology (AIST). The patients/participants provided their written informed consent to participate in this study.
Author Contributions
Both authors have been involved in the design, experiment, and analysis of this study.
Funding
This work was partly supported by a Grant-in-Aid for Scientific Research (B) (Grant No. 18H03324) from the Japan Society for the Promotion of Science.
Conflict of Interest
EO was employed by Mitsubishi Heavy Industries.
The remaining author declares that the research was conducted in the absence of any commercial or financial relationships that could be construed as a potential conflict of interest.
Acknowledgments
We thank Sydney Koke, MFA, from Edanz Group (https://en-author-services.edanz.com/ac) for editing a draft of this manuscript.
References
Ayr, U., Cirillo, E., and Martellotta, F. (2001). An Experimental Study on Noise Indices in Air Conditioned Offices. Appl. Acoust. 62, 633–643. doi:10.1016/S0003-682X(00)00072-4
Ayr, U., Cirillo, E., Fato, I., and Martellotta, F. (2003). A New Approach to Assessing the Performance of Noise Indices in Buildings. Appl. Acoust. 64, 129–145. doi:10.1016/S0003-682X(02)00075-0
Beranek, L. L. (1956). Criteria for Office Quieting Based on Questionnaire Rating Studies. J. Acoust. Soc. America 28, 833–852. doi:10.1121/1.39824310.1121/1.1908489
Beranek, L. L. (1957). Revised Criteria for Noise in Buildings. Noise Control 3, 19–27. doi:10.1121/1.2369239
Beranek, L. L. (1989). Balanced Noise‐criterion (NCB) Curves. The J. Acoust. Soc. Am. 86, 650–664. doi:10.1121/1.398243
Blazier, W. E. (1981). Revised Noise Criterion for Application in the Acoustical Design and Rating of HVAC Systems. Noise Control. Eng. J. 16, 64–73. doi:10.3397/1.2832172
Blazier, W. E. (1997). RC Mark II: A Refined Procedure for Rating the Noise of Heating, Ventilating, and Air Conditioning (HVAC) Systems in Buildings. Noise Control. Eng. J. 45, 243–250. doi:10.3397/1.2828446
Cariani, P. A., and Delgutte, B. (1996). Neural Correlates of the Pitch of Complex Tones. I. Pitch and Pitch Salience. J. Neurophysiol. 76, 1698–1716. doi:10.1152/jn.1996.76.3.1698
Fujii, K., Atagi, J., and Ando, Y. (2002). Temporal and Spatial Factors of Traffic Noise and its Annoyance. J. Temp Des. Archit Environ. 2, 33–41.
Gille, L.-A., Marquis-Favre, C., and Weber, R. (2017). Aircraft Noise Annoyance Modeling: Consideration of Noise Sensitivity and of Different Annoying Acoustical Characteristics. Appl. Acoust. 115, 139–149. doi:10.1016/j.apacoust.2016.08.022
Hiramatsu, K., Takagi, K., Yamamoto, T., and Ikeno, J. (1978). The Effect of Sound Duration on Annoyance. J. Sound Vibration 59, 511–520. doi:10.1016/S0022-460X(78)80131-X
Hoechstetter, M., SautterGabbert, J.-M. U., Gabbert, U., and Verhey, J. L. (2016). Role of the Duration of Sharpness in the Perceived Quality of Impulsive Vehicle Sounds. Acta Acustica united with Acustica 102, 119–128. doi:10.3813/AAA.918929
Hongisto, V., Saarinen, P., and Oliva, D. (2019). Annoyance of Low-Level Tonal Sounds - A Penalty Model. Appl. Acoust. 145, 358–361. doi:10.1016/j.apacoust.2018.09.023
Jeon, J. Y., and Sato, S. (2008). Annoyance Caused by Heavyweight Floor Impact Sounds in Relation to the Autocorrelation Function and Sound Quality Metrics. J. Sound Vibration 311, 767–785. doi:10.1016/j.jsv.2007.09.029
Jeon, J. Y., Lee, P. J., Kim, J. H., and Yoo, S. Y. (2009). Subjective Evaluation of Heavy-Weight Floor Impact Sounds in Relation to Spatial Characteristics. J. Acoust. Soc. Am. 125, 2987–2794. doi:10.1121/1.3081390
Landström, U., Kjellberg, A., Söderberg, L., and Nordström, B. (1991). The Effects of Broadband, Tonal and Masked Ventilation Noise on Performance, Wakefulness and Annoyance. J. Low Frequency Noise, Vibration Active Control. 10, 112–122. doi:10.1177/026309239101000402
Landström, U., Kjellberg, A., SÖDerberg, L., and Nordström, B. (1994). Measures against Ventilation Noise - Which Tone Frequencies Are Least and Most Annoying? J. Low Frequency Noise, Vibration Active Control. 13, 81–88. doi:10.1177/026309239401300301
Lee, J., and Wang, L. M. (2018). Development of a Model to Predict the Likelihood of Complaints Due to Assorted Tone-In-Noise Combinations. J. Acoust. Soc. Am. 143, 2697–2707. doi:10.1121/1.5036731
Lee, J., and Wang, L. M. (2020). Investigating Multidimensional Characteristics of Noise Signals with Tones from Building Mechanical Systems and Their Effects on Annoyance. J. Acoust. Soc. Am. 147, 108–124. doi:10.1121/10.0000487
Lee, J., Francis, J. M., and Wang, L. M. (2017). How Tonality and Loudness of Noise Relate to Annoyance and Task Performance. Noise Cont. Eng. J. 65, 71–82. doi:10.3397/1/376427
Leite, R. P., Paul, S., and Gerges, S. N. Y. (2009). A Sound Quality-Based Investigation of the HVAC System Noise of an Automobile Model. Appl. Acoust. 70, 636–645. doi:10.1016/j.apacoust.2008.06.010
Ma, K. W., Wong, H. M., and Mak, C. M. (2018). A Systematic Review of Human Perceptual Dimensions of Sound: Meta-Analysis of Semantic Differential Method Applications to Indoor and Outdoor Sounds. Building Environ. 133, 123–150. doi:10.1016/j.buildenv.2018.02.021
Nagasawa, S. Y. (2002). Improvement of the Scheffé's Method for Paired Comparisons. KANSEI Eng. Int. 3, 47–56. doi:10.5100/jje.27.Supplement_22810.5057/kei.3.3_47
Nakasaki, R., Hasegawa, H., Kasuga, M., Kobayashi, R., Hasegawa, H., and Kasuga, M. (2013). Evaluation of Air-Conditioning Sounds in a Vehicle to Determine Thermal Feelings Using Psychoacoustic Parameters. Acoust. Sci. Tech. 34, 159–165. doi:10.1250/ast.34.159
Oliva, D., Hongisto, V., Hongisto, V., and Haapakangas, A. (2017). Annoyance of Low-Level Tonal Sounds - Factors Affecting the Penalty. Building Environ. 123, 404–414. doi:10.1016/j.buildenv.2017.07.017
Osgood, C. E., Suci, G., and Tannenbaum, P. H. (1957). The Measurement of Meaning. Urbana: University of Illinois Press.
Osgood, C. E. (1960). The Cross-Cultural Generality of Visual-Verbal Synesthetic Tendencies. Behav. Sci. 5, 146–169.
Ryherd, E. E., and Wang, L. M. (2008). Implications of Human Performance and Perception under Tonal Noise Conditions on Indoor Noise Criteria. J. Acoust. Soc. America 124, 218–226. doi:10.1121/1.2932075
Saberi, K., Takahashi, Y., Konishi, M., Albeck, Y., Arthur, B. J., and Farahbod, H. (1998). Effects of Interaural Decorrelation on Neural and Behavioral Detection of Spatial Cues. Neuron 21, 789–798. doi:10.1016/S0896-6273(00)80595-4
Sato, S., You, J., and Jeon, J. Y. (2007). Sound Quality Characteristics of Refrigerator Noise in Real Living Environments with Relation to Psychoacoustical and Autocorrelation Function Parameters. J. Acoust. Soc. Am. 122, 314–325. doi:10.1121/1.2739440
Scheffé, H. (1952). An Analysis of Variance for Paired Comparisons. J. Am. Stat. Assoc. 47, 381–400. doi:10.2307/2281310
Schomer, P. D. (2000). Proposed Revisions to Room Noise Criteria. Noise Control. Eng. J. 48, 85–96. doi:10.3397/1.2827970
Shapiro, S. S., and Wilk, M. B. (1965). An Analysis of Variance Test for Normality (Complete Samples). Biometrika 52, 591–611. doi:10.1093/biomet/52.3-4.591
Soeta, Y., and Ando, Y. (2015). Neurally Based Measurement and Evaluation of Environmental Noise. Tokyo, Japan: Springer. doi:10.1007/978-4-431-55432-5
Soeta, Y., and Kagawa, H. (2020). Three Dimensional Psychological Evaluation of Aircraft Noise and Prediction by Physical Parameters. Building Environ. 167, 106445. doi:10.1016/j.buildenv.2019.106445
Soeta, Y., and Shimokura, R. (2017). Sound Quality Evaluation of Air-Conditioner Noise Based on Factors of the Autocorrelation Function. Appl. Acoust. 124, 11–19. doi:10.1016/j.apacoust.2017.03.015
Soeta, Y., Maruo, T., and Ando, Y. (2004). Annoyance of Bandpass-Filtered Noises in Relation to the Factor Extracted from Autocorrelation Function (L). J. Acoust. Soc. Am. 116, 3275–3278. doi:10.1121/1.1782931
Soeta, Y., Nakagawa, S., Kamiya, Y., and Kamiya, M. (2016). Subjective Preference for Air-Conditioner Sounds inside a Car in Summer and Winter. J. Ergon. 6, 170. doi:10.4172/2165-7556.1000170
Susini, P., McAdams, S., Winsberg, S., Perry, I., Vieillard, S., and Rodet, X. (2004). Characterizing the Sound Quality of Air-Conditioning Noise. Appl. Acoust. 65, 763–790. doi:10.1016/j.apacoust.2004.02.003
Tang, S. K., and Wong, M. Y. (2004). On Noise Indices for Domestic Air Conditioners. J. Sound Vibration 274, 1–12. doi:10.1016/S0022-460X(03)00567-4
Wagner, V., Enigk, H., Beitz, T., and Kallus, K. W. (2014). Subjective and Objective Evaluation of the Air Conditioning Sound. J. Ergon. 4, 131. doi:10.4172/2165-7556.1000131
Wright, H. N. (1947). The Growth of Auditory Sensation. J. Acoust. Soc. Am. 19, 584–591. doi:10.1121/1.1916525
Yoon, J.-H., Yang, I.-H., Jeong, J.-E., Park, S.-G., and Oh, J.-E. (2012). Reliability Improvement of a Sound Quality Index for a Vehicle HVAC System Using a Regression and Neural Network Model. Appl. Acoust. 73, 1099–1103. doi:10.1016/j.apacoust.2012.02.018
Keywords: air conditioner, correlation parameter, loudness, sharpness, annoyance
Citation: Soeta Y and Onogawa E (2021) Multidimensional Psychological Evaluation of Air Conditioner Sounds and Prediction via Correlation Parameters. Front. Built Environ. 7:659115. doi: 10.3389/fbuil.2021.659115
Received: 27 January 2021; Accepted: 30 April 2021;
Published: 13 May 2021.
Edited by:
Louena Shtrepi, Politecnico di Torino, ItalyReviewed by:
Jin Yong Jeon, Hanyang University, South KoreaLily M. Wang, University of Nebraska — Lincoln, United States
Valtteri Hongisto, Turku University of Applied Sciences, Finland
Copyright © 2021 Soeta and Onogawa. This is an open-access article distributed under the terms of the Creative Commons Attribution License (CC BY). The use, distribution or reproduction in other forums is permitted, provided the original author(s) and the copyright owner(s) are credited and that the original publication in this journal is cited, in accordance with accepted academic practice. No use, distribution or reproduction is permitted which does not comply with these terms.
*Correspondence: Yoshiharu Soeta, y.soeta@aist.go.jp