Seasonal and Inter-annual Variation of Evapotranspiration in Amazonia Based on Precipitation, River Discharge and Gravity Anomaly Data
 Linghui Sun1
  Jessica C. A. Baker2
  Emanuel Gloor1*
  Dominick Spracklen2
  Hartmut Boesch3 Peter Somkuti3 Eduardo Maeda4 Wolfgang Buermann5
- 1School of Geography, University of Leeds, Leeds, United Kingdom
- 2School of Earth and Environment, University of Leeds, Leeds, United Kingdom
- 3Department of Physics and Astronomy, University of Leicester, Leicester, United Kingdom
- 4Department of Geosciences and Geography, University of Helsinki, Helsinki, Finland
- 5Institut fuer Geographie, University of Augsburg, Augsburg, Germany
We analyzed seasonal and spatial variations of evapotranspiration (ET) for five Amazon sub-basins and their response to the 2015/16 El Niño episode using a recently developed water-budget approach. ET varied typically between ~7 and 10 cm/month with exception of the Xingu basin for which it varied between 10 and 15 cm/month. Outstanding features of ET seasonality are (i) generally weak seasonality, (ii) two ET peaks for the two very wet catchments Solimões and Negro, with one occurring during the wet season and one during the drier season, and (iii) a steady increase of ET during the second half of the dry season for the three drier catchments (Madeira, Tapajos, Xingu). Peak ET occurs during the first half of the wet season consistent with leaf flush occurring before the onset of the wet season. With regards to inter-annual variation, we found firstly that for the Solimões and Madeira catchments the period with large positive wet season anomalies (2012–2015) is associated with negative ET anomalies, and negative SIF (solar induced fluorescence) anomalies. Furthermore, we found negative ET of several cm/months and SIF (up to 50%) anomalies for most of the Amazon basin during the 2015/16 El Niño event suggesting down-regulation of productivity as a main factor of positive carbon flux anomalies during anomalously hot and dry conditions. These results are of interest in view of predicted warmer and more erratic future climate conditions.
Introduction
The Amazon is one of the most significant watersheds on the Earth (Foley et al., 2002). With a vast network of freshwater systems containing watercourses, and extended seasonal floodplains, Amazonia plays a vital role in the global hydrological cycle. It discharges approximately 20% of the Earth's freshwater to the sea (Foley et al., 2002). Moreover, the Amazon basin contains the largest area of tropical rainforest (e.g., Hansen et al., 2013). These forests contribute nearly 10% of the Earth's terrestrial productivity and vegetation biomass (Brienen et al., 2015), and provide habitats to numerous animal and plant species (Foley et al., 2002). The forests exchange large quantities of energy and water with the atmosphere (Choudhury et al., 1998; Hasler and Avissar, 2007). These fluxes contribute to tropical convection, and possibly help trigger the onset of the wet season (Hasler and Avissar, 2007; Wright et al., 2017). The forests thus influence local, regional and, to some extent, global climate (Meir and Grace, 2005).
The Amazon humid forests experience pressures from human development of the region as well as a changing climate. Development inside the region includes the growth of cities like Manaus, and construction of roads and dams (Barber et al., 2014; Fearnside, 2014), which increasingly lead to pressure on the status of protected areas. Concentrated primarily along the fringes of the remaining Amazon forest, large-scale deforestation for the purpose of agriculture has led to the conversion of approximately 20% of the original forested area (Davidson et al., 2012). Furthermore, a rise in small-scale deforestation across the Amazon has recently been reported (Aragão et al., 2018; Kalamandeen et al., 2018). Deforestation has been shown to lead to decreases in evapotranspiration (ET) during the dry season (Hodnett et al., 1995; Zhang et al., 2001; Spracklen et al., 2012).
The main features of observed recent climate change are rapid warming and an increase in the frequency of droughts and severe floods (Figure 1; Barichivich et al., 2018; Gloor et al., 2018). These trends are modulated by regularly recurring El Niño events as well as tropical Atlantic sea surface temperature anomalies not related to El Niño (Ronchail et al., 2002; Zeng et al., 2008), which cause strong additional positive temperature anomalies and drought conditions for substantial parts of the Amazon. These ongoing climate shifts are expected to affect humid forest functioning and performance. Indeed tree mortality has been observed to increase in the regions which experienced drier than usual conditions in 2005 (Phillips et al., 2009) and alterations of carbon and water cycling dynamics cause lagged effects for years after drought episodes (Saleska et al., 2003; Meir and Grace, 2005; Qian et al., 2008; Phillips et al., 2010). One measure of plant functioning is ET (evapotranspiration). Water is released to the atmosphere when stomata are open thereby cooling leaves. Stomata need to be open for carbon uptake, thus water loss is linked to plant productivity. Changes in ET can therefore be an indicator of changes in tropical forest productivity.
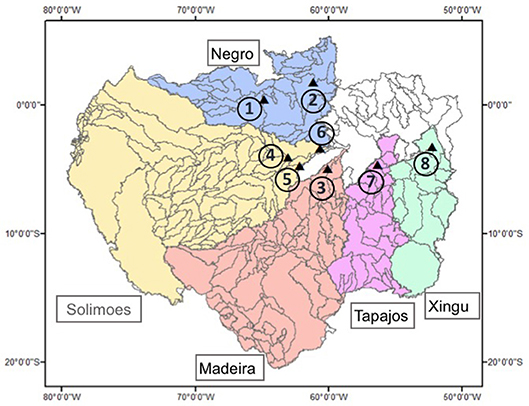
Figure 1. Amazon watershed with sub catchments. Black dots refer to location of gauge stations from where we used river discharge records in this study.
Given the increasing variability of Amazon climate and the rapid warming, here we investigate inter-annual variability of ET and possible indications of large-scale shifts over time as an indicator of changes in humid forest functioning. Events which are of particular interest include episodes with drier than usual conditions in parts of Amazonia, such as the droughts of 2005 and 2010 (Phillips et al., 2009; Feldpausch et al., 2016) and the recent 2015/16 El Niño event.
A variety of remote sensing estimates for ET exist but a comparison study has revealed that these estimates differ strongly during climate extremes (Miralles et al., 2016). We therefore decided to use basin-scale balances of precipitation and runoff, taking into account terrestrial water storage, which cannot be neglected when estimating ET over seasonal timescales. This extends studies estimating long-term mean annual evaporation based solely on precipitation and basin-scale river discharge (summarized in Marengo, 2006). The method has become possible with the commencement of the Gravity Recovery and Climate Experiment (GRACE) satellite mission, which measures gravity anomalies and thus can be used to estimate terrestrial water storage anomalies (Rodell et al., 2011). The approach has been applied before to the Amazon basin (Maeda et al., 2017; Swann and Koven, 2017), with these studies focusing on understanding the seasonal cycle of Amazon ET and spatial patterns of seasonality, but not inter-annual variation and system responses to strong climate anomalies.
Our focus here is primarily on ET responses to anomalous climate conditions, particularly the 2015/16 El Niño event. We examine how ET relates to measures of forest functioning, quantified here using remote sensing of vegetation photosynthesis diagnosed by solar-induced fluorescence (SIF). To provide a background for the analysis of anomalies and put our study in perspective with other studies we first investigate mean seasonal patterns and their relation to climate and vegetation photosynthetic activity.
Important insights about the magnitude, seasonality and controls on ET at the local scale have been previously gained from eddy flux ET measurements at a few sites in the Amazon (Vourlitis et al., 2002, 2015; Da Rocha et al., 2009; Costa et al., 2010). Based on such records from three wet rainforest sites and two seasonally dry sites, Costa et al. (2010) concluded that (i) “…evapotranspiration in the dry season is higher than that in the wet season and that surface net radiation is the main controller of evapotranspiration in wet equatorial sites” (Manaus record: ET = 3.4 and 3.7 mm d−1 and net radiation Rn = 129.9 and 140.0 W m−2; and Santarem: ET = 3.4 and 3.6 mm d−1 and Rn = 117.9 and 139.6 W m−2 during wet and dry seasons, respectively) and (ii) that non-biotic factors control evapotranspiration in year-round wet parts of the Amazon while stomatal control is an important element of the seasonal cycle of evapotranspiration at sites with strong dry seasons (Jaru record: ET = 3.86 and 3.27 mm d−1 during wet and dry seasons, respectively). The methods of Rodell et al. (2011) complement these studies by allowing for a regional scale perspective.
This manuscript is structured as follows. We first briefly summarize the approach and data used. We then characterize the main large-scale spatio-temporal patterns of ET and its relationship with precipitation, SIF and solar radiation and put them in the context of previous estimates. Next, we discuss inter-annual variation in ET and its relation to controls like climate and what it suggests about responses of forest functioning in an increasingly warmer and erratic climate.
Methods and Data
The total water mass balance of a river basin like the Amazon is given by
where A is basin area (cm2), S is basin-mean water storage below and aboveground (cm), t is time (e.g., in months), P is basin-mean precipitation (cm month−1), ET is basin-mean evapotranspiration (cm month−1), Q is river discharge (cm3 month−1) at the location where the river leaves the basin, e.g., when entering the sea or when joining a river which drains another basin. This balance assumes that all water leaving the basin in liquid form is via river outflow.
Guided by availability of long-term river discharge records, we settled here on the same partitioning of the Amazon into sub-catchments as suggested by Becker et al. (2011) (their Figure 2): the Madeira Basin, the Negro Basin, the Solimões Basin, the Tapajós Basin and the Xingú Basin (Figure 1).
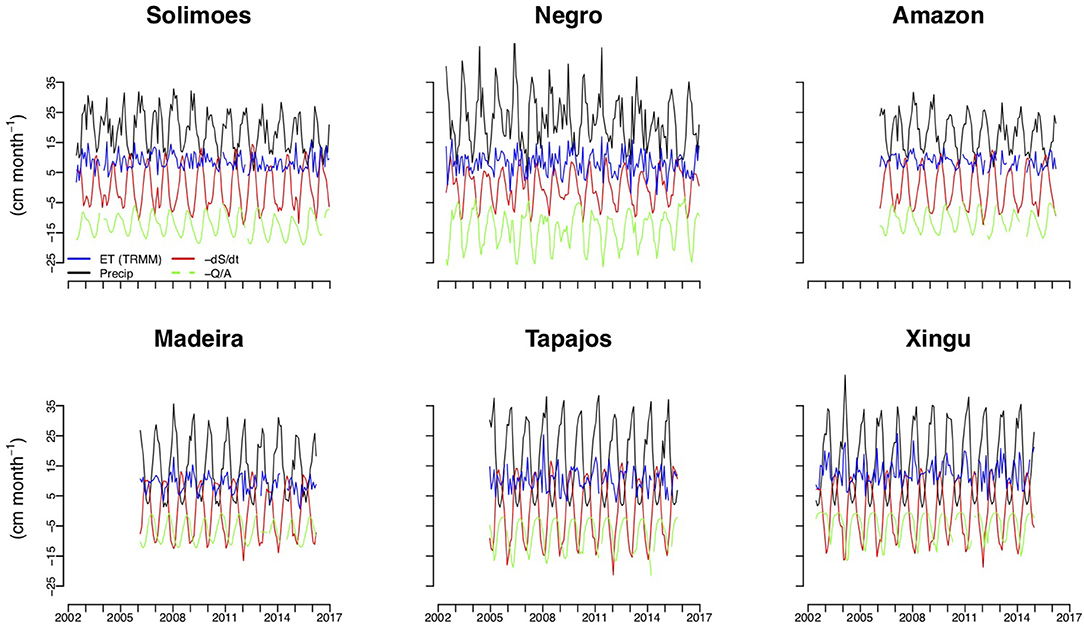
Figure 2. Long-term records of precipitation, river discharge, time rate of change of terrestrial water storage anomalies and evapotranspiration estimated from these records.
For P, we used the estimates from the Tropical Rainfall Measuring Mission (TRMM) 3B43 version 7 and version 7A products, at a 0.25° spatial resolution. TRMM uses a combination of satellite radar and microwave observations, as well as data from gauge stations (Huffman et al., 2007). We computed monthly average rainfall for the period from 1998 to 2017 for each sub-basin by using the spatial masks shown in Figure 1. For comparison, we also used the Climatic Research Unit TS3.25 P dataset (Harris et al., 2014), which is a station-based product, to derive ET estimates. Magnitudes of ET estimates are similar and intra-annual variation is highly correlated (r = 0.76,…0.91) with exception of the estimates for the Tapajos basin.
To calculate Q/A, we used in situ river discharge measurements from eight sites provided by the Brazilian Hydrological Service (ANA) and available at http://www.snirh.gov.br/hidroweb/publico/apresentacao.jsf. The locations of these sites are shown in Figure 1, and further details of the gauge stations are given in Table S1. In basins with missing data at the outflow from the catchment, multiple gauge sites were used and gap-filling procedures employed. Thus, two gauge stations in the Negro basin were selected and an area-weighted mean was used to compute Q for the whole Negro basin. Moreover, three gauge stations were chosen in Solimões basin, since the mainstream station lacks data from July 2013 to January 2015. Further information is provided in the Supplementary Information.
dS/dt was calculated from terrestrial water storage anomalies (ΔS) estimated by the GRACE satellite mission. The GRACE satellites comprise a pair of identical spacecraft, which monitor changes in the Earth's gravitational field primarily caused by variations in surface and below-ground water mass (Tapley et al., 2004). Changes in water mass are measured relative to the long-term time average, and thus ΔS values are provided as anomalies that indicate whether water mass over a given region is increasing or decreasing. In this study, we used the Jet Propulsion Laboratory (JPL) ΔS estimates from 2002 to 2017 (Landerer and Swenson, 2012). Change in water storage per month (dS/dt) was computed by backwards differences. First, we determined basin-mean ΔS for each sub-basin and then calculated the difference between consecutive ΔS values, divided by the time-step:
Given non-uniform sampling frequency and gaps in the GRACE data, an interpolation method was applied to compute monthly water storage changes.
ET was calculated after interpolating P, Q/A and dS/dt to the monthly scale in each sub-basin as outlined above. The time series considered are shown in Table S2. To approximate ET for the entire Amazon basin and investigate the impacts of the 2015/16 El Niño, we combined estimates from the Madeira, Negro and Solimões basins, as the Tapajós and Xingu records were not long enough to cover the 2015/16 El Niño episode.
To understand the impact of the 2015/16 El Niño on Amazon water fluxes, we compared our ET results with temperature (T) data. Global daily T data were obtained from Earth System Research Laboratory (ESRL) website (https://www.esrl.noaa.gov/psd/data/gridded/data.cpc.globaltemp.html) from 1987 to 2016 at a 0.5° spatial resolution.
ET results were also compared with SIF (Solar Induced Fluorescence) data. SIF has been shown to be related to photosynthetic activity (e.g., Frankenberg et al., 2011; van der Tol et al., 2014; Yang et al., 2015) and thus we use it here as a proxy for forest productivity. A small fraction of the solar radiation trapped by chlorophyll escapes instead of being used to fix CO2. This fraction is re-emitted into the atmosphere from the leaf at slightly longer wavelengths than the originally trapped radiation (in the range of 670–800 nm, e.g., Meroni et al., 2009). Monthly SIF data were retrieved from GOSAT (Greenhouse Gases Observation Satellite, Kuze et al., 2009) radiance measurements at 772 nm by the remote sensing group at the University of Leicester (Peter Somkuti and Hartmut Boesch pers. communication), using the physically-based retrieval technique described in Frankenberg et al. (2011). Time series from April 2009 to September 2016 were used. To explore seasonal variation in SIF, ET, and P, we calculated climatological seasonal cycles for each catchment using data from the full time period available for each dataset (namely 2009–2016 for SIF, 2002–2017 for ET, and 1998–2017 for P). Monthly anomalies of SIF, ET and P were computed by subtracting the corresponding climatological mean monthly value from the monthly value.
We estimated the relative uncertainty v in ET estimates for each basin by propagating errors in P (σP), R (σR) and dS/dt () as Rodell et al. (2011):
Following the methods of Spracklen et al. (2012), we estimated σP as the systematic error in TRMM plus the random error, summed in quadrature. The systematic error was taken to be 20% of mean monthly P (Smith et al., 2006), while random error was estimated according to Huffman et al. (2007). We used 5% of monthly mean R to estimate σR. For we used error grids provided with the GRACE data, and followed guidance to account for spatial autocorrelation in the errors (https://grace.jpl.nasa.gov/data/get-data/monthly-mass-grids-land/). Basin values were multiplied by to account for the fact that backward differencing to obtain dS/dt used S data from two consecutive months (Maeda et al., 2017). The uncertainty estimates are given in Table S3.
Results and Discussion
It is instructive to first consider the three contributions to ET: precipitation (P), the ratio of river discharge to catchment area (Q/A), and time rate of change of terrestrial water storage (dS/dt) (Figure 2). The two largest terms, with nearly equal magnitude, are P and dS/dt, while the amplitude of Q/A is approximately half as large and ET is a fairly small “residual.” dS/dt is in phase and positively correlated with P (r = 0.95, p < 0.001), while there is a time lag of varying length between P and Q/A. This lag corresponds with the process of runoff formation, as it takes time for water to filter through the catchment. The phase relationship of ET with precipitation varies across catchments.
Seasonal Cycle and Spatial Variation of ET
Overall the magnitudes and seasonality we have estimated are consistent with the results of Maeda et al. (2017) when taking into account that the results are not directly comparable because the partitioning into catchments is not identical (Table S4 and their Figure 1). The region most comparable is the Tapajos catchment covered in full by both studies. For this region estimated magnitudes and seasonality agree well. Two regions for which estimates are comparable to a limited extent is the Solimões region. Maeda et al. (2017) estimate ET only for the upper Solimões (Western Amazon)–approximately at third of the region used in this study. While magnitudes are similar peak ET is 2 months later according to our estimates compared to the Maeda et al. (2017) estimates. Agreement in seasonality is close for the Purus catchment which is included in our Solimões estimates. Finally for the Rio Negro seasonality is similar although of larger amplitude and magnitude of estimates is smaller by ~10–15% which may be because our region is approximately twice as large. Our intra-annual results for the entire Amazon are also consistent with the analysis of Swann and Koven (2017) although the period covered by the Swan and Koven study is shorter.
The picture of seasonal cycles across catchments resulting from our calculations is the following (Figure 3). Generally, seasonal variation in ET is relatively low compared to annual mean ET. Mean intra-annual standard deviation across catchments is 1.8 cm month−1, which equates to approximately 1.5 % of total mean annual ET of 115.1 cm year−1. This is lower than the intra-annual variability of P, which is approximately 5% of the annual total. Low intra-annual variability in ET relative to P is particularly evident for the three southern catchments (Madeira, Tapajos and Xingu). This result agrees well with those of Costa et al. (2010) based on four eddy flux sites.
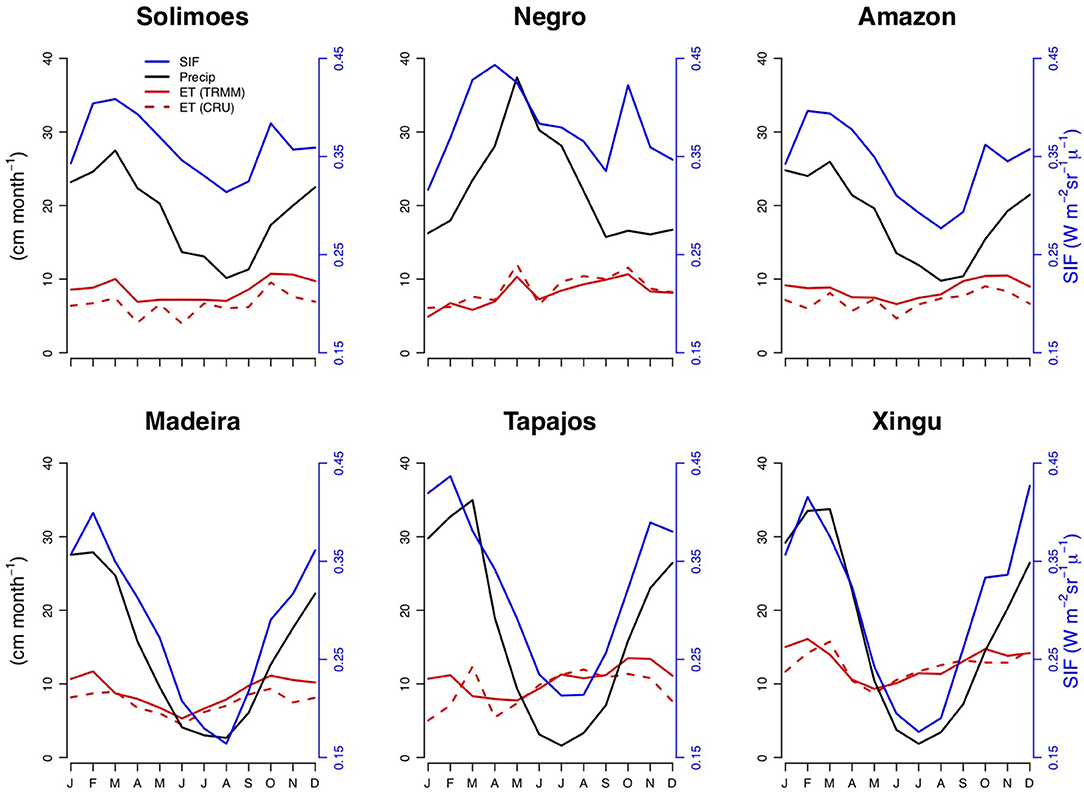
Figure 3. Seasonal variations of evapotranspiration, solar induced fluorescence (SIF) and precipitation for the catchments in Figure 1.
According to our results, the ET estimates for the five catchments fall into two groups: (i) the Solimões and Negro and (ii) the Madeira, Tapajos and Xingu catchments. Both the Solimões and Negro basins are very wet/wet throughout the year, i.e., not only during the wet but also the nominal dry season. Precipitation is never below 10 cm/month, roughly the value of potential evapotranspiration (thought to be the limit for the start of plant water stress). For these two basins we find two ET peaks per year, and SIF and precipitation are not synchronous (Figure 3). Instead the two ET peaks are roughly synchronous with two peaks in SIF, which is analogous to forest productivity. Comparing ET with the seasonal time series of solar radiation and precipitation reveals that the first joint ET SIF maximum is coincident with the precipitation maximum and the second with the solar radiation maximum (Figure S1). The finding of a second peak during the drier part of the year is in agreement with the results of Costa et al. (2010), although they find a lesser first peak during the wetter season.
Compared to the first group of catchments the precipitation seasonality of the second group, Madeira, Tapajos, Xingu, is much stronger with precipitation being much lower during the dry season and exhibiting a very clear and strong seasonal cycle with one minimum and one maximum. SIF and precipitation vary synchronously over these drier catchments, unlike for the former group. ET peaks during the transition from the dry to wet season. The minimum in ET precedes the minimum in precipitation and SIF by approximately 3 months from where it starts to rise steadily again when it is still dry. This latter behavior agrees with the timing of leaf flush toward the end of dry season estimated using remotely sensed NDVI (Normalized Difference Vegetation Index, e.g., Wagner et al., 2017). It is also in agreement with analyses of Saleska et al. (2003). The steady increase in ET starting mid-way through the dry season suggests that radiation overcomes the effect of VPD (vapor pressure deficit) on stomatal regulation, and thus that radiation plays a role in these catchments during the second part of the dry season. ET during this phase may be influenced by deep water reserves (Vourlitis et al., 2008), given precipitation during the dry season would otherwise be insufficient to sustain ET. This differs somewhat from the generalizations that Costa et al. (2010) made based on the eddy flux results discussed earlier on-that stomatal control via VPD governs the seasonal cycle of ET in seasonally dry sites, and that radiation is the main control in wetter sites.
Our finding of two groups of catchments with regards to ET intra-annual variation agrees with an analysis of photosynthesis and its controls based on SIF data by Guan et al. (2015). These authors found a similar regional partitioning and attributed it to the degree of water limitation as a result of the duration and strength of the dry season. Our analysis suggests a slightly more complicated picture, as we find for the catchments with strong wet-dry season seasonality that photosynthetic activity starts in the middle of the dry season, which is only possible if there is access to water.
Overall the three outstanding features of ET seasonality we find are (i) the generally weak seasonality, (ii) the two ET peaks for the two very wet catchments with one occurring during the wet and one during the drier season, and (iii) for the three drier catchments a steady increase of ET during the second half of the dry season with peak ET occurring during the first half of the wet season.
Inter-annual Variations and El Niño Impacts
As well as providing a measure of variation in the hydrological cycle, GRACE water storage anomalies (ΔS) may be interpreted as an indicator of plant water stress. As in many parts of the world, our analysis of NOAA ESRL (National Oceanic and Atmospheric Administration, USA) temperature data showed that there has been substantial warming in the Amazon over recent decades, with an increase of 0.7°C per decade during 2002–2016, the period for which GRACE data are available (Table S5). We examined the GRACE data from this period to see whether there was evidence for corresponding changes in water availability (Figure 4). The records for the Solimões catchment and, to some extent, also the Madeira catchment reveal an increase in the seasonal amplitude of ΔS over time. For the Solimões catchment, wet season precipitation was particularly large in 2009, 2012 and 2014, and 2015 causing severe flooding, and this is reflected in the ΔS record from this basin (Figure 4). In 2014, wet season precipitation was anomalously high throughout the Amazon basin. Particularly dry seasons occurred in 2010, to some extent in 2005, and for the Negro and Xingu basins also in 2015/16, visible as low excursions in these ΔS time series. During 2016 there were very strong negative wet season anomalies across most of the basin.
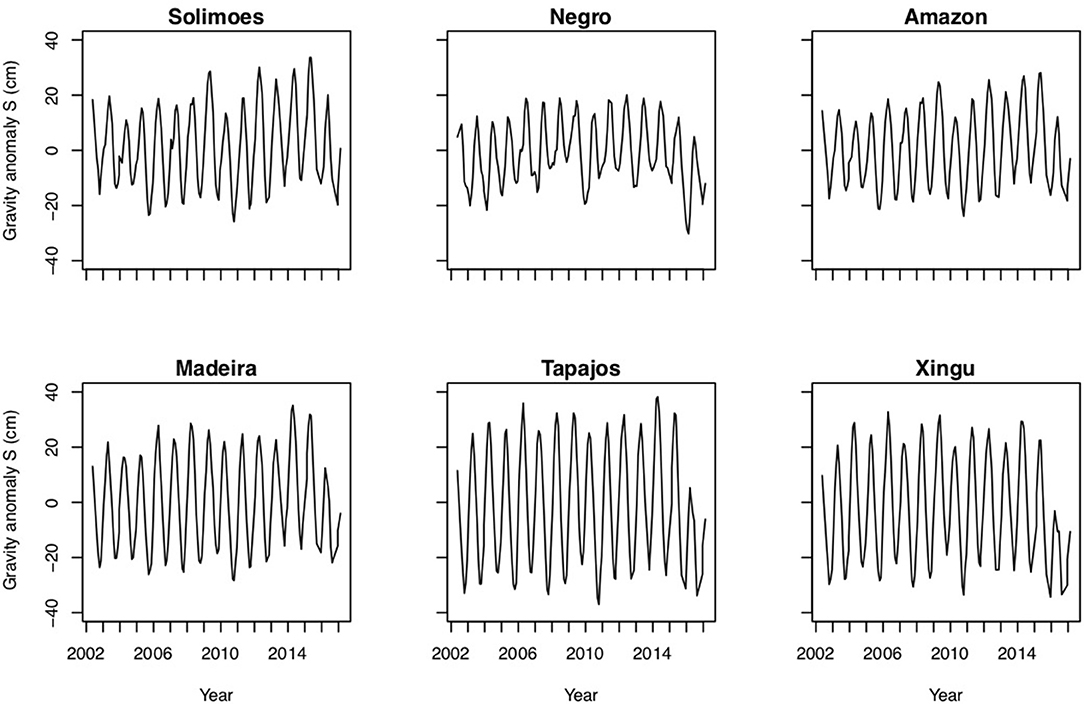
Figure 4. Long-term records of terrestrial water storage anomalies for all catchments.
Considering finally inter-annual variation in ET anomalies, an inspection of these records reveals that they are very noisy (Figure 5). Nonetheless, there are interesting patterns. Firstly, for the Solimões and Madeira catchments the period with large positive wet season anomalies (2012–2015) is associated with negative ET anomalies, and negative SIF anomalies, which would be consistent with reduction in photosynthetically active radiation as a result of positive cloud cover anomalies.
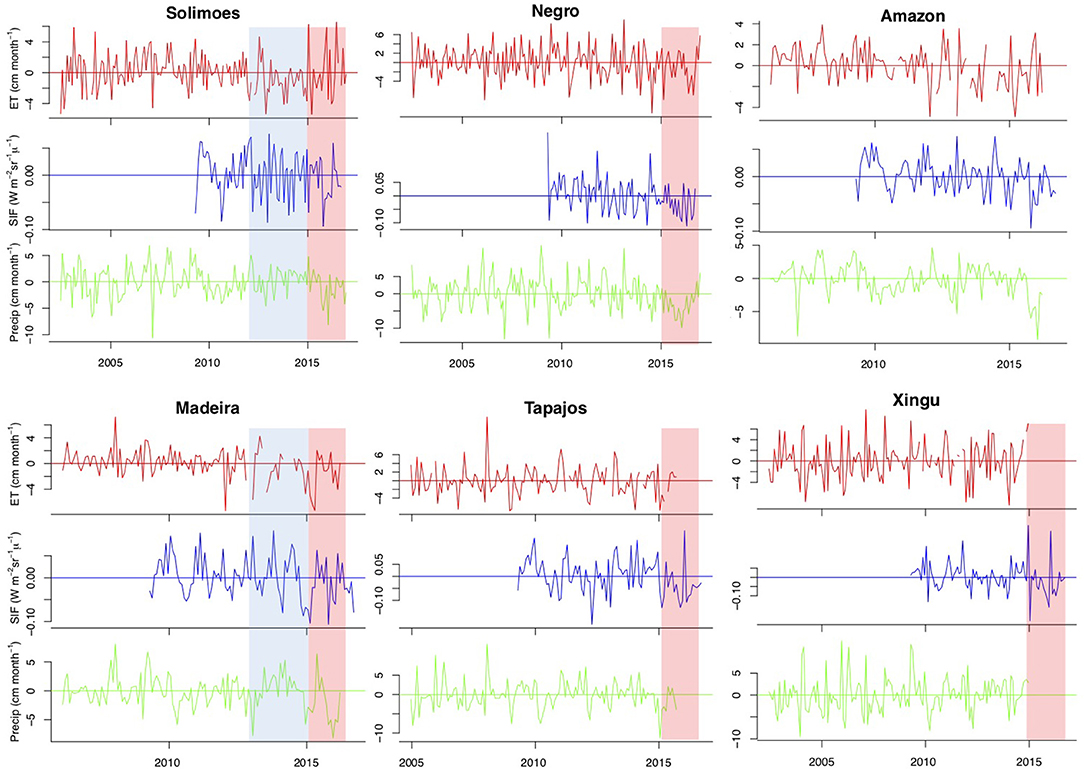
Figure 5. Evapotranspiration, precipitation and solar induced fluorescence anomalies for all catchments in Figure 1.
The second pattern of interest in Figure 5 is the signatures that occur during the El Niño years 2015 and 2016. These were characterized by strong negative P anomalies and strong positive T anomalies on top of a rapid warming trend (Gloor et al., 2018; Figure 1). All catchments show down-regulation of ET and SIF, although the signatures are less clear for the Solimões catchment compared to the other catchments. 2015 and 2016 carbon flux anomalies for the Amazon, estimated using atmospheric carbon concentration data and atmospheric transport inverse modeling, were positive (a larger than usual flux to the atmosphere), and primarily attributed to a reduction in gross primary productivity (Liu et al., 2017). Our results provide further support that down-regulation of productivity during the El Niño years 2015 and 2016 contributed substantially to the positive land to atmosphere CO2 flux anomaly from the Amazon.
Summary and Conclusions
We analyzed seasonal and spatial variations of ET in the Amazon and its response to the 2015/16 El Niño episode. ET was estimated directly using a water-budget approach, which encompasses river discharge, rainfall and water storage changes over time. The three outstanding features of ET seasonality are (i) the generally weak seasonality, (ii) two ET peaks for the two very wet catchments Solimões and Negro), with one occurring during the wet season and one during the drier season, suggesting a dual control of precipitation and radiation, and (iii) a steady increase of ET during the second half of the dry season for the three drier catchments (Madeira, Tapajos, Xingu), with peak ET occurring during the first half of the wet season consistent with leaf flush occurring before the onset of the wet season (Saleska et al., 2003).
With regards to inter-annual variation, we found firstly that for the Solimões and Madeira catchments the period with large positive wet season anomalies (2012–2015) is associated with negative ET anomalies, and negative SIF anomalies. Furthermore, we found negative ET and SIF anomalies for most of the Amazon basin during the 2015/16 El Niño event suggesting down-regulation of productivity as a main factor of positive carbon flux anomalies during anomalously hot and dry conditions. These results are of interest in view of predicted warmer and more erratic future climate conditions.
Author Contributions
Project suggested by WB, EG, and DS. Analysis done by LS, EG, and JB. Data and comments contributed by HB, PS and EM. Article written by LS, JB and EG. All authors commented on the manuscript.
Conflict of Interest Statement
The authors declare that the research was conducted in the absence of any commercial or financial relationships that could be construed as a potential conflict of interest.
Acknowledgments
We would like to thank data providers ANA Brazilian hydrological service, TRMM satellite mission, GRACE satellite mission and funding received from NERC FAPESP CSSP Brazil, NERC grant (NE/K01353X/1), NERC BIO-RED (NE/N012542/1) and NERC MOYA project (NE/N015657/1).
Supplementary Material
The Supplementary Material for this article can be found online at: https://www.frontiersin.org/articles/10.3389/feart.2019.00032/full#supplementary-material
Data Sheet 1. Data records displayed in Figures 1–5 and Figure S1 using CRU (Climate research unit) precipitation data.
Data Sheet 2. Data records displayed in Figures 1–5 and Figure S1 using TRMM (Tropical Rainfall Measuring Mission) precipitation data.
References
Aragão, L., Anderson, L. O., Fonseca, M. G., Rosan, T. M., Vedovato, L. B., Wagner, F. H., et al. (2018). 21st century drought-related fires counteract the decline of Amazon deforestation carbon emissions. Nat. Commun. 9:536. doi: 10.1038/s41467-017-02771-y
Barber, C. P., Cochrane, M. A., Souza, C. M., and Laurance, W. F. (2014). Roads, deforestation, and the mitigating effect of protected areas in the Amazon. Biol. Conserv. 177, 203–209. doi: 10.1016/j.biocon.2014.07.004
Barichivich, J., Gloor, E., Peylin, P., Brienen, R., Schöngart, J., Espinoza, J. C., et al. (2018). Recent intensification of Amazon flooding extremes driven by strengthened Walker circulation. Sci. Adv. 4:eaat8785. doi: 10.1126/sciadv.aat8785
Becker, M., Meyssignac, B., Xavier, L., Cazenave, A., Alkama, R., and Decharme, B. (2011). Past terrestrial water storage (1980-2008) in the Amazon basin reconstructed from GRACE and in situ river gauging data. Hydrol. Earth Syst. Sci. 15:533. doi: 10.5194/hess-15-533-2011
Brienen, R., Phillips, O. L., Feldpausch, T., Gloor, M., Baker, T. R., Galbraith, D., et al. (2015). Long-term decline of the Amazon carbon sink. Nature 519, 344–348. doi: 10.1038/nature14283
Choudhury, B. J., DiGirolamo, N. E., Susskind, J., Darnell, W. L., Gupta, S. K., and Asrar, G. G. (1998). A biophysical process-based estimate of global land surface evaporation using satellite and ancillary data II. Regional and global patterns of seasonal and annual variations. J. Hydrol. 205, 186–204. doi: 10.1016/S0022-1694(97)00149-2
Costa, M. H., Biajoli, M. C., Sanches, L., Malhado, A., Hutyra, L. R., Da Rocha, H. R., et al. (2010). Atmospheric versus vegetation controls of Amazonian tropical rain forest evapotranspiration: are the wet and seasonally dry rain forests any different? J. Geophys. Res. Biogeosci. 115, 1–9. doi: 10.1029/2009JG001179
Da Rocha, H. R., Manzi, A. O., Cabral, O. M., Miller, S. D., Goulden, M. L., Saleska, S. R., et al. (2009). Patterns of water and heat flux across a biome gradient from tropical forest to savanna in Brazil. J. Geophys. Res. Biogeosci. 114, 1–8. doi: 10.1029/2007JG000640
Davidson, E. A., de Araújo, A. C., Artaxo, P., Balch, J. K., Brown, F., Bustamante, M. M., et al. (2012). The Amazon basin in transition. Nature 481, 321–328 doi: 10.1038/nature10717
Fearnside, P. M. (2014). Viewpoint-Brazil's Madeira river dams: a setback for environmental policy in amazonian development. Water Alter. 7, 154–167.
Feldpausch, T. R., Phillips, O. L., Brienen, R. J. W., Gloor, M., Lloyd, J., Lopez-Gonzalez, G., et al. (2016). Amazon forest response to repeated droughts. Glob. Biogeochem. Cycles 30, 964–982. doi: 10.1002/2015GB005133
Foley, J. A., Botta, A., Coe, M. T., and Costa, M. H. (2002). El Nino–Southern oscillation and the climate, ecosystems and rivers of Amazonia. Glob. Biogeochem. Cycles 16, 1–20. doi: 10.1029/2002GB001872
Frankenberg, C., Fisher, J. B., Worden, J., Badgley, G., Saatchi, S., Lee, J.-E., et al. (2011). New global observations of the terrestrial carbon cycle from GOSAT: Patterns of plant fluorescence with gross primary productivity. Geophys. Res. Lett. 38:L17706. doi: 10.1029/2011GL048738
Gloor, E., Wilson, C., Chipperfield, M. P., Chevallier, F., Buermann, W., Boesch, H., et al. (2018). Tropical land carbon cycle responses to 2015/16 El Niño as recorded by atmospheric greenhouse gas and remote sensing data. Phil. Trans. R. Soc. B 373:20170302. doi: 10.1098/rstb.2017.0302
Guan, K., Pan, M., Li, H., Wolf, A., Wu, J., Medvigy, D., et al. (2015). Photosynthetic seasonality of global tropical forests constrained by hydroclimate. Nat. Geosci. 8:284 doi: 10.1038/ngeo2382
Hansen, M. C., Potapov, P. V., Moore, R., Hancher, M., Turubanova, S. A., Tyukavina, A., et al. (2013). High-resolution global maps of 21st-century forest cover change. Science 342, 850–853. doi: 10.1126/science.1244693
Harris, I., Jones, P. D., Osborn, T. J., and Lister, D. H. (2014). Updated high-resolution grids of monthly climatic observations–the CRU TS3.10 Dataset. Int. J. Climatol. 34, 623–642. doi: 10.1002/joc.3711
Hasler, N., and Avissar, R. (2007). What controls evapotranspiration in the Amazon basin? J. Hydrometeorol. 8, 380–395. doi: 10.1175/JHM587.1
Hodnett, M. G. L., Pimentel da Silva, da Rocha, H. R., and Cruz Senna, R. (1995). Seasonal soil water storage changes beneath central Amazonian rainforest and pasture. J. Hydrol. 170, 233–254. doi: 10.1016/0022-1694(94)02672-X
Huffman, G. J., Adler, R. F., Bolvin, D. T., Gu, G., Nelkin, E. J., Bowman, K. P., et al. (2007). The TRMM multi-satellite precipitation analysis: quasiglobal, multi-year, combined-sensor precipitation estimates at fine scale. J. Hydrometeor. 8, 38–55. doi: 10.1175/JHM560.1
Kalamandeen, M., Gloor, E., Mitchard, E., Quincey, D., Ziv, G., Spracklen, D., et al. (2018). Pervasive rise of small-scale deforestation in Amazonia. Sci. Rep. 8:1600. doi: 10.1038/s41598-018-19358-2
Kuze, A., Suto, H., Nakajima, M., and Hamazaki, T. (2009). Thermal and near infrared sensor for carbon observation Fourier-transform spectrometer on the Greenhouse Gases Observing Satellite for greenhouse gases monitoring. Appl. Optics 48, 6716–6733. doi: 10.1364/AO.48.006716
Landerer, F. W., and Swenson, S. C. (2012). Accuracy of scaled GRACE terrestrial water storage estimates. Water Resour. Res. 48:W04531. doi: 10.1029/2011WR011453
Liu, J., Bowman, K. W., Schimel, D. S., Parazoo, N. C., Jiang, Z., Lee, M., et al. (2017). Contrasting carbon cycle responses of the tropical continents to the 2015–2016 El Niño. Science 358:191. doi: 10.1126/science.aam5690
Maeda, E. E., Ma, X., Wagner, F., Kim, H., Oki, T., and Eamus, D. (2017). Evapotranspiration seasonality across the Amazon basin. Earth Syst. Dyn. 8:439. doi: 10.5194/esd-8-439-2017
Marengo, J. A. (2006). On the hydrological cycle of the Amazon basin: a historical review and current state-of-the-art. Rev. Bras. Meteorol. 21, 1–19.
Meir, P., and Grace, J. (2005). “The effects of drought on tropical forest ecosystems,” in Tropical Forests and Global Atmospheric Change, eds Y. Malhi, and O. L. Phillips (Oxford: Oxford University Press), 75–86. doi: 10.1093/acprof:oso/9780198567066.003.0007
Meroni, M., Rossini, L., Guanter, L., Alonso, L., Rascher, U., Colombo, R., et al. (2009). Remote sensing of solar-induced chlorophyll fluorescence: review of methods and applications. Rem. Sens. Env. 113, 2037–2051. doi: 10.1016/j.rse.2009.05.003
Miralles, G., Jiménez, C., Jung, M., Michel, D., Ershadi, A., McCabe, M. F., et al. (2016). The WACMOS-ET project – part 2: evaluation of global terrestrial evaporation data sets. Hydrol. Earth Syst. Sci. 20, 823–842. doi: 10.5194/hess-20-823-2016
Phillips, O. L., Aragão, L. E., Lewis, S., Fisher, J. B., Lloyd, J., López-González, G., et al. (2009). Drought sensitivity of the Amazon rainforest. Science 323, 1344–1347. doi: 10.1126/science.1164033
Phillips, O. L., Van Der Heijden, G., Lewis, S. L., López-González, G., Aragão, L. E., Lloyd, J., et al. (2010). Drought–mortality relationships for tropical forests. New Phytol. 187, 631–646. doi: 10.1111/j.1469-8137.2010.03359.x
Qian, H., Joseph, R., and Zeng, N. (2008). Response of the terrestrial carbon cycle to the El Niño-Southern oscillation. Tellus B 60, 537–550. doi: 10.1111/j.1600-0889.2008.00360.x
Rodell, M., McWilliams, E. B., Famiglietti, J. S., Beaudoing, H. K., and Nigro, J. (2011). Estimating evapotranspiration using an observation based terrestrial water budget. Hydrol. Processes 25, 4082–4092. doi: 10.1002/hyp.8369
Ronchail, J., Cochonneau, G., Molinier, M., Guyot, J. L., Gorreti de Miranda Chaves, A., Guimarães, V., et al. (2002). Interannual rainfall variability in the Amazon basin and sea surface temperatures in the equatorial Pacific and the tropical Atlantic Oceans. Int. J. Climatol. 22, 1663–1686. doi: 10.1002/joc.815
Saleska, S. R., Miller, S. D., Matross, D. M., Goulden, M. L., Wofsy, S. C., Da Rocha, H. R., et al. (2003). Carbon in Amazon forests: unexpected seasonal fluxes and disturbance-induced losses. Science 302, 1554–1557. doi: 10.1126/science.1091165
Smith, T. M., Arkin, P. A., Bates, J. J., and Huffman, G. J. (2006). Estimating bias of satellite-based precipitation estimates. J. Hydrometeor. 7, 841–856. doi: 10.1175/JHM524.1
Spracklen, D. V., Arnold, S. R., and Taylor, C. M. (2012). Observations of increased tropical rainfall preceded by air passage over forests. Nature 489, 282–285. doi: 10.1038/nature11390
Swann, A. L., and Koven, C. D. (2017). A direct estimate of the seasonal cycle of evapotranspiration over the Amazon Basin. J. Hydrometeorol. 18, 2173–2185. doi: 10.1175/JHM-D-17-0004.1
Tapley, B. D., Bettadpur, S., Ries, J. C., Thompson, P. F., and Watkins, M. M. (2004). GRACE measurements of mass variability in the earth system. Science 305, 503–505. doi: 10.1126/science.1099192
van der Tol, C., Berry, J. A., Campbell, P. K., and Rascher, U. (2014). Models of fluorescence and photosynthesis for interpreting measurements of solar-induced chlorophyll fluorescence. J. Geophys. Res. Biogeosci. 119, 2312–2327, doi: 10.1002/2014JG002713
Vourlitis, G. L., de Souza Nogueira, F., de Almeida Lobo, K. M., Sendall, S. R. de Paulo, C. A., Antunes Dias, O., et al. (2008). Energy balance and canopy conductance of a tropical semi-deciduous forest of the southern Amazon Basin. Water Res. Res. 44:W03412. doi: 10.1029/2006WR005526
Vourlitis, G. L., de Souza Nogueira, J., de Almeida Lobo, F., and Pinto, O. B. (2015). Variations in evapotranspiration and climate for an Amazonian semi-deciduous forest over seasonal, annual, and El Niño cycles. Int. J. Biometeorol. 59, 217–230. doi: 10.1007/s00484-014-0837-1
Vourlitis, G. L., Hayashi, M. M. S., Nogueira, J. S., Caseiro, F. T., and Campelo, J. H. (2002). Seasonal variations in the evapotranspiration of a transitional tropical forest of Mato Grosso, Brazil. Water Resour. Res. 38, 1–11. doi: 10.1029/2000WR000122
Wagner, F. H., Hérault, B., Rossi, V., Hilker, T., Eiji Maeda, E., Sanchez, A., et al. (2017). Climate drivers of the Amazon forest greening. PLoS ONE 12:e0180932. doi: 10.1371/journal.pone.0180932
Wright, J. S., Fu, R., Worden, J. R., Chakraborty, S., Clinton, N. E., Risi, C., et al. (2017). Rainforest-initiated wet season onset over the southern Amazon. Proc. Natl. Acad. Sci. U.S.A. 114, 8481–8486. doi: 10.1073/pnas.1621516114
Yang, X., Tang, J., Mustard, J. F., Lee, J.-E., Rossini, M., Joiner, J., et al. (2015). Solar-induced chlorophyll fluorescence that correlates with canopy photosynthesis on diurnal and seasonal scales in a temperate deciduous forest. Geophys. Res. Lett. 42, 2977–2987. doi: 10.1002/2015GL063201
Zeng, N., Yoon, J.-H., Marengo, J. A., Subramaniam, A., Nobre, C. A., Mariotti, A., et al. (2008). Causes and impacts of the 2005 Amazon drought. Environ. Res. Lett. 3, 1–9. doi: 10.1088/1748-9326/3/1/014002
Keywords: Amazonia, El Niño, Evapotranspiration, Forest Productivity, Solar induced fluorescence
Citation: Sun L, Baker JCA, Gloor E, Spracklen D, Boesch H, Somkuti P, Maeda E and Buermann W (2019) Seasonal and Inter-annual Variation of Evapotranspiration in Amazonia Based on Precipitation, River Discharge and Gravity Anomaly Data. Front. Earth Sci. 7:32. doi: 10.3389/feart.2019.00032
Received: 30 August 2018; Accepted: 13 February 2019;
Published: 19 March 2019.
Edited by:
Juan Carlos Jimenez, University of Valencia, SpainReviewed by:
Jose A. Marengo, Centro Nacional de Monitoramento e Alertas de Desastres Naturais (CEMADEN), BrazilPennan Chinnasamy, Indian Institute of Technology Bombay, India
Copyright © 2019 Sun, Baker, Gloor, Spracklen, Boesch, Somkuti, Maeda and Buermann. This is an open-access article distributed under the terms of the Creative Commons Attribution License (CC BY). The use, distribution or reproduction in other forums is permitted, provided the original author(s) and the copyright owner(s) are credited and that the original publication in this journal is cited, in accordance with accepted academic practice. No use, distribution or reproduction is permitted which does not comply with these terms.
*Correspondence: Emanuel Gloor, e.gloor@leeds.ac.uk