Short- and Intermediate-Range Structure and Dynamics of Fe-Ni-C Liquid Under Compression
 Jianwei Wang
 Bin Chen
 Quentin Williams
 Murli H. Manghnani2
- 1Department of Geology and Geophysics, Center for Computation and Technology, Louisiana State University, Baton Rouge, LA, United States
- 2Hawai‘i Institute of Geophysics & Planetology, University of Hawai‘i at Mānoa, Honolulu, HI, United States
- 3Department of Earth and Planetary Sciences, University of California, Santa Cruz, Santa Cruz, CA, United States
Properties of liquid Fe alloys under high-pressure conditions are crucial for understanding the composition, thermal state, and dynamics of Earth’s core. Experiments on such liquids, however, are often performed under pressures far below those of the outer core, necessitating long extrapolations of experimental results to core conditions. Such estimates can be complicated by light elements possibly forming pressure-dependent molecular clusters that can significantly affect the physical properties of liquids as core conditions are approached. First-principles molecular dynamics simulations were employed to compute the properties of an Fe-Ni-C liquid with a composition of Fe3.7Ni0.37C at 1673 K and pressures from 0 to 67 GPa to benchmark computational methods on pressure effects on the structure and properties of the liquid relative to low pressure experimental results. The short-range structure is manifested by the coordination number (CN) of Fe/Ni-Fe/Ni being around 12, indicative of a nearly close-packed structure in the pressure range, and the CN of C-Fe/Ni gradual increasing from 6.5 to 8.5, indicative of an approximately octahedral to cubic transition as pressure increases. The Fe/Ni-Fe/Ni bond distance, however, is found to be 10 times more compressible than the C-Fe/Ni distance. The intermediate-range structure of Fe/Ni-Fe/Ni and C-Fe/Ni subsystems, described by a partial configurationally decomposed distribution function, undergoes substantial changes, characterized by a significant increase of the number of polyhedra that share 3 atoms with each other. Such dense configurations are related to an increased bulk modulus, decreased diffusion coefficient, decreased activation volume for diffusion, and increased shear viscosity. Reproducing the experimental observations at low pressures provides important support for modeling the liquid under the conditions relevant to the outer core.
Introduction
Earth’s core is predominately Fe with ∼5–10% Ni (Birch, 1952), as inferred from seismic velocities, cosmic abundances of elements (McDonough, 2003), and the understanding of Earth’s accretion and differentiation processes (Hart and Zindler, 1986; Kleine et al., 2002; Rubie et al., 2015). In order to make up the difference between the estimated density of Fe-Ni alloy under core conditions and the estimate from seismic and geodetic data, ∼8–12% of light elements are required to be present in the core (McDonough, 2003). However, the nature and identity of light elements have been subjects of considerable speculation and extensive research, in large part because the partitioning of elements of the Earth during its formation, differentiation, and subsequent evolution is not well understood. By considering the bulk composition of the Earth, the chemical affinities to Fe, and processes involving incorporation of light elements to the outer core with constraints on the core density, seismic wave velocity, and solubility in liquid Fe, there are a number of feasible candidate light elements (Birch, 1964; Wood, 1993; Poirier, 1994; Li and Fei, 2007; Wood et al., 2013; Badro et al., 2014, 2015), including H, C, O, S, and Si. However, solutions to which light elements might be dominant are not unique and depend on the methodology used to determine the most likely light elements given a set of constraints. Nevertheless, C continues to represent a plausible lighter alloying component within the core. The existing data show that alloying Fe with C might partially account for the shear wave velocity anomaly and anisotropy of the inner core (Nikolussi et al., 2008; Gao et al., 2009; Chen et al., 2014, 2018; Prescher et al., 2015; Chen and Li, 2016; Lai et al., 2018). In addition, the Fe7C3 phase has recently been proposed as the leading candidate among possible inner core precipitates from a liquid composed of Fe and a small amount of C (Lord et al., 2009). In order to place tighter constraints to the C content of the outer core, it is instructive to understand how C is incorporated in the Fe-Ni liquid, and how it affects the properties of the liquid and their pressure and temperature dependences. In particular, the chemical bonding between C and Fe/Ni and the short- and intermediate-range structures of the candidate liquid alloys likely play an important role in determining the elastic and transport properties that are relevant to modeling of the Earth’s outer core.
The candidate light elements, such as C, often bond differently with Fe and Ni relative to bonding between the two transition metals. This is mostly because light elements are usually considered to be dissolved in, but not necessarily alloyed with Fe and Ni based on the Hume-Rothery rules of alloying, given their differences in valence, electronegativity, size, and crystal structure with respect to Fe and Ni (Hume-Rothery et al., 1969). Such differences may lead to light elements forming limited solid solutions or intermetallic compounds with Fe and Ni. At ambient conditions, Fe crystallizes as BCC alpha-Fe (ferrite). As light elements are incorporated in Fe, the crystal structure is modified. The phases of Fe hydrides, carbides, oxides, sulfides, and silicides have very different crystal structures from alpha-Fe. For instance, as C content in Fe-C increases, Fe may crystallize to orthorhombic cementite (Fe3C) at low temperature and pressure (Chipman, 1972). For Fe liquid alloys, chemical bonding may change as pressure increases, which can lead to changes in the solubility of light elements (Sherman, 1991). Indeed, there are substantial indications that light elements significantly modify the structure of Fe liquids. For example, decreases in density as a function of C, Si, and S contents in Fe liquid alloys are non-linear, which demonstrate that these light elements mix non-ideally in terms of molar volumes (Shimoyama et al., 2013). The concave nature of the molar volume variations with the light element content suggests negative excess molar volumes of the mixing, indicating that the interatomic distance decreases as a result of the complex chemical bonding environment. A proposed substitution mechanism in which C occupies interstitial sites of liquid Fe cannot solely explain the non-ideal mixing behavior, and hence represents an oversimplification of the molecular structure of C in the liquid (Shimoyama et al., 2013). With respect to transport properties, the experimentally observed viscosity of Fe-S liquid increases by three orders of magnitude at 3–4 GPa relative to ambient pressure (LeBlanc and Secco, 1996). This dramatic shift led to the hypothesis that sulfur cluster aggregates were formed, which impede the diffusion of atoms in the liquid, causing the viscosity to increase. In general, at a given temperature and pressure condition, light elements are expected to reduce the density of Fe liquid and thus increase the seismic velocity. However, how and to what extent each of the candidate elements changes the liquid properties depends strongly on the properties of their chemical bonding with Fe. The short- and intermediate-range orderings and the associated formation of molecular moieties and clusters may in part provide the answer. Furthermore, the intermediate-range structure may also provide clues as to how the precursor liquid solidifies at the solid inner core.
Due to a lack of long-range order, pair distribution functions (PDFs) are often used to describe liquid structure using computational and experimental techniques. However, PDFs are the one-dimensional average of a three-dimensional structure, and details of the structure are partially lost in PDFs, and particularly the intermediate-range structure, which is challenging to recover from the average, but is critical for understanding properties of a liquid. Reconstruction of the three-dimensional structure based on a pair distribution function is an inverse problem that is ill-posed and often requires simplifications and assumptions with potential risks. Order parameters, if applied appropriately, can be used to improve the description of both the short- and intermediate-range structures of an aperiodic material. While the short-range structure of crystalline materials is often similar to that of their relevant amorphous phases (Mavračić et al., 2018), the intermediate- and long-range structures may differ significantly. It is the intermediate-range structures that often offer crucial information on amorphous materials such as for charactering polyamorphic transitions (Poole et al., 1997), liquid phase separation (Anisimov et al., 2018), and the precursor liquid of crystallization (Suzuki, 2017).
Recent experiments suggest that there may be at least one liquid-liquid transition in liquid Fe. This transition was proposed to be a structural change of bcc-like to mixed bcc-fcc-like local order in the vicinity of the δ-γ-liquid triple point at ∼5 GPa (Sanloup et al., 2000). However, such a transition was not unambiguously confirmed in subsequent experiments on pure Fe liquid (Shen et al., 2004; Kono et al., 2015). Interestingly, most observations of this transition have been observed or suggested for systems with some amount (3.5–7.5 wt%) of C (Sanloup et al., 2011; Shimoyama et al., 2013; Shibazaki et al., 2015). A recent study on Fe-Ni liquids with 3–5 wt% C unambiguously confirmed the polyamorphic transition and shows that the structural transition results from a marked increase of three-atom face-sharing polyhedral connections in the liquids (Lai et al., 2017). This raises a key question: what role might C play in polyamorphic transitions in molten Fe alloys? Since C might be able to modify the structure of the liquids and change the phase behavior, the local molecular structure involving C is expected to be key to understanding the transition. If the transition is caused or enhanced by C because of property modifications, it would be of great interest to know whether such modifications occur at the higher pressures of the outer core. However, details of the role of C in the transition are unknown. Experimentally, it is difficult to extract the contribution of C to the liquid structure because the X-ray scattering factor of C is much lower relative to Fe. This lack of data motivates the use of first-principles molecular dynamics (MD) to explore the relationship between the structure and properties of the liquid. First-principle MD is of particular value in tracking the phase space of the dynamic systems with Newton’s equations of motion while the forces on atoms are computed directly from first-principles electronic structure calculation, which is an advantage over classical MD where forces are calculated based on empirical interatomic potentials.
The focus of this study is to understand the structural change of Fe-Ni-C liquid with pressure and the role of C in the polyamorphic transition using first-principles MD simulations at pressures where experimental results are available. The data from the MD simulations were used to compute structural and dynamic properties of the liquid. As such, this study is oriented toward not only benchmarking results of the MD calculations against experimentally determined physical parameters of such liquids, but also probing, through the use of pair distribution functions, the pressure dependence of the liquid structure and structural species (such as polyhedral linkages) present within the liquid, and relating these structural features to liquid properties (such as the equation of state, diffusion coefficient, and viscosity). The results extend to substantially higher pressures than previously studied (Lai et al., 2017). The presence of C reduces the density of the liquid compared to pure Fe, but it also modifies the structure of Fe. The hypothesis is that the response of C-Fe bonding to pressure is markedly different from that of the Fe-Fe bonding due to the stronger bonding between Fe and C, leading to different topological changes of Fe-C and Fe-Fe networks under compression. The key questions here involve the length-scale(s) over which structural changes occur that are associated with the presence of C within the liquid Fe alloy, and what the pressure dependence of these length-scale dependent structural changes may be. By analyzing the structure and dynamics of the liquid, the simulations show that the short- and intermediate-range structures of C play an essential role in the changes of the liquid structure and properties, such as occurring at the polyamorphic transition at ∼5 GPa.
Materials and Methods
Materials and Model
All of the calculations were performed with a system of 192 atoms. The computational supercell containing 140 Fe, 14 Ni, and 38 C atoms (∼Fe72.9Ni7.3C19.8) was created by modifying the Fe3C crystal structure (64 units of Fe3C), and melted at a temperature of 3000 K, and then cooled down to 1673 K using MD simulations. The computational supercell was then scaled to be a cube by changing the supercell dimensions. For each MD simulation, the system was changed to a given volume. An equilibration period was followed to allow the system to adjust to its pressure. The composition and conditions were chosen for understanding the pressure effect on the structure and properties of the liquid alloy where experimental results are available with which to compare (Lai et al., 2017). The trajectories and statistical data from the MD simulations were used to compute structural and dynamic properties of the liquid.
First-Principles Molecular Dynamics Simulations
The first-principles MD simulations were based on Density Functional Theory (DFT) and plane wave basis sets as implemented in VASP (Kresse and Furthmüller, 1996). The Projector-Augmented Wave method and exchange-correlation as parameterized by the PBE functional were applied in the Generalized Gradient Approximation (GGA) (Perdew et al., 1992; Blöchl, 1994). For Fe, 8 electrons (6d and 2s) are treated as valence electrons and the core electrons have the [Ar] configuration. For Ni, 10 electrons (8d and 2s) are treated as valence electrons and the core electrons have the [Ar] configuration. For C, 4 electrons (2p and 2s) are treated as valence electrons and the core electrons have the [He] configuration. The energy cut-off for the plane-wave basis was set to 520.00 eV and Γ point Brillouin zone sampling was deployed for the MD simulations. A ferromagnetic state was initiated at the start of the MD simulations, but was not constrained and was allowed to evolve during the equilibration and equilibrium simulations.
The simulations were performed using a NVT ensemble with the Nosé-thermostat for up to 5 ps for equilibration, which was checked by monitoring a number of parameters including electronic cycle convergence, temperature, pressure, potential energy of the systems, the partition of the kinetic energy of the Fe, Ni and C subsystems, structure, and displacement of atoms, among other system parameters. The temperature was kept at 1673 K for all simulations in order to isolate the effect of pressure. Although the alloy may be in a metastable liquid regime for the higher pressure simulations, the temperature is expected to be sufficiently high that the MD simulations adequately sample the liquid in this regime, which is demonstrated by the convergences and errors of the calculated properties such as PDFs and viscosity. The time step is 1 fs. The total energy drift was ∼2–5 meV/atom/ps. Extensive tests were performed to balance between the accuracy and efficiency of the simulations by systematically tuning simulation parameters, including those related to convergences, real space projection, and time step among others. After equilibration, each of the simulations was run up to 23 ps (23,000 steps) for statistical analysis. The direct outputs from the simulations include a trajectory containing system volume, total energy, stress tensor, magnetic moments, and positions of all atoms at each of the steps. The length of the simulation is adequate to compute the averaged properties by monitoring the statistics of the properties and the convergence of the correlation functions (e.g., the stress correlation function for viscosity calculation). The Pulay stress from the finite plane-wave basis set (Francis and Payne, 1990) and systematic errors from the GGA approximation cause an error in the calculated pressure (Perdew et al., 2008). A pressure correction of 7.27 GPa was applied to all the results based on the calculated Pulay stress from selected systems and further benchmarked by the pair distribution functions from the experimental data (Lai et al., 2017).
Analysis of the Structural and Dynamic Properties
The system potential energy, magnetic moment per atom, and pressure (with corrections) were calculated by averaging the properties over the trajectory. Total and individual PDFs were calculated in a similar fashion. Nearest neighbor CNs were calculated by integrating the PDFs. Due to the size of the computational supercell (∼12 Å), the spatial correlation length that can be sampled without the effect from the periodic boundary images is ∼6 Å, which was used for the cutoff distance for the PDFs. For comparison with experimental results, the intensities of pair distribution functions of different pairs (Fe-Fe, Fe-Ni, Ni-Ni, Fe-C, Ni-C, and C-C pairs) were scaled using the scattering factors derived under the experimental conditions, according to the Faber–Ziman formalism (Wagner and Halder, 1967): , where a,n, and k are the PDF, fractional concentration, and scattering factor respectively, and i and j are the two elements considered.
Self-diffusion coefficients were calculated from the mean squared displacement (MSD) using the Einstein relation:, where and represent the position of species α at time t + t0 and t, respectively. Brackets <> α represent the trajectory average of species α. Diffusion coefficients were then calculated from the long-time slope of the MSD as a function of time (Frenkel and Smit, 2002). To ensure that dynamics of simulations are in the diffusive regime, the simulations should be run long enough for most simulations so that the MSD as a function of time shows a clear linear behavior (∼t) at long times (Figures 9A–C). Optimally, the maximum MSD value should be greater than 10 Å2. However, in practice, it is challenging for the MSD to be over 10 Å2 for all the systems, especially for viscous systems, as a result of slow dynamics and computer resource limitations. A linear regime is approximated after the initial free molecular motion regime (∼t2) and intermediate regime. Shear viscosity was calculated from the stress autocorrelation function from equilibrium simulations based on the Green-Kubo relation (Allen and Tildesley, 1987; Frenkel and Smit, 2002; Ghosh and Karki, 2011): , where Pi,j is the symmetrized traceless part of the stress tensor σi,j defined by: , where δi,j is the Kronecker delta, the weighting factor is 4/3 for each of the three diagonal components and 1 for each of the six off-diagonal components, and σi,j was directly calculated from the simulation. The viscosity was calculated from the integration of the correlation function over long times. However, in practice, the statistical error of the viscosity integral increases with time because the autocorrelation function itself decays to zero in a short time, after which time the contribution to the integral is mainly noise (Alfe, 2010). The convergence of the stress correlation function was less than 1 ps. Equilibrium simulations of up to 23 ps are adequate to obtain the averages of the structure and dynamic properties with acceptable uncertainties.
Results and Discussion
Energetics, Magnetic Properties, and the Equation of State
The potential energy, magnetic moment, and pressure as a function of volume are plotted in Figure 1 for the Fe-Ni-C liquid at 1673 K. The potential energy has a minimum around ∼10.26 Å3/atom or a density of ∼7.67 g/cm3 at a pressure of 16.3 GPa and temperature of 1673 K (Figure 1A). The magnetic moment per Fe/Ni decreases gradually from ∼2.0 μB as the volume decreases, and the decrease steepens for volumes less than ∼10.3 Å3/atom, approximately corresponding to the potential energy minimum (Figure 1B). The magnetic moment collapses at ∼70 GPa and 1673 K, which is similar to the crystalline Fe7C3 phase (Mookherjee et al., 2011), and the Fe3C phase (Vočadlo et al., 2002; Ono and Mibe, 2010) based on similar DFT calculations but computed at 0 K temperature. The effect of temperature mainly shifts the volume at which the magnetic moment collapses by ∼0.5 Å3/atom to a larger volume with respect to the volumes calculated at 0 K for the Fe7C3 and Fe3C phases. Reported magnetic transition pressures from experiments vary from as high as 68 GPa to as low as 6.5 GPa for crystalline carbides (Gao et al., 2008; Fiquet et al., 2009; Chen et al., 2012, 2014, 2018). Both experiments and theoretical calculations show that there is no apparent structural change associated with the magnetic transition of the Fe carbide crystalline phases (Lin et al., 2004; Chen et al., 2012; Prescher et al., 2012), similar to the Fe-Ni-C liquid presented here.
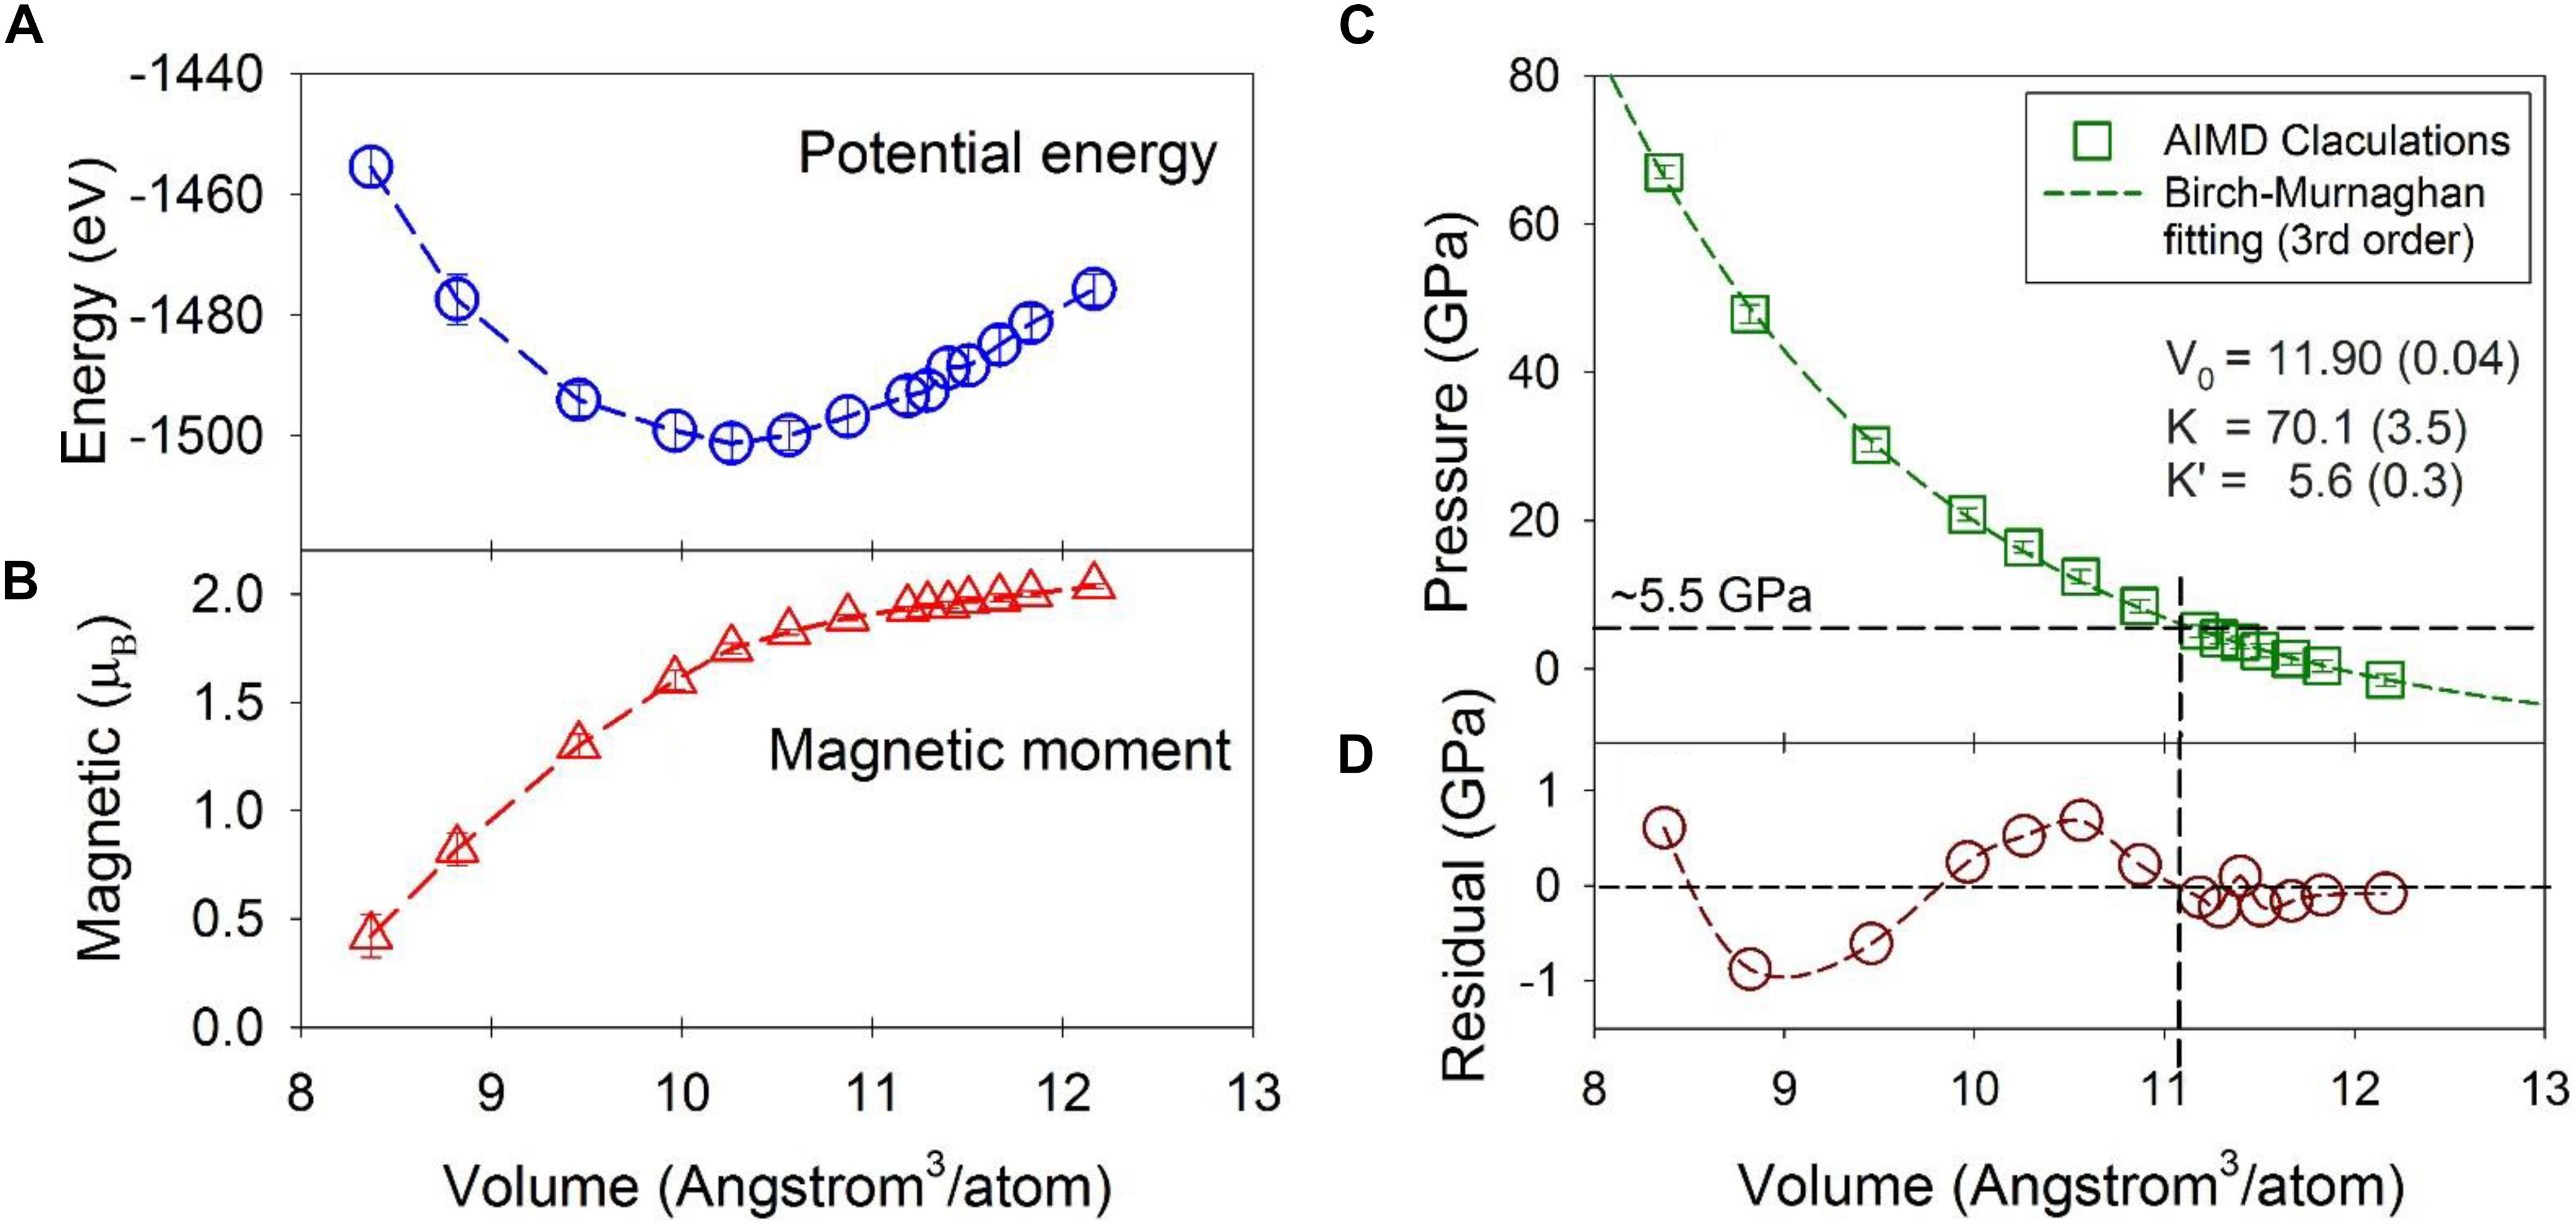
Figure 1. Statistical averages from the first-principles molecular dynamics simulations as a function of volume (Å3/atom) at 1673 K. (A) System potential energy (eV). (B) Magnetic moment per Fe or Ni atom (μB). (C) Pressure and the fitted curve from the third order Birch-Murnaghan equation. (D) The residual of the fitting. The average and standard deviation were calculated over the MD simulation at each volume. Error bars denote one standard deviation of the data and most are within the symbol size. The actual errors are about one magnitude smaller than the standard deviation. Dashed lines are intended to guide the eye.
The calculated pressure as a function of volume is plotted in Figure 1C. The third-order Birch-Murnaghan equation (Birch, 1947) was used to fit the calculated data with a result of V0 = 11.90 ± 0.04 Å3/atom (or ρ0 = 6.65 g/cm3), and a bulk modulus, KT0 = 70.1 ± 3.5 GPa and its pressure derivative, K’ = 5.6 ± 0.3 (Figure 1C). These are comparable to the experimentally observed values of 6.91 g/cm3, 83.9 GPa, and 5.9 respectively for Fe liquid with 3.5 wt% C at 1700 K (Jimbo and Cramb, 1993; Shimoyama et al., 2016). The lower values from the present study are likely due to our slightly higher C content (5 wt%).
Although the fit to the data by the Birch-Murnaghan equation appears high-quality, the residuals of the fit to the MD results show systematic deviations from the finite strain fit (Figure 1C). In particular, at volumes larger than ∼11 Å3/atom (∼5 GPa), the residuals are small and within ∼ ± 0.2 GPa (Figure 1D), at the same level of the error (note the error is one magnitude smaller than the standard deviation plotted in Figure 1C). At smaller volumes, the residuals oscillate by as much as ∼ ± 1 GPa, which is statistically significant because the statistical error of the calculated pressure is ∼ 0.1 GPa. The oscillation, i.e., positive at volumes between 11 and 10 Å3/atom and negative between 10 and 8.5 Å3/atom with a similar amplitude, signals that a single 3rd-order finite strain equation of state is insufficient to fit the higher pressure data, and that the structural shifts above ∼5 GPa produce a different equation of state. Indeed, by fixing K’ = 5.6 and using the same 3rd-order Birch-Murnaghan equation, two separate piece-wise fittings of the data with volumes greater than and smaller than 11 Å3/atom (or below and above ∼5 GPa) produced a better overall fitting statistic and a larger bulk modulus for volumes less than 11 Å3/atom. The summed square of the residuals with volumes greater than 11 Å3/atom is reduced from 0.21 to 0.08 (a 0.13 decrease), and that with volumes smaller than 11 Å3/atom is reduced from 2.3 to 2.1 (a 0.2 decrease). Accordingly, these results are consistent with a stiffening of the liquid above ∼5 GPa, and with a liquid-liquid polyamorphic transition at the corresponding volume of ∼11 Å3/atom. The liquid-liquid polyamorphic transition was indicated by the changes of the second nearest neighbor peaks in the PDFs in a previous study using experimental and first-principle MD simulations (Lai et al., 2017). The changes are manifested as notable reduction in peak positions of the subpeaks of the second nearest neighbors at around 5 GPa. Notably, no discrete shift in volume is resolved at the transition; rather, the data are consistent with a shift in compressibility, implying that the polyamorphic transition has features in common with a second-order phase transition in crystalline materials. The key feature that the MD calculations allow is the ability to probe the pressure-dependent structural changes that might contribute to this change in elasticity.
Local Structure and Nearest Neighbor Coordination
Calculated PDFs of the Fe-Ni-C liquid at 1673 K and 1.3 GPa are plotted in Figure 2A, which well reproduce the experimentally measured PDF at 1673 K and 1.5 GPa in terms of both the peak positions and shapes (Lai et al., 2017). In the scattering-factor normalized PDFs (Figure 2A), the Fe-Fe and Fe-Ni pairs are the main components in the first and second main peaks and the C-Fe/Ni and C-C contributions are barely visible due to the much smaller X-ray scattering factor of C. The un-normalized PDFs of individual pairs (Figures 2C,D) suggest that a minor peak around 1.93 Å in the normalized PDF (Figure 2A) corresponds to the Fe/Ni-C pair (Figures 2C,D), which could be easily obscured by noise in experimentally observed PDFs as a result of the Fourier transformation of high frequencies (with associated noise) being mapped into short distances (Lai et al., 2017).
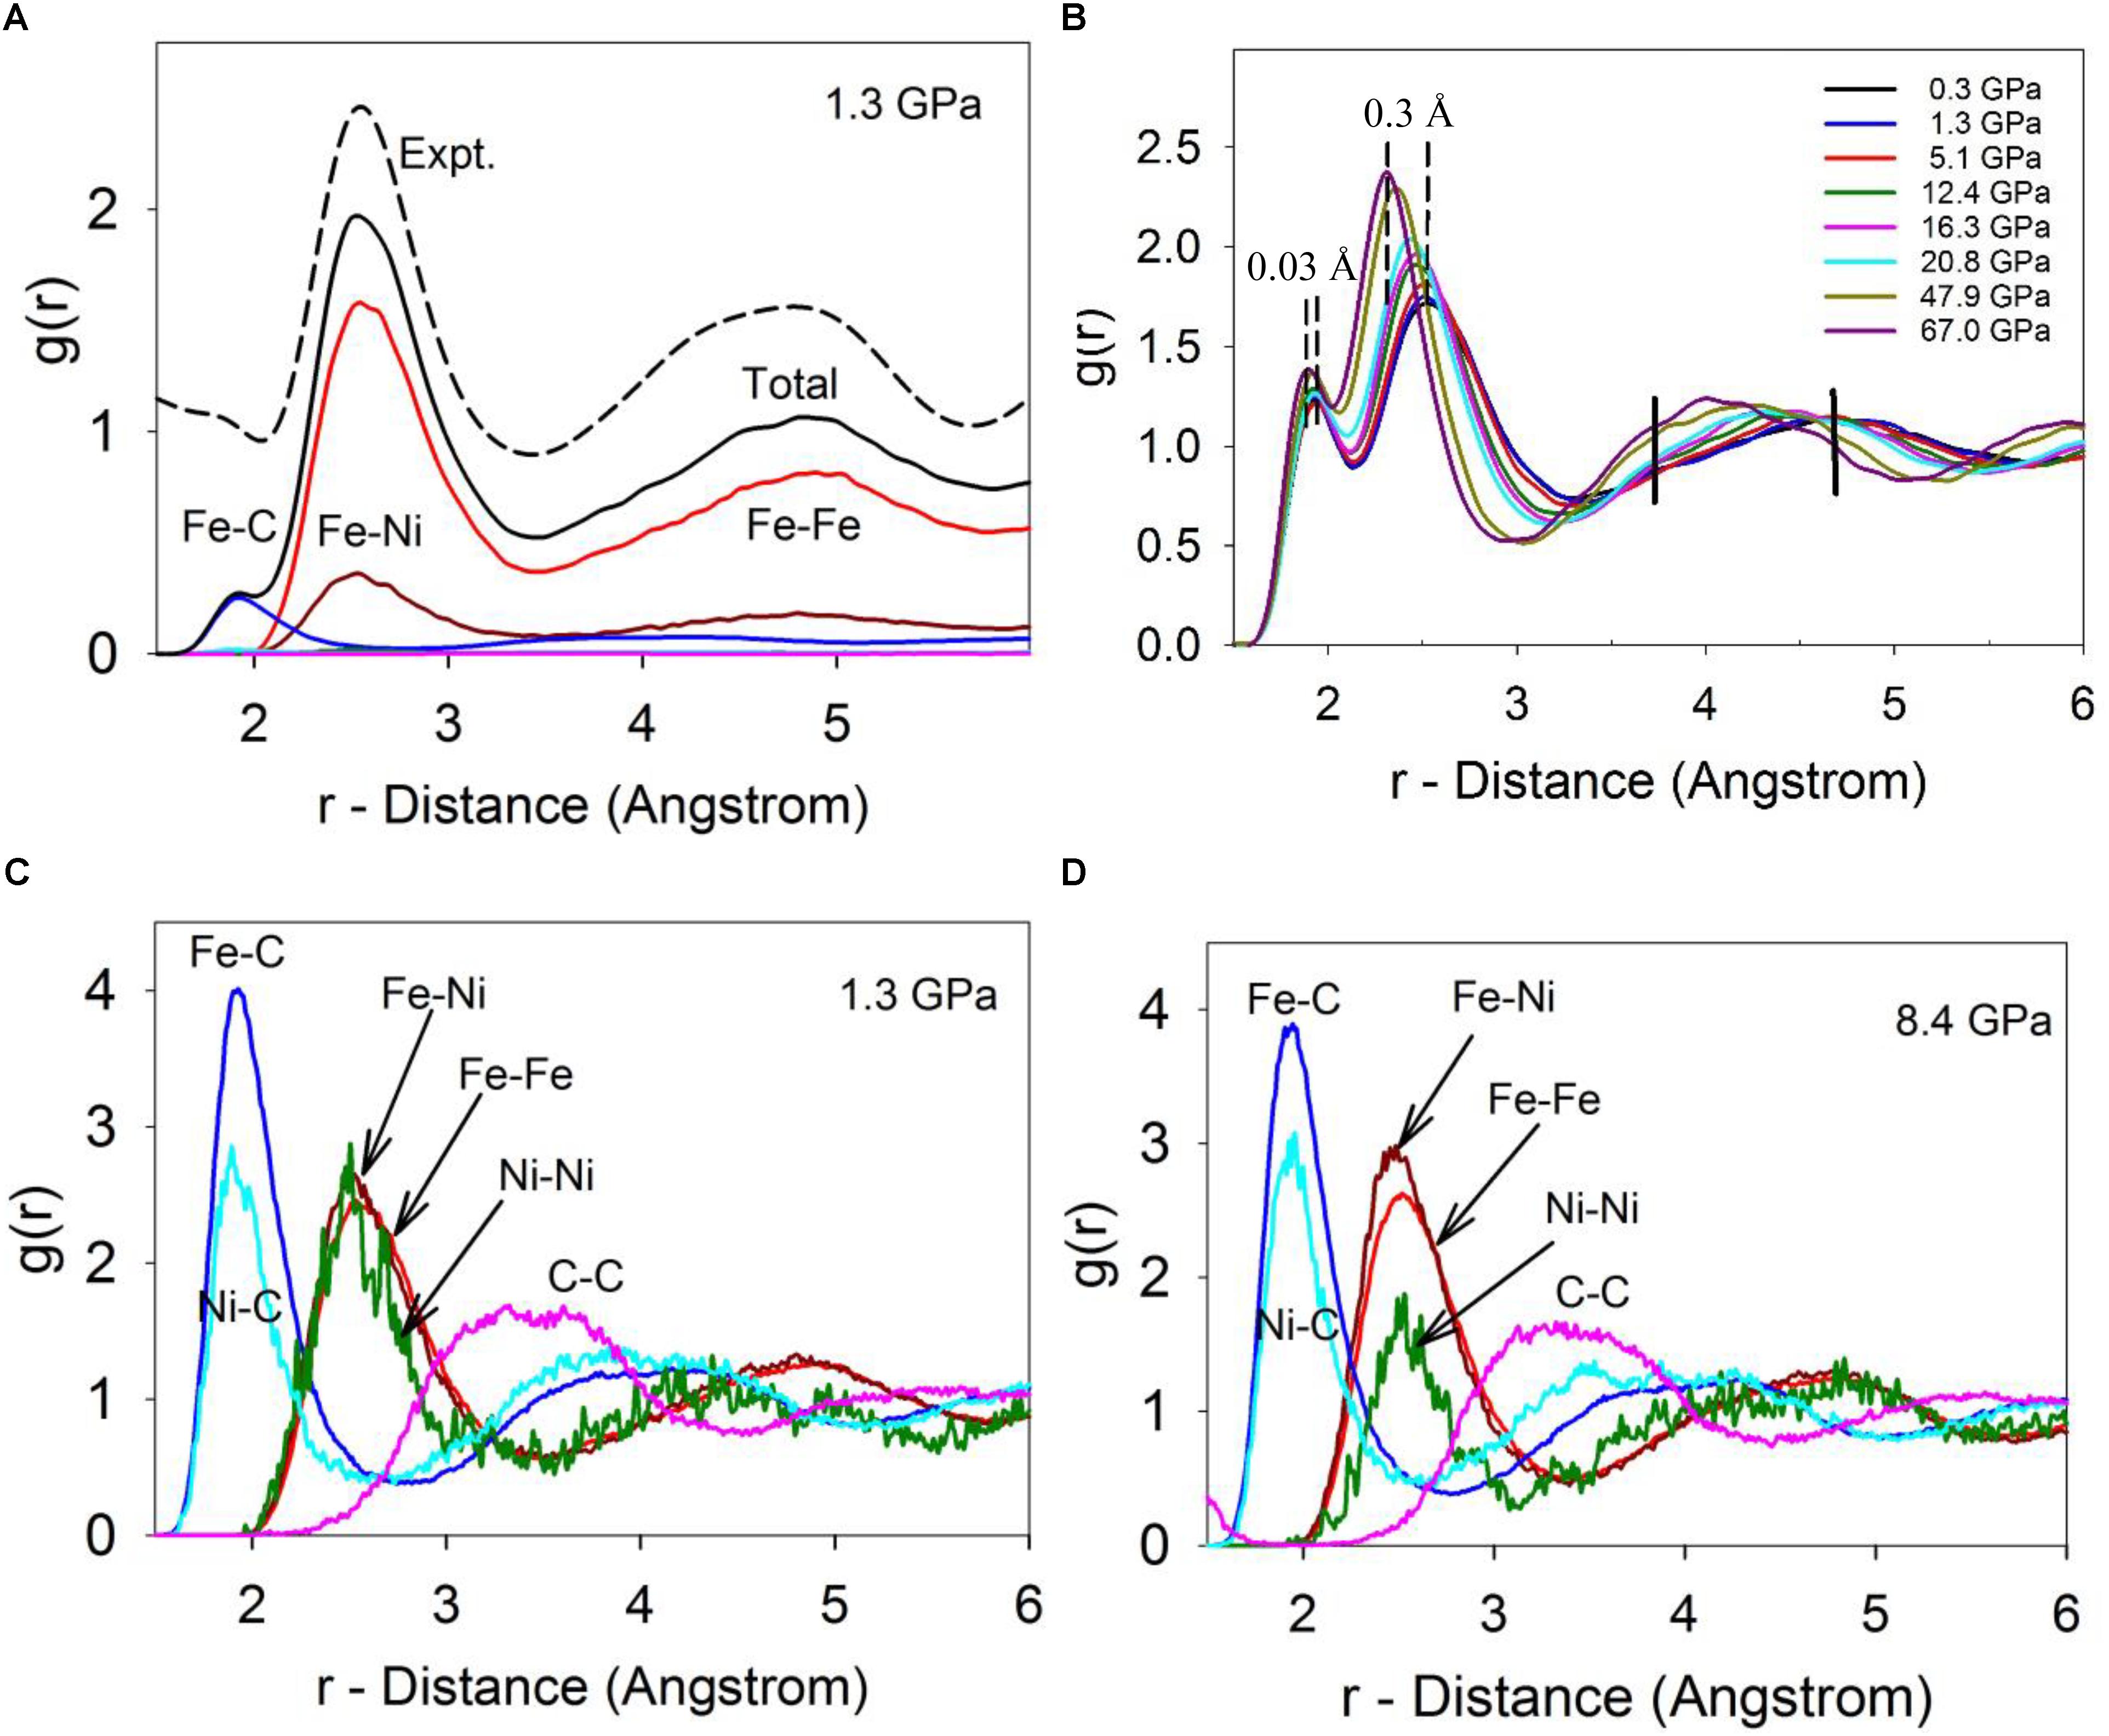
Figure 2. The calculated pair distribution function (PDF). (A) Calculated total and individual PDFs at 1673 C and 1.3 GPa, in comparison with experimentally measured PDF at 1673 C and 1.5 GPa (dashed-line, top). The calculated PDFs were normalized by X-ray scattering factors in order to compare with the experimental PDF. (B) The calculated total RDFs of Fe-Ni-C liquid at 1673 K and different pressures. (C) The individual un-normalized PDFs at 1673 K and 1.3 GPa. (D) The individual pairs of PDFs at 1673 K and 8.4 GPa.
Deviations from random mixing of Fe and Ni within the liquid (including whether carbon might prefer bonding to one transition metal relative to the other) can be qualitatively addressed from the PDFs. Clustering of similar atoms (which could indicate the potential onset of a miscibility gap) or a preference for heterogeneous bonding environments (which could imply local ordering within the liquid) can be detected based on the nearest neighboring environment because non-random mixing will lead to disparities in the first peaks of the PDFs between the mixing elements. In particular, since the PDFs are normalized by their number densities, differences between their PDFs after scaling by bond distance can be used to understand their miscibility. If Fe and Ni are indistinguishable, completely miscible, and randomly mixed at the atomistic level, their RDFs should be very close (with a slight offset from their different sizes). As shown in Figure 2C, at low pressure, Fe and Ni appear fully miscible as shown by the almost identical Fe-Fe, Fe-Ni, and Ni-Ni PDFs. The higher noise level of the Ni-Ni peak arises due to the low concentration of Ni. However, as pressure increases (Figure 2D), the Fe-Ni peak around ∼2.5 Å becomes larger than the Fe-Fe peak and substantially larger than the Ni-Ni peak. This shift in relative peak sizes is statistically significant, and suggests that Fe and Ni prefer bonding to each other over bonding to themselves as pressure is increased. This preference may suggest a local (first nearest neighboring) non-random chemical ordering occurs in the liquid between Fe and Ni. Similarly, for C, the first C-Ni peak intensity is lower than the first C-Fe peak, which suggests C atoms prefer bonding to Fe over Ni, and this preference persists as pressure increases (Figures 2C,D).
As pressure increases, the first two main peaks shift to smaller distances, corresponding to the C-Fe/Ni and Fe/Ni-Fe/Ni bond distances (Figure 2B). It is intriguing that the bond distances, as indicated by their respective peak positions at maximum height, are compressed differently. The C-Fe/Ni bond distance decreases from ∼1.93 Å to ∼1.90 Å by ∼0.03 Å, or 1.55% from 0 to 67 GPa, in contrast with the Fe/Ni-Fe/Ni distance that compacts from ∼2.60 Å to ∼2.30 Å by ∼0.3 Å or 11.5% in the same pressure range (Figure 2B). The Fe/Ni-Fe/Ni distance change is consistent with a ∼32% decrease of the system volume, 1.0-(1.0–0.115)3 ≈ 0.31. In contrast, the C-Fe/Ni distance change only corresponds to a ∼5% volume decrease, 1.0-(1.0–0.0155)3 ≈ 0.05. The dramatically different responses of the two bond distances reflect their distinct chemical bonding characteristics, where the C-Fe/Ni bond exhibits a complex mixture of metallic, covalent, and ionic characters as in the Fe3C phase (Jiang et al., 2008), while the Fe/Ni-Fe/Ni bond is metallic. In short, the C-Fe/Ni distances are substantially more rigid than the metal-metal distances, reflecting both the more compact electronic configuration of C and its tendency to form stronger and more rigid bonds. A significant change occurs in the third peak, which reflects the intermediate-range structure of the liquid (Figure 2B: the intermediate-range order is discussed in detail below). The amplitude of the shoulder around ∼3.7 Å (marked as a vertical bar in Figure 2B) increases while the main peak position shifts from around ∼5 Å to ∼4 Å (the initial peak is marked as a vertical bar in Figure 2B). An abrupt change occurs around ∼5 GPa in the amplitude pattern between 3.5 and 5.3 Å (Figure 2B), which is associated with the liquid-liquid transition, and was observed in experiments and is discussed in detail in a separate publication (Lai et al., 2017).
Figure 3 shows the CN and the first minimum distance of Fe/Ni-Fe/Ni pairs. The CN lies within a narrow range close to ∼12 as pressure increases from 0 to 67 GPa (Figure 3A), suggesting a close-packed local structure over the pressure range. This result may support the notion that C atoms occupy the interstitial sites of the Fe/Ni liquid. The first minimum decreases almost linearly from ∼3.5 Å to ∼3.1 Å (Figure 3B). At pressures below the liquid-liquid transition (∼5 GPa), the CN does increase by 0.5 from about 11.7 to 12.2, while above the transition pressure, the CN remains ∼12 up to at least ∼40 GPa (Figure 3A). Such a change may be associated with the polyamorphic transition and a progressive shift to a more densely packed transition metal configuration. In contrast, the CN of C-Fe/Ni pairs increases continuously from ∼6.5 to ∼8.5 as pressure increases from 0 to 67 GPa (Figure 3C), suggesting a gradual change from approximately octahedral-dominated (CN ∼6) to cubic-dominated (CN ∼8) geometry over the pressure range. The first minimum distance only slightly decreases from ∼2.8 Å to ∼2.7 Å (Figure 3D). Note that the octahedral and cubic geometric descriptions of the liquid are highly simplified, and the local structure is both topologically irregular and undergoes constant dynamical changes. The change in C-Fe/Ni bond distance is steeper below the polyamorphic transition pressure (∼5 GPa) than above the transition pressure (Figure 3D), which may be related to the relative compressibility difference of the liquid before and after the transition, consistent with the polyamorphic transition at ∼5 GPa. As an important side note, it is difficult to quantitatively assess how the entropy of the liquid might shift across the polyamorphic transition from the structural data shown in Figure 3. It is possible that the shift in the CN of Fe/Ni-Fe/Ni to a value near 12 at the transition (Figure 3A) could be indicative of more regular coordination spheres above ∼5 GPa, and hence a lower entropy of the higher pressure liquid. However, by analogy with the observation of a shift in elasticity near the transition without a resolvable shift in volume (Figure 1D), it is possible that the shift in thermal properties associated with the transition may primarily be reflected in the heat capacity of the liquid, rather than in the entropy. Nevertheless, if a decrease in entropy is associated with more regular coordination and cluster formation at high-pressures, then a correlation could be drawn between lowered entropy of the liquid, cluster formation, and an increase in viscosity at high pressures that we describe below.
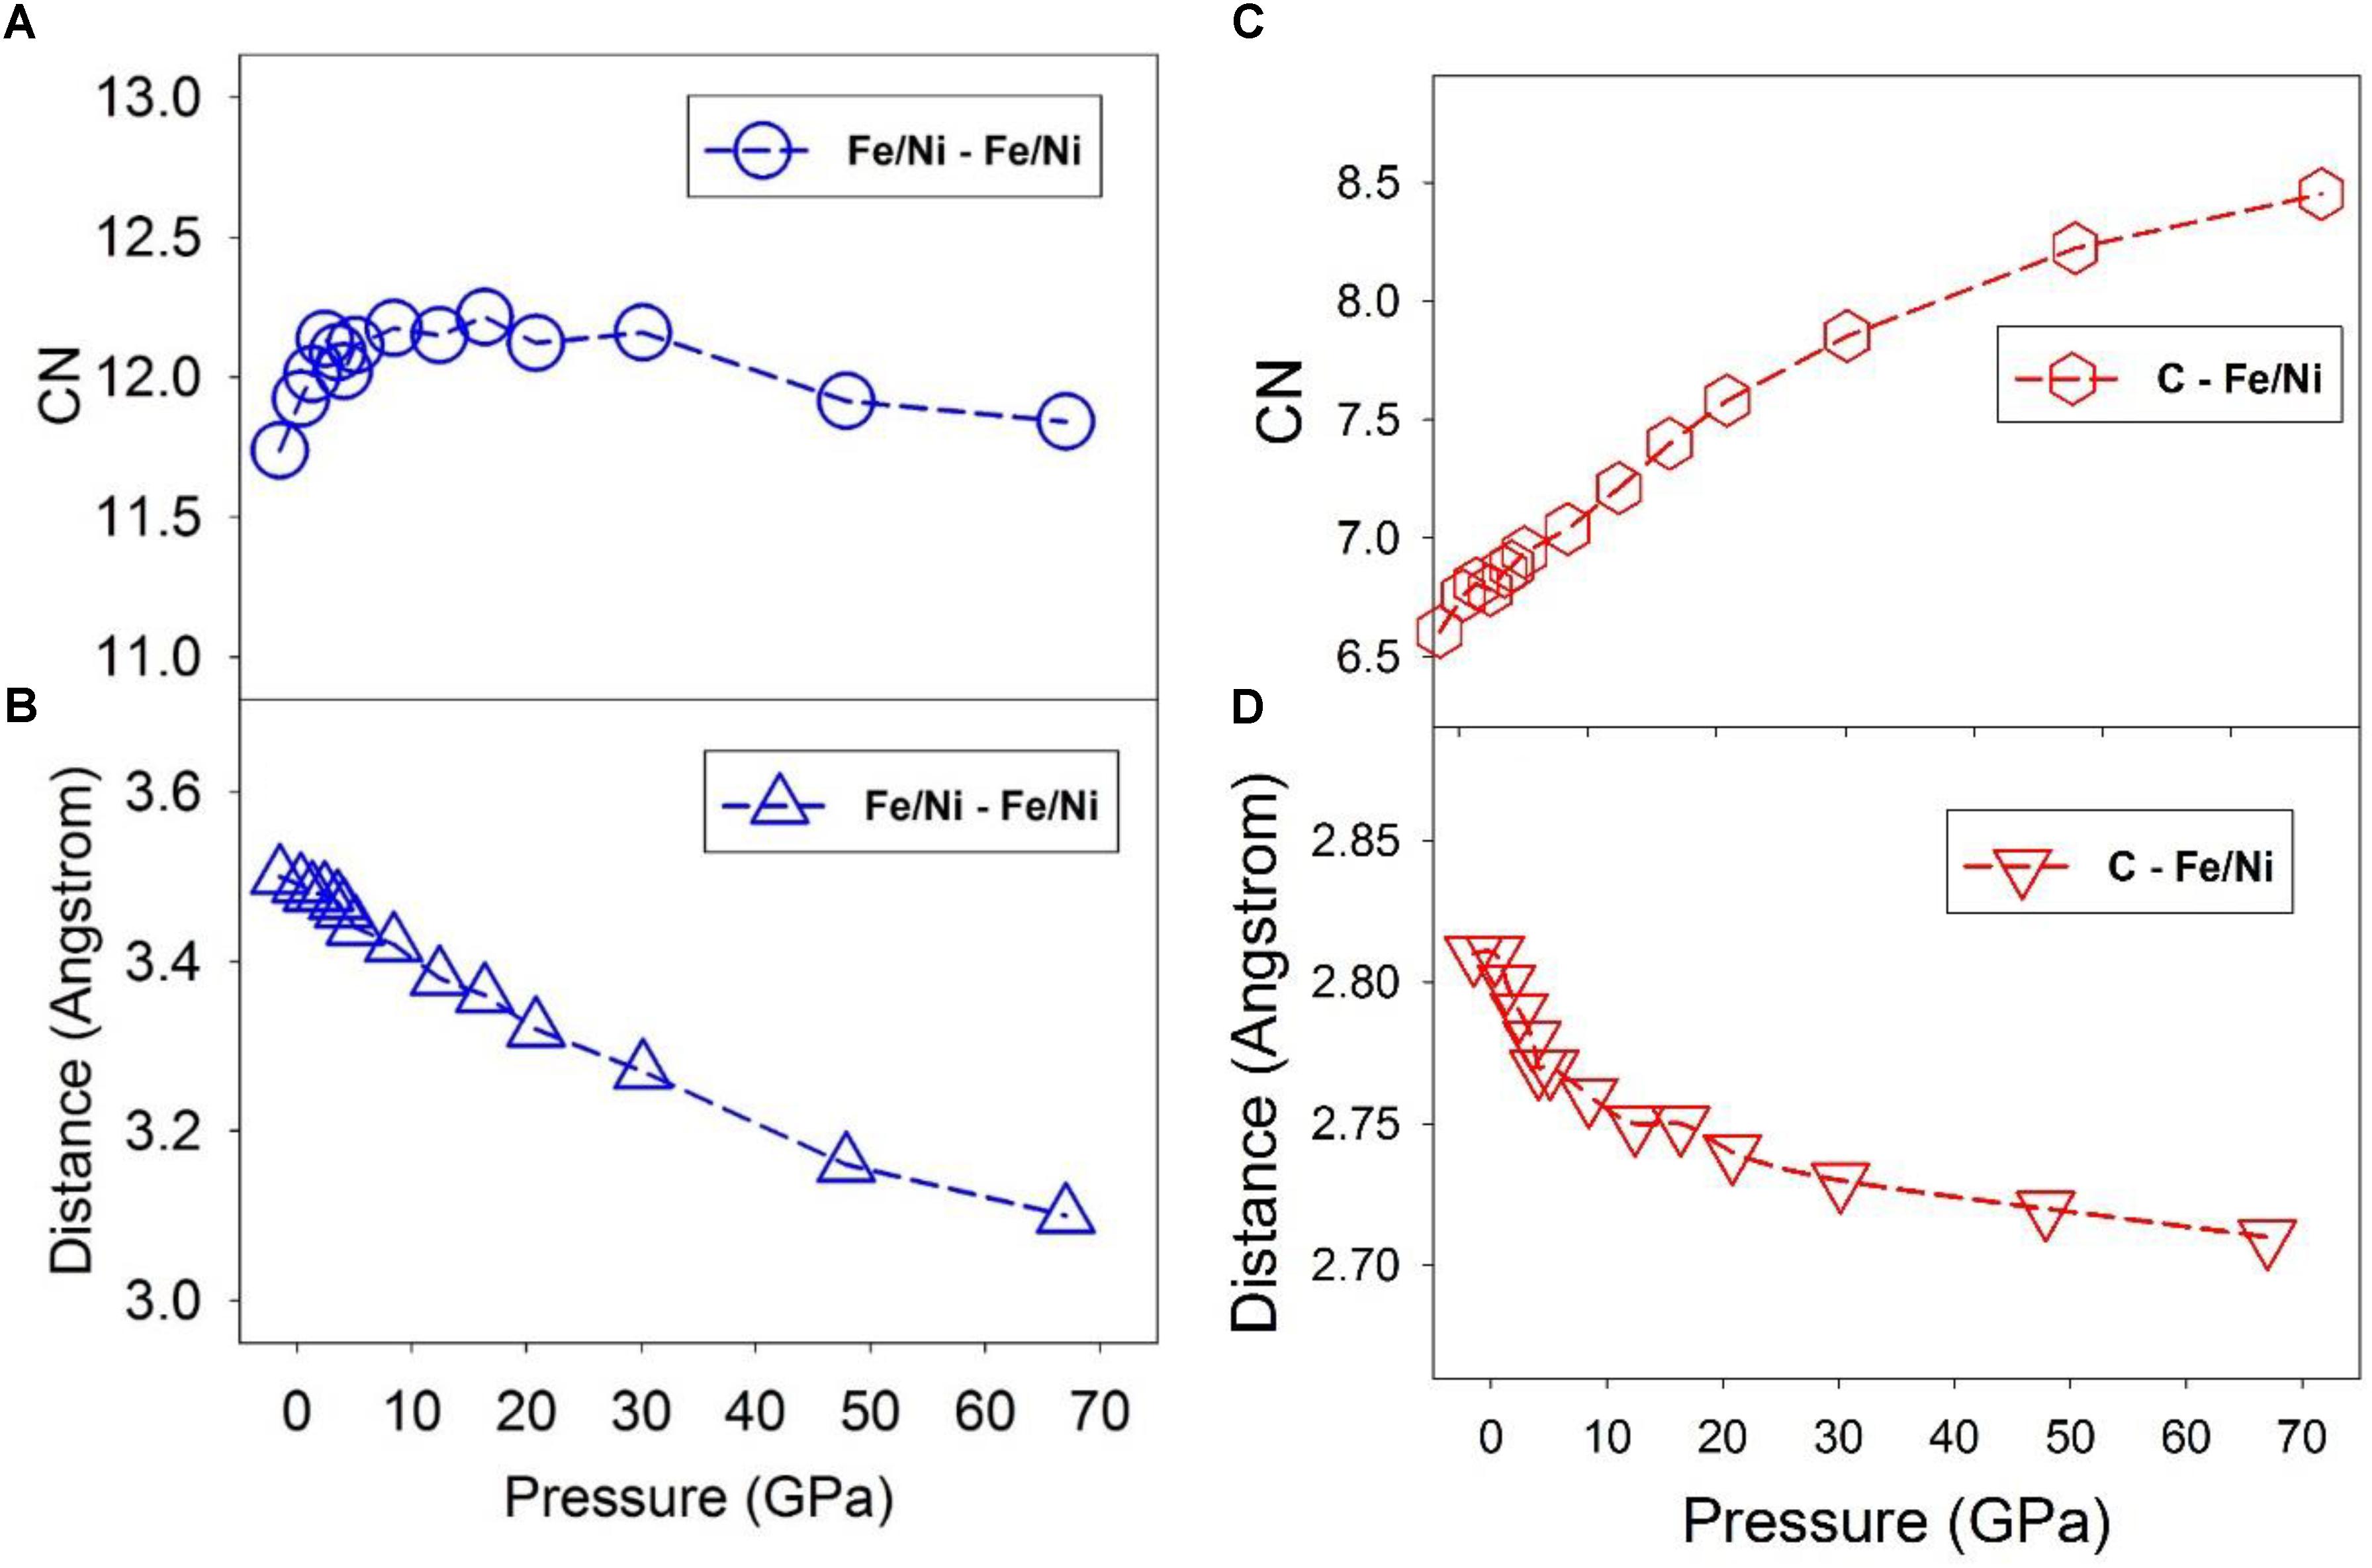
Figure 3. Coordination number (CN) of nearest neighbor and first minimum distance of the PDF at 1673 K and different pressures. Dashed lines are intended to guide the eye. (A) Fe/Ni – Fe/Ni CN. (B) Fe/Ni – Fe/Ni distance of the first minimum of the PDF. (C) C – Fe/Ni CN. (D) C – Fe/Ni distance of the first minimum of the PDF.
Geometries of the Fe/Ni-Fe/Ni and C-Fe/Ni coordination described by the bond angle distribution shown in Figure 4 are consistent with the CNs and first minimum distances (Figure 3). The distribution of the Fe/Ni-Fe/Ni-Fe/Ni angles between a central Fe/Ni atom with two nearest neighboring Fe/Ni atoms does not resolvably change as pressure increases (Figure 4A). The pressure effect does, however, make the distribution narrower. The distribution with peaks around 60°, near 120°, and near 180° is consistent with a close-packed structure and the CN of 12 throughout the pressure range (Figure 3A). In contrast, a nearly linear configuration of Fe/Ni-C-Fe/Ni bond angles (∼180°) at lower pressures effectively disappears at higher pressures (Figure 4B). This result suggests that the C-Fe/Ni coordination gradually changes from an octahedrally dominated (CN = 6) to a cubic-dominated (CN = 8) geometry in response to the pressure increase. This coordination shift is accomplished without much of a change in the C-Fe/Ni bond distances.
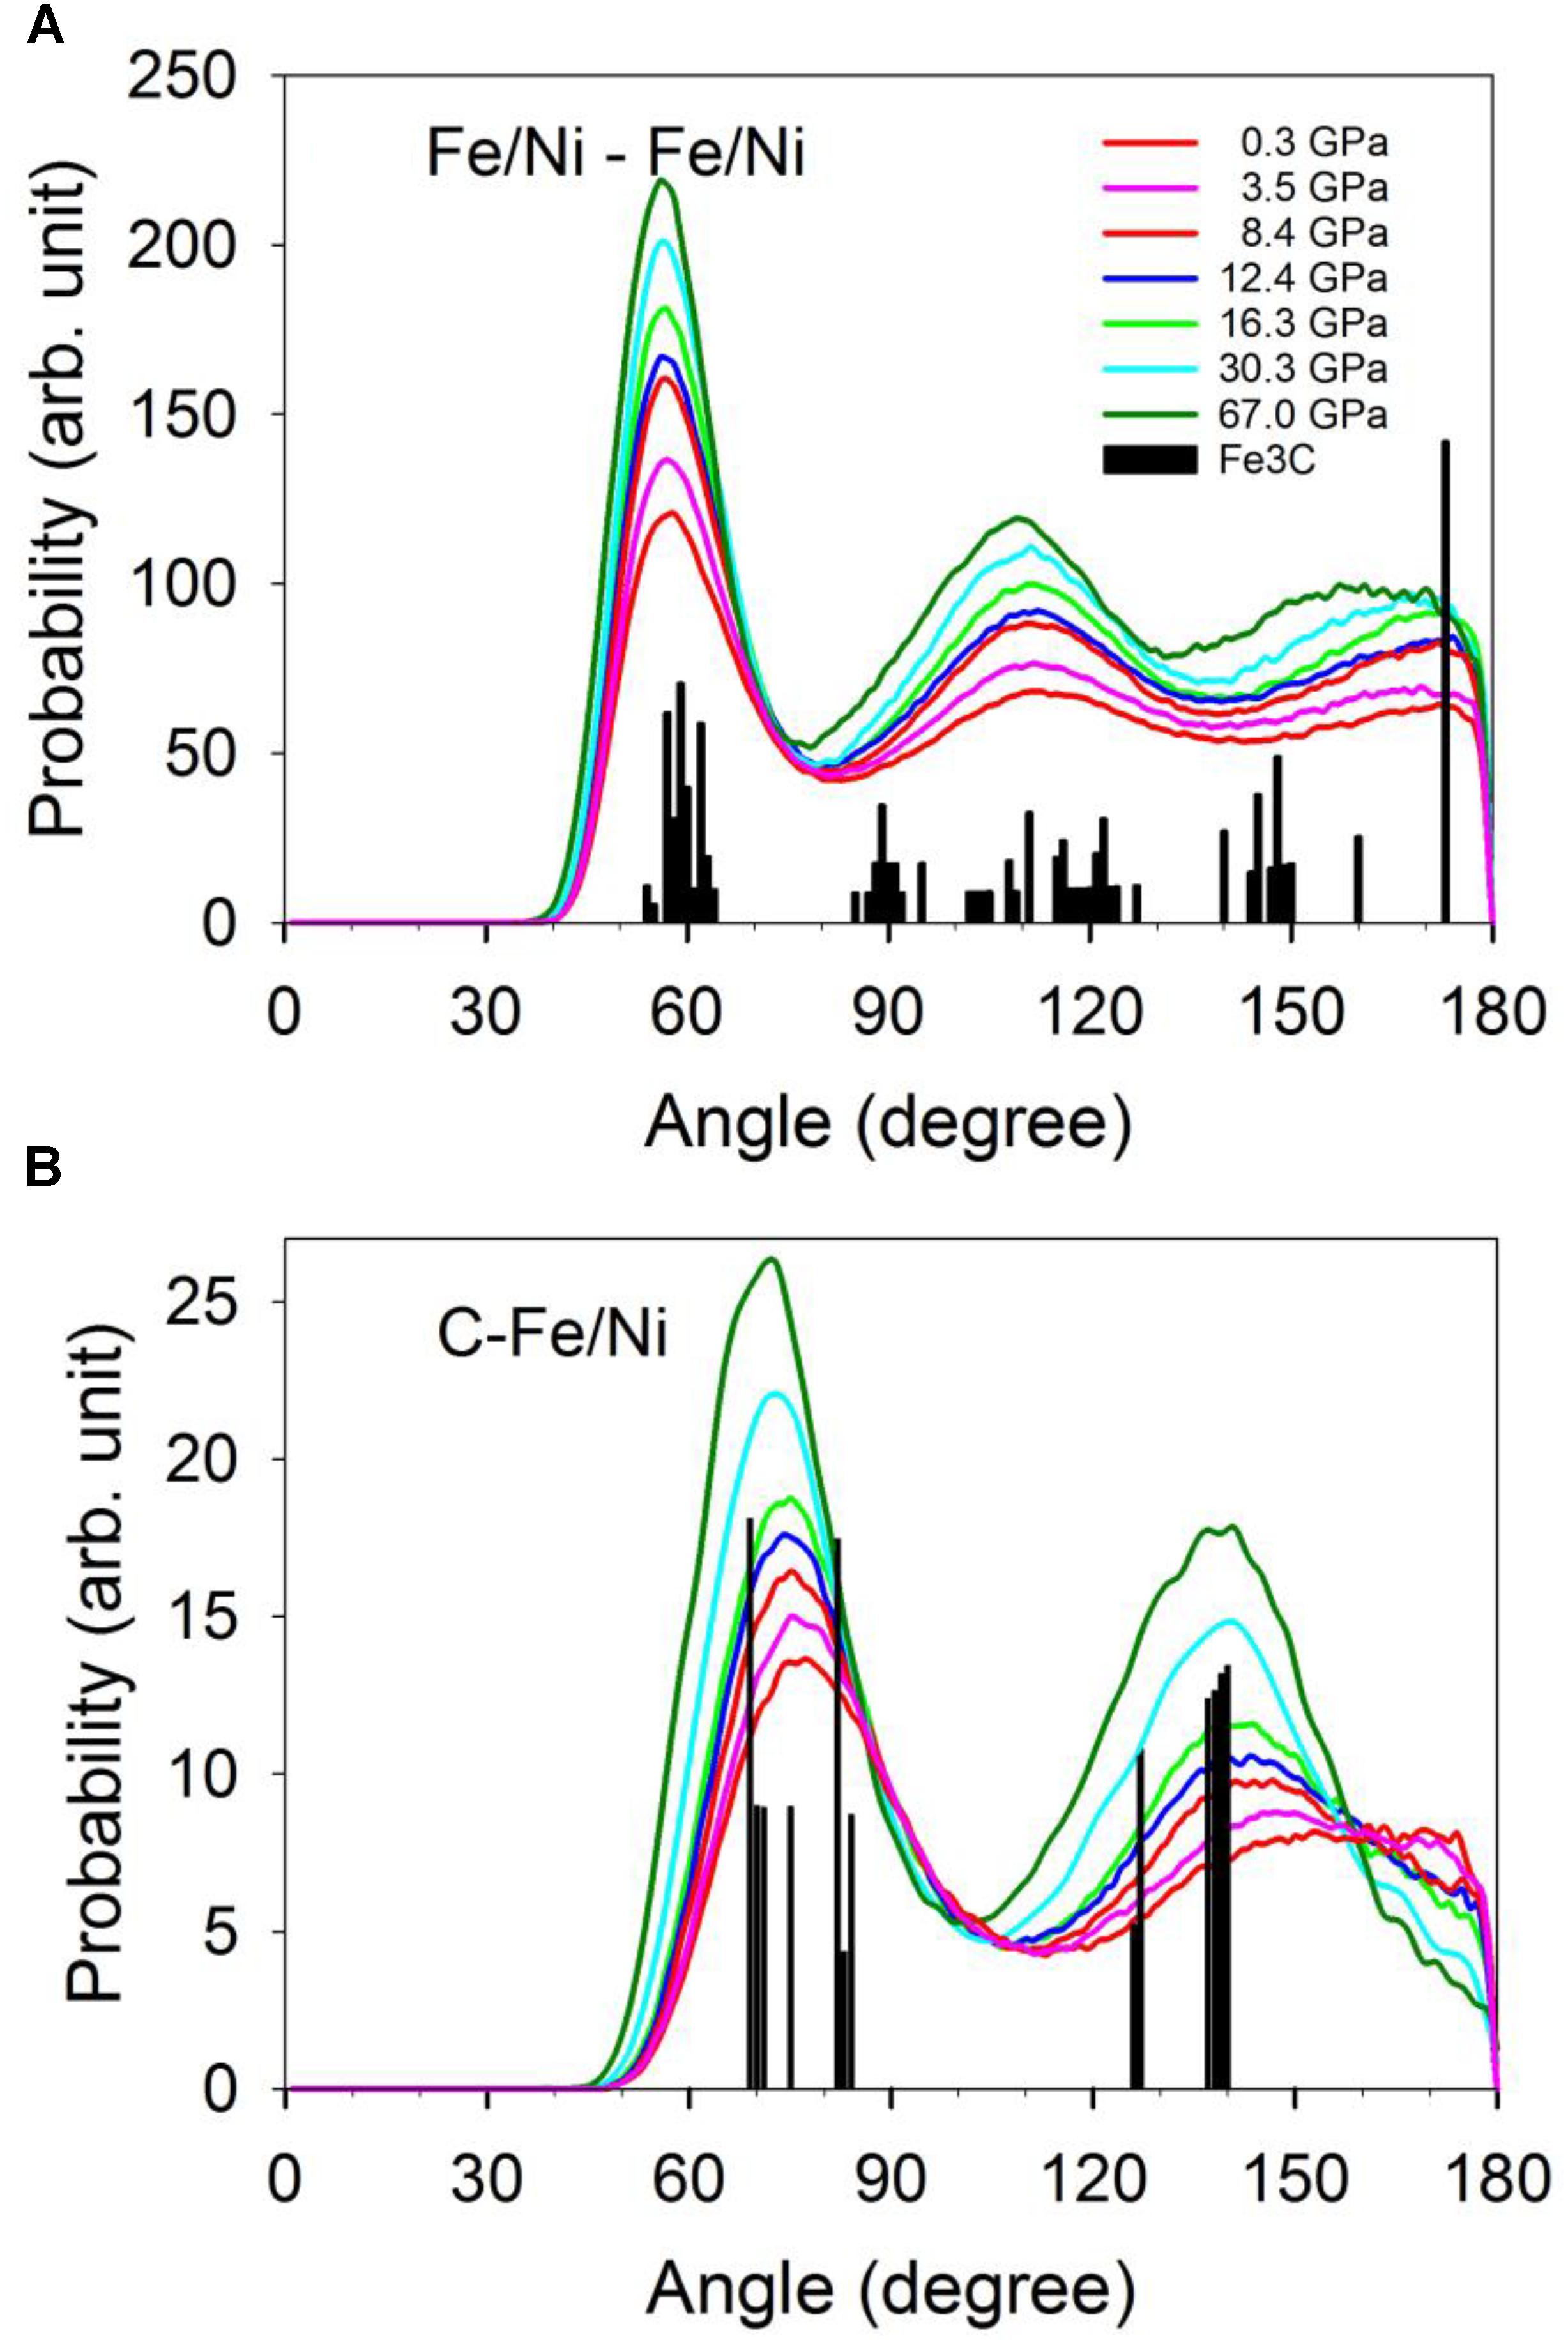
Figure 4. Distribution of the angles between the central atom with two coordinated Fe/Ni. (A) The central atom is Fe/Ni. (B) The central atom is C. The vertical bars are the distribution of the angles of the Fe3C phase.
Intermediate-Range Structure and Polyhedral Connectivity
The intermediate-range structure of the liquid can be described by the connectivity between individual polyhedra via shared common atoms. As shown in Figure 5A, 1-atom (red), 2-atom (blue), 3-atom (magenta), and 4-atom (green) shared Fe/Ni-Fe/Ni polyhedra are highlighted in the computational simulation supercell. Total and partial configurationally decomposed PDFs of Fe/Ni-Fe/Ni polyhedra with different shared numbers of atoms at 1.3 GPa and 1673 K are plotted in Figure 5B. For comparison, the corresponding PDFs of the crystalline Fe3C phase are plotted in Figure 5C. The first peak (first shell) positions compare well between Fe-Ni-C liquid and the Fe3C phase, except that the distribution within the liquid is smeared out and substantially broadened. For the rest of the peaks, the relative peak positions between the liquid and the Fe3C phase are comparable except for a shift to longer distances within the liquid.
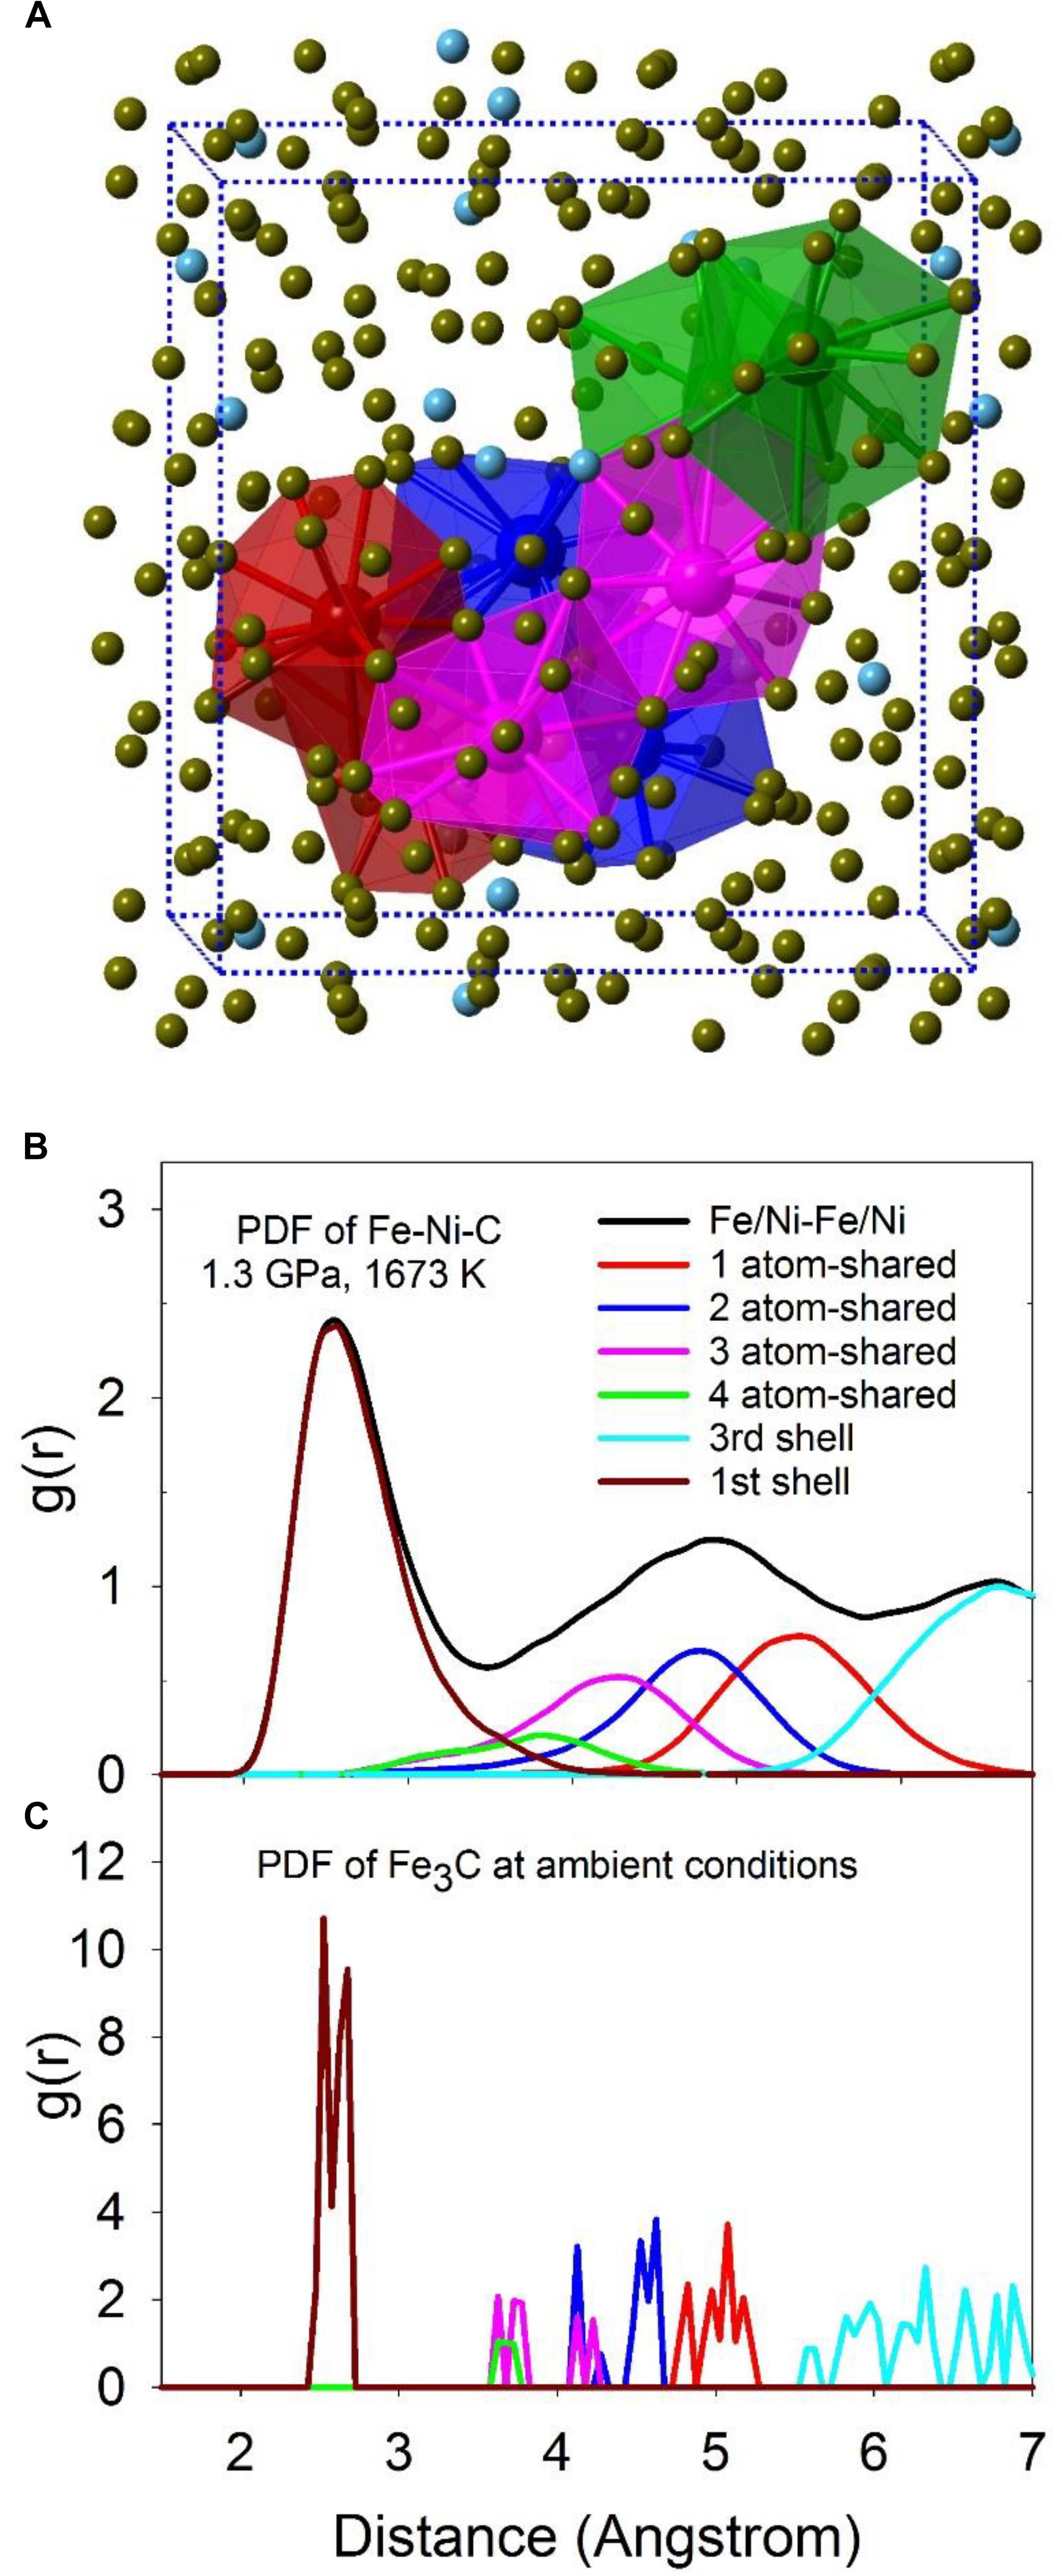
Figure 5. (A) A snapshot of MD simulations with the computational super cell highlighted in dashed lines. The two highlighted polyhedra for each type are 1-atom corner-shared (red), 2-atom edge-shared (blue), 3-atom face-shared (magenta), and 4-atom distorted face-shared (green) polyhedra of Fe/Ni atom. The center atoms in the polyhedra are Fe/Ni atoms, with their sizes enlarged for clarity. (B,C) The total PDF (black) and partial configurationally decomposed PDFs of Fe/Ni-Fe/Ni with different connection schemes: 1-atom corner-shared (red), 2-atom edge-shared (blue), 3-atom face-shared (magenta), and 4-atom distorted face-shared (green) connections. (B) Fe-Ni-C liquid at 1.3 GPa, 1673 K (Lai et al., 2017). (C) Fe3C at ambient condition.
The number of polyhedra sharing different numbers of atoms based on different connection schemes, or the CN of the polyhedra, is plotted as a function of pressure in Figure 6. At low pressures, the numbers of 1-, 2-, 3-, and 4-atom shared polyhedra are ∼20.5, ∼13, ∼9, and ∼2.2 for the liquid, compared to 19, 14, 7, and 2 for the Fe3C phase, respectively. These values are similar, except for the 3-atom shared polyhedra, which decreases by 2 within the crystal. This result suggests that the liquid structure, although different, bears similarities with the Fe3C phase in terms of the Fe/Ni-Fe/Ni network. For the 1-atom shared polyhedra, at pressures below the polyamorphic transition at ∼5 GPa, the CN is constant (Figure 6A), and above ∼5 GPa, there is a steady decrease of the CN from ∼20.6 to 19.6. The 2-, and 4-atom shared polyhedra have a CN of roughly around ∼13, and ∼2.5 respectively, which are more or less constant from 0 to 67 GPa (Figures 6B,D). In contrast, the 3-atom shared polyhedra increases from ∼9 to ∼11, without much of a change of the first shell CN (∼12) in this pressure range (Figures 6C, 3A). Notably, a steep increase of the 3-atom shared polyhedra CN occurs below the polyamorphic transition pressure at ∼5 GPa. The change of the number of 3-atom shared polyhedra has a significant implication for the liquid’s structure and dynamical properties because the 3-atom connected polyhedra may cause a markedly stable local intermediate-range structural environment. Such intermediate-range, face-sharing structures could lead to a higher viscosity based on the geometrical stability and the larger size of flow units within the liquid (Ding et al., 2015). A detailed discussion of possible implications of these structures for the low-pressure (below 8 GPa) properties of the liquid was reported along with the associated experimental result in a separate publication (Lai et al., 2017).
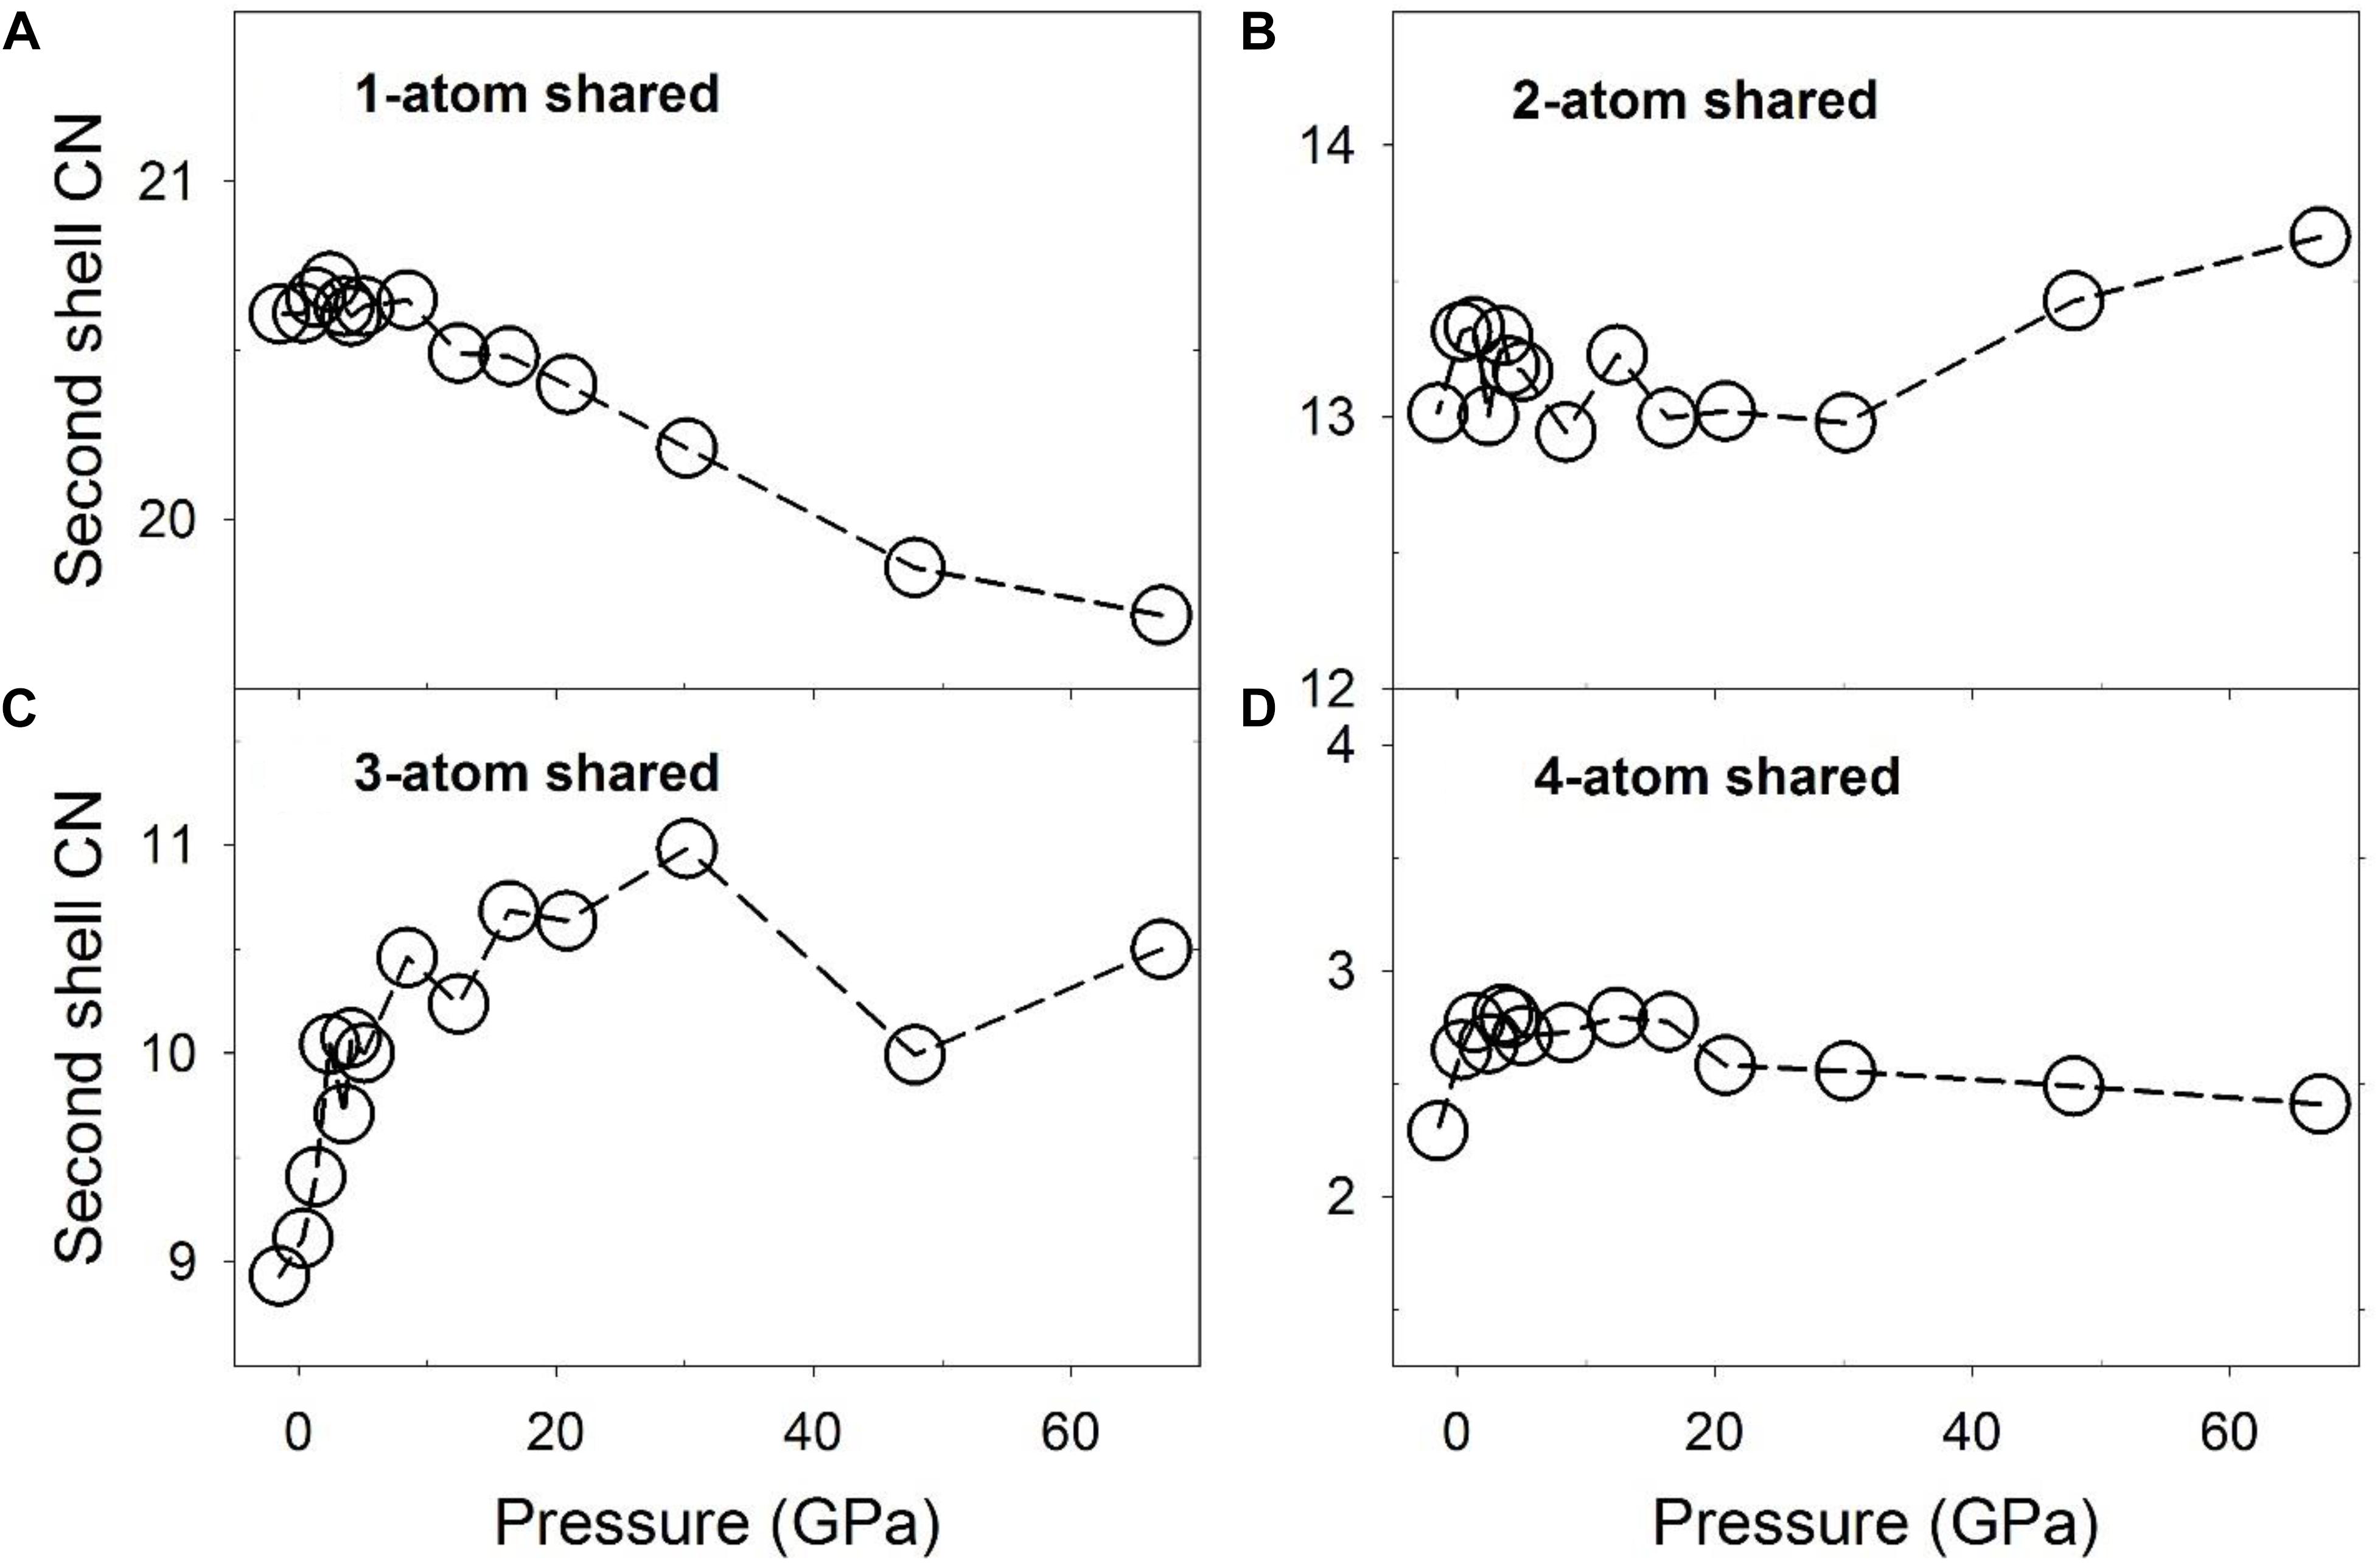
Figure 6. Coordination numbers (CNs) of Fe/Ni-Fe/Ni associated with partial configurationally decomposed PDFs as a function of pressure. (A) 1-atom corner-shared, (B) 2-atom edge-shared, (C) 3-atom face-shared, and (D) 4-atom shared connections.
The novel aspects of these results include that the CN of the 3-atom sharing Fe/Ni polyhedra reaches a maximum near 30 GPa (Figure 6C), implying that the 3-atom face-sharing configuration has a particularly extended structural configuration near this pressure. Notably, it is also near this pressure that the residuals from the fitting of a single Birch-Murnaghan equation of state (Figure 1D) are particularly large (and negative). Indeed, the initial rapid increase in the CN of 3-atom shared polyhedra truncates near 10 GPa, at a similar pressure to the largest positive fluctuation (Figure 1D). Thus, the residual fluctuations in Figure 1D that initiate at the ∼5 GPa structural transition in the liquid appear to reach their maximum and minimum values (Figure 1D) at pressures associated with changes in slope of the Fe/Ni CN of 3-atom face-sharing polyhedra (Figure 6C), implying that there is a direct correlation between the intermediate-range structure of the liquid and fluctuations in its equation of state. This correlation is further highlighted by the fact that the greater number of 3-atom shared polyhedra at higher pressures is correlated with a higher bulk modulus of the liquid at smaller volumes based on the piece-wise fitting of the Birch-Murnaghan equation of state.
Configurationally decomposed PDFs of C-Fe/Ni polyhedra sharing different numbers of atoms are plotted in Figure 7A for a pressure of 1.3 GPa and in Figure 7B for 67 GPa, along with that of the Fe3C crystal phase in Figure 7C for comparison. A significant change between low and high pressures is observed in the peak of the 3-atom shared polyhedra, which is absent in the Fe3C crystal structure. The CN of the C-Fe/Ni subsystem plotted in Figure 8 further illustrates this shift with pressure. The CN of 3-atom shared polyhedra increases almost linearly by a factor of five, from ∼0.3 to ∼1.5 as pressure increases from 0 to 67 GPa (Figure 8C). The CN of 1-atom shared polyhedra is nearly constant at ∼3.6 over the same pressure range (Figure 8A). The number of 2-atom shared polyhedra increases from ∼1.5 to ∼2.5 (Figure 8B). The number of 4-atom shared polyhedra increases dramatically, but the absolute number is rather small (Figure 8D). In the Fe3C structure, the CNs of 1- and 2-atom shared C-Fe polyhedra are 6 and 4, respectively, for a total CN of 10. For the Fe-Ni-C liquid at low pressure, the CNs of 1- 2-, 3-, and 4-atom shared C-Fe/Ni polyhedra are 3.5, 1.5, 0.3, and 0.004 respectively, for a total of 5.3, which increase to 3.5, 2.5, 1.5, and 0.03 at 67 GPa, for a total of 7.5. This result suggests that the liquid lacks the connectivity of the C-Fe/Ni network associated with the crystalline phase. But as pressure increases, the overall connectivity increases, and a new cluster, i.e., the 3-atom shared polyhedron, emerges, which is absent in the Fe3C crystal structure. The increase of the CN associated with 3-atom shared polyhedra of the C-Fe/Ni network with pressure is similar to that observed for the Fe/Ni-Fe/Ni network up to 30 GPa, which, in both cases, may reflect a consistent enhancement of the packing of three-fold shared polyhedra, which plausibly exercise an effect on the dynamic properties of the liquid.
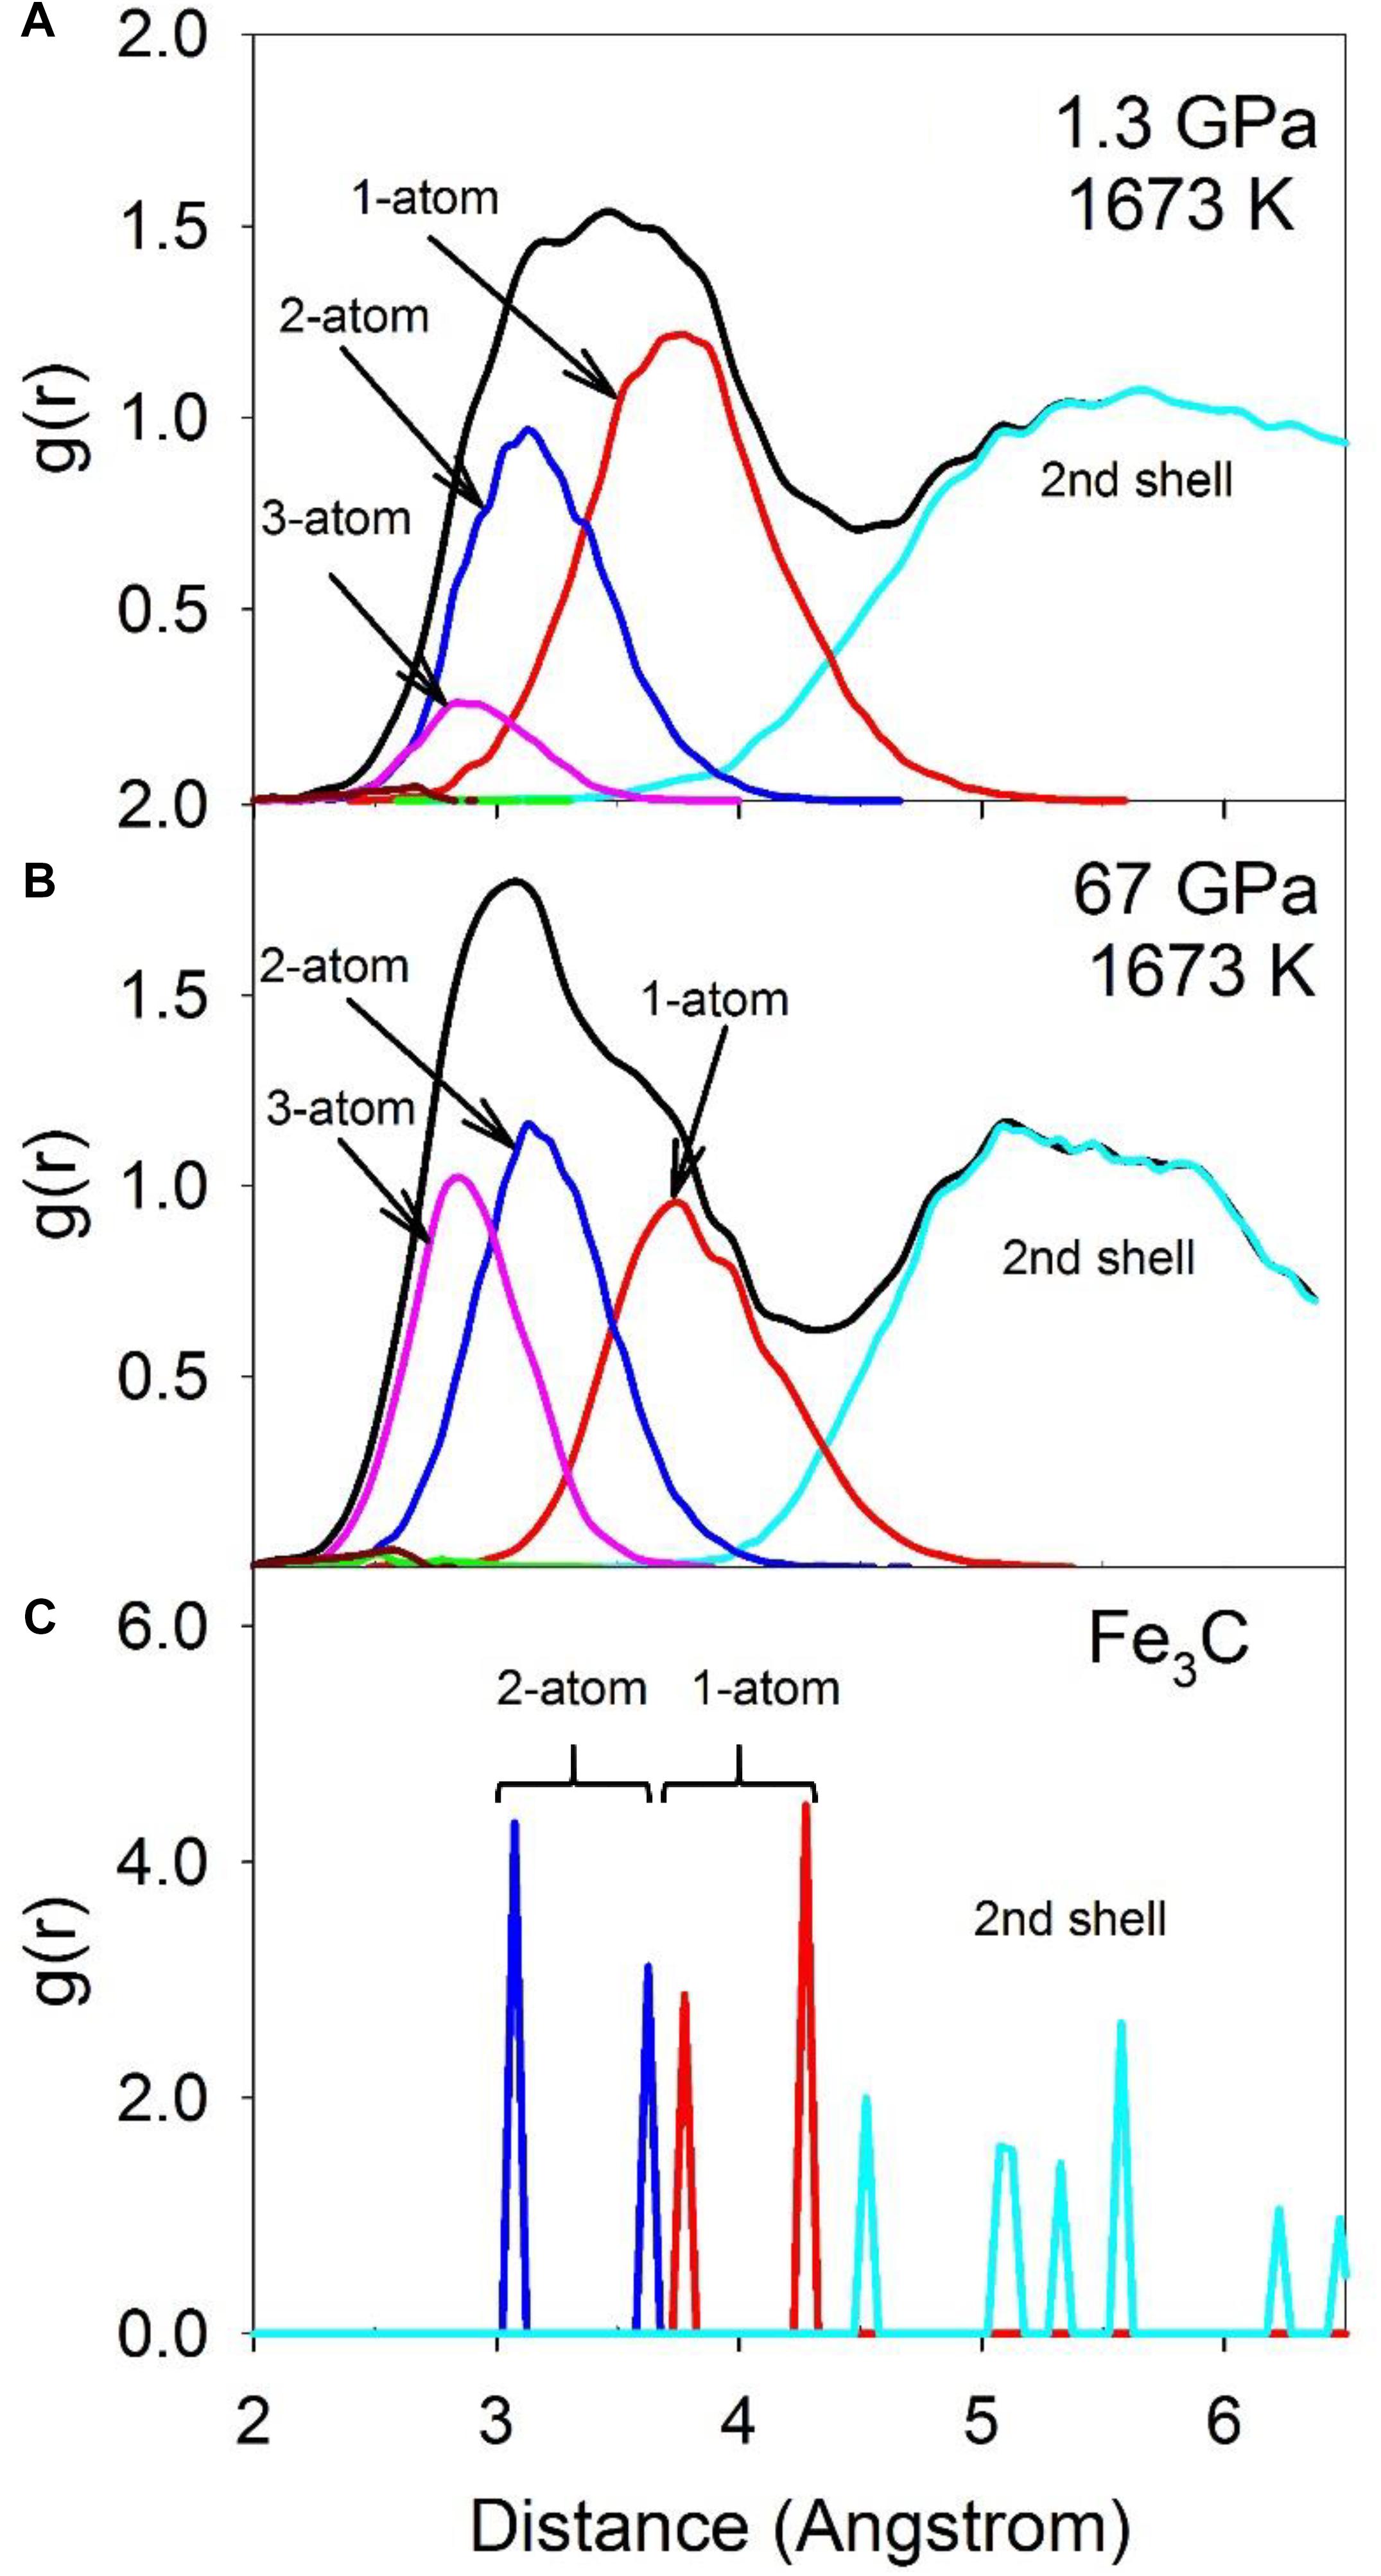
Figure 7. The total RDF (black) and partial configurationally decomposed RDFs of coordination polyhedra of C-Fe/Ni with different connection schemes: 1-atom corner-shared (red), 2-atom edge-shared (blue), 3-atom face-shared (magenta), and 4-atom distorted face-shared (green) connections. (A) Fe-Ni-C liquid at 1.3 GPa, 1673 K, (B) at 67 GPa, 1673 K, and (C) Fe3C at ambient condition.
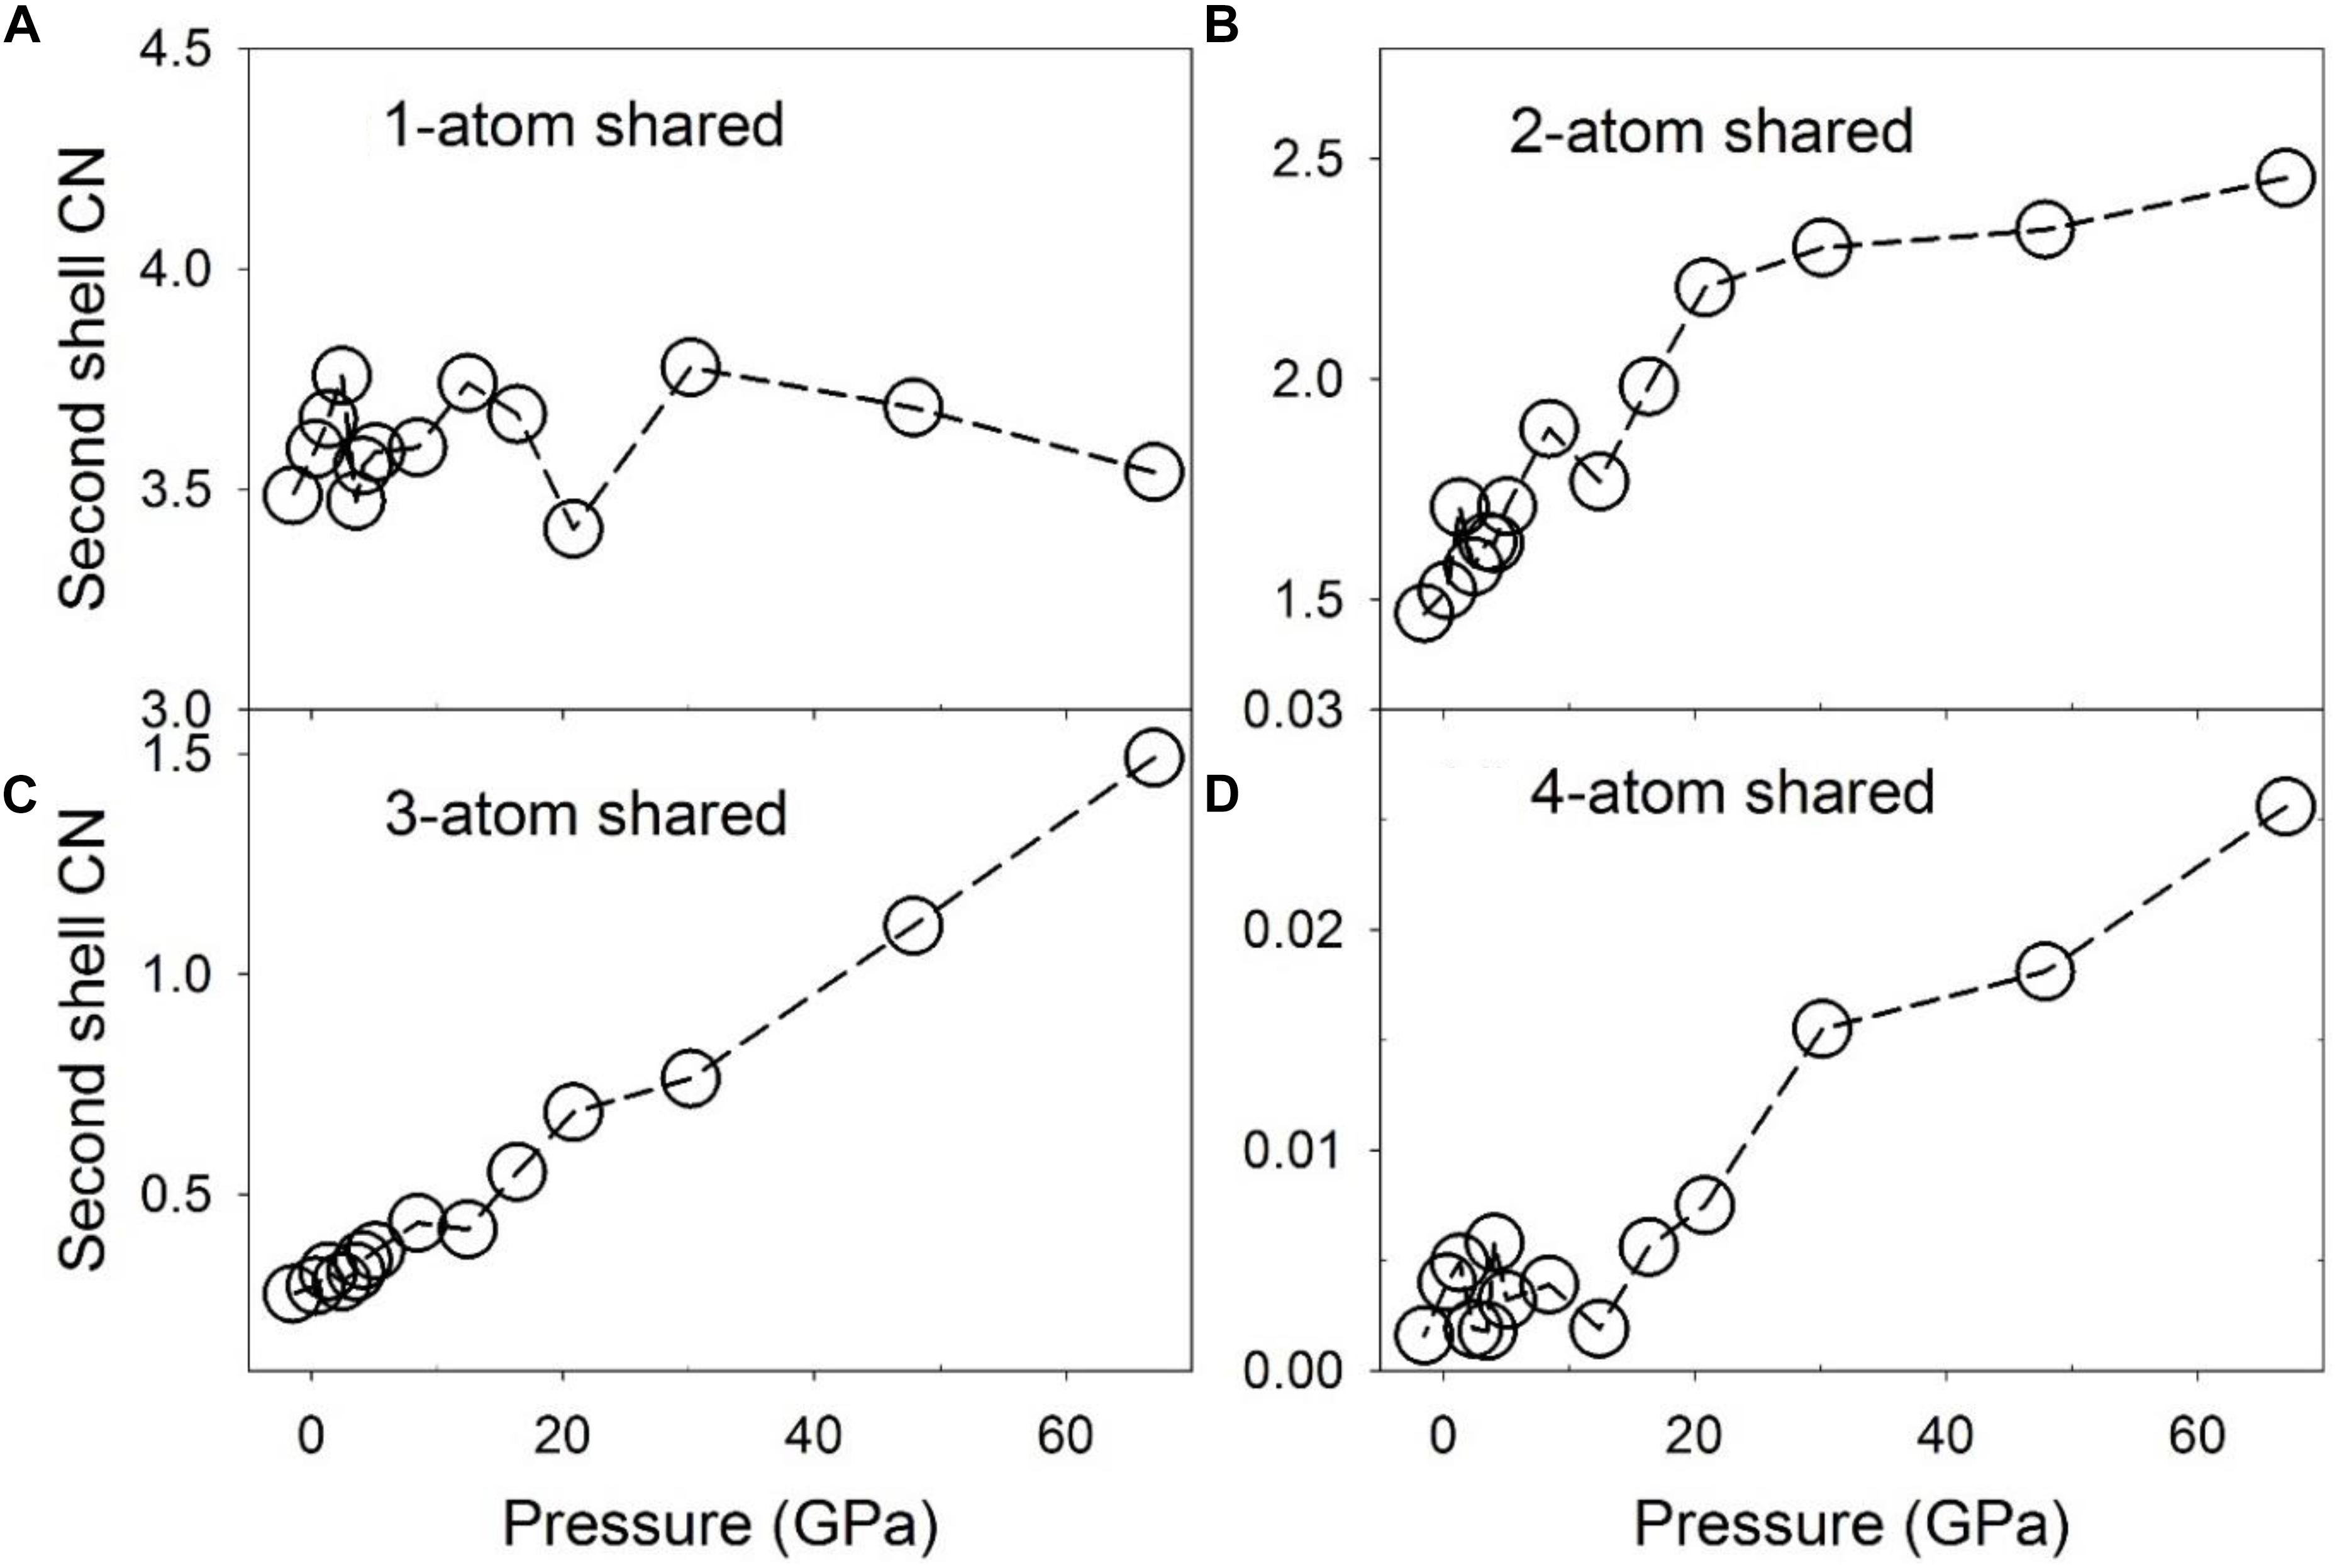
Figure 8. Coordination numbers (CNs) of C-Fe/Ni polyhedra associated with partial configurationally decomposed PDFs as a function of pressure. (A) 1-atom corner-shared, (B) 2-atom edge-shared, (C) 3-atom face-shared, and (D) 4-atom shared connections.
Diffusion Coefficient and Shear Viscosity
The dynamic properties of the Fe-Ni-C liquid are characterized by the self-diffusion coefficient and viscosity, which are plotted in Figures 9, 10, respectively. The self-diffusion coefficient can be reliably computed for data at low pressures, as the MSDs clearly extend into the linear regime (Figures 9A–C). As pressure increases, it becomes challenging to accurately obtain the diffusion coefficient because the linear regime is reached at longer times relative to at low pressures. The calculated value of the Fe/Ni diffusion coefficient with a composition of Fe72.9Ni7.3C19.8 (∼5 wt% C) is 3.15 ± 0.01 × 10⁻⁹ m2/s at 0.34 GPa and 1673 K, which is closely comparable with a recent experimental measured value of 2.43 ± 0.12 × 10⁻⁹ m2/s for Fe at ambient pressure and 1680 K within a composition of Fe83.1C16.9 (∼4.2 wt% C) (Meyer et al., 2019), and in agreement with the experimental result ∼5 × 10⁻⁹ m2/s for Fe in Fe-Si and Fe-Cr alloys at their melting temperatures (Posner et al., 2017). The diffusion coefficient of C is consistently higher than Fe/Ni, in agreement with a previous study using similar techniques (Sobolev and Mirzoev, 2013). The ratio of the diffusion coefficients, DC/DFe/Ni, is ∼1.7 at pressures less than ∼5 GPa, and ∼2.4 at pressures greater than ∼5 GPa. If the diffusion of C and Fe/Ni was only affected by their masses, the ratio would be expected to be inversely proportional to the square root of their mass ratio, i.e., (massFeNi/massC)1/2, which is about ∼2.2. This result indicates that C diffuses more slowly than expected from its mass relative to Fe/Ni at lower pressures, suggesting impeded C diffusion relative to Fe/Ni. As pressure increases, the ratio of the two diffusion rates increases, suggesting that increases in C coordination and clustering (Figures 3, 8) tend to increase C diffusion relative to Fe at high pressures. As Figure 9D shows, the diffusion coefficient decreases as pressure increases for both Fe/Ni and C (Figure 9D), which can be described with the Arrhenius equation, D(P) = D0e−PΔV/RT, where D is the diffusion coefficient, P the pressure, D0 a constant, ΔV the activation volume, R the gas constant, and T the temperature. The data in Figure 9D can be fit with this equation in two pressure ranges: less than ∼ 5 GPa and greater than ∼5 GPa. The calculated activation volumes are 1.4 ± 0.3 cm3/mol and 1.2 ± 0.3 cm3/mol for Fe/Ni and C respectively at pressure less than ∼5 GPa, and 0.77 ± 0.06 cm3/mol and 0.61 ± 0.09 cm3/mol for Fe/Ni and C respectively at pressures greater than ∼5 GPa. The latter values are in line with the experimentally determined self-diffusion activation volumes of Fe (∼1.1 cm3/mol) and C (∼1.3 cm3/mol) in Fe3C liquid at 8–15 GPa, but measured at much higher temperatures between 2228 and 2413 K (Dobson and Wiedenbeck, 2002). The activation volumes at high pressures are about half of those at low pressures (Figure 9D), suggesting that different diffusion mechanisms are controlled by differing local and intermediate structures.
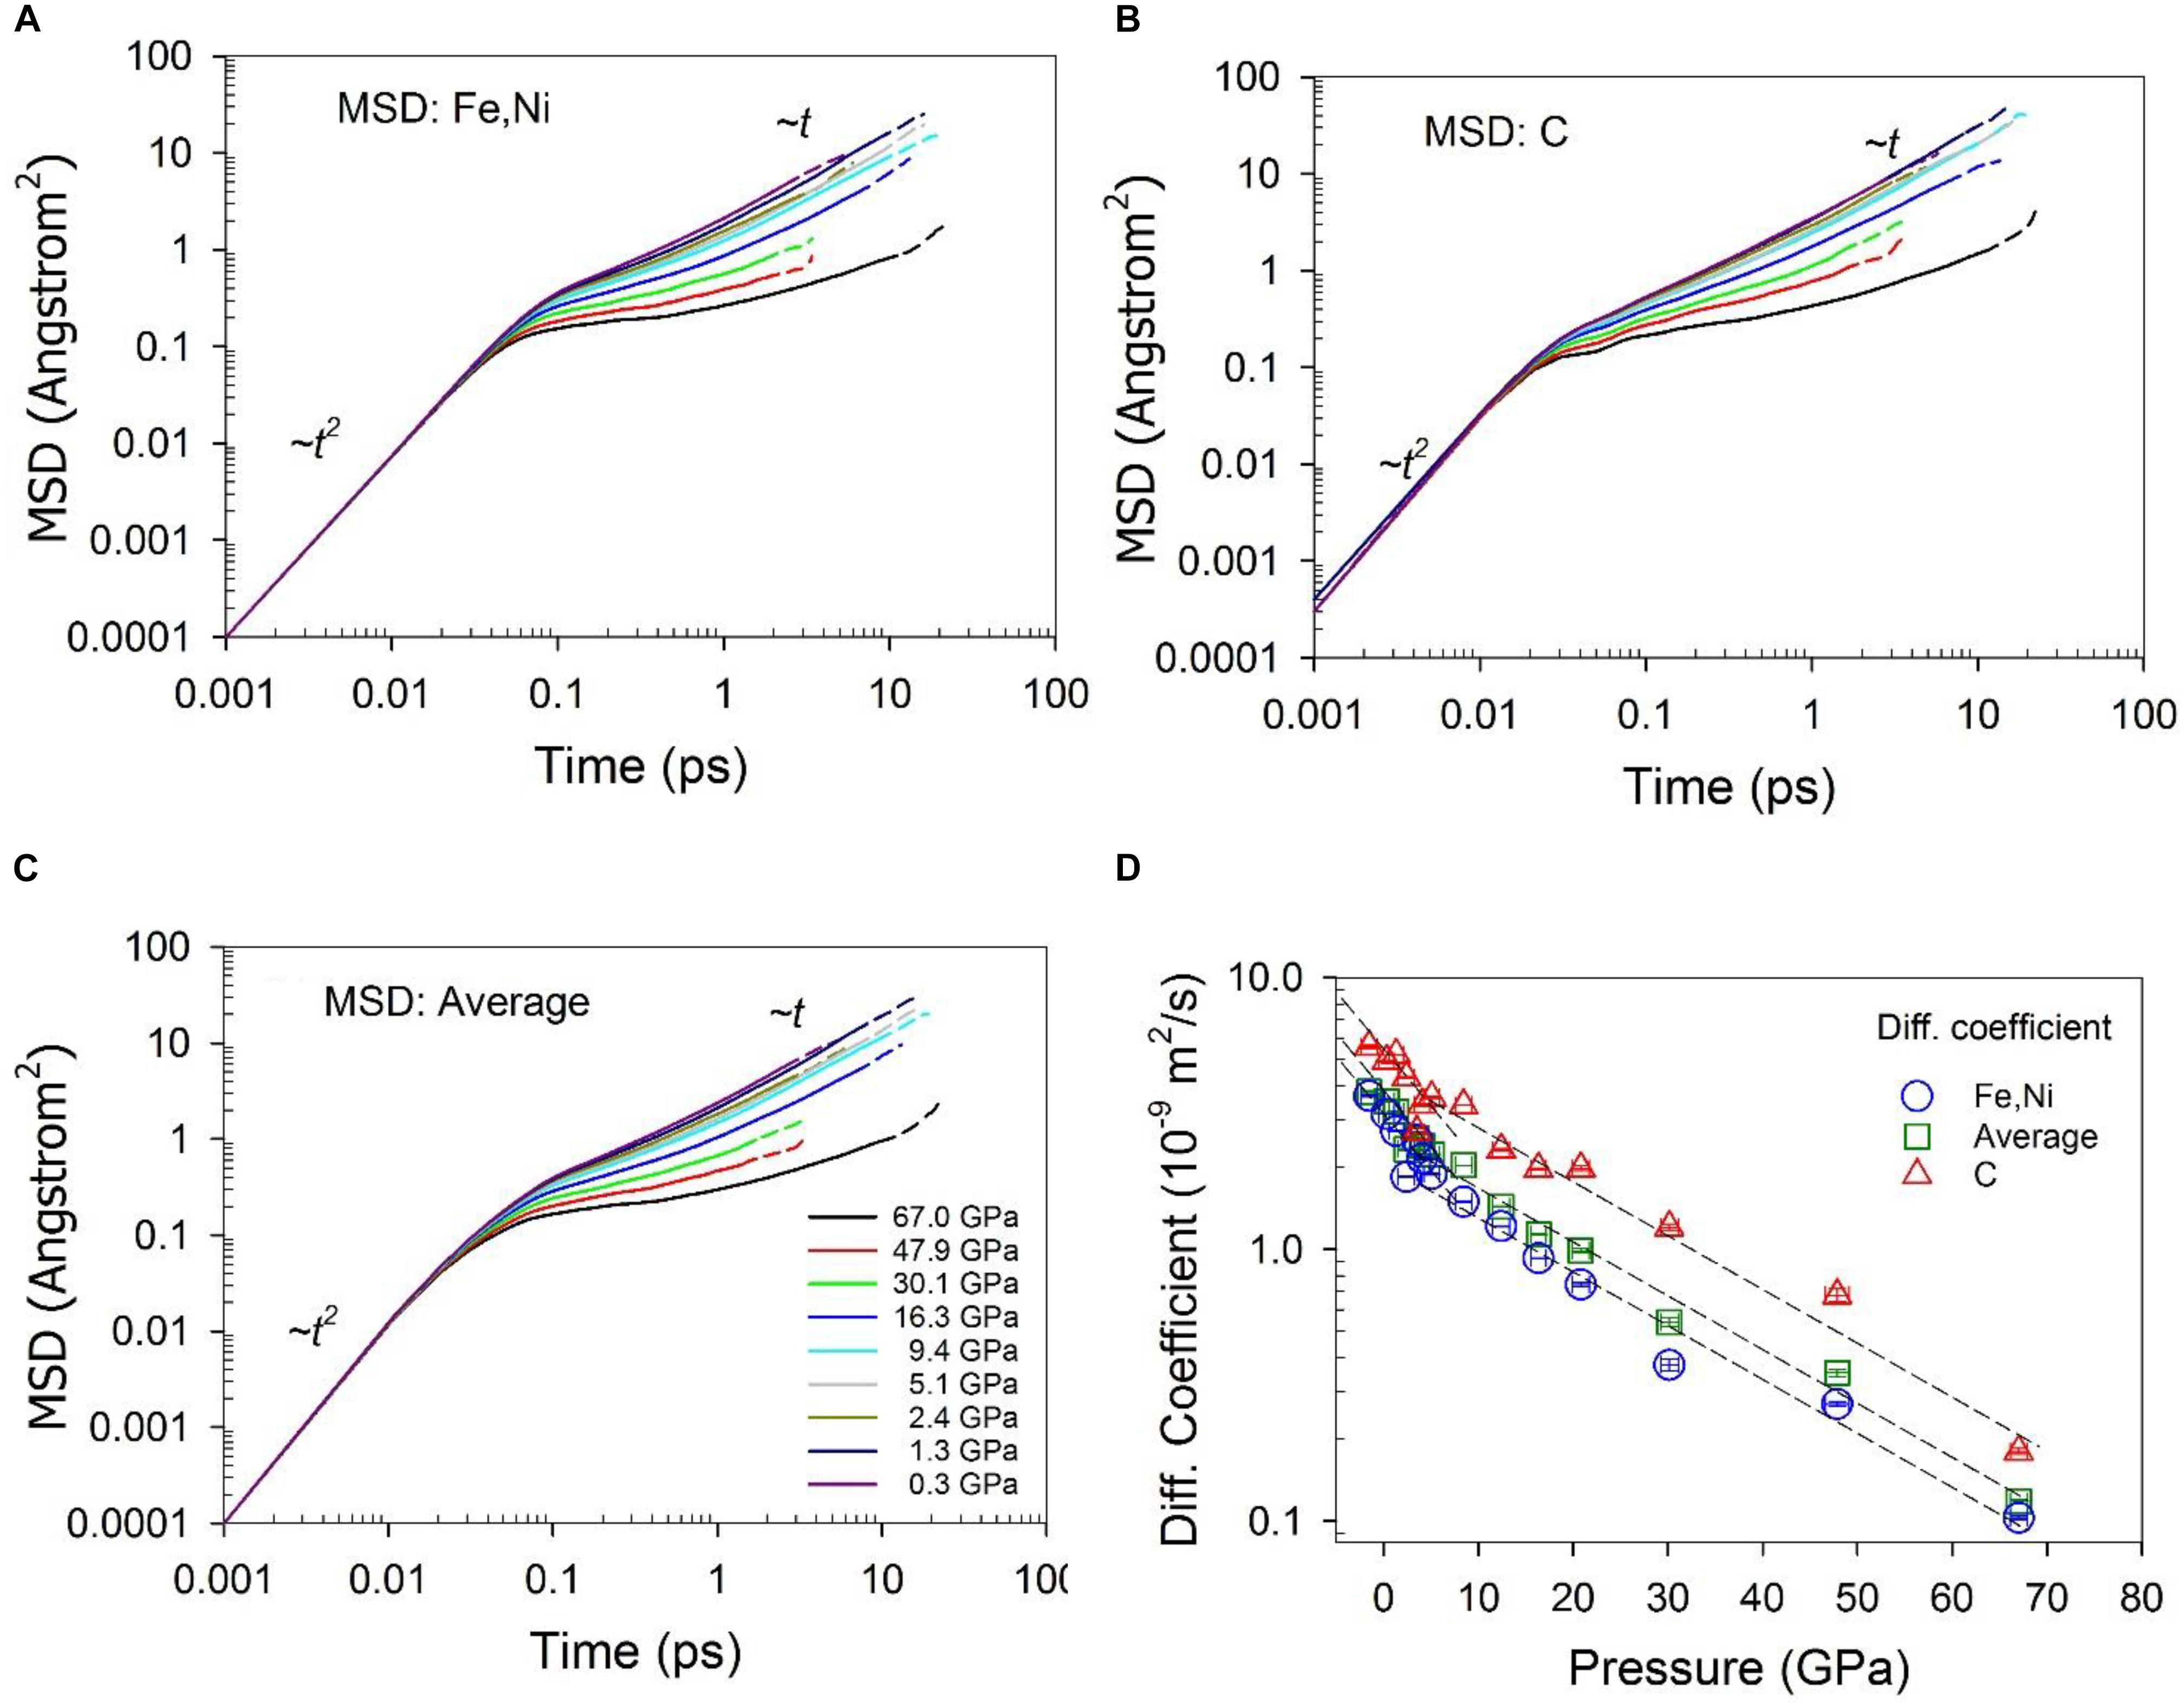
Figure 9. Mean squared displacement – (A) Fe and Ni, (B) C, and (C) average, and (D) Self diffusion coefficient of Fe-Ni-C liquid at 1673 K and different pressures. The solid portion of the lines in (A–C) are calculated with half of the simulation time, and dashed lines are with the full simulation time. The dashed lines in (D) are to guide the eye. The error bars in pressure are one standard deviation of the average. The errors for diffusion coefficients are within the size of the symbol, as estimated from the MSD fitting and consideration of correlations in MD trajectories. The actual errors might be larger as indicated by the variability of the values.
The shear viscosity as a function of pressure was calculated from the integral of the Green-Kubo relation (Figure 10; Frenkel and Smit, 2002). Due to the fluctuation of the integral values at a short timescale when the correlation function decays to zero, the viscosity was calculated as the average within a short time range, but after the integral reaches a plateau. As shown in Figure 10B, the calculated viscosity is ∼3.3 mPa⋅s at low pressures (about twice that of liquid water near 273 K) (Dehaoui et al., 2015), and increases to ∼6.0 mPa⋅s at a pressure of 8.4 GPa above the liquid-liquid polyamorphic transition, and then remains nearly constant until ∼50 GPa. As pressure increases to 67 GPa, the viscosity increases to ∼20 mPa⋅s. At low pressures, the computed viscosity values are in agreement with the experimental value of 3.8–6.3 mPa⋅s for liquid Fe86C14 at pressures up to 4.5 GPa and 1843 K (Terasaki et al., 2006), 6.1–7.4 mPa⋅s for liquid Fe measured at up to 6.4 GPa at the melting temperatures (Kono et al., 2015), and 2.36–4.80 mPa⋅s for liquid Fe measured at pressures up to 5.5 GPa and 2050 K (Rutter et al., 2002). The viscosity increase with pressure from low pressures to above ∼5 GPa is consistent with the changes of the equation of state (Figure 1C) and the structure that is characterized by an increase of the stable 3-atom shared polyhedral abundance (Figures 6C, 8C) and CNs (Figure 3) for both the Fe/Ni-Fe/Ni and C-Fe/Ni coordination environments.
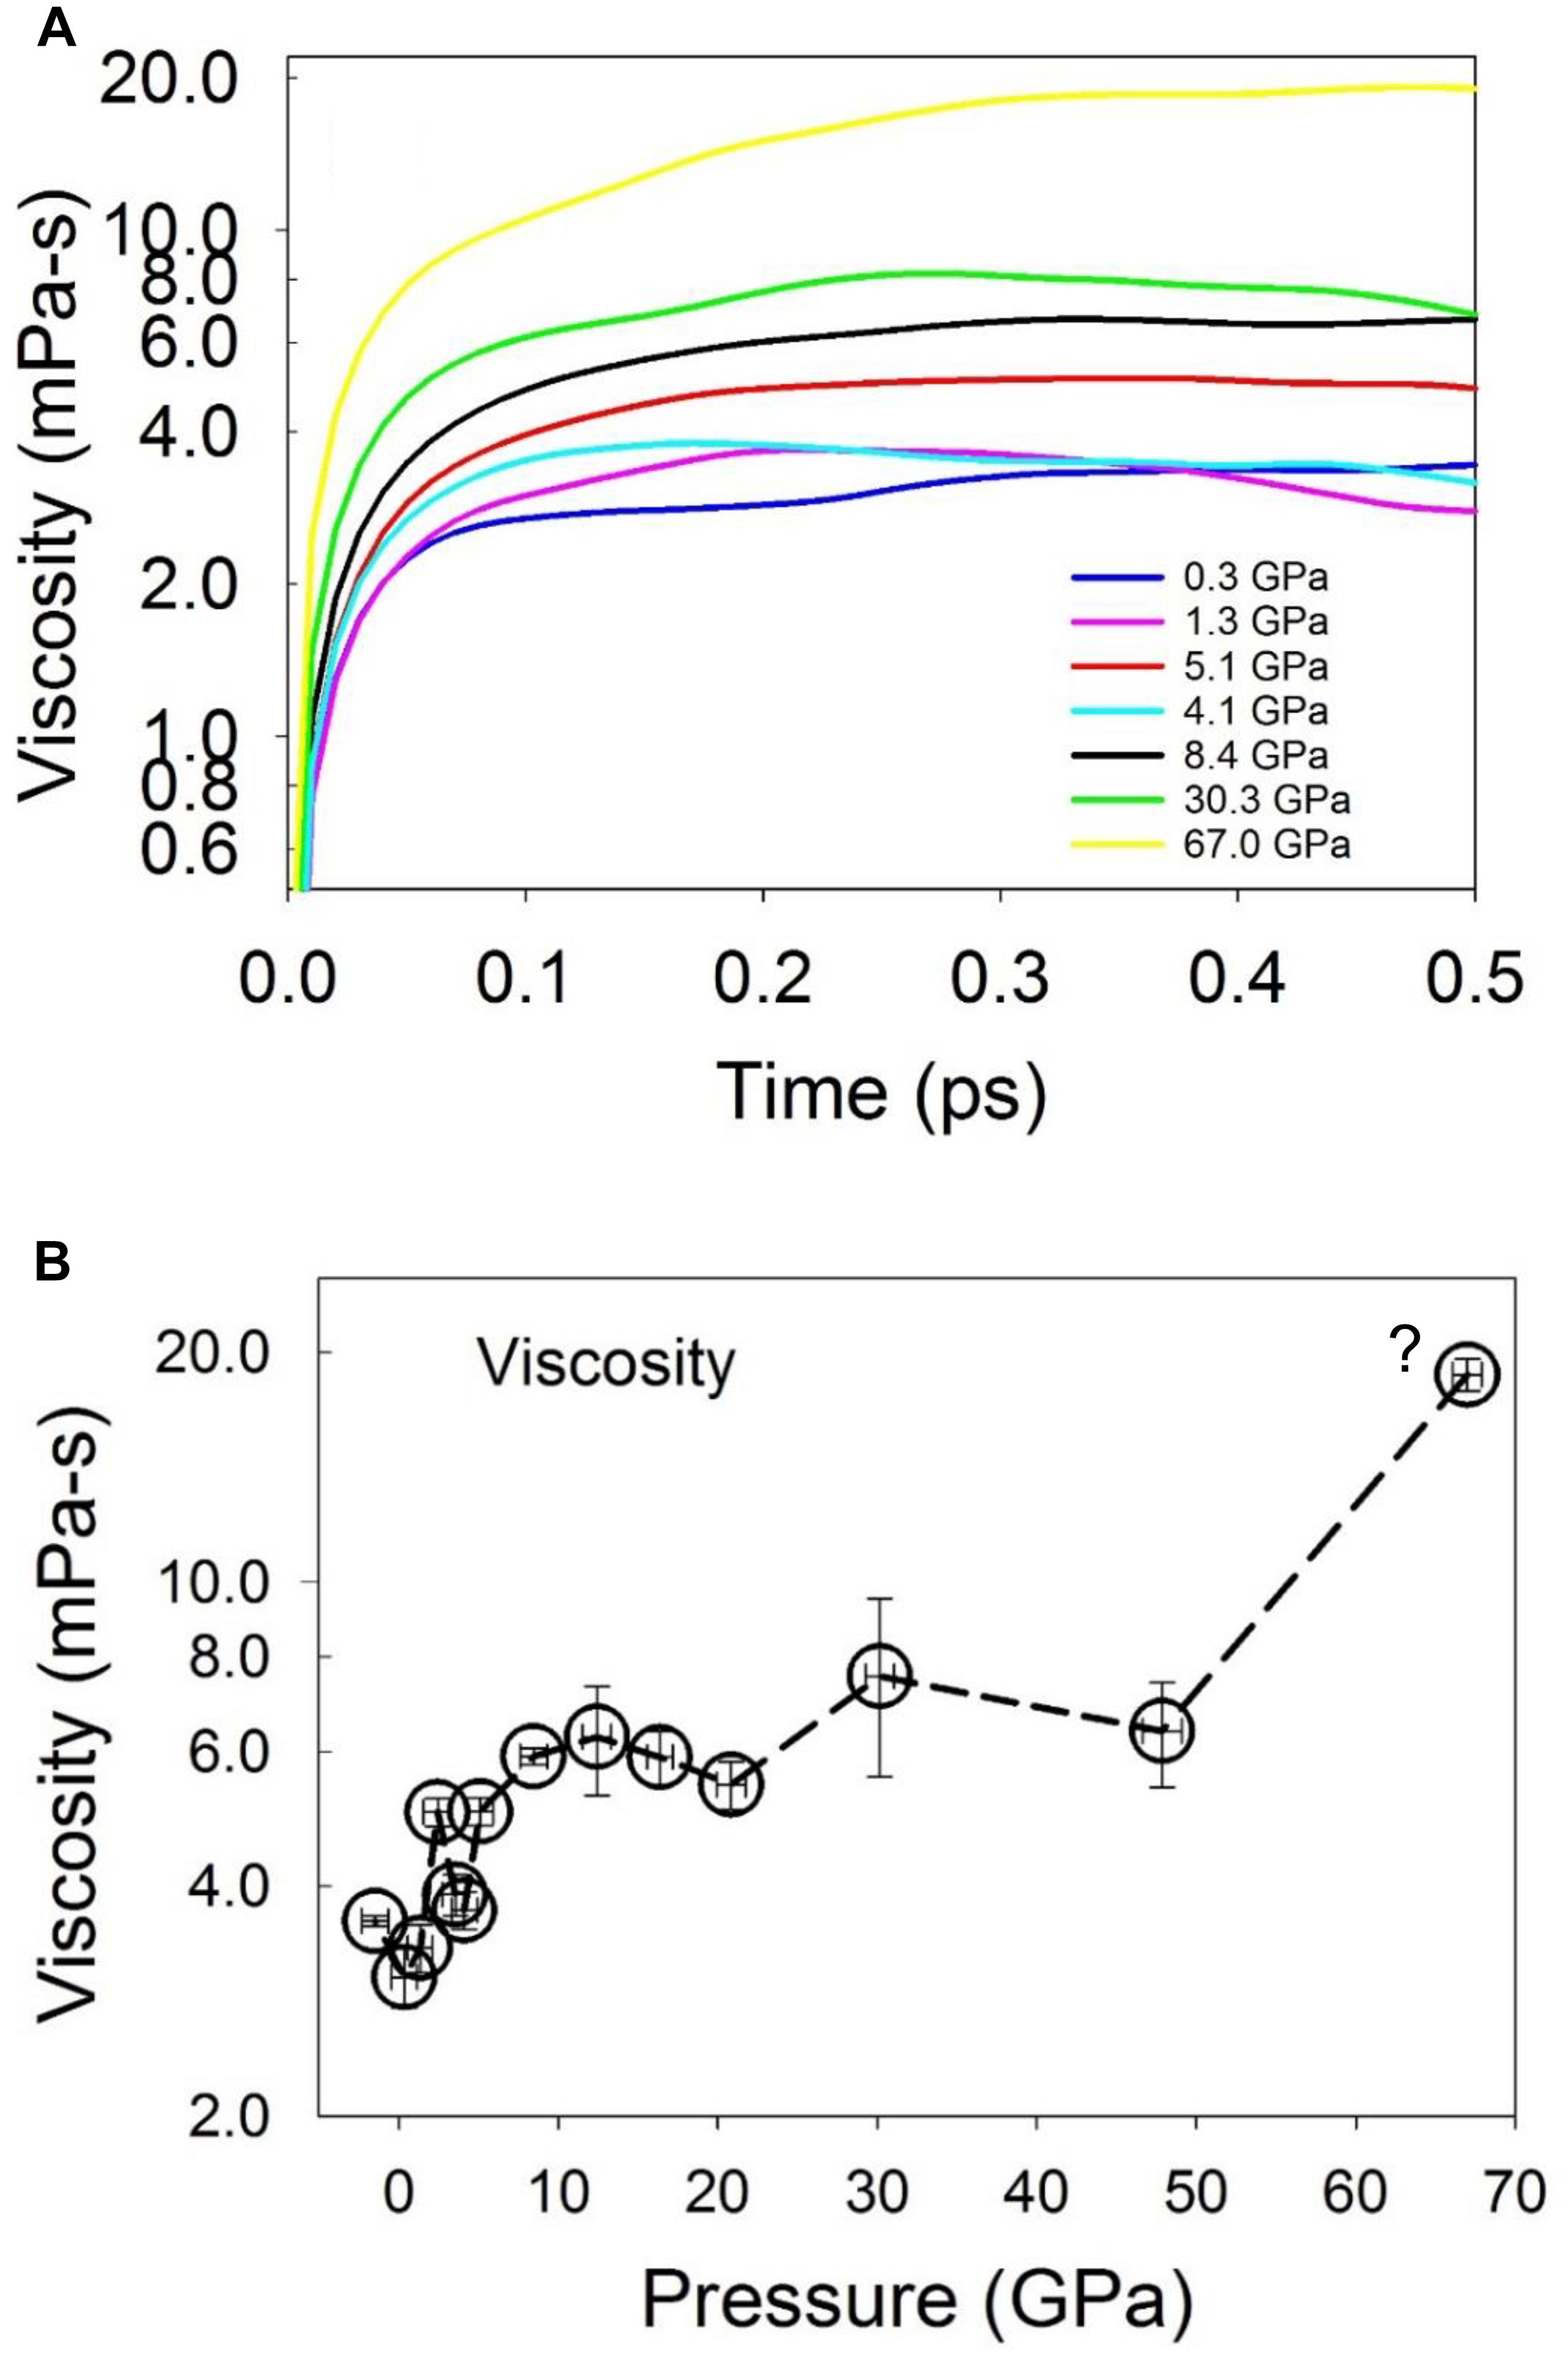
Figure 10. Viscosity of Fe-Ni-C liquid at 1673 K. (A) Convergence of viscosity of the liquid as a function of time at selected pressures. (B) Viscosity at 1673 K as a function of pressure. The question mark in (B) indicates that the liquid may be in a metastable state. The error bar was estimated as the standard deviation over a short time scale after the integral reaches the plateau.
Summary and Concluding Remarks
First-principles MD simulations were implemented to model Fe/Ni liquid with 5 wt% C at 1673 K and pressures from 0 to 67 GPa. The simulations adequately reproduced the liquid structure, and support the existence of a liquid-liquid polyamorphic transition, as characterized by recent experiments up to 7.3 GPa (Lai et al., 2017). In addition, the results suggest that the C-Fe/Ni bond is much less compressible than the Fe/Ni-Fe/Ni bond, the mixing of Fe, Ni, and C is not ideal, and their preferential clustering is pressure-dependent. Such non-ideal mixing can be caused by different bonding strength among different elements. The C atoms prefer to bond to Fe relative to Ni at all pressures studied, and the Fe and Ni atoms appear randomly mixed at low pressure, but Ni becomes more likely to bond to Fe than itself as pressure increases. Such subtle miscibility changes with pressure among the elements likely lead to changes in local chemical and structural environments, but may be particularly reflected in changes of other physical properties. As pressure increases, the intermediate-range structure of both Fe/Ni-Fe/Ni and C-Fe/Ni subsystems evolves, and clusters with 3-atom/face shared polyhedra increase significantly in concentration, which is consistent with an increase in bulk modulus, decreases in diffusivity, and increases in shear viscosity. Both miscibility and clustering of the liquid are structural characteristics that appear to have a significant impact on the physical properties of the liquid.
Reproducing the experimental observations at low pressures provides an essential benchmark for the MD simulation method. Although the alloy composition studied is not likely to be that of the Earth’s outer core, and the pressures and temperature lie below the conditions of the outer core, this study demonstrates that the methodology implemented here may be sufficient to model the structure and transport properties of Fe-rich liquid at Earth’s outer core conditions. The computational technique provides an alternative to experiments by computing the structure and properties and being able to interrogate the liquid in detail at the atomic and electronic levels. This approach can provide substantial insights into the validity (or lack thereof) of long extrapolations of structural or dynamic properties of liquids to outer core conditions based on data measured at low pressures, and particularly can be of value in determining if there are unanticipated changes, like the polyamorphic transition around ∼5 GPa, or changes of intermediate structure and clustering involving light elements such as C.
Data Availability Statement
The datasets generated for this study are available on request to the corresponding author.
Author Contributions
JW and BC designed the research. JW conducted the computations and analyzed the data. JW, BC, and QW wrote the manuscript. JW, BC, QW, and MM reviewed the manuscript.
Funding
This material is based upon work supported by the National Science Foundation under EAR-1565678 to JW, EAR-1565708 and EAR-1555388 to BC, and EAR-1620423 to QW. This research used resources of the National Energy Research Scientific Computing Center, a DOE Office of Science User Facility supported by the Office of Science of the United States Department of Energy under Contract No. DE-AC02-05CH11231.
Conflict of Interest
The authors declare that the research was conducted in the absence of any commercial or financial relationships that could be construed as a potential conflict of interest.
Acknowledgments
We thank the two reviewers for helpful comments. Portions of this research were conducted with high performance computing resources provided by Louisiana State University (http://www.hpc.lsu.edu).
References
Alfe, D. (2010). Iron at Earth’s core conditions from first principles calculations. Rev. Mineral. Geochem. 71, 337–354. doi: 10.2138/rmg.2010.71.16
Anisimov, M. A., Duška, M., Caupin, F., Amrhein, L. E., Rosenbaum, A., and Sadus, R. J. (2018). Thermodynamics of fluid polyamorphism. Phys. Rev. X 8:011004. doi: 10.1103/PhysRevX.8.011004
Badro, J., Brodholt, J. P., Piet, H., Siebert, J., and Ryerson, F. J. (2015). Core formation and core composition from coupled geochemical and geophysical constraints. Proc. Natl. Acad. Sci. U.S.A. 112, 12310–12314. doi: 10.1073/pnas.1505672112
Badro, J., Côté, A. S., and Brodholt, J. P. (2014). A seismologically consistent compositional model of Earth’s core. Proc. Natl. Acad. Sci. U.S.A. 111, 7542–7545. doi: 10.1073/pnas.1316708111
Birch, F. (1947). Finite elastic strain of cubic crystals. Phys. Rev. 71, 809–824. doi: 10.1103/PhysRev.71.809
Birch, F. (1952). Elasticity and constitution of the earth interior. J. Geophys. Res. 57, 227–286. doi: 10.1029/JZ057i002p00227
Birch, F. (1964). Density and composition of mantle and core. J. Geophys. Res. 69, 4377–4388. doi: 10.1029/jz069i020p04377
Blöchl, P. E. (1994). Projector augmented-wave method. Phys. Rev. B 50, 17953–17979. doi: 10.1103/physrevb.50.17953
Chen, B., Gao, L., Lavina, B., Dera, P., Alp, E. E., Zhao, J., et al. (2012). Magneto-elastic coupling in compressed Fe7C3 supports carbon in Earth’s inner core. Geophys. Res. Lett. 39:L18301. doi: 10.1029/2012gl052875
Chen, B., Lai, X., Li, J., Liu, J., Zhao, J., Bi, W., et al. (2018). Experimental constraints on the sound velocities of cementite Fe3C to core pressures. Earth Planet. Sci. Lett. 494, 164–171. doi: 10.1016/j.epsl.2018.05.002
Chen, B., and Li, J. (2016). Carbon in the Core, Deep Earth: Physics and Chemistry of the Lower Mantle and Core. Hoboken, NJ: John Wiley & Sons, Inc.
Chen, B., Li, Z., Zhang, D., Liu, J., Hu, M. Y., Zhao, J., et al. (2014). Hidden carbon in Earth’s inner core revealed by shear softening in dense Fe7C3. Proc. Natl. Acad. Sci. U.S.A. 111, 17755–17758. doi: 10.1073/pnas.1411154111
Chipman, J. (1972). Thermodynamics and phase diagram of the Fe-C system. Metall. Mater. Trans. B 3, 55–64. doi: 10.1007/bf02680585
Dehaoui, A., Issenmann, B., and Caupin, F. (2015). Viscosity of deeply supercooled water and its coupling to molecular diffusion. Proc. Natl. Acad. Sci. U.S.A. 112, 12020–12025. doi: 10.1073/pnas.1508996112
Ding, J., Ma, E., Asta, M., and Ritchie, R. O. (2015). Second-nearest-neighbor correlations from connection of atomic packing motifs in metallic glasses and liquids. Sci. Rep. 5:17429. doi: 10.1038/srep17429
Dobson, D. P., and Wiedenbeck, M. (2002). Fe- and C-self-diffusion in liquid Fe3C to 15 GPa. Geophys. Res. Lett. 29:015536. doi: 10.1029/2002gl015536
Fiquet, G., Badro, J., Gregoryanz, E., Fei, Y., and Occelli, F. (2009). Sound velocity in iron carbide (Fe3C) at high pressure: implications for the carbon content of the Earth’s inner core. Phys. Earth Planet. Inter. 172, 125–129. doi: 10.1016/j.pepi.2008.05.016
Francis, G., and Payne, M. (1990). Finite basis set corrections to total energy pseudopotential calculations. J. Phys. 2, 4395–4404. doi: 10.1063/1.4723805
Frenkel, D., and Smit, B. (2002). Understanding Molecular Simulation From Algorithms to Applications. Cambridge, MA: Academic Press.
Gao, L., Chen, B., Lerche, M., Alp, E. E., Sturhahn, W., Zhao, J., et al. (2009). Sound velocities of compressed Fe3C from simultaneous synchrotron X-ray diffraction and nuclear resonant scattering measurements. J. Synchrotron Radiat. 16, 714–722. doi: 10.1107/S0909049509033731
Gao, L., Chen, B., Wang, J., Alp, E. E., Zhao, J., Lerche, M., et al. (2008). Pressure-induced magnetic transition and sound velocities of Fe3C: implications for carbon in the Earth’s inner core. Geophys. Res. Lett. 35:L17306.
Ghosh, D. B., and Karki, B. B. (2011). Diffusion and viscosity of Mg2SiO4 liquid at high pressure from first-principles simulations. Geochim. Cosmochim. Acta 75, 4591–4600. doi: 10.1016/j.gca.2011.05.030
Hart, S. R., and Zindler, A. (1986). In search of a bulk-Earth composition. Chem. Geol. 57, 247–267. doi: 10.1016/0009-2541(86)90053-7
Hume-Rothery, W., Haworth, C. W., and Smallman, R. E. (1969). The Structure of Metals and Alloys. London: Institute of Metals and the Institution of Metallurgists.
Jiang, C., Srinivasan, S. G., Caro, A., and Maloy, S. A. (2008). Structural, elastic, and electronic properties of Fe3C from first principles. J. Appl. Phys. 103:043502. doi: 10.1063/1.2884529
Jimbo, I., and Cramb, A. (1993). The density of liquid iron-carbon alloys. Metall. Trans. B 24, 5–10. doi: 10.1007/bf02657866
Kleine, T., Münker, C., Mezger, K., and Palme, H. (2002). Rapid accretion and early core formation on asteroids and the terrestrial planets from Hf–W chronometry. Nature 418, 952–955. doi: 10.1038/nature00982
Kono, Y., Kenney-Benson, C., Shibazaki, Y., Park, C., Shen, G., and Wang, Y. (2015). High-pressure viscosity of liquid Fe and FeS revisited by falling sphere viscometry using ultrafast X-ray imaging. Phys. Earth Planet. Inter. 241, 57–64. doi: 10.1016/j.pepi.2015.02.006
Kresse, G., and Furthmüller, J. (1996). Efficiency of ab-initio total energy calculations for metals and semiconductors using a plane-wave basis set. Comput. Mater. Sci. 6, 15–50. doi: 10.1016/0927-0256(96)00008-0
Lai, X., Chen, B., Wang, J., Kono, Y., and Zhu, F. (2017). Polyamorphic transformations in Fe-Ni-C liquids: implications for chemical evolution of terrestrial planets. J. Geophys. Res. Solid Earth 122, 9745–9754. doi: 10.1002/2017JB014835
Lai, X., Zhu, F., Liu, J., Zhang, D., Hu, Y., Finkelstein, G. J., et al. (2018). The high-pressure anisotropic thermoelastic properties of a potential inner core carbon-bearing phase, Fe7C3, by single-crystal X-ray diffraction. Am. Mineral. 103, 1568–1574. doi: 10.2138/am-2018-6527
LeBlanc, G., and Secco, R. (1996). Viscosity of an Fe-S liquid up to 1300°C and 5 GPa. Geophys. Res. Lett. 23, 213–216. doi: 10.1029/96gl00216
Li, J., and Fei, Y. (2007). “Experimental constraints on core composition,” in Treatise on Geochemistry, eds H. D. Holland, and K. K. Turekian, (Oxford: Pergamon), 1–31. doi: 10.1016/b0-08-043751-6/02014-4
Lin, J.-F., Struzhkin, V. V., Mao, H.-K., Hemley, R. J., Chow, P., Hu, M. Y., et al. (2004). Magnetic transition in compressed Fe3C from x-ray emission spectroscopy. Phys. Rev. B 70:212405. doi: 10.1103/PhysRevB.70.212405
Lord, O., Walter, M., Dasgupta, R., Walker, D., and Clark, S. (2009). Melting in the Fe-C system to 70 GPa. Earth Planet. Sci. Lett. 284, 157–167. doi: 10.1016/j.epsl.2009.04.017
Mavračić, J., Mocanu, F. C., Deringer, V. L., Csányi, G., and Elliott, S. R. (2018). Similarity between amorphous and crystalline phases: the case of TiO2. J. Phys. Chem. Lett. 9, 2985–2990. doi: 10.1021/acs.jpclett.8b01067
McDonough, W. (2003). Compositional model for the Earth’s core. Treatise Geochem. 2, 547–568. doi: 10.1016/b0-08-043751-6/02015-6
Meyer, A., Hennig, L., Kargl, F., and Unruh, T. (2019). Iron self diffusion in liquid pure iron and iron-carbon alloys. J. Phys. Condens. Matt. 31:395401. doi: 10.1088/1361-648x/ab2855
Mookherjee, M., Nakajima, Y., Steinle-Neumann, G., Glazyrin, K., Wu, X. A., Dubrovinsky, L., et al. (2011). High-pressure behavior of iron carbide (Fe7C3) at inner core conditions. J. Geophys. Res. Solid Earth 116:B04201. doi: 10.1029/2010jb007819
Nikolussi, M., Shang, S., Gressmann, T., Leineweber, A., Mittemeijer, E., Wang, Y., et al. (2008). Extreme elastic anisotropy of cementite, Fe3C: first-principles calculations and experimental evidence. Scr. Mater. 59, 814–817. doi: 10.1016/j.scriptamat.2008.06.015
Ono, S., and Mibe, K. (2010). Magnetic transition of iron carbide at high pressures. Phys. Earth Planet. Inter. 180, 1–6. doi: 10.1016/j.pepi.2010.03.008
Perdew, J. P., Chevary, J. A., Vosko, S. H., Jackson, K. A., Pederson, M. R., Singh, D. J., et al. (1992). Atoms, molecules, solids, and surfaces: applications of the generalized gradient approximation for exchange and correlation. Phys. Rev. B 46, 6671–6687. doi: 10.1103/physrevb.46.6671
Perdew, J. P., Ruzsinszky, A., Csonka, G. I., Vydrov, O. A., Scuseria, G. E., Constantin, L. A., et al. (2008). Restoring the density-gradient expansion for exchange in solids and surfaces. Phys. Rev. Lett. 100:136406.
Poirier, J.-P. (1994). Light elements in the Earth’s outer core: a critical review. Phys. Earth Planet. Inter. 85, 319–337. doi: 10.1016/0031-9201(94)90120-1
Poole, P. H., Grande, T., Angell, C. A., and McMillan, P. F. (1997). Polymorphic phase transitions in liquids and glasses. Science 275, 322–323. doi: 10.1126/science.275.5298.322
Posner, E. S., Rubie, D. C., Frost, D. J., Vlček, V., and Steinle-Neumann, G. (2017). High P–T experiments and first principles calculations of the diffusion of Si and Cr in liquid iron. Geochim. Cosmochim. Acta 203, 323–342. doi: 10.1016/j.gca.2017.01.024
Prescher, C., Dubrovinsky, L., Bykova, E., Kupenko, I., Glazyrin, K., Kantor, A., et al. (2015). High Poisson’s ratio of Earth’s inner core explained by carbon alloying. Nat. Geosci. 8, 220–223. doi: 10.1038/ngeo2370
Prescher, C., Dubrovinsky, L., McCammon, C., Glazyrin, K., Nakajima, Y., Kantor, A., et al. (2012). Structurally hidden magnetic transitions in Fe3C at high pressures. Phys. Rev. B 85:140402.
Rubie, D. C., Jacobson, S. A., Morbidelli, A., O’Brien, D. P., Young, E. D., de Vries, J., et al. (2015). Accretion and differentiation of the terrestrial planets with implications for the compositions of early-formed Solar System bodies and accretion of water. Icarus 248, 89–108. doi: 10.1016/j.icarus.2014.10.015
Rutter, M. D., Secco, R. A., Liu, H., Uchida, T., Rivers, M. L., Sutton, S. R., et al. (2002). Viscosity of liquid Fe at high pressure. Phys. Rev. B 66:060102.
Sanloup, C., Guyot, F., Gillet, P., Fiquet, G., Hemley, R., Mezouar, M., et al. (2000). Structural changes in liquid Fe at high pressures and high temperatures from synchrotron X-ray diffraction. Europhys. Lett. 52:151. doi: 10.1209/epl/i2000-00417-3
Sanloup, C., Van Westrenen, W., Dasgupta, R., Maynard-Casely, H., and Perrillat, J.-P. (2011). Compressibility change in iron-rich melt and implications for core formation models. Earth Planet. Sci. Lett. 306, 118–122. doi: 10.1016/j.epsl.2011.03.039
Shen, G., Prakapenka, V. B., Rivers, M. L., and Sutton, S. R. (2004). Structure of liquid iron at pressures up to 58 GPa. Phys. Rev. Lett. 92:185701.
Sherman, D. M. (1991). Chemical bonding in the outer core: high-pressure electronic structures of oxygen and sulfur in metallic iron. J. Geophys. Res. Solid Earth 96, 18029–18036.
Shibazaki, Y., Kono, Y., and Fei, Y. (2015). Microscopic structural change in a liquid Fe-C alloy of ~5 GPa. Geophys. Res. Lett. 42, 5236–5242. doi: 10.1002/2015gl064271
Shimoyama, Y., Terasaki, H., Ohtani, E., Urakawa, S., Takubo, Y., Nishida, K., et al. (2013). Density of Fe-3.5wt% C liquid at high pressure and temperature and the effect of carbon on the density of the molten iron. Phys. Earth Planet. Inter. 224, 77–82. doi: 10.1016/j.pepi.2013.08.003
Shimoyama, Y., Terasaki, H., Urakawa, S., Takubo, Y., Kuwabara, S., Kishimoto, S., et al. (2016). Thermoelastic properties of liquid Fe-C revealed by sound velocity and density measurements at high pressure. J. Geophys. Res. Solid Earth 121, 7984–7995. doi: 10.1002/2016jb012968
Sobolev, A., and Mirzoev, A. (2013). Ab initio studies of the short-range atomic structure of liquid iron–carbon alloys. J. Mol. Liq. 179, 12–17. doi: 10.1016/j.molliq.2012.11.019
Suzuki, Y. (2017). Effect of solute nature on the polyamorphic transition in glassy polyol aqueous solutions. J. Chem. Phys. 147:064511. doi: 10.1063/1.4998201
Terasaki, H., Suzuki, A., Ohtani, E., Nishida, K., Sakamaki, T., and Funakoshi, K. (2006). Effect of pressure on the viscosity of Fe-S and Fe-C liquids up to 16 GPa. Geophys. Res. Lett. 33:L33207.
Vočadlo, L., Brodholt, J., Dobson, D. P., Knight, K. S., Marshall, W. G., Price, G. D., et al. (2002). The effect of ferromagnetism on the equation of state of Fe3C studied by first-principles calculations. Earth Planet. Sci. Lett. 203, 567–575. doi: 10.1016/S0012-821X(02)00839-7
Wagner, C. N. J., and Halder, N. C. (1967). Atomic distribution and electronic transport properties in liquid alloys studied by X-ray diffraction. Adv. Phys. 16, 241–261. doi: 10.1080/00018736700101355
Wood, B. J. (1993). Carbon in the core. Earth Planet. Sci. Lett. 117, 593–607. doi: 10.1016/0012-821X(93)90105-I
Keywords: iron, carbon, liquid, short-range structure, intermediate-range structure, diffusion, viscosity, high temperature – high pressure
Citation: Wang J, Chen B, Williams Q and Manghnani MH (2019) Short- and Intermediate-Range Structure and Dynamics of Fe-Ni-C Liquid Under Compression. Front. Earth Sci. 7:258. doi: 10.3389/feart.2019.00258
Received: 09 July 2019; Accepted: 19 September 2019;
Published: 10 October 2019.
Edited by:
Zhicheng Jing, Southern University of Sciences and Technology, ChinaReviewed by:
Nikolai Bagdassarov, Goethe University Frankfurt, GermanyMartin Charles Wilding, Sheffield Hallam University, United Kingdom
Copyright © 2019 Wang, Chen, Williams and Manghnani. This is an open-access article distributed under the terms of the Creative Commons Attribution License (CC BY). The use, distribution or reproduction in other forums is permitted, provided the original author(s) and the copyright owner(s) are credited and that the original publication in this journal is cited, in accordance with accepted academic practice. No use, distribution or reproduction is permitted which does not comply with these terms.
*Correspondence: Jianwei Wang, jianwei@lsu.edu