Fault Pattern and Seismotectonic Style of the Campania – Lucania 1980 Earthquake (Mw 6.9, Southern Italy): New Multidisciplinary Constraints
 S. Bello1,2*
  R. de Nardis1,2*
  R. Scarpa2,3
  F. Brozzetti1,2
  D. Cirillo1,2
  F. Ferrarini1,2
  B. di Lieto4
  R. J. Arrowsmith5
  G. Lavecchia1,2
- 1DiSPUTer, University “G. d’ Annunzio” Chieti-Pescara, Chieti, Italy
- 2Centro InteRUniversitario per l’analisi Sismotettonica Tridimensionale (CRUST), Chieti, Italy
- 3Dipartimento di Fisica Università “E.R. Caianiello”, Salerno, Italy
- 4Osservatorio Vesuviano, INGV, Napoli, Italy
- 5School of Earth and Space Exploration, Arizona State University, Tempe, AZ, United States
New fault trace mapping and structural survey of the active faults outcropping within the epicentral area of the Campania-Lucania 1980 normal fault earthquake (Mw 6.9) are integrated with a revision of pre-existing earthquake data and with an updated interpretation of the CROP-04 near-vertical seismic profile to reconstruct the surface and depth geometry, the kinematics and stress tensor of the seismogenic fault pattern. Three main fault alignments, organized in high-angle en-echelon segments of several kilometers in length, are identified and characterized. The inner and intermediate ones, i.e. Inner Irpinia (InIF) and Irpinia Faults (IF), dip eastward; the outer Antithetic Fault (AFA) dips westward. Both the InIF and the IF strike NW-SE along the northern and central segments and rotate to W-E along the southern segments for at least 16 km. We provide evidence of surface coseismic faulting (up to 1 m) not recognized before along the E-W segments and document coseismic ruptures with maximum vertical displacement up to ∼1 m where already surveyed from other investigators 40 years ago. Fault/slip data from surface data and a new compilation of focal mechanisms (1980 – 2018) were used for strain and stress analyses to show a coherent NNE-directed least principal stress over time and at different crustal depths, with a crustal-scale deviation from the classic SW-NE tensional direction across the Apennines of Italy. The continuation at depth of the outcropping faults is analyzed along the trace of the CROP-04 profile and with available hypocentral distributions. Integrating all information, a 3D seismotectonic model, extrapolated to the base of the seismogenic layer, is built. It outlines a graben-like structure with a southern E-W bend developed at depth shallower than 10–12 km, at the hanging wall of an extensional NE- to E-dipping extensional basal detachment. In our interpretation, such a configuration implies a control in the stress transfer during the 1980 earthquake ruptures and provides a new interpretation of the second sub-event, occurred at 20 s. Our reconstruction suggests that the latter ruptured a hanging wall NNE-dipping splay of the E-W striking main fault segment and possibly also an antithetic SSW-dipping splay, in two in-sequence episodes.
Introduction
Moderate-to-large intra-continental extensional seismic sequences (Mw 6.5–7) occurring in regions with well-exposed Quaternary faults are unusual. They are precious for two scientific reasons: to understand the faulting processes controlling the earthquake rupture and propagation from depth to surface and to reconstruct and model fault pattern for hazard purposes.
In the Mediterranean area, large extensional instrumental earthquakes (M ≥ 6.5) are mainly concentrated along the Apennines of Italy and in the Hellenides of Greece (Figure 1A). Since 1980, destructive events were those of Campania-Lucania 1980 (Mw 6.9, Bernard and Zollo, 1989), Corinth 1981 (Ms 6.7, Jackson et al., 1982; Kim et al., 1984), and Central Italy 2016 (Mw 6.5, Lavecchia et al., 2016; Civico et al., 2018; Villani et al., 2018; Brozzetti et al., 2019).
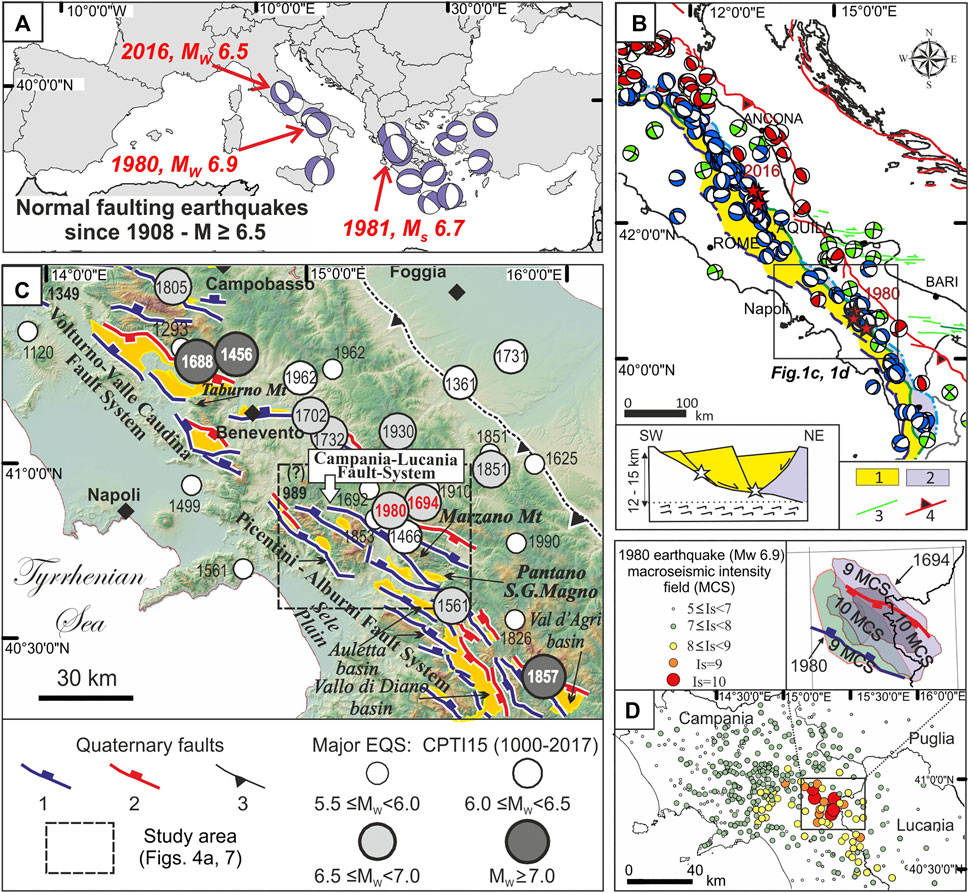
FIGURE 1. The Campania-Lucania 1980 earthquake in the Mediterranean seismotectonic context. (A) Mediterranean normal faulting earthquakes with M ≥ 6.5 since 1908 derived from the World Stress Map database (Heidbach et al., 2018). (B) The Italian earthquake focal mechanisms (MW ≥ 4.0) from 1908 to 2015 (Montone and Mariucci, 2016); red stars represent the mainshocks of 2016/2017 Central Italy and 1980 Campania-Lucania seismic sequences. The background colors indicate the extensional seismotectonic provinces as in Lavecchia et al., 2021: Key: 1 = Extensional seismogenic province; 2 = Deep extensional seismogenic province; 3 = right-lateral strike-slip faults within the Adriatic foreland; 4 = Active outer thrust system; The sketch in the lower left corner represents the simplified model of the Apennine extensional system as in Lavecchia et al., 2011. (C) Active faults in Southern Italy (after Adinolfi et al., 2015) with major historical and instrumental earthquakes from Parametric Catalogue of Italian Earthquakes, CPTI15 v2.0 (Rovida et al., 2019). Key: 1, east-dipping normal faults; 2, west-dipping normal faults; 3 thrust faults. (D) 1980 earthquake macroseismic field from the Italian Macroseismic database DBMI15 v2.0 (Locati et al., 2019). The inset in the right upper corner represents the contour of IX and X MCS intensity of the 1694 and 1980 earthquakes.
When focusing on Italian cases, we observe that the Central Italy 2016 seismic sequence (CISS-2016) released in three months three neighboring major events with Mw between 6.0 and 6.5, activating as a whole a ∼60 km-long SW-dipping extensional fault alignment and releasing a cumulate magnitude of Mw ∼6.8 (Lavecchia et al., 2016; Menichetti et al., 2016; Porreca et al., 2020; Brozzetti et al., 2019; Brozzetti et al., 2020).
Conversely, the Campania-Lucania earthquake of November 23, 1980 (also Irpinia earthquake, hereinafter referred to as 1980-EQ), released a similar total magnitude (Mw 6.9) in a time span of about 1 min (Bernard and Zollo, 1989). It had multiple sub-events that activated in sequence three distinct neighboring fault segments, also with opposite dips (east- and west-dipping) (Westaway and Jackson, 1987; Bernard and Zollo, 1989). Surface displacements with peaks slightly exceeding 1 m were documented along the fault trace (Pantosti and Valensise, 1990; Galli and Peronace, 2014).
Surface ruptures, aftershock distributions and kinematics of both 1980-EQ and CISS-2016 are well consistent with the activation of normal and normal-to-oblique intra-Apennine Quaternary faults at upper crustal-depths (Valensise and Pantosti, 2001; Basili et al., 2008; DISS Working Group, 2018). The kinematics characterizing either the active normal faults or the focal mechanisms of all the instrumental Mw ≥ 5.5 earthquakes that occurred along the intra-Apennine extensional belt are consistent with a NE-SW minimum horizontal stress axis (Pantosti and Valensise, 1990; Brozzetti and Lavecchia, 1994; Pondrelli et al., 2006; Brozzetti et al., 2009a; Ferrarini et al., 2015).
The 1980-EQ was the most destructive Italian earthquake of the last 40 years, but it occurred almost in early instrumental times and in spite of large efforts in the literature its seismotectonic and seismogenic interpretation is still questioned, starting from the size, the attitude, the dip-angle and the depth of the involved fault segments.
CISS-2016 taught us that extensive and detailed use of geometric and kinematic fault data, covering a time span from Late Pliocene to present, can help to identify the segmentation pattern that controls the seismogenic stress release (Lavecchia et al., 2016; Livio et al., 2016; Wilkinson et al., 2017; Brozzetti et al., 2019; Porreca et al., 2020). Therefore, in this paper, in the light of lessons learned from CISS-2016, we attempt a thorough seismotectonic revision of the 1980-EQ with the main aim to improve our understanding of earthquake-fault association and seismogenic scenarios in Italy.
In this paper, after an overview of the geological and seismological background of the 1980-EQ, we:
(1) Update the geometry and kinematics of the Quaternary extensional fault pattern within the epicentral area through detailed structural mapping and construction of a new digital fault-slip database (Supplementary Tables S1, S2 and Data Sheet S1) and compare the present state of the coseismic rupture pattern with that developed within few years from the event (Pantosti and Valensise, 1990).
(2) Revise and partially update seismological data from the literature (hypocentral distributions and focal mechanisms of three major 1980-EQ sub-events, of the aftershock sequence and of the recent background seismicity (Supplementary Tables S3–S5).
(3) Perform independent stress inversion of geological and seismological data to evaluate the present and Quaternary stress tensor and compare them over time.
(4) Reconstruct the depth geometry of the outcropping fault pattern, down to the base of the seismogenic layer, along the trace of the CROP-04 seismic profile, which strikes across the 1980-EQ source area.
(5) Build a 3D fault model of the 1980-EQ seismogenic faults by integrating all the newly acquired and the revised multi-source information.
(6) Advance a new seismotectonic hypothesis concerning the fault segmentation control on the 1980-EQ sub-events propagation.
Background
Seismotectonic Setting
The 1980-EQ is located within the Campania-Lucania sector of the intra-Apennine Extensional Province (Figures 1B,C). This Province is manifest along the entire length of peninsular Italy (Lavecchia et al., 2011; Lavecchia et al., 2021 and references therein). It consists of moderate to high-angle (>45°) westward and eastward-dipping normal faults, Quaternary and Late Quaternary in age (Martini et al., 2001; Brozzetti, 2011). At depth, these faults detach along low-angle east-dipping discontinuities (Figure 1B) interpretable as regional low-angle normal faults (LANFs) highlighted by seismic lines and background seismicity rock volumes (Boncio et al., 2000; Barchi et al., 2007; Brozzetti et al., 2009b; Mirabella et al., 2011; Di Naccio et al., 2013; Lavecchia et al., 2017). Recent works suggest active asymmetrical extension driven by east-dipping LANFs which would represent the basal detachment of the high-angle seismogenic fault bounding the seismically deforming upper crust for the Campania-Lucania and northern Calabria arcs (Brozzetti, 2011; Brozzetti et al., 2017a; Brozzetti et al., 2017b).
The Extensional Province dislocates pre-existing Late-Miocene Early-Pliocene compressional structures (Lavecchia, 1988) on the west. On the east, it is parallel to an active and seismogenic eastward verging coaxial contractional belt (Lavecchia et al., 1994) also revealed from focal mechanisms (Figure 1B). In a even more external position, near-vertical E-W-striking faults confined within the Adriatic foreland are also known (Figure 1B).
Within the Campania-Lucania sector of the Intra-Apennine extensional belt (area of Figure 1C), the deformation is accommodated by distributed faults, east-to west-dipping with low to moderate slip rates (0.2–2 mm/yr; Galli and Bosi, 2003; Galli et al., 2006; Papanikolaou and Roberts, 2007; Ferranti et al., 2014; Sgambato et al., 2020). These structures are mainly developed in the hanging wall of a regional east-dipping system, whose inner outcropping master faults can be traced from the Volturno-Valle Caudina Fault System to the Alburni-Picentini Fault System (Brozzetti, 2011). The associated hanging wall basins are asymmetric, filled by syntectonic continental deposits and characterized by south-westward thickening, tilted beds. They well document extensional activity in the time interval from the Early Pleistocene to the Holocene (Abate et al., 1998; Ascione et al., 2003; Giano and Martino, 2003; Brozzetti and Salvatore, 2006; Martino, 2007). Activity predating the Early Pleistocene is indicated in some key areas (Auletta and Vallo di Diano basins) by seismic reflection profiles (Barchi et al., 2007; Amicucci et al., 2008).
Ongoing extensional activity of the area is testified by geodetic data (2–5 mm/y, Devoti et al., 2011; D'Agostino, 2014; Ferranti et al., 2014) and diffuse seismicity. Focal mechanisms testify an upper crustal (<12–15 km) stress state with SW-NE minimum horizontal axis. The pure-normal and normal-oblique kinematics focal mechanisms show a dominant SW–NE extensional regime, compatible with the attitude of the known active faults (Cello et al., 2003; Maschio et al., 2005; Brozzetti et al., 2009b).
Since the 1980-EQ, diffuse background seismicity with a few small-to-moderate events (Mw < 5.0) have been recorded (De Matteis et al., 2012; Stabile et al., 2012; Amoroso et al., 2014; De Landro et al., 2015; Vassallo et al., 2016). Destructive earthquakes have occurred historically (Figure 1C; Porfido et al., 2002; Rovida et al., 2019). In particular, there is knowledge of three events (Mw ≥ 7.0, Io XI MCS) among the strongest of the Italian territory (1456 Mw 7.2; 1688, Mw 7.1; 1857, Mw 7.2) plus seven moderate-large events (6.5 ≤ Mw < 7.0 with macroseismic intensity up to X-XI MCS). In the study area (Figure 1C) the Italian Parametric Catalogue (CPTI15v.2, Rovida et al., 2019) reports other six events with equivalent magnitude greater than M 5.5 occurred from the second half of 1400 to date (1466, 1561, 1692, 1694, 1853, and 1910). Furthermore, archaeoseismic evidence highlights two destructive earthquakes occurred in the second half of the first century and in 989–990 AD (Blumetti et al., 2002; Galli and Peronace, 2014; Galli, 2020).
The Campania-Lucania 1980 Earthquake (1980-EQ)
On the 23rd of November (18:34 UTC) 1980, a sector of the Campania Lucania Fault System (hereinafter referred to as CLFS) broke in a Mw 6.9 destructive earthquake (Westaway, 1993) that produced widespread damage, razed to the ground six villages (X MCS) and caused ∼3,000 casualties (red circles in Figure 1D). The 1980-EQ was not preceded by significant events (Martini and Scarpa, 1983), but only by swarms of microearthquakes along the boundaries of the current rupture (Del Pezzo et al., 1983) observed with a local seismic network by Cagnetti et al. (1981). It was followed by several hundred earthquakes, with four major aftershocks (M ≥ 5.0) occurred on the 24th and 25th November, on the 16th of January, 1981, and on the 3rd of December 1980 (Pantosti and Valensise, 1990). A temporary network was operating from the 1st to the 15th of December and many authors analyzed the aftershock relocations, focal mechanisms, and velocity models (Deschamps and King, 1984; Westaway and Jackson, 1987; Bernard and Zollo, 1989; Pantosti and Valensise, 1990; Amato and Selvaggi, 1993; Amoruso et al., 2011).
Significant surface fractures were generated by the 1980-EQ. The papers published immediately after the earthquake ascribed them to gravitational phenomena or landslide with tectonic origin (Bollettinari and Panizza, 1981; Cantalamessa et al., 1981; Carmignani et al., 1981; Ortolani and Torre, 1981). Only some years later, they were recognized as primary coseismic ruptures in some still pivotal papers. Westaway and Jackson (1987) reported on 20 km-long primary coseismic faulting. Pantosti and Valensise (1990) and Pantosti and Valensise (1993) described 38 km of coseismic ruptures. Subsequently, Blumetti et al. (2002) presented new field data and demonstrated the importance of an antithetic west-dipping system. Galli and Peronace (2014) reviewed the effects of the surface faulting through a structural and topographic survey along a 43-km-long fault.
Sub-events of the 1980-EQ
The 1980-EQ was a complex normal faulting event characterized by multiple ruptures. It consisted of three sub-events (Figure 2A) occurring within 1 min (0 , ∼20 and ∼40 s), and of several rupture episodes (2–12) within the first 20 s (Westaway and Jackson, 1987; Bernard and Zollo, 1989; Pantosti and Valensise, 1990; Vaccari et al., 1990; Westaway, 1993). The 1980-EQ released a total seismic moment between (1.4–3.0 E+19 Nm) corresponding to a cumulate magnitude moment between Mw 6.7 and 6.9. The magnitude attributed to the three sub-events ranges from Mw 6.7 to 6.8 for sub-event 1, from Mw 6.3 to 6.4 for sub-event 2 and from Mw 6.2 to 6.3 for sub-event 3 (Supplementary Tables S3, S5). The location of three sub-events are ambiguous due to the backswing of earlier arrivals, but focal mechanisms are coherent with prevailingly normal kinematics (Giardini et al., 1993). A summary of available data is here given in Supplementary Tables S3, S5.
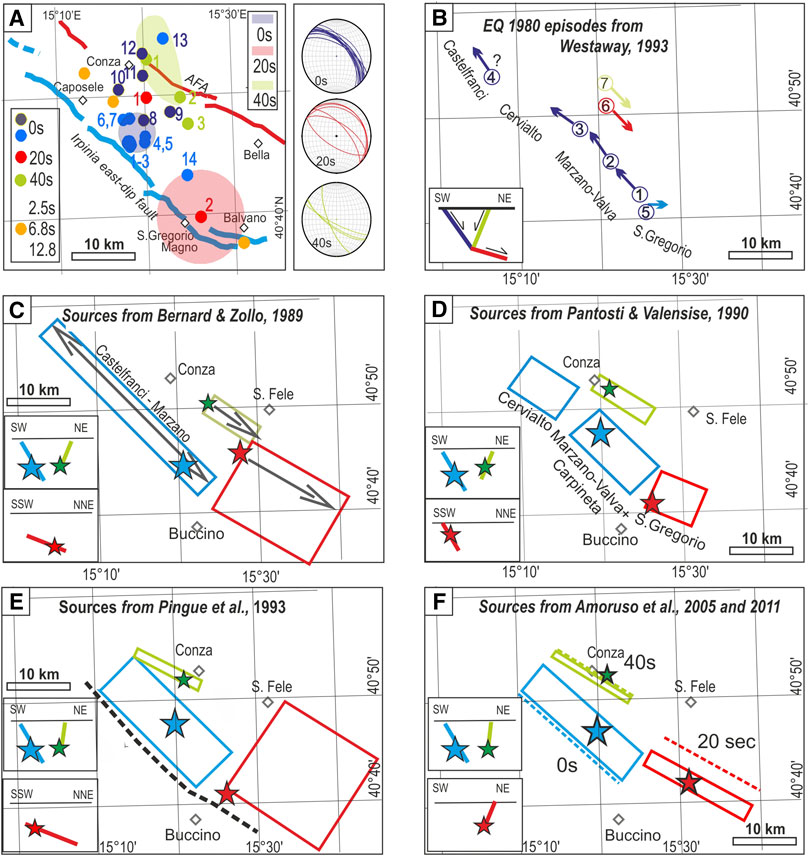
FIGURE 2. Epicentral locations and source models of the 1980 Campania-Lucania earthquake from the literature. (A) Summary of epicentral location proposed by different investigators for the sub-event 1 (blue circles), sub-event 2 (red circles), sub-event 3 (green circles). The respective table with references is given in the supplementary material (Supplementary Table S3). The orange circles are other seismic episodes occurred at 2.5, 6.8, and 12 s from the sub-event 1 as in Westaway and Jackson (1987). The colored areas represent the seismic location uncertainty as in Bernard and Zollo, 1989. Summary of preferential fault plane solutions proposed in literature for sub-events 1–3 (Supplementary Table S4). (B–F) The geometry of the main seismogenic sources of the three events representing a complex rupture mechanism occurred within 1 min of the onset of the main event (0, 20, 40 s) proposed by different investigators (Westaway and Jackson 1987; Bernard and Zollo 1989; Pantosti and Valensise 1990; Pingue and De Natale, 1993; Westaway, 1993; Troise et al., 1998; Dalla Via et al., 2003; Amoruso et al., 2005; Amoruso et al., 2011) Blue boxes refer to the first event (0 s), red boxes to the second (20 s) and the green boxes to the third one (40 s). The inset inside each panel is the schematic cross section of the proposed model.
Sub-event 1 was located from most of investigators to the eastern flank of Marzano Mt., with epicentral solutions clustered within ∼3 km (blue dots, n° = 1–7, Figure 2A). Substantially different seismic locations were given by the seismological agencies (e.g., NEIC, NEIS, ISC, ING; dark blue dots n° = 8–12 in Figure 2A) and by Westaway (1993) (Figure 2A, Supplementary Table S3, n°14). Conversely, there is a good agreement for the fault planes (Supplementary Table S4), that show an average dip angle of 60° (±15°) and a N45°E (±15°) dip direction.
The epicentral locations and seismogenic fault planes of sub-events 2 and 3 are more dispersed. The solutions of sub-event 2, as located by Westaway and Jackson (1987) and by Bernard and Zollo (1989) (red dots, n° = 1–2 in Figure 2A), are about 20 km away each other.
Even if with dispersed epicentral locations, sub-event 3 is almost unanimously attributed to the west-dipping high-angle (70–80°) antithetic normal fault system, although assuming different fault strikes as shown in the stereonet of Figure 2A (156°, Westaway and Jackson, 1987 and 115° Pingue and De Natale, 1993). The most recent location of sub-event 3 was proposed by Amoruso et al., (2011) (the southernmost location of this sub-event, green dot n° 3 in Figure 2A).
Source Models
Various source models have been proposed for the 1980-EQ. The main ones, associated to the three sub-events, are summarized in Figure 2. Sub-event 1 is unanimously associated to the NE-dipping fault along the eastern flank of the Cervialto and Marzano Mts, although different names are given to this structure (Scarpa and Slejko, 1982; Brüstle and Müller, 1983; Del Pezzo et al., 1983; Deschamps and King, 1983; Westaway and Jackson, 1987; Pantosti and Valensise, 1990; Giardini et al., 1996; Amoruso et al., 2011).
Westaway and Jackson (1987) and Westaway (1993) proposed that it involved all the NE-dipping fault alignment from Castelfranci to S. Gregorio, for an along strike extent of ∼70 km and with 4-5 rupture episodes (numbered circles in Figure 2B).
Bernard and Zollo (1989), based on a re-evaluation of teleseismic, strong motion and leveling data, associated sub-event 1 to a multiple fracture from Castelfranci to Marzano, excluding the activation of the San Gregorio fault segment (Figure 2C).
Pantosti and Valensise (1990) considered for sub-event 1 a more conservative along-strike extent (∼40 km in length). Based on a geological approach, they associated the 0 s earthquake exclusively to the Marzano and Cervialto faults, because they did not find any surface faulting evidences north of Cervialto Mt. (Figure 2D).
Based on leveling data, other authors (Pingue et al., 1993; Troise et al., 1998; Dalla Via et al., 2003; Amoruso et al., 2005) indicated a rupture length (25 km) for the sub-event 1, even if the northern termination of the fault is not well constrained by such data (Figure 2E).
Sub-event 2 is located by Westaway and Jackson (1987) NE of Marzano Mt. and is attributed to the down-dip low-angle continuation of the high-angle NE-dipping Marzano fault. Several other authors (Bernard and Zollo, 1989; Pingue et al., 1993; Westaway, 1993; Troise et al., 1998; Dalla Via et al., 2003; Lancieri and Zollo, 2009) associated sub-event 2 as well to a low-angle normal fault, but located it at the base of the brittle layer along the down dip prosecution of the NNE-dipping outcropping of San Gregorio fault (inset in Figures 2C,E).
Pantosti and Valensise (1990) associated sub-event 2 with a high-angle normal fault belonging to the San Gregorio segment along the southward continuation of the Marzano fault (inset in Figure 2D). Amoruso et al. (2005), based on leveling data and aftershock distribution, detected, as a possible causative fault of the 20 s event, a SW-dipping high-angle normal fault, antithetic to the S. Gregorio one (inset in Figure 2F), which possibly reactivated a high-angle thrust fault located at the eastern edge of the Apulian belt (Improta et al., 2014).
Sub-event 3 is mostly attributed to the SW-dipping high-angle normal fault system antithetic to the Marzano Mt., possibly reactivating pre-existing Pliocene thrust structures (Amato and Selvaggi, 1993). The source is given in correspondence of the Conza fault or several kilometers southward (Westaway and Jackson 1987; Bernard and Zollo, 1989). Pingue and De Natale (1993), based on leveling data, proposed a 120°-striking and 80° SW-dipping fault. A very different hypothesis was advanced by Crosson et al. (1986), that associated sub-event 3 to a NE-trending fault orthogonal to the main Cervialto-Marzano alignment.
STRUCTURAL-GEOLOGICAL DATA AND ANALYSIS
An extensive set of observations were made during four field campaigns from 2017 to 2019. We carried out the fieldwork over an area of ∼2400 km2, primarily aimed at acquiring long-term and coseismic fault/slip data and at mapping the fault trace using a tablet computer on which the Petroleum Experts Fieldmove software was installed. We integrated the new data with geological maps from Servizio Geologico d'Italia (Servizio Geologico d’Italia, 1969; Servizio Geologico d’Italia, 1970a; Servizio Geologico d’Italia, 1970b; Servizio Geologico d’Italia, 1970c), scale 1:100.000, producing an original structural-geological map of the CLFS across the epicentral zone of the 1980-EQ (Figure 3; Supplementary Figure S1) and surrounding areas.
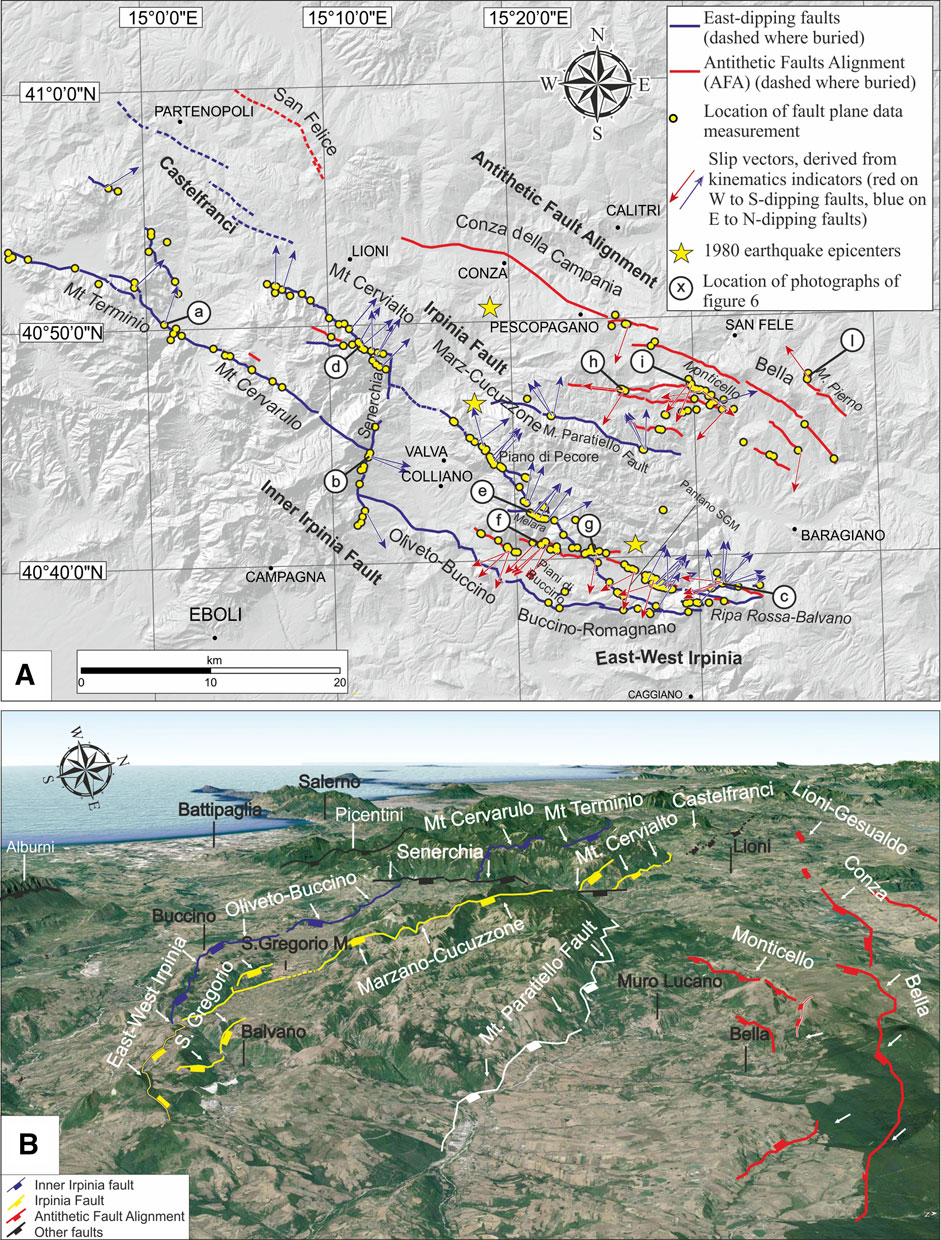
FIGURE 3. (A) Summary map of the reconstructed tectonic structures and of the acquired data in the Campania-Lucania 1980 earthquake epicentral area. Arrows show the slip vectors derived from kinematic indicators and reported together with the structural data of the fault planes in the stereoplots of Figure 4. Yellow circles represent the location of the structural data summarized in stereoplots of Figure 4 and listed in Supplementary Table S1. Letters in white circles refer to photographs of Figure 6. (B) Panoramic view looking WNW of the entire study area. The fault alignments are shown in their subdivision into segments.
On a whole, we acquired ∼350 data points (Figure 3), grouped in 40 survey sites (hereinafter referred to as SS) and we plotted the fault/striae measurements in stereoplots using the FaultKin7 software (Allmendinger et al., 2012; Figure 4). To our dataset we added ∼50 more observations from other authors (Brozzetti, 2011; Ascione et al., 2013; Galli and Peronace, 2014). We provide the dataset of georeferenced structural-geological observations and measurements as an Excel file to facilitate further use (Supplementary Table S1).
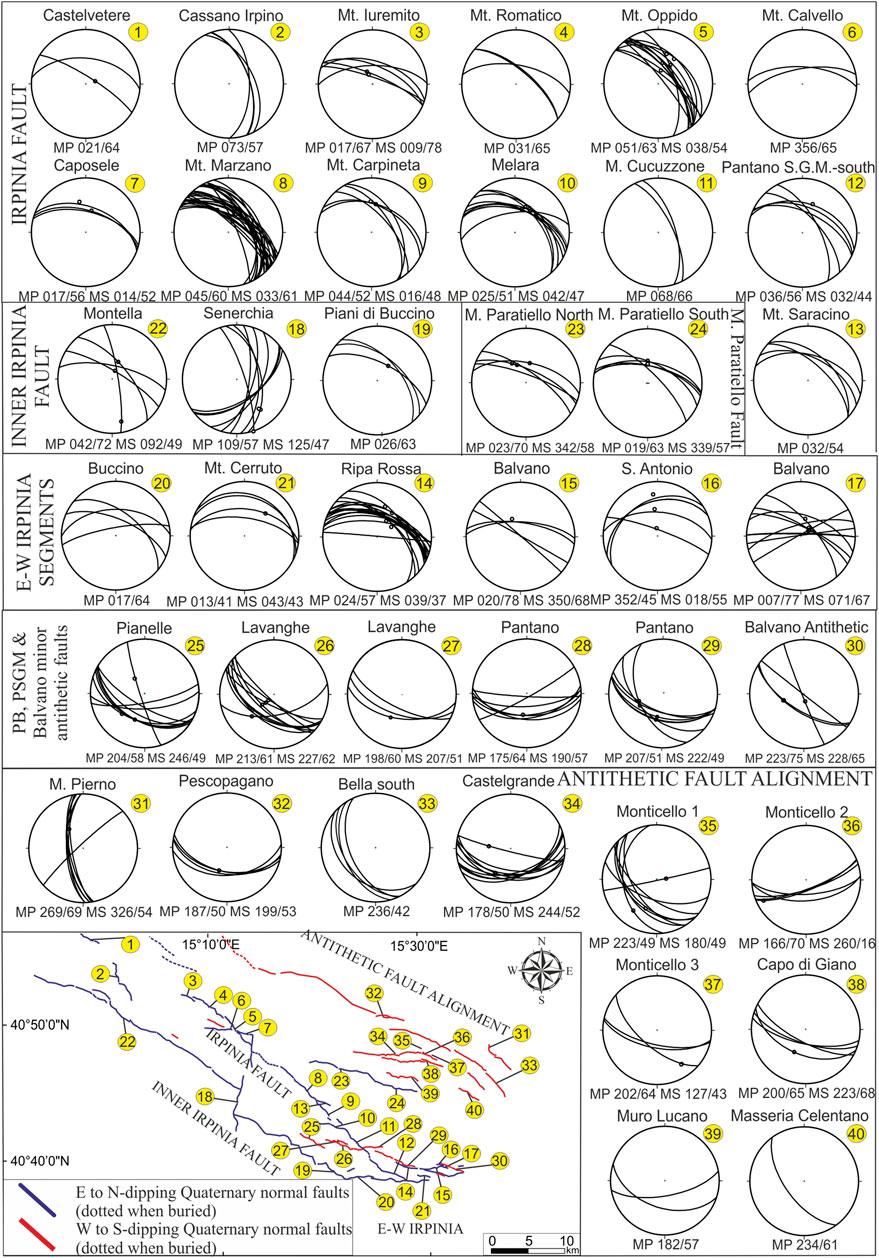
FIGURE 4. Structural analysis carried out on the Quaternary normal faults outcropping in the Campania–Lucania 1980 earthquake epicentral area. Stereoplots of survey sites (SS) depicting normal faults (great circles) and striated normal faults (great circles with small black circles) are grouped by the fault or fault-alignment on which the data were acquired. Only normal or normal-oblique senses of slip were observed. The map (lower left) shows, as small yellow circles, the location of the SS that consist either of structurally homogeneous outcrops, or group of close outcrops. Sites are numbered from north to south for each of the reconstructed structures.
To provide an immediate view of the data distribution on the three main faults (detailed in the next section), we plotted them on four stereoplots (Figure 5A).
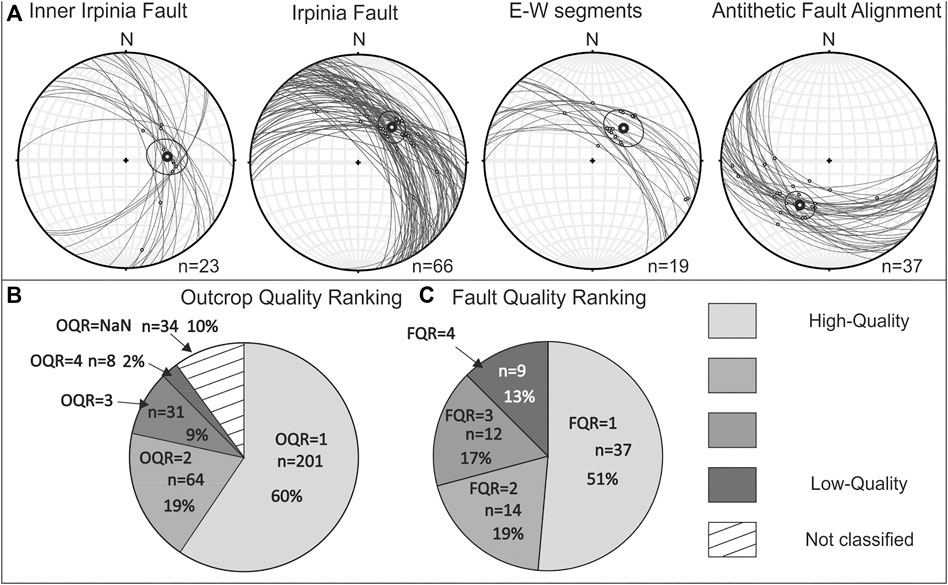
FIGURE 5. Summary of structural data and quality parameters. (A) Faut/slip data (fault planes and slip vectors from slickenlines) summarized for the main faults reconstructed in this paper. The mean slip vectors are reported for each fault with the bold black circles; error calculated are reported with the thin black circles around the mean slip vectors. (B) Distribution of the measurements by the assigned four-class Outcrop Quality Rankings (OQR) (see also Supplementary Table S1). (C) Distribution of the mapped faults divided on the basis of the four-class Fault Quality Rankings (FQR) assigned (see also Supplementary Table S2 where FQR are reported close to the fault name).
We analyzed the measured fault planes containing kinematic indicators using both the FaultKin7 and Stereonet software (Allmendinger et al., 2012). From this analysis we obtained the pseudo-focal mechanism for groups of fault/slip data belonging to or neighboring of a single SS (Supplementary Figure S2). In Table 1, we report the deformation parameters expressed as fault attitude, rake, and deformation axes of the pseudo-focal mechanisms with a representative location (Lat and Long).
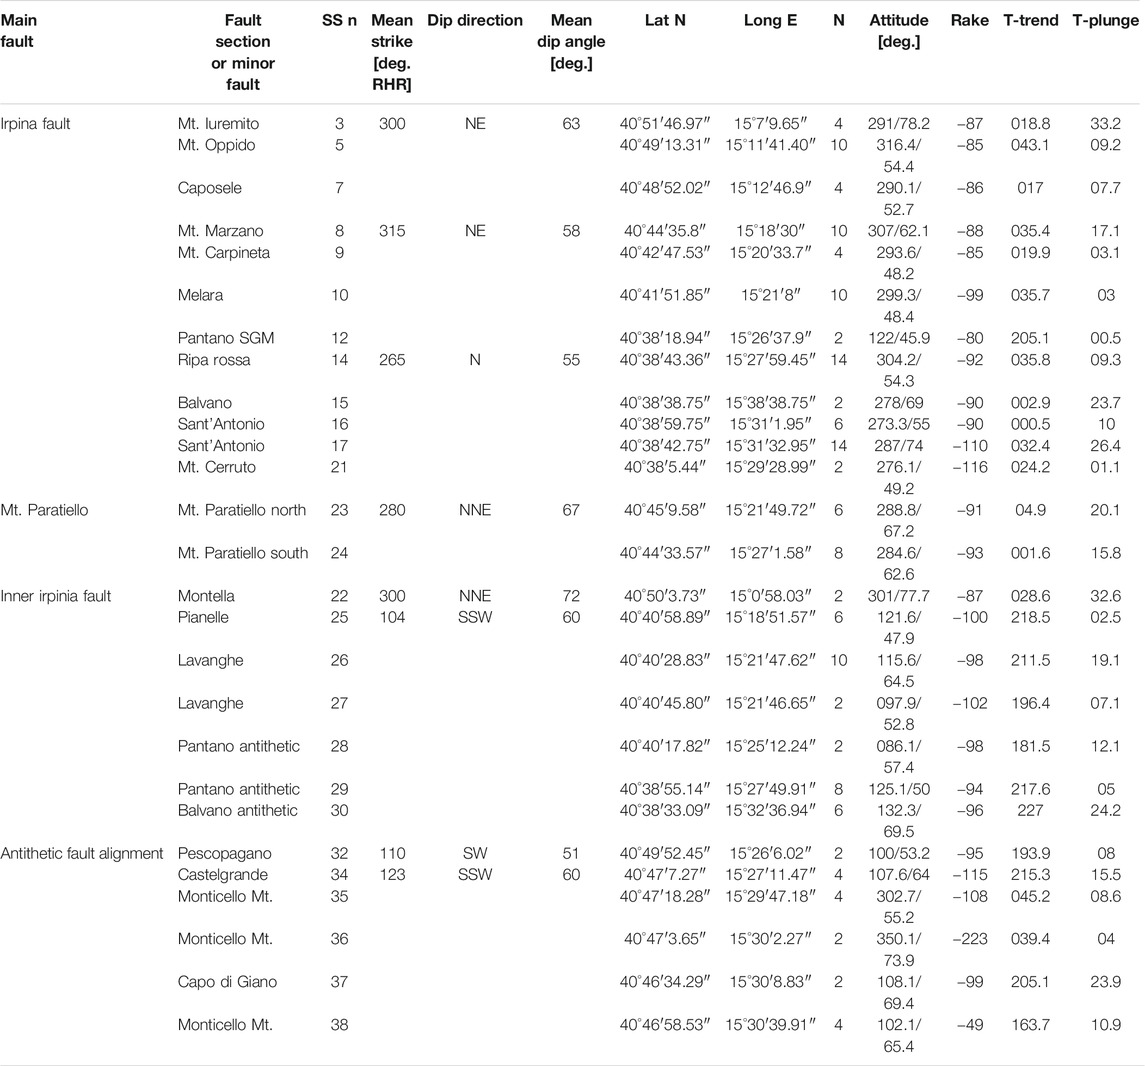
TABLE 1. Pseudo-focal mechanisms parameters. Lat N and Long E are representative location as they refer to an average location of a number of neighboring data points at different outcrop sites; N = number of fault slip/data used for the pseudo focal mechanism computation. Attitude is in strike/dip and rake is in Aki-Richards format; T axis (trend/plunge) have been computed applying the dihedron angle method to fault populations (Angelier and Mechler, 1977).
For quality control, we assigned each of the structural-geological data with a quality parameter called Outcrop Quality Ranking (OQR). We assigned the OQRs during the field campaigns describing the degree of preservation and therefore the level of reliability of the outcrop on which the data was acquired. OQR is ascending (one is best). Out of the ∼330 measurements, we assigned OQR = 1 to the 60% of them, OQR = 2 to the 19%, OQR = 3 to the –9% and OQR = 4 to the 2%. (Figure 5B). 10% of the outcrops were not rated. Looking at the overall data, we find a direct proportionality between the rock type and the OQR; measurements acquired on limestone or on indurated rock types obtained a higher OQR. The high percentage of OQR = 1 is in fact due to the presence, in this area of the southern Apennines, of formations belonging to the Apennine Carbonate Platform (Late Triassic - Middle Miocene), (Supplementary Figure S1 and Table S1).
To facilitate the use of the collected data and to increase quality control, we produced and provide a collection of the most significant sites’ pictures to illustrate the landscapes, outcrops and features of the whole area (Supplementary Data Sheet S1). We produced the photographic documentation with one, two or three pictures on the ∼60% of the outcrops. Each of the picture is uniquely identified with an ID number (photographic documentation ID in Supplementary Table S1 and Data Sheet S1). We also show some examples of representative fault planes outcropping in the 1980-EQ epicentral area in Figure 6.
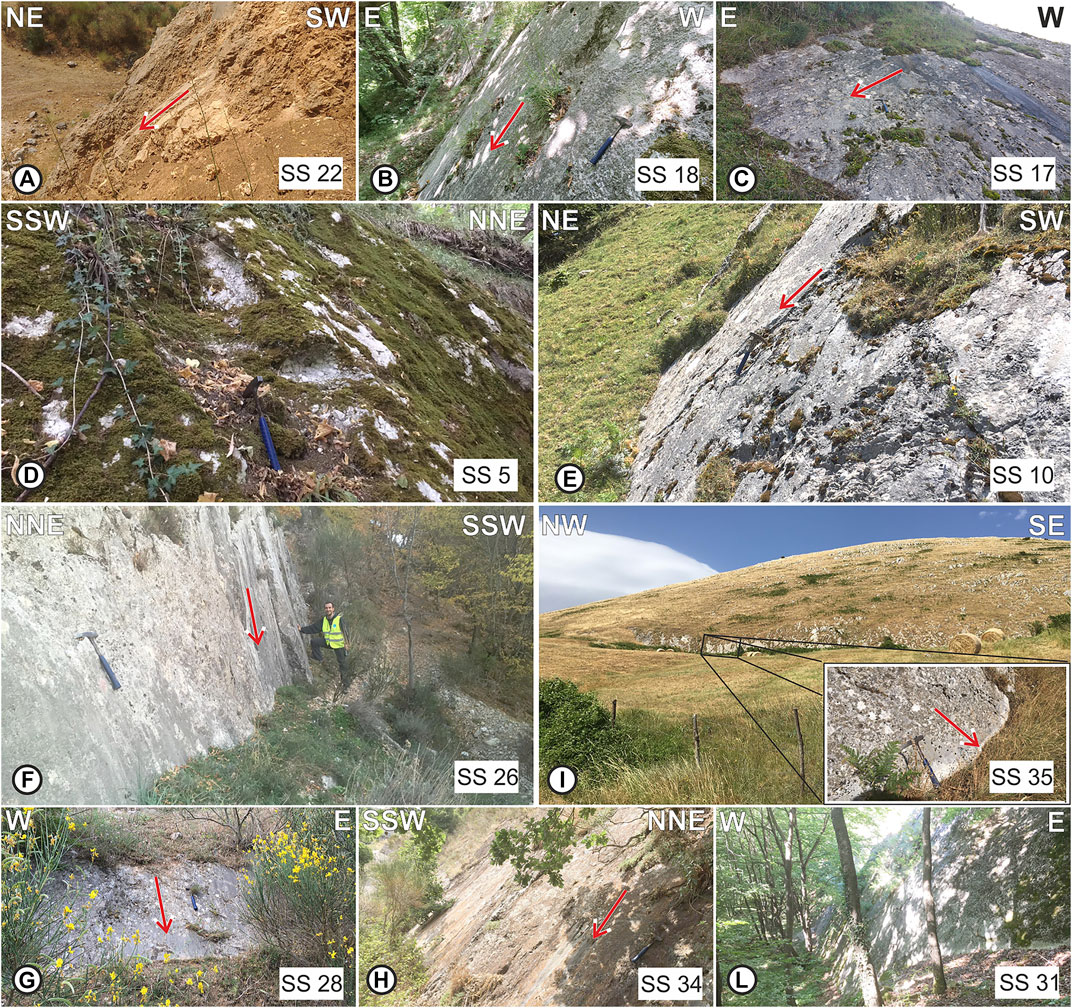
FIGURE 6. Outcrop views of the Quaternary normal faults mapped in the study area (locations in Figure 3 as small white circles) (A,B) refer to InIF; (C) to the E-W Irpinia; (D,E) to IF; (F,G) to minor antithetic structures in the PB and PSGM basins; (H,I,L) refer to AFA. Red arrows indicate the sense of slip given by the slickenlines measured on the fault plane. On each picture the number of the SS located in Figure 6 is also indicated.
We also focused attention on evidence of coseismic slip associated with the 1980-EQ. We paid attention to those structures along which previous authors documented the 1980 earthquake primary coseismic ruptures (hereinafter referred to as CoRs), but we also identified some new evidence of coseismic slip which is significant for the seismotectonic interpretation of the system. After forty years, the CoRs are excellently preserved as it can be appreciated in Figure 7. Both the CoRs traces from previous papers (Pantosti and Valensise, 1990; Blumetti et al., 2002) and the new ones observed, are shown on the map of Figure 8A. A schematic summary of the geologic contacts between the hanging wall and the footwall of the CoRs is also reported.
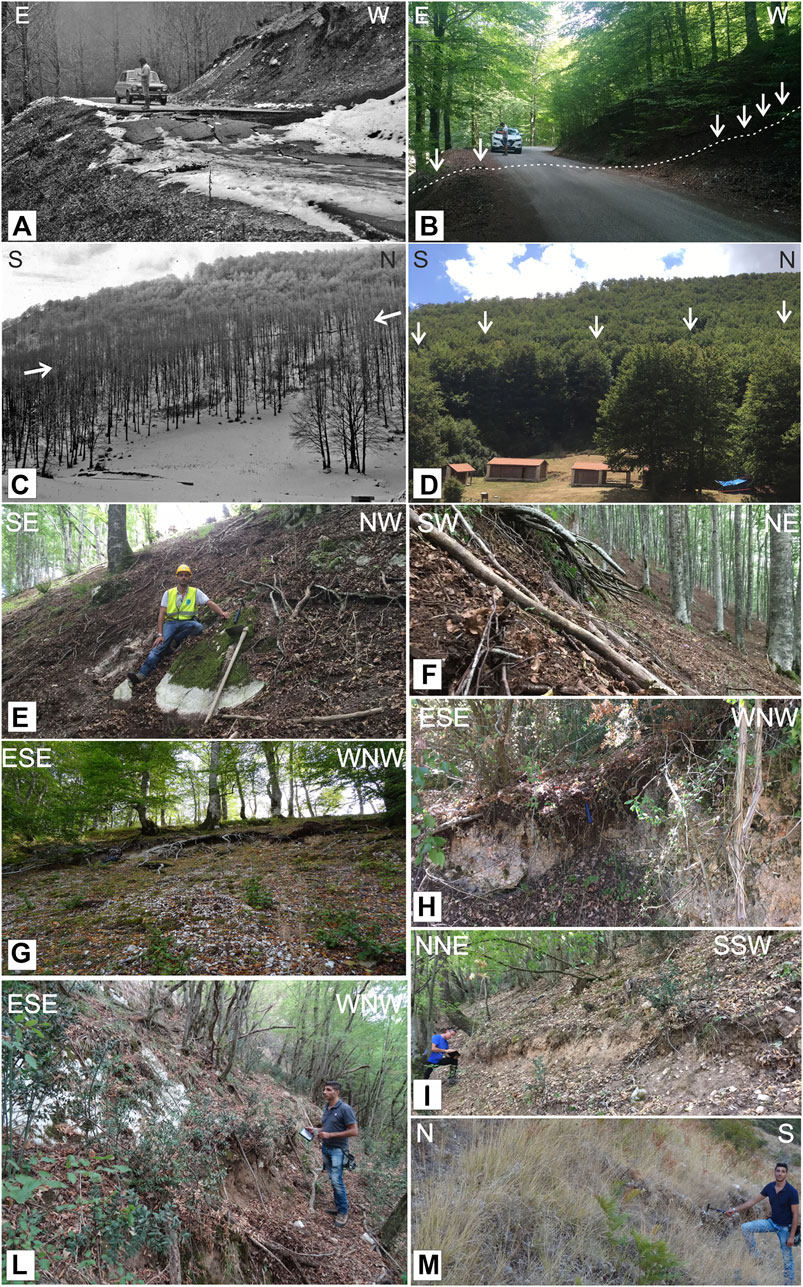
FIGURE 7. Coseismic rupture evidence along the IF and AFA. Location in Figure 8A. (A) The road that coast the Piano di Pecore on Marzano Mt. with surface faulting of about 1 meter. (B) The restoration of the road surface has erased the trace along the road of the coseismic rupture, but the latter remains evident at its edges (black arrows). (C) Coseismic rupture along the Marzano Mt. slope in January 1981. (D) Panoramic view of the fault escarpment that highlights the shadow that the trees on the hanging wall expose on the trees on the footwall due to the coseismic ruptures (white arrows). (A and C) are photographs of I. Sgrosso published by Galli and Peronace, 2014 and (B, D) are photographs taken in the same places 40 years later during our field campaigns. (E) CoRs with the bedrock fault plane outcropping (Marzano Mt.). (F) Roots cut by the 1980 ruptures along the Marzano Mt. slope (details in the text). (G) CoRs affecting the slope close to the Melara locality (Melara fault section). (H) CoRs in the breccias at the southern edge of the PSGM basin (PSGM fault segment). (I, L) CoRs along the Ripa Rossa–Balvano segment affecting the slope debris at the base of the bedrock, or by fracture in soils and colluvium (details in the text), with vertical separations up to 1 m. (M) Rupture in the slope deposits with ∼20 cm offset along the slope of Monticello Mt.
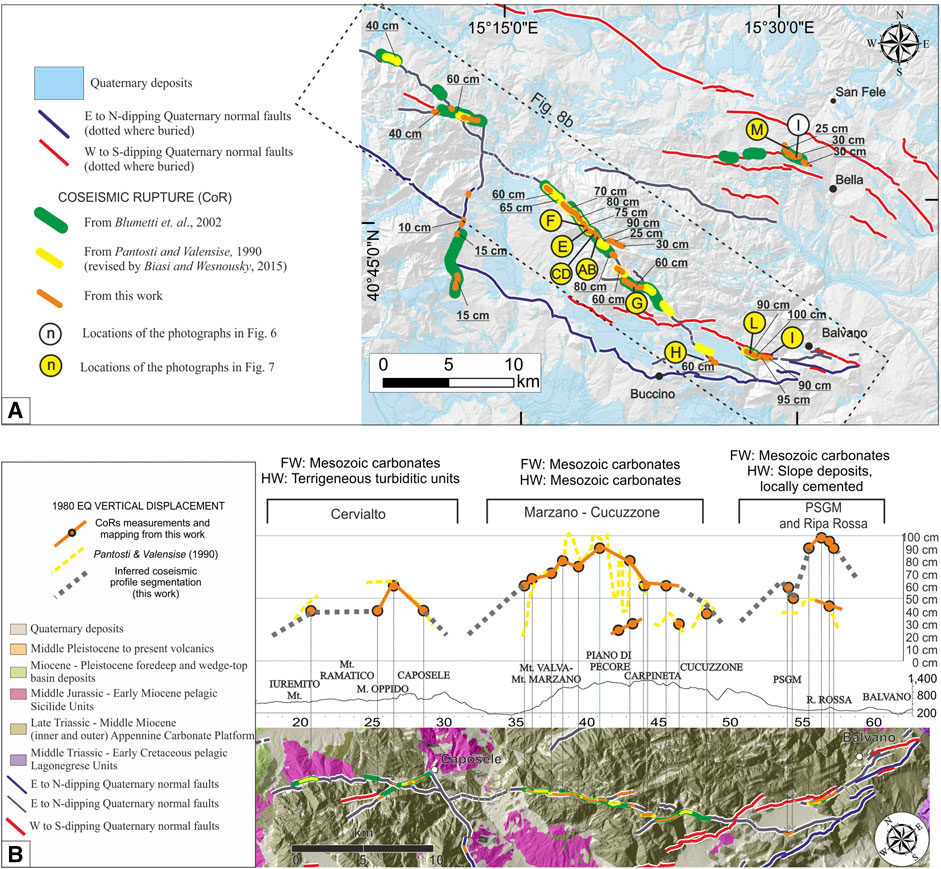
FIGURE 8. Representation and analysis of 1980 coseismic data (A) Schematic structural map of the study area on which the Quaternary deposits are represented in light-blue on a 10 m resolution DEM. Along the traces of the main faults, the vertical displacement (in centimeters) of the CoRs measured during our fieldwork are reported. The extent along the strike of the CoRs is represented through colored ribbons according to the authors who mapped them (explained in the legend). Yellow circles are the locations of the photographs of Figure 7. (B) The graphics is a comparison between CoRs mapped in this work (orange lines and circles) and CoRs mapped by Pantosti and Valensise (1990) (yellow dashed lines) reported in map view through the topographic profile on the trace of IF. A schematic summary of the geologic contacts between the hanging wall and the footwall of the CoRs along the different segments is reported.
Fault Segmentation Pattern
The field mapping and the structural dataset allowed us to highlight a complex Quaternary structural setting and segmentation pattern across the CLFS (Figure 3A; Supplementary Figure S1). Three main fault strands were mapped; they are here referred to as Inner Irpinia Fault (InIF) and Irpinia Fault (IF), eastward-dipping, and as Antithetic Fault Alignment (AFA), westward-dipping. Each of them¸ which have along-strike lengths in the order of several tens of km, represents a first-order structure, organized in second-order segments (few tens of km) and third-order sections (some km). The hierarchical order was defined at the 100.000 mapping scale and was based on the segmentation pattern of the fault traces derived from the distribution and size of structural-geometric features and complexities and locally integrated with 1980 coseismic displacement observations from the literature (e.g., Boncio et al., 2004; Manighetti et al., 2005; Christophersen et al., 2015) and from this paper.
The three first-order main faults, with lengths of 50–60 km, may be considered as individual and potentially seismogenic master faults. They would be substantially continuous at seismogenic depths (10–12 km) even if segmented at the surface and capable of releasing large-magnitude multi-rupture normal fault earthquakes, such as the 1980-EQ.
The second-order faults, here referred to as segments, span over a relatively broad range of lengths (10–30 km); they are separated from each other by a few kilometric size structural or geometrical complexities such as fault gaps, sharp bends, intersections with cross structures and transfer faults. The segments, in turn, may be continuous along strike or envelope interconnected sections. The here identified sections have length varying between 3 and 10 km; they are not necessarily continuous along strike, but often arranged at the surface in closely spaced structures of minor hierarchical order, separated by hundreds of meter complexities.
Detailed information concerning the identified fault segments and sections, including location, length, strike, dip-angle and rake were determined and are made available in Supplementary Table S2. In addition to the segments and sections, we have also parameterized all minor faults or splays by dividing them in their position with respect to the main fault to which they belong (i.e., hanging wall, footwall, synthetic or antithetic).
We assigned to each fault section or splay a Fault Quality Ranking (FQR) between 1 and 4 (1 is best) based on the reliability of surface constraints. A fault well constrained by a considerable number of new or bibliographic structural data, with the presence of significant geomorphological evidence (e.g., triangular facets) received a FQR = 1. On the contrary, a fault not very defined at the surface by structural data, with scarce geomorphological evidence was considered model-driven and received a FQR = 4. On a total of 72 mapped sections and splays, we assigned a FQR = 1 to the 51% of them, a FQR = 2 to the 19%, a FQR = 3 to the 17% and a FQR = 4 to the 13% (Figure 5B). We reported the FQRs in Supplementary Table S2 close to the name of the fault.
We provide the mapped faults as a shapefile (Supplementary Data Sheet S2) and a full-page map with all the mapped faults and their names (segments, sections and minor faults; Supplementary Figure S3).
Detailed Fault Description
Inner Irpinia Fault
InIF is the westernmost main fault (∼55 km-long) of the study area. The measures are variable within a fairly wide range of strikes because the fault is made up of well-identified segments with sudden changes of directions (Figures 4, 5A). It is composed of four normal fault segments (from north to south they are referred to as Mt. Terminio, Mt. Cervarulo, Oliveto-Buccino and Buccino-Romagnano; Figure 3; Supplementary Data Sheet S2).
The Mt. Terminio segment is a NE-dipping segment extending for ∼22 km. The segment develops within the rock types belonging to the Apennine Carbonate Platform (Supplementary Figure S1). We divided this segment in three sections (Supplementary Data Sheet S2). In the central one, for nearly 2-3 km, it causes the tectonic contact between the carbonate platform and the Sicilian pelagic units (Supplementary Figure S1). The envelope of these three sections was described and identified as “Volturara Fault” in Papanikolaou and Roberts (2007) and similarly interpreted in Faure Walker et al. (2012) and in Sgambato et al. (2020).
Due to the dense vegetation and the diffuse soil coverage, we observed only a few striated fault planes in the field (SS 22-Figures 4, 6A), showing dip-slip. The fault segment defines several small intermontane basins filled with Quaternary sediments and bordered by slope breaks (Figure 8A; Supplementary Figure S1).
The Mt. Cervarulo segment strikes ∼ N300 for ∼14 km. It develops within the rock types belonging to the carbonate platform. It has been divided into two sections, the Mt. Cervarulo North and South, extended ∼9 and ∼5 km, respectively. Like the Mt. Terminio segment, several along-strike elongated basins are spread along its trace (Supplementary Figure S1).
A ∼ N-S striking transfer fault, named Senerchia, extending for ∼9 km, separates the two northern segments on the InIF from the southern ones. The fault causes the tectonic contact between the carbonate platform and the Sicilian pelagic units for its entire extent. Along this structure, numerous fault planes have been measured (Figure 6B; stereoplot 18, Figure 4). The calculated rakes for this fault range between −70° and −140° (Supplementary Table S1). The measurements made along this transfer fault, which is here considered part of the InIF, are evident in Figure 5A. The fault shows some evidence of coseismic displacement associated with the 1980-EQ (Blumetti et al., 2002; this paper). CoRs are on calcareous bedrock with vertical displacement of a few cm, along a road located east of the village of Senerchia.
The southern portion of InIF is composed of two segments divided by a sudden strike variation. The Oliveto-Buccino segment is a NE-dipping fault further divided based on minor strike variations into four sections. The extent and continuity of the fault are poorly constrained, due to the non-conservative lithology of the displaced units (Supplementary Figure S1) and to the abundant alluvial and slope debris cover. Nevertheless, the integration of field data with photo-geological interpretation, locally integrated with the visual analysis of morphostructural elements, led us to map for ∼20 km-along-strike. Where exposed, it dips north-westward at a high-angle of 60–65° and shows dip-slip sense of motion (SS 19 Figure 4).
With the Buccino-Romagnano segment, InIF turns to an E-W direction. It stretches for ∼9 km with local deviations in strike to WNW-ESE bordering the Piani di Buccino basin. The structural data measured along this segment are synthesized in the stereoplots of the SS 20–21 (Figure 4). We located the tip of the InIF at the intersection with the IF, described below.
The northern side of the Piani di Buccino are bordered by a left-handed arranged en-echelon pattern of minor faults here considered to be antithetic at the footwall of InIF (Supplementary Table S2). As for InIF, a clear change in strike is observed from NW-SE to ∼ E-W. This alignment develops for ∼17 km along-strike and contributes together with the whole east-dip system to the setting of the two intramountain continental basins (i.e., Piani di Buccino and Pantano di San Gregorio Magno, hereinafter referred to as PB and PSGM). The origin of these lacustrine basins, separated by a bedrock threshold and filled with quaternary deposits, occurred during the Middle Pleistocene (Ascione et al., 2013). We report the measurements of striated fault planes acquired on this alignment in the stereoplots SS25 to SS30 (Figure 4) and photographs in Figures 6F, 6G. The structural analysis shows mostly dip-slip (Figures 6F, 6G) and a slightly normal-left sense of motion in a few outcrops (SS29 in Figure 4).
Irpinia Fault
The IF is a largely exposed normal fault, widely described for large part of its extent in previous works (Pantosti and Valensise, 1990; Galli and Peronace, 2014, among others). It strikes in an average N125 E direction and develops for a total length of ∼55 km along-strike, with an average dip of 65° to the NE. It consists of three segments elongated in the Apennine direction (i.e., Mt. Cervialto, Marzano-Cucuzzone and PSGM segments, Supplementary Figure S3) and of a southernmost segment bent in the E-W direction (i.e., Ripa Rossa-Balvano) (Figures 3, 5A). The three NW striking structures extend along-strike for ∼13 km, ∼23 and 10 km respectively and are arranged in a right-handed en-echelon pattern.
The Mt. Cervialto segment consists of five en-echelon sections, each with a length between 2 and 3 km. The segment marks the contact between the Apennine carbonates at the footwall and terrigenous turbiditic units at the hanging wall (Supplementary Figure S1). Structural data acquired (Figures 4, 5A) show a purely dip-slip or slightly normal-left kinematic (Table 1; Supplementary Table S1). The average rake is −86°. Along this segment, near the village of Caposele, we measured CoRs with variable vertical displacements between 40 and 60 cm on bedrock (Figure 8). This segment is separated from the southern one by the pre-existing N-S discontinuity, coinciding with the Senerchia fault (described above).
The Marzano-Cucuzzone segment is composed of five sections each slightly bending in the southern portion from a NW-SE strike to a NNW-SSE (Figures 3, 5A); their length ranging between 3 and 5 km. The segment puts in contact two different portions of the same carbonates platform succession (Supplementary Figure S1). Nevertheless, it bounds westward several small intramountain basins such as the Piano di Pecore or Melara plains, filled with colluvial deposits. Data acquired along this segment show a dip-slip to slightly normal-left sense of motion (stereoplots 8 to 11, Figures 4, 5A, 6E and Supplementary Data Sheet S1) with an average rake of −88°. Slickenlines measured display a plunge toward N035° along fault planes dipping ∼65° toward N045°. On the Marzano section we measured CoRs with a peak of ∼90 cm (Figures 7E, 7F, 8; Supplementary Data Sheet S1). The 1980-EQ CoRs truncated the roots of the trees that remained suspended on the footwall of the ruptures (Figures 7E–G, 7L). Along the Melara section, we observed CoRs with vertical displacements ranging from 40 to 60 cm (Figures 7G, 8).
The southernmost segment with NW-SW direction is the PSGM. The SGM Gap separates this segment from the Marzano-Cucuzzone segment. It is composed of two sections NE- and NNE-dipping with lengths of ∼2 and ∼4 km respectively (Figure 3; Supplementary Table S2). The fault can be observed outcropping on the western edge of the PSGM basin. The data acquired (stereoplot SS12 in Figure 4) show the strike variation of the two sections and dip-slip kinematics (slightly left-normal) with an average rake of -80° and a plunge of the slickenlines toward N030°. We measured CoRs of ∼60 cm (Figures 7F, 8). Also within the PSGM basin fill, important CoRs formed. Although these are no longer visible in outcrop due to widespread agriculture in the plain, some photographs taken just after the earthquake document their presence (e.g., Galli, 2010).
The E-W striking segment of the IF (Ripa Rossa-Balvano), is arranged in a left en-echelon pattern with respect to the PSGM segment. It is composed of two sections (Ripa Rossa and Balvano) with good exposures of fault planes both along the northern slope of the Ripa Rossa Ridge and along the east side of Balvano village (Figures 6C, 7H, 7L). In these outcrops, the fault cuts the Late Pleistocene-Holocene slope debris (Servizio Geologico d’Italia, 1969). The observed sense of motion is dip-slip along the westernmost fault planes (SS14 and SS15 in Figure 4) and normal-oblique along the easternmost ones (SS16, SS17). This ∼ N-dipping fault extends for ∼10 km along the Campania-Lucania border. The attitude of the kinematic indicators observed on the fault planes shows a slight left-lateral component (average rake of −80°) (Figures 5A, 6C). CoRs with vertical displacement up to ∼90 cm were measured halfway up the slope of the Ripa Rossa Ridge, spreading over the slope deposits locally cemented and ending up on carbonate platform bedrock fault planes (Figures 7I, 7L, 8). We present pictures of the CoRs here observed in the photographic documentation of Supplementary Data Sheet S1. In an antithetic position with respect to the Balvano section, we measured fault planes considered to be part of the minor faults that border the PB and PSGM basins, antithetic to the InIF and described above (SS25 to SS30 in Figure 4). Further minor faults have been mapped in this area (few km lengths). The structural data show normal-to-slightly right-normal sense of motion (Table 2; Supplementary Tables S1, S2; Supplementary Data Sheet S1, S2).

TABLE 2. Seismological and Geological stress tensor parameters showed in Figure 10E for the Irpinia fault systems. σ1, σ2, σ3 = principal stress axes; Φ = stress ratio = (σ2-σ3)/(σ1-σ3); QR = quality ranking: AQRw as in Sperner et al. (2003) and A-QRfm as in Heidbach et al. (2010).
Antithetic Fault Alignment
The AFA is a SW- to SSW-dipping alignment of faults antithetic to IF and InIF. The three segments branch off parallel to the IF for over 60 km (Supplementary Figure S3). The northernmost one (San Felice) extends for ∼10 km and is divided in two ∼5 km-long sections. Its norhern portion affects the Middle Triassic-Early Cretaceous pelagic Lagonegrese Units and partially the Middle Miocene Carbonate Platform units (Supplementary Figure S1). Due to the weakness of the outcropping units, they are poorly detectable in the field and are mainly defined through geophysical and seismological data. The central segment, known as “Conza” (DISS Working Group, 2018) extends for ∼22 km and is composed of three sections. The two northern sections, as the San Felice segment, are buried. The southernmost section (Pescopagano) crops out, and the data show a normal to slightly-right-normal sense of motion, with fault planes S-to-SSW-dipping of ∼55° and slickenlines plunging ∼ N210°.
The Bella segment is a ∼20 km-long normal fault with a ∼N120 strike SW-dipping of ∼60° (SS 33 in Figure 4). This segment is composed of three sections, Bella North, Central and South, ∼9, 5 and 4 km-long respectively. It presents several splays both at its hanging wall and footwall (Supplementary Table S2 and Data Sheet S2). Data in SS31 (Figure 4) refer to the synthetic minor fault at its footwall whereas SS34 to SS40 refer to splays and minor faults within the Bella (central) hanging wall. In this position are located the synthetic Pescopagano and Monticello splays, that overall are ∼18 km-long. They extend in E-W direction from the village of Castelgrande to Monticello and in NW-SE direction from Monticello mount to the locality of Baragiano (Supplementary Figure S3). The change in direction of the structure (NW-SE to E-W) is shown in SS35–38 of Figure 4. The outcrops are characterized by well-preserved planes showing ∼ N190/200°-trending normal slickenlines (Figure 6I,H) with a rake of ∼ −110°. Along the Monticello splay it is possible to observe at the base of the fault planes a white free-face of ∼20 cm (Figure 6I) some tens of meters-long. In the same locality, a rupture in the slope deposits with ∼20 cm offset is visible for some hundred meters (Supplementary Data Sheet S1).
Other Faults
In the northernmost sector we reconstructed a normal fault (i.e., Castelfranci), consisting of four sections of variable length between 3 and 6 km, through photo-geological interpretation, integrated with the analysis of morphostructural elements. Nevertheless, the fault was identified by Westaway (1993) because of a dense NNW-SSE elongate cluster of seismicity developed between the localities of Partenepoli and Nusco, documenting then the northward propagation of the rupture of the 1980-EQ for ∼10 km.
Between the IF and the AFA, close to the village of Muro Lucano, a NE-dipping fault, Mt. Paratiello, crops out (Brozzetti and Salvatore, 2006; Brozzetti, 2011). The recent activity of this fault is suggested by the deformation, within its damage zone, of recent debris, possibly Late Pleistocene–Holocene in age, as suggested by the lack of sensible cementation and by the presence of dark brown paleosol lenses. The fault planes dip ∼065° toward NNE and display slickenlines ∼ N020°-plunging (SS23 and SS24 in Figure 4). Along this fault two generations of slickenlines show respectively transtensional and normal sense of motion. The latter is reasonably associated with Quaternary extension, whereas the former might be related to a previous strike-slip faulting phase which would have occurred during the Late Pliocene–very Early Pleistocene (Brozzetti, 2011 and references therein).
Seismological Data and Analysis
A comparison between the seismicity pattern observed during the 1980-EQ seismic sequence and the recent seismic activity is useful to understand the reliability of early instrumentals data and to better discuss their association with the seismogenic faults. To this aim, we performed a comprehensive review, collected and analyzed seismological data available in the literature from 1980 to 2018.
We have analyzed the aftershock distribution in the time interval from 01/12/1980–15/12/1980 relocated by Amoruso et al. (2011) with a 3D velocity model. The dataset consisted of 629 earthquakes (1.0 ≤ ML≤ 4.0) and represents the most recent revision of the 1980-EQ aftershocks.
The overall aftershock distribution was analyzed by mean Kernel Density Estimation (KDE). The aftershocks show that the epicentral area extended for a length of ∼60 km in the NW-SE direction and its largely confined between the east-dipping IF and the antithetic west-dipping fault zone. Along strike, it is possible to identify four major epicentral clusters, mainly positioned in the center of the graben. The contours define the three seismic gap zones (Nusco, Sele and San Gregorio gaps in Figure 9A) well known in the literature (Westaway and Jackson, 1987; Bernard and Zollo, 1989; Pantosti and Valensise, 1990). It is also noteworthy that part of seismicity can be also associated with the InIF. Northward, the aftershock area reaches the Castelfranci segment, whereas earthquake data are missing in the southern sector. This configuration was conditioned by the seismic station distribution more concentrated to the northern sector as demonstrated by Bernard and Zollo (1989). We do not exclude the occurrence of aftershocks associated with the southern sector of the Irpinia and East-West Irpinia faults.
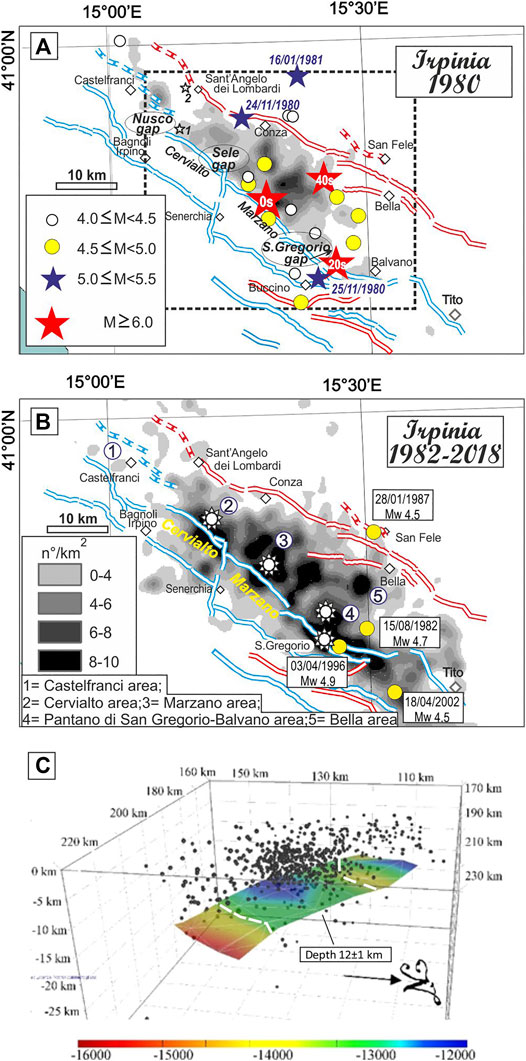
FIGURE 9. Instrumental seismicity of the study area from 1980 to 2018. (A) Seismicity distribution of the Irpinia 1980 seismic sequence (Mw 6.9, Io X MCS) from November 23, 1980 to December 31, 1981. The main events epicentres (red stars) are from Amoruso et al., (2005) and Amoruso et al., 2011, the other significant events are from Montone and Mariucci 2016, Italian CMT (Pondrelli et al., 2006) and some unpublished data. The density contour lines (number of earthquakes per square kilometer) are referred to the aftershocks (1.0 ≤ ML≤4.0) occurred from the first to the 15th December of 1980 and relocated by Amoruso et al., (2011). The two small white stars, 1 and 2, are the epicenters of the Nusco (April 15, 2020, ML 3.3) and Rocca San Felice (July 6, 2020, ML 2.7) recent small events, respectively. (B) Seismicity distribution from 1982 to 2018 obtained compiling the Italian Seismic Catalogue CSI (Castello et al., 2006) and all the events (0.3 ≤ M L ≤ 5.1) listed in the Italian Seismological Instrumental and Parametric database (ISIDe, working group 2016). The white stars represent the seismicity cluster as in reported in Stabile et al., 2012. (C) Base of the seismogenic layer computed for the study area and used for the source model reconstruction, obtained with De Landro et al., 2015 relocated seismicity. The white line represents the reliable curve.
Background Seismicity
This seismicity of the Campania-Lucania area is monitored by the Italian Seismic Network and by a local network (Irpinia Seismic Network, ISNet, Iannaccone et al., 2010). The large amount of available data has allowed refinement of the velocity models and constrain the seismicity distribution and focal mechanisms (De Matteis et al., 2012; Stabile et al., 2012; Amoroso et al., 2014; De Landro et al., 2015; Vassallo et al., 2016; Adinolfi et al., 2019). The area is mainly characterized by low-to-moderate recurrent seismicity (ML ≤ 3.0) at upper crustal depths and defined as background seismicity by De Matteis et al., 2012. The only significant event, after the 1980-EQ, occurred on April 3, 1996 (Mw 5.1) in the southern IF sector. Its instrumental epicentre is within the seismic gap of the two fault segments associated with the 0 and 20 s sub-events (Cocco et al., 1999).
We analyzed the instrumental seismicity, from 1982 to 2018, available from Italian catalogs (Castello et al., 2006, CSI 1.1, 1981–2002; Italian Seismological Instrumental and Parametric database, 2003–2018; Figure 9). We also used the 2005–2011 3D relocated seismicity by De Landro et al. (2015) and the revised seismic bulletin by Chiarabba et al. (2015). The epicentral density contours of seismicity, derived from Italian catalogs (Figure 9B), shows that the 1980-EQ area still displays significant seismic activity along Cervialto (n°2) and Marzano (n°3), with exclusion of the northernmost Castelfranci area (n°1). The density contour also shows that the background seismicity is not only concentrated along the Apennine chain axis, in between the east- and west-dipping seismogenic faults, but enlarged southward along San Gregorio Magno sector (n°4), eastward close to Bella village (n°5), and westward indicating activity also associated to the Inner Irpinia fault. Just recently (April 15, 2020), an ML 3.3 event occurred, 3 km SE of Nusco at a depth of 12 km, apparently activating InIF at depth, with extensional sense of motion (Figure 9A). Furthermore, a small extensional sequence (M 2.7) occurred at Rocca San Felice, from July 4-6, 2020. Earthquake locations from local networks (Festa et al., 2020), show a small high-angle (∼60°) SE-dipping hypocentral volume at depths of 11–12 km, possibly activating the Castefranci fault.
We also computed density contours of the seismic activity for the three datasets, above mentioned, in order to verify the stability and the persistence of the seismicity clusters. The corresponding maps are given in Supplementary Figure S4. The results of spatial clusters of Figure 9B are in agreement with what has been observed, at smaller scale, by Stabile et al. (2012), who showed that earthquakes are prevalently clustered around specific areas, probably asperities of the IF, and the seismicity is typically released in swarm-like seismic sequences (white stars in Figure 9B) (De Matteis et al., 2012; Stabile et al., 2012).
Base of the Seismogenic Layer
In order to study the depth distribution of seismicity, we considered only the best relocated seismic catalogs: the 3D relocated aftershocks by Amoruso et al. (2011), the 3D relocated background seismicity by De Landro et al. (2015), and the relocated events by Chiarabba and Gori (2016) (hereinafter referred to as DD1, DD2, DD3). Starting from these three datasets, we computed a 3D seismogenic layer as part of the 1980-EQ 3D fault model reconstruction following the approach proposed in Ferrarini et al. (2017) and Castaldo et al. (2018) (Figure 9; Supplementary Figure S5). Specifically, the base of seismogenic thickness was computed starting on a regular grid chosen performing preliminary tests to find the optimal grid-space configuration respect to the earthquake distribution. The events, falling into the adjacent parallelepipeds (10 × 10 km of base) centered on the grid nodes, were selected and used to compute the cumulative frequency vs. depth. The evaluation was performed detecting the layer that releases the 90% of events at each node. The 3D reconstruction was carried out by interpolating the results with the Delaunay triangulation method (Okabe et al., 1992). This procedure was independently repeated for DD1, DD2 and DD3. To define the base of the seismogenic layer, we consider reliable the grid nodes containing at least 15 earthquakes (dashed line in Figure 9C). The results and the comparison are showed in Figure 9C and Supplementary Figure S5.
DD1, DD2, and DD3 depict a pattern of seismicity contained in a well-defined volume confined between the east and west-dipping fault alignments. The base computed with the three datasets is well defined at depth of ∼12–13 km with an average maximum vertical error of ∼1 km (Supplementary Figure S5).
Deformation and the Evolving Stress Field
Focal Mechanism Dataset Compilation
To determine the Quaternary and present deformation and stress field in the 1980-EQ area, we used seismological and geological data. We subdivided the available seismological data in two datasets taking into consideration the diverse quality of modern observations with respect to the ones of the eighties (Figures 10A, 10B). The first dataset consists of a compilation of 63 focal solutions (2.5 ≤ M ≤ 6.9) spanning from November 23, 1980 to December 31, 1981. It is composed by focal mechanisms (FM) of the 0 , 20 , and 40 s events (Westaway and Jackson, 1987), the major earthquakes (Mw ≥ 5.0) (Montone and Mariucci, 2016), 10 unpublished focal mechanisms (computed with the first polarities of the teleseismic data, Supplementary Data Sheet S3) and the aftershocks of the seismic sequence relocated by Amoruso et al. (2011). The latter provides the most complete set of solutions that have been derived to date from the data related to the 1980-EQ (Figure 10A). The second data set is composed by 187 (Figure 10B) focal mechanisms of earthquakes occurred from 1982 to 2018 mainly derived from microseismicity 2.0 ≤ ML≤ 4.0 (Frepoli et al., 2011; De Matteis et al., 2012) and from the Italian CMT and TDMT catalogs, 4.0 ≤ Mw ≤ 5.4 (Pondrelli et al., 2006; Scognamiglio et al., 2006).
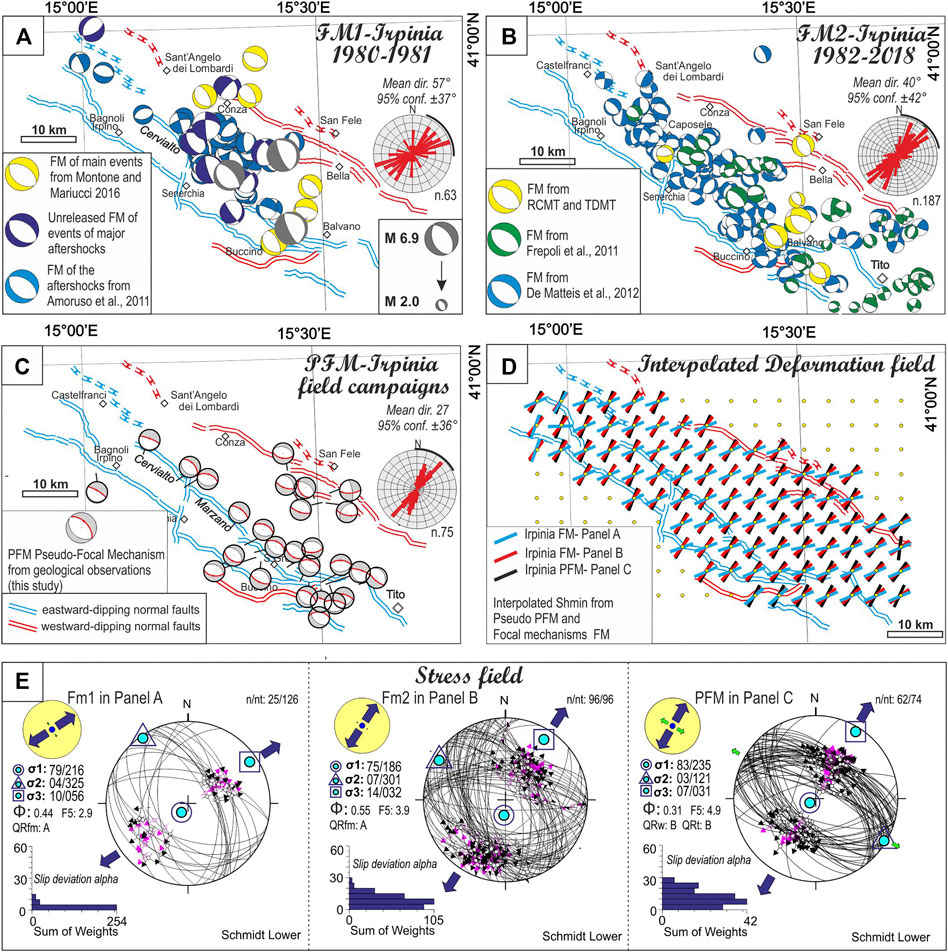
FIGURE 10. Deformation and stress field of the study area. (A) Focal mechanisms distribution of 1980-EQ seismic sequence. The beach-balls of the main event are from Westaway and Jackson (1987), the major aftershocks (Mw > 5.0) from Italian CMT, and the aftershocks from Amoruso et al., 2011. The blue ones refer to Supplementary Data Sheet S3. (B) Focal mechanisms distribution from 1982 to 2018. Focal mechanisms solutions of the more energetic events (Mw ≥ 4.0) are from the Italian CMT and Time Domain Moment Tensor catalog (Scognamiglio et al., 2006), the others are from detailed papers (Frepoli et al., 2011; De Matteis et al., 2012). (C) Pseudo focal mechanisms computed with geological structural data. (D) Deformation pattern from data in Panel A–C opportunely selected for quality. The colored axes represent the results of the interpolated shmin computed following the approach of Carafa and Barba (2013). (E) Stress inversion of the fault plane solutions given in panel A, B and of Pseudo focal mechanisms obtained with geological fault/slip data. The followed inversion procedure as in Delvaux and Sperner (2003). The histograms represent the corresponding misfit angles vs. the number of data points; nt = total number of data; n = number of successfully inverted data; σ1, σ2, σ3 = principal stress axes; φ = stress ratio = (σ2‐σ3)/(σ1‐σ3); the quality ranking factors (QR) and the stress inversion parameters with associated uncertainties are listed in Table 2.
The geological dataset is composed by pseudo-focal mechanisms (PFM) (Figure 10C) computed from fault/slip data of this study (Figures 4, 10C; Supplementary Figure S2 and Table 1). The three datasets show prevalent normal-to-normal-oblique sense of slip with a scattered (∼± 40°) T axes distribution around mean values of 57°, 40°, and 27° respectively (Figure 10). We explored this discrepant T-axis attitude and evaluated the strain and stress field pattern. Whenever possible, we first performed a preliminary quality analyses for FM computed with the polarities. The available focal mechanisms were selected based on the two quality factors (Q) of the FPFIT code, decreasing from A to C, which are the degree of polarity misfit (Qp) and the range of uncertainties of strike, dip and rake (Qf). The selected solutions have quality A–A, A–B, B–A and B–B and a threshold magnitude ML ≥ 2.5. The selected datasets are composed of 63, 96, and 74 focal and pseudo focal mechanisms (Figure 10E, Fm1, Fm2 and PFM).
Strain Field and Stress Inversion
In order to analyze the map variation of the strain field, we computed the minimum horizontal stress (Shmin) from the focal and pseudo focal mechanisms related to the three datasets described above. We built a regular grid comprising the east- and west-dipping active faults and evaluated the variation of Shmin at each node. For the interpolation we followed the approach proposed by Carafa and Barba (2013) to calculate the SHmax that considers the uneven sampling of FM data and the correlation of stress orientation with distance. We observe small differences between the deformation field derived by focal solutions (1982–2018) and the ones obtained from geological data (mean ∼14° ± 5°) (black and red deformation axes in Figure 10D); such differences represent the average Shmin changes from surface to depth, in fact the highest differences between these two datasets are observed for grid nodes positioned in the center of the graben, in between the east- and west-dipping normal fault alignments. On the contrary, large differences (mean ∼38° ± 9°) are obtained comparing the Shmin map distribution from 1980 seismic sequence and the other two datasets in most points of the grid. The deformation field can be considered homogeneous because of large or significant variation of Shmin along the study area are not observed for all datasets.
This difference between the 1980 dataset and recent FM are also evident comparing the stress tensors. In fact, to compute and analyze the seismogenic stress tensor of the study area we independently inverted the three datasets following the procedure proposed in Delvaux and Sperner (2003) and the methodological approach as in Ferrarini et al. (2015). The orientation of the three principal axes of the stress (σ1, σ2, σ3) and the stress ratio Ф = (σ2 - σ3)/(σ1 - σ3) are considered as model parameters.
All theinversions highlight a normal faulting stress regime with a nearly horizontal, NNE–SSW to NE-SW trending σ3-axis (10/056, 10/032, 07/031) and a subvertical σ1-axis attitude (79/216, 75/186, 83/235); the shape factor, equal to 0.44, 0.55, 0.31 respectively, indicates a near triaxial tensor in the case of inversion obtained with FM. The stress orientations solutions fall in the quality rank QRfm = A, QRfm = A and QRw = B as shown in Figure 10E and summarized in Table 2 (quality factor as in Sperner et al. (2003) and Heidbach et al. (2010)). We can observe that the inversion of the 1980-EQ seismological dataset (63 focal mechanisms, nt = 126 nodal planes) shows a 056 trending σ3-axis rotated of ∼30° respect to the ones obtained with the other two datasets that show a coaxial attitude (032 and 031). It is worth noting that, notwithstanding the resulting stress tensor is of A-quality, a large percentage of total data was rejected. This is due to the high heterogeneity of the resulting senses of motion retrieved by the aftershock focal mechanisms as highlighted in Deschamps and King (1984), Westaway and Jackson (1987), and by Pasquale et al. (2009). In contrast, the results of second and third formal inversion show that most of the data are consistent with the computed stress tensor being 100% and 84% considered in the inversion (n/nt, Figure 10E).
Fault Model Building
Depth Geometry and 1980-EQ/fault Association Along the CROP-04 Seismic Profile
The epicentral area of the 1980-EQ is cross-cut by the CROP-04 near-vertical seismic line (Cippitelli, 2007; Patacca and Scandone, 2007; Scrocca et al., 2007) that runs SW-NE perpendicular to the average axial extensional trend (Figure 11).
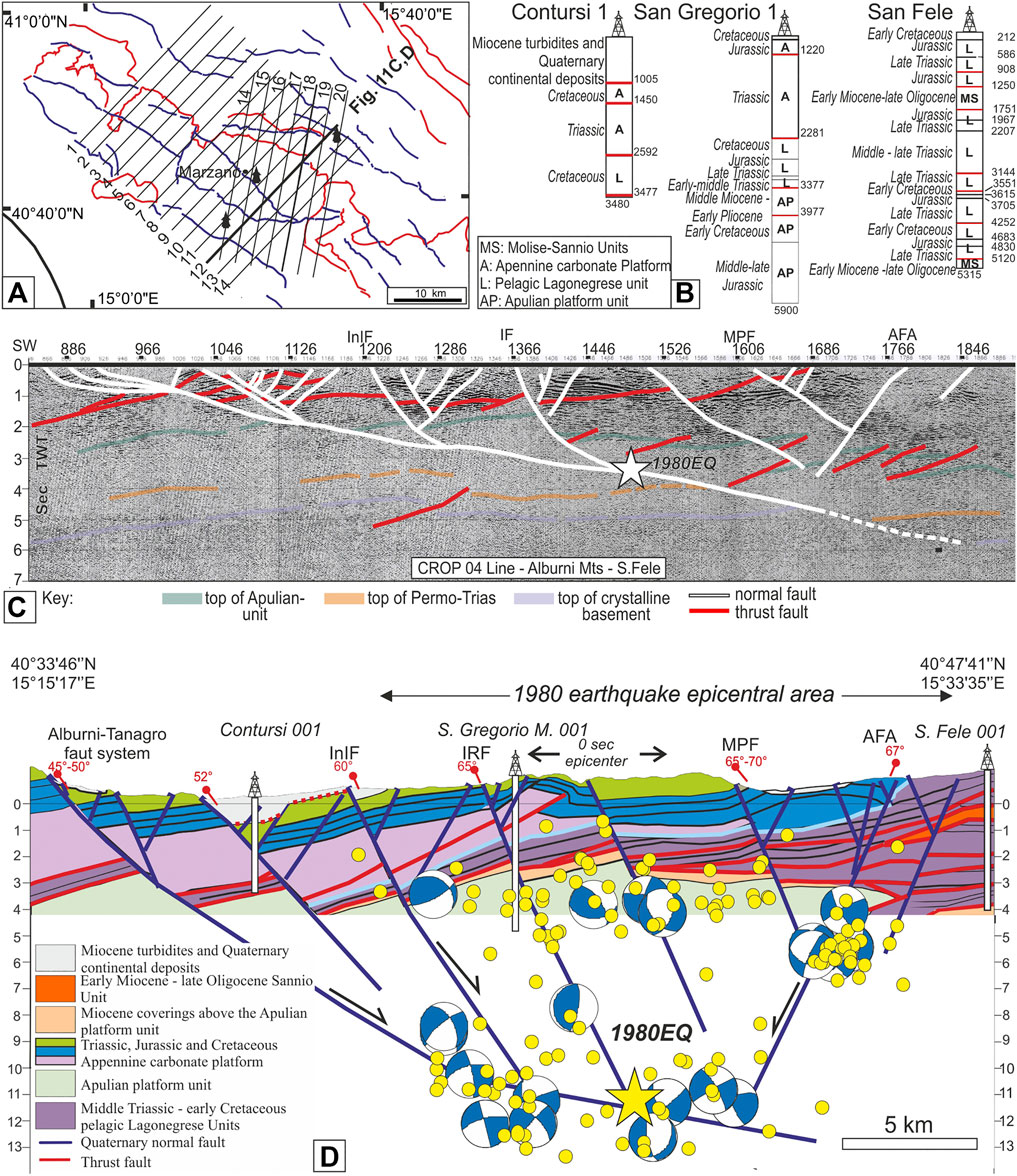
FIGURE 11. Depth interpretation of the outcropping 1980-EQ faut pattern along the trace of the CROP-04 near vertical seismic profile. (A) Location map with the trace of the CROP-04 line; the serial transects used to build the 3D faut model of Figure 12 are reported. (B) Contursi, San Gregorio Magno 001 and San Fele wells stratigraphy. (C) Interpretation of the CROP-04 profile, along the Tanagro–S. Fele transect (from Brozzetti, 2011). (D) Geological cross-section along the CROP-04 line, oil wells, seismicity (yellow circle from De Landro et al., 2015) and focal mechanisms from De Matteis et al., 2012 (semi-width 5 km).
To define the downdip geometry of the CLFS involved in the 1980-EQ, we updated the Brozzetti’s (2011) interpretation of the central part of the profile by integrating it with our geological data along the trace of the Alburni–San Fele transect (Figure 11A). Beneath the 1980-EQ epicentral area, we have an upper crust sedimentary pile of ∼10 km. Such a pile lies above a thin low-velocity clastic layer (e.g., sedimentary basement) transitional to the underlying metamorphic basement (Improta et al., 2000; Patacca and Scandone, 2007; Steckler et al., 2008; Di Luzio et al., 2009; Brozzetti, 2011; Ascione et al., 2013).
The two main faults involved in the 1980-EQ (IF and AFA) are recognized in the sections of Figures 11C, 11D. They belong to a broader extensional system, which from west to east, consists of four well distinct east-dipping faults (Alburni-Tanagro (ATf), the Picentini, InIF and IF) with dips ranging from 45° to 65°. The ATf represents the break-away fault of the overall system, which develops above the east-deepening detachment layer. The ATf reflector can be recognized at 2.5s-depths (5–6 km) below the PB basin at the hanging wall of the IF and in some continuous packages of low-angle east-dipping reflectors detectable below San Gregorio Magno and Muro Lucano (at depth of 3–4 s) and between the Muro Lucano basin and San Fele (at depth of 4–5.5 s). There is evidence of a regional low-angle reflector, which dips undisturbed eastward and is not displaced by other high-angle normal faults.
Along the seismic profile, there is evidence of the Marzano-Carpineta fault. This implies that such a fault has cumulated enough vertical slip to be clearly resolved by seismic reflection profile.
To assess the spatial association at depth between the major 1980-EQ sub-event and its seismogenic fault (Marzano fault), we projected, along the CROP-04 section in Figure 11C, the epicentre of sub-event 1 with its range of variability (Figure 2A). We assumed for the Marzano fault, an average planar geometry with an average dip of 60° which fit both surface data (65°) and focal mechanisms solutions (50°–70°) (Supplementary Table S4).
Such a geometry is also supported by well data. At a depth of ∼3 km, the Marzano-Carpineta segment (IF) is drilled by the San Gregorio Magno 1 well (Patacca and Scandone, 2007) (Figures 11B, 11C). The fault is revealed by the sharp contact between the Scisti Silicei formation and the Monte Facito formation with elision of the Calcari con Selce formation. The well projection on the CROP-04 trace (Figure 11C) falls at a horizontal distance of ∼1200 m from the IF trace. When corrected with topography, this fit with a planar dip of ∼65° for the upper portion of IF.
The hypocentre of sub-event 1 intercepts the IF close to the intersection with the basal detachment at a depth corresponding to ∼3.7 s. Assuming the overall sedimentary pile has an average velocity of 5.5 km/s, the Marzano-Carpineta segment of IF is encountered at a depth of ∼11 km. The depth may vary from 10 to 12 km when assuming slightly different an average dip angles (±10°) and/or average velocities (5.5–6 km/s). The major reflectors drawn within the seismic line (Figure 11C) and the hypocenter seems to lie at the bottom of the Apulia platform carbonates, possibly within the Triassic Anhydrite layer (Figure 11C).
The here reconstructed hypocentral depth is not different from others proposed in the literature based on geological and geophysical data (∼8 km by Ascione et al., 2013, ∼9 km by Brozzetti (2011), ∼10 km by Improta et al. (2010). It is also consistent with the depth of 10–12 km calculated from seismological data by Westaway and Jackson (1987); Westaway (1993) and with ground effects described by Porfido et al., 2002 for large earthquakes in this portion of the southern Apennines. Conversely, it is much shallower than the hypocentral depth of 16–18 km given by Del Pezzo et al. (1983), Gasparini et al. (1985), and Amoruso et al. (2011).
To compare the reconstructed fault geometry with the depth distribution of the background seismicity in Figure 11C, we have projected along the trace of the section, a selection of good quality hypocentral locations and focal mechanisms (de Matteis et al., 2012; De Landro et al., 2015), assuming a semi-width of 5 km. A rather good geometric fit may be observed between the distribution of seismic events and the fault geometries independently reconstructed. The focal mechanisms preferentially focus on IF and on the underlying detachment and highlight the involvement of the InIF and the antithetic west-dipping system.
Geometric Fault Model
In order to build a 3D representation of the active fault segments involved in the 1980-EQ, we integrate available geological and seismological data, at the light of the structural style interpreted along the trace of the CROP-04 profile. We follow the methodological approach classically adopted by the Community Fault Model of Southern California (Nicholson et al., 2014; Nicholson et al., 2015; Plesch et al., 2014) and already applied to some other Italian cases (Lavecchia et al., 2017; Castaldo et al., 2018).
We paid particular attention to the role of the uncertainties and subjectivity in depicting the active fault segments and the fault-earthquake association. In order to properly address this issue we considered OQR and FQR (Bello et al., 2021) and the seismological formal errors derived from our analyses (Seismological Data and Analysis; Supplementary Figure S5; Supplementary Tables S1, S2). Specifically, the two quality factors used to constrain the faults at the surface together with the high-sampling step (as recently suggested by Sgambato et al., 2020) helped reducing the subjectivity in the interpretation (e.g., Bond et al., 2007; Bond et al., 2011; Hester, 2012; Salisbury et al., 2015). With our approach it is possible to discern and further select the objective and subjective parts of our final model.
The reconstruction was performed using the Move suite software (by PetEx Ltd., version 2019.1) and is articulated in three steps:
(1) Fault traces extrusion to shallow depths (ribbons in Figure 12A).
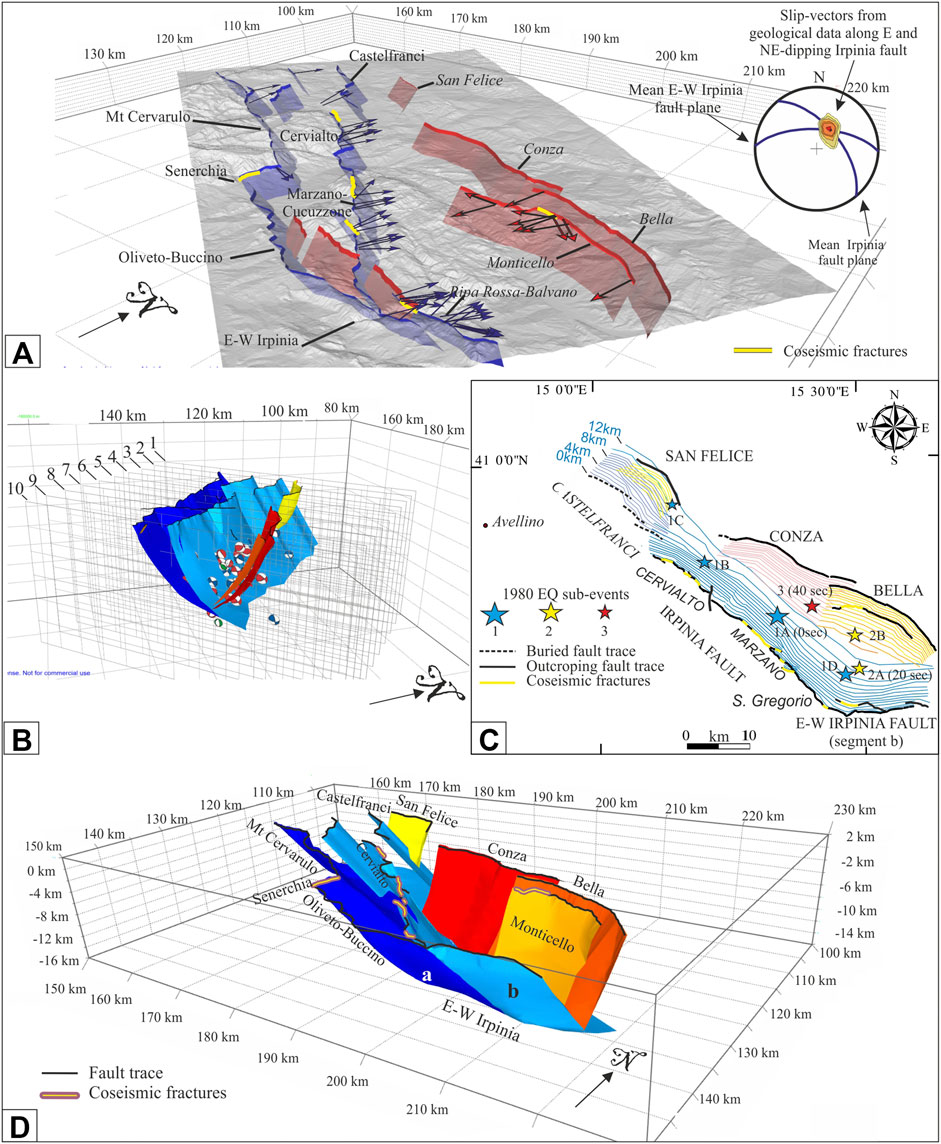
FIGURE 12. 3D model building and seismotectonic interpretation of 1980-EQ. (A) Fault “Ribbons” i.e., extrapolation in depth for 3 km of the fault traces with the dip-angle acquired during the field work (Figure 3A; Supplementary Data Sheet S2; Supplementary Tables S1, S2); the fault slip vectors are also reported as blue and red arrows projected on the surface. The model is represented on a 10 m DEM; the coseismic ruptures (yellow lines) are from this paper and from Pantosti and Valensise (1990). (B) Serial hypocentral and focal mechanisms cross-sections used to build the 3D surface along the ribbon down dip extrapolation (data from De Landro, et al. (2015) and De Matteis et al. (2012)). (C) Depth contour lines of the reconstructed fault surfaces with location of the epicenters of the sub-events and episodes of 1980-EQ. (D) 3D fault model of the Inner Irpinia Fault and Irpinia Fault (e.g., Cervialto, Marzano and San Gregorio) with their common southern E-W segment plus the Antithetic Fault Alignment.
The detailed Quaternary fault traces (Figure 3; Supplementary Figure S3), specifically the Inner Irpinia (InIF), Irpinia Faults (IF) and the Antithetic Fault Alignment (AFA), together with the Monticello Splay and the minor faults antithetic to InIF, are extruded along dip to a common depth of 3 km beneath sea level, with different degrees of approximation. In most cases, the depth extrapolation is constrained with dip-angle data (Supplementary Table S2); whereas, if the latter are not available, it is extruded from the surface trace at a fixed dip (60°). Up-dip, the fault ribbons are bounded by topographic digital elevation model data (10 m-resolution); laterally, they may slightly overlap or terminate into another. Horizontal shear stress direction derived from fault-slip data (Figures 4, 5; Supplementary Table S1) and associated to the various ribbons are projected in Figure 12A.
(2) Construction of interpretative section-view fault traces along serial hypocentral transects.
14 transects are built in direction N45° and ten in direction N10° (Figure 11A). Along each transect we projected all the intersected ribbon and available good-quality earthquake data assuming a semi-width of 1.25 km (de Matteis et al., 2012; Stabile et al., 2012; De Landro et al., 2015). The fault traces are drawn by connecting each ribbon with hypocentral distributions and preferential fault planes from focal mechanisms, down to the base of the seismogenic layer (as in Figure 12B). The fault geometry reconstructed along the CROP-04 profile (Figure 11) which, corresponding to transect number 12, was adopted as reference structural style for the neighboring transects.
(3) 3D Delaunay triangulation-based interpolation of data from steps 1-2.
Based on the obtained geometric accuracy, we assign to each fault representation a quality factor, adopting five quality ranking factors (R) as in Castaldo et al. (2018). At shallow depth (<3 km), the reconstructed surfaces are well-constrained and highly detailed based on the data acquired in this paper (Supplementary Tables S1, S2). The interpretation at depth is more schematic and partially suffers of the inconsistency between the velocity model from the seismic line (e.g., CROP) and from earthquake data. In fact, the latter appear to be systematically deeper with a vertical difference in the order of 2 km between the two. Nevertheless, in our opinion, the position and mutual relations among the various faults appears rather constrained (R2 to R3).
The final 3D-model is represented in Figure 12, in both 3D and 2D view. It consists of the major fault segments involved in the 1980-EQ, that are the east-dipping Irpinia Fault and its Antithetic Fault Alignment, together with the synthetic Ripa Rossa-Balvano Splay and the Monticello splay.
Results and Discussion
Structural Style and Timing of the Extensional Fault System
The structural analysis performed in the 1980-EQ epicentral area (Figures 4, 5; Table 1; Supplementary Table S1; Data Sheet S1), together with the building of a new fault map (Figure 3; Supplementary Figure S3; Supplementary Table S2; Supplementary Data Sheet S2) and local focus on coseismic evidence (Figures 7, 8), pointed out the presence of a more complex Quaternary extensional system than previously known. Both the IF and the InIF trend NW-SE in their northern and central segments and are characterized by a sharp bend to E-W along their southernmost segment (Buccino-Romagnano section along the InIF and Mt. Ruga section along the IF, Supplementary Figure S3). The E-W bend is not a subordinate feature, having an overall extent of ∼15 km, also including the NNE-dipping Ripa Rossa-Balvano hanging wall synthetic splay. Such a splay, here recognized for an overall length of ∼13 km, shows evidence of coseismic deformation, with a vertical displacement up to 1 m in the Ripa Rossa locality. As well, the Monticello SSW-dipping antithetic splay also shows evidence of coseismic displacement with a preserved vertical separation of 10–20 cm.
Locally the IF and the InIF show other minor bends in the E-W direction, possibly reactivating pre-existing strike-slip discontinuities, but such bends do not substantially modify the geometry and trend of the overall fault system. A more evident N-S transfer zone, as well possibly corresponding to a pre-existing discontinuity of the compressional phase, has been recognized between the villages of Senerchia and Calabritto. It propagates across both the IF and the InIF, subdividing them into a northern and a southern NW-SE segments. Evidence of coseismic displacement associated to the 1980-EQ are evident along the Senerchia section (Figure 3). The Calabritto section bounds to the south the NW-SE-striking Marzano-Cucuzzone segment and delimits northward the Sele gap. Such a structural complexity may have controlled the deformation partitioning during the 1980-EQ.
The main IF fault segments (Cervialto, Marzano-Cucuzzone, San Gregorio) were already well known in the literature, nevertheless the presence of the southern bend and, in general, the role of the InIF was underestimated. The along strike extent of the faults mapped in this work is sensibly greater than what was considered in previous work, with evident implications for seismic hazard. If we compare the IF with the corresponding segment in the DISS database (DISS Working Group, 2018), we measure a length of ∼50/55 km in the first case and of ∼40 km in the second. Furthermore, the InIF is partially present in a few papers for its northern segment (i.e., Volturara Fault; Papanikolaou and Roberts, 2007; Faure Walker et al., 2012; Sgambato et al., 2020) but entirely absent from the DISS database.
An important role in the understanding of this system is also played by the minor structures mapped throughout the area (Supplementary Table S2). In particular, the alignment of minor faults in the PB and PSGM (Figure 3) can be interpreted as a system initially antithetic to the InIF and subsequently cut and partially reactivated by the IF in the gradual eastward migration of the normal faulting. As for InIF and IF, these faults substantial bend from NW-SE-direction in the northern portions to ∼ E-W in the south. A Quaternary age of the extensional faults involved in the 1980-EQ, is also supported by the San Gregorio Magno well which shows a stratigraphic gap of some hundreds of meters, when drilling the IF (Figure 11), as well as by the clear evidence of extensional displacement of some of the stratigraphic records across the CROP-04 seismic line (Figure 11). The IF shear zone appears well visible as well as its low-angle basal detachment. Such a good resolution, together with the significant offset, implies a longer record of deformation.
A kinematic novelty in the interpretation of the fault system comes from the observation that whereas the prevailing dip-direction of the various fault segments and sections may variate from NNW to NE (Figures 4, 5A), all planes show a prevailing and common NNE trending slip vector. Such a common shear direction evidently represents a kinematic compatibility of the overall system, which may have therefore moved at the same time instantaneously along differently oriented segments. In particular, the E-W striking segments suggest a slight right-lateral component, which makes the movements on this structure to remain consistent with the kinematics of the entire system and avoiding that the breakdown propagation would stop in the area of direction change during the 1980 coseismic faulting (Figures 5A, 6C, 10D).
The age of the onset of the extensional tectonics in the southern Apennines and, specifically, in the Irpinia area is controversial in the literature. Some authors (e.g., Cinque et al., 1993) based on regional morphotectonic evidence of a regional uplift, consider the beginning of the extensional activity only since Middle-Pleistocene times (last 700 kyr). As well, a beginning of the fault activity in the Middle-Pleistocene is suggested by radiometric age of the PSGM basin basal layers of the syn-tectonic deposits in Ascione et al., 2013. Another position is taken by Pierdominici et al. (2011), envisaging a fully linked fault zone, organized in interacting segments, for more than 50 km.
The high degree of fault interaction and multi-scale linkage evident in our maps (Figure 3; Supplementary Figure S3) better support this latter interpretation. Furthermore, the age of the syn-tectonic extensional basin deposits along the trace of the CROP-04 section, from the Alburni ridge to the west to the Muro Lucano area to the east, indicate an onset of the extension at least since the beginning of Quaternary (last 2.5 Myr) or even Late Pliocene times.
Surface-Depth Connection and Stress Field
According to our interpretation the IF, the InIF and the AFA are part of a more complex asymmetric system of eastward-dipping listric faults that detach on an eastward-dipping extensional basal detachment (Figure 11). This configuration does not exclude that even the W-dipping structures play a crucial role in the deformation of the area.
Such a prevailing top-to-east sense of shear interpretation differs from others in the literature, which either do not represent the normal faults at all (Patacca et al., 2000; Patacca and Scandone, 2007) or represent them schematically as high-angle west-dipping normal faults, dissecting the compressional ones and/or locally reactivating them (Scrocca et al., 2007; Improta et al., 2014), or still assumes that all major normal faults dip to the west and detach along a regional westward-dipping thrust (Cippitelli, 2007).
Previous authors pointed out a mismatch in the attitude of the Quaternary faults outcropping in the 1980-EQ epicentral area (typically WNW-ESE in their reconstruction) and of the underlying deep faults as unraveled by focal mechanism analysis (Ascione et al., 2013). The decoupling could be related to the presence of the clay-rich melange zone interposed at a depth of 4–6 km between the foreland Apulia platform carbonates and the overlying eastward-verging allochthonous units (Amoroso et al., 2017).
The hypothesis of a decoupling may be definitively excluded from our data in this paper, for three main reasons:
(1) Prevailing structural trends all over the area are NW-SE oriented with local N-S and E-W deflections, both at shallow and seismogenic depths (Figures 3, 12; Supplementary Table S2).
(2) The CROP-04 profile shows deeply rooted Quaternary normal faults dissecting pre-existing compressional structures and connecting surface and depth levels, as already accepted in most of the literature (Scrocca et al., 2005; Cippitelli, 2007; Brozzetti, 2011; Pierdominici et al., 2011).
(3) The stress field inverted from both the Campania-Lucania outcropping faults and from the background seismicity (1982–2018. Mw 2.0–5.1), are strictly coaxial and all coherent with a SSW-NNE oriented least principal stress (Figure 10). A corresponding minimum principal stress axis (N20° ± 4°) is also indicated by stress in situ data along the San Gregorio well (Pierdominici et al., 2011).
The discrepancy shown by the stress parameters computed for the 1980-EQ, which indicate an average SW-NE σ3 axis (Figure 10), may be reasonably attributed to the relatively low quality of the available aftershock focal mechanisms. In effect, often in the literature, the upper crust regional stress trend in the southern Apennines is given as Shmin in direction N44° ± 20° (Pierdominici et al., 2011).
Given that the geological and seismological data we present here cover a large area (∼2400 km2), we wonder if an homogeneous NNE Shmin axis indicated since Quaternary times, represents a local or a regional stress deviation, in any case over time. Certainly, within the boundary of the study area, it does nor represent a local variation due to differently oriented active faults, neither represents a multi-stage deformation pattern. At the moment, we do not have detailed data to evaluate its configuration. It is evident that the implication in assuming a Shmin ∼ N30°E may imply significant variation for any stress analysis across the 1980-EQ involved area.
1980-EQ Sub-events/Fault Association
The analysis performed in this paper allow us to contribute to the discussion on the fault sources of the 1980-EQ sub-events, constraining and parameterizing the hypocentral location of sub-event 1 and proposing a new lecture key for sub-event 2.
Regarding the hypocentral structural location of the sub-event 1, Improta et al. (2010) and Ascione et al. (2013) localize it within the crystalline basement of the Apulia carbonate platform, at a depth of 10–11 km, beneath the low velocity basal clastic, within a CO2 pressurized reservoir.
In our reconstruction, the 0 s hypocentre is located at a depth of 11 ± 1 km, at the intersection between the high-angle IF and the east-dipping basal detachment. It lies within the Triassic Anhydrite layer at the bottom of an eastward overthrusted slice of the Apulia platform (Figure 11). The Anidriti di Burano fm, consisting of alternance of evaporite and dolostone layers, is especially capable of triggering earthquakes (De Paola et al., 2008; Trippetta et al., 2010; Porreca et al., 2018), due to the tendency of localize the deformation along thin anhydrite and dolomites shear zones, in such way promoting a transition from velocity strengthening to velocity weakening behavior (Scuderi et al., 2013).
At the light of our data, we consider suitable two alternative solutions as the most likely fault source for sub-event 2:
(1) The western border fault of PSGM, NE-dipping in the northern sector and NNE in the southern one, for a total along-strike length of ∼6 km, an average dip-angle of 65°, a width of 12 km, a coseismic displacement of 60 cm. The fault trace is not linear, but it shows an along strike bent. The intersection line between the two differently striking fault sections plunges 60° NNE-ward and would represent the slip vector of sub-event 2 (Figure 12). As matter of fact, this solution has been proposed by Pantosti and Valensise (1993).
(2) The NNE-dipping Ripa Rossa-Balvano segment of the Irpinia E-W, with a total along-strike length of ∼13 km, an average dip-angle of 60°, a coseismic displacement of 90/100 cm along the Ripa Rossa slope (Figures 7, 8 and Supplementary Data Sheet S1). In such a case, the PSGM fault would have been reactivated by the last episode (14 s) of sub-event 1 (Westaway, 1993). We advance the hypothesis that sub-event 2 may have also activated the SSW-dipping Monticello splay, in front of Ripa-Rossa Balvano, which also shows evidence of coseismic rupture with vertical displacement up to 20 cm. As a matter of fact, our Monticello source geographically corresponds with the SW-dipping 20 s source modeled by Amoruso et al. (2005) and Amoruso et al., 2011 (Figure 2D). Also considering that equally convincing seismologic and geodetic modeling by the same authors (Amoruso et al., 2005; Amoruso et al., 2011) point to a NE-dipping source for sub-event 2 (Figure 2), we advance the hypothesis that effectively the sub-event 2, such as sub-event 1, was more complex and characterized by initial displacement on a NE-dipping structure (either San Gregorio or Ripa-Rossa Balvano segments) which might have triggered further displacement on its antithetic structure.
In summary, in our interpretation, the CLFS involved in the 1980-EQ consists of high-angle E-dipping normal fault detaching at depths of ∼11 km along a low-angle detachment synthetic and of SW to SSW-dipping antithetic structures. The here built 3D model highlights a NW-SE graben-like structure with a significant E-W bent in the southern portion. Following Westaway (1993), we consider that the first sub-event almost entirely activated the NE-dipping border fault of the graben, with shearing moving with time from the Marzano-Cucuzzone segment northward toward the Castelfranci fault and, soon after, southward toward the PSGM fault. The second event was controlled by the southern E-W bend, with activation of a significant E-dipping segment and of its near parallel antithetic Monticello splay. With the third sub-event the deformation was triggered further north on the antithetic SW-dipping Conza fault. In such interpretation the eastward-deepening basal detachment, also characterized by the southern E-W bend, plays a significant geometric-kinematic role in controlling the enucleation of its hanging wall structures, but it has not been activated by energetic earthquake release.
Conclusions
A full synthesis of multi-source data in a 3D frame allows for a better geometric-kinematic reconstruction of the 1980-EQ and associated fault system. The newly acquired structural-geologic data and their geometric and kinematic elaborations, together with a synthesis of seismological data, are here provided, for future applications (Supplementary Figure S3; Tables S1–S3; Data Sheet S1, S2).
The main results are summarized as follows:
(1) The NW-SE striking CLFS is characterized in its southern portion by a sharp E-W bend, which has controlled the nucleation of the second 1980-EQ sub-event. This particular arrangement, which also characterizes the InIF, might also control the stress transfer in the area with eastward migration of the seismogenic extensional front toward the Val d’Agri basin, rather than along strike in correspondence of the Vallo di Diano basin, in the past activated by one of the two sub-events of the 1857 earthquake (Mw 7.1, Io XI MCS). In other words, the E-W Irpinia segment may represent the existence of an Earthquake Gate (EGA, sensu Oskin et al., 2015), exerting a control on the southward IF propagation. Possibly, during the 1980-EQ such a gate was closed. The 20 s event, after a first rupture episode on the NNE-dipping IF segment, turned northward activating the antithetic SSW-dipping Monticello splay. After that, the deformation continued northward activating the SW-dipping partially blind Conza structure.
(2) The E-W fault bend, north-dipping along IF and S-dipping along AFA, runs parallel to the E-W S-dipping lateral ramp of the Early/Late Pliocene Ofanto thrust front (Supplementary Figure S1). Both structures represent a deviation from the classic NW-SE extensional and compressional trends. We advance the hypothesis that the E-W striking N-dipping segments of the IF and the InIF, although not reactivating any pre-existing thrust structure, are controlled in their structural trends by the pre-existing compressional Ofanto structures. Otherwise, both might be controlled by pre-existing E-W crust-scale discontinuities. As a matter of fact, heat flow data and shear waves pattern highlight such a configuration (Vassallo et al., 2016).
(3) The extensional deformation is associated with a NNE-SSW directed least principal stress, with a crust-scale deviation from the classic SW-NE tensional direction across the Apennines of Italy. All stress analyses to be performed in the area must take into consideration such a result.
(4) A potentially seismogenic structure, of the same geometric significance of the Irpinia Fault, is identified in the Inner Irpinia Fault. Such a structure with a total along-strike extent of ∼55 km is not highlighted in the DISS database but brighten by background seismicity and subordinately activated during the 1980-EQ. It should be considered in the elaboration of seismic hazard scenarios.
(5) The 1980-EQ has involved in the sub-event 1 rupture process also the independent Castelfranci fault segment, located north-eastward of the Irpinia main fault (Figure 12C). Such a structure has remained substantially silent during the last forty years (Figure 9), but just very recently it has been activated by the small normal fault E-dipping San Felice sequence (Festa et al., 2020). In our reconstruction, it does not represent the northern termination of the IF, but rather the southern tip of an independent potentially seismogenic structure which might be capable of releasing strong earthquakes.
The partitioning of the 1980-EQ in three distinct sub-events within the time lapse of 40 s reminds us of the partitioning in three events of the CISS-2016, occurred in a time lapse of nearly two months (24 August, 26 October and 30 October). In both cases, a cumulate magnitude equal to about ∼Mw 6.9, activated a complex interconnected pattern of fault segments at depth connected and detaching along a regional east-deepening master fault.
Data Availability Statement
The original contributions presented in the study are included in the article/Supplementary Material, further inquiries can be directed to the corresponding authors.
Ethics Statement
Written informed consent was obtained from the individual(s) for the publication of any potentially identifiable images or data included in this article.
Author Contributions
SB worked in field and collected the structural data. FB and DC contributed to the fieldwork and in geological discussion. SB, FF, and GL processed and analyzed the geological data. RdN and GL took care of the methodological approach. RdN led the review, analyses and processing of the seismological data. RS and BdL provided support in analyzing and interpreting seismological data. DC, SB, and GL realized the 3D model with the Move suite software. SB, RdN, and GL wrote the manuscript and prepared maps, graphs, and tables. RdN, GL, FB, RS, and RA supervised the work and involved in the review and editing of the manuscript. All authors contributed to the article and approved the submitted version.
Funding
This research was supported by DiSPUTer Department funds (Resp. Rita de Nardis), by PRIN 2017 (2017KT2MKE) funds from the Italian Ministry of Education, University and Research (P.I. Giusy Lavecchia), and by funds from the School of Advanced Studies G. d'Annunzio at University of Chieti‐Pescara (Italy) to the “Earthquake and Environmental Hazards” Ph.D. Course.
Conflict of Interest
The authors declare that the research was conducted in the absence of any commercial or financial relationships that could be construed as a potential conflict of interest.
Acknowledgments
We acknowledge Grazia De Landro for providing the high-precision seismological data and Luigi Ferranti for the fruitful discussion. We acknowledge PetEx that provided the Move 2019.1 suite software license. We also thank the editor and the two reviewers for costructive comments.
Supplementary Material
The Supplementary Material for this article can be found online at: https://www.frontiersin.org/articles/10.3389/feart.2020.608063/full#supplementary-material.
References
Abate, D., De Pippo, T., Massaro, E., and Pennetta, M. (1998). Evoluzione morfologica tardo‐quaternaria della valle caudina (benevento, Italia). Quaternario 11 (2), 255–264.
Adinolfi, G. M., De Matteis, R., Orefice, A., Festa, G., Zollo, A., de Nardis, R., et al. (2015). The September 27, 2012, ML 4.1, Benevento earthquake: a case of strike-slip faulting in Southern Apennines (Italy). Tectonophysics 600, 35–46.
Allmendinger, R., Cardozo, N., and Fisher, D. (2012). Structural geology algorithms: vectors and tensors. Cambridge: Cambridge University Press.
Amato, A., and Selvaggi, G. (1993). Aftershock location and P-velocity structure in the epicentral region of the 1980 Irpinia earthquake. Ann. Geofisc 36, 3–15
Amicucci, L., Barchi, M. R., Montone, P., and Rubiliani, N. (2008). The vallo di diano and auletta extensional basins in the southern apennines (Italy): a simple model for a complex setting. Terra. Nova 20, 475–482. doi:10.1111/j.1365-3121.2008.00841.x
Amoroso, O., Ascione, A., Mazzoli, S., Virieux, J., and Zollo, A. (2014). Seismic imaging of a fluid storage in the actively extending apennine mountain belt, southern italy. Geophys. Res. Lett 41, 3802–4380. doi:10.1002/2014GL060070
Amoroso, O., Russo, G., De Landro, G., Zollo, A., Garambois, S., Mazzoli, S., et al. (2017). From velocity and attenuation tomography to rock physical modeling: inferences on fluid‐driven earthquake processes at the irpinia fault system in southern italy. Geophys. Res. Lett 44, 6752–6760. doi:10.1002/2016GL072346
Amoruso, A., Crescentini, L., and Scarpa, R. (2005). Faulting geometry for the complex 1980 campania-lucania earthquake from levelling data. Geophys. J. Int 162, 156–168. doi:10.1111/j.1365-246X.2005.02652.x
Amoruso, A., Crescentini, L., Di Lieto, B., and Scarpa, R. (2011). Faulting mechanism of the campania–lucania 1980 earthquake, Italy, from high-resolution, 3D velocity structure, aftershock relocation, fault-plane solutions, and post-seismic deformation modeling. Ann. Geophys 54, 806–821. doi:10.4401/ag-4984
Angelier, J., and Mechler, P. (1977). Sur une méthode graphique de recherche des contraintes principales également utilisable en tectonique et en séismologie: La méthode des diédres droits. Bulletin de la Société géologique de France 19, 1309–1318. doi:10.2113/gssgfbull.S7-XIX.6.1309
Ascione, A., Cinque, A., Improta, L., and Villani, F. (2003). Late quaternary faulting within the southern apennines seismic belt: new data from Mt. Marzano area (southern Italy). Quat. Int 101–102, 27–41. doi:10.1016/S1040-6182(02)00127-1
Ascione, A., Mazzoli, S., Petrosino, P., and Valente, E. (2013). A decoupled kinematic model for active normal faults: insights from the 1980, MS = 6.9 Irpinia earthquake, southern italy. GSA Bull 125, 1239–1259. doi:10.1130/B30814.1
Barchi, M., Amato, A., Cippitelli, G., Merlini, S., and Montone, P. (2007). Extensional tectonics and seismicity in the axial zone of the southern apennines. Boll. Soc. Geol. It (Ital.J.Geosci.) 7, 47–56.
Basili, R., Valensise, G., Vannoli, P., Burrato, P., Fracassi, U., Mariano, S., et al. (2008). The database of individual seismogenic sources (DISS), version 3: summarizing 20 years of research on italy’s earthquake geology. Tectonophysics 453, 20–43. doi:10.1016/j.tecto.2007.04.014
Bello, S., Scott, C. P., Ferrarini, F., Brozzetti, F., Scott, T., Cirillo, D., et al. (2021). High-resolution surface faulting from the 1983 Idaho Lost River Fault Mw 6.9 earthquake and previous events. Sci. Data.
Bernard, P., and Zollo, A. (1989). The irpinia (Italy) 1980 earthquake: detailed analysis of a complex normal faulting. J. Geophys. Res 94, 1631–1647. doi:10.1029/jb094ib02p01631
Biasi, G. P., and Wesnousky, S. G. (2015). Steps and gaps in ground ruptures: empirical bounds on rupture propagation. Bull. Seismol. Soc. Am 106 (3), 1110–1124. doi:10.1785/0120150175
Blumetti, A. M., Esposito, E., Ferreli, L., Michetti, A. M., Porfido, S., Serva, L., et al. (2002). New data and the reinterpretation of the november 23, 1980, M 6.9, irpinia-lucania earthquake (Southern Apennine) coseismic surface effects. Spec. Issue Studi Geologici Camerti 2, 19–27.
Bollettinari, G., and Panizza, M. (1981). Una “faglia di superficie” presso San gregorio magno in occasione del sisma del 23/11/1980 in irpinia. Rend. Soc. Geol. Ital 4, 135–136.
Boncio, P., Brozzetti, F., and Lavecchia, G. (2000). Architecture and seismotectonics of a regional low-angle normal fault zone in central ltaly. Tectonics 19, 1038–1055. doi:10.1029/2000tc900023
Boncio, P., Lavecchia, G., and Pace, B. (2004). Defining a model of 3D seismogenic sources for seismic hazard assessment applications: the case of central apennines (Italy). J. Seismol 8, 407–425. doi:10.1023/b:jose.0000038449.78801.05
Bond, C. E., Gibbs, A. D., Shipton, Z. K., and Jones, S. (2007). What do you think this is? “Conceptual uncertainty” in geoscience interpretation. GSA Today 17 (11), 4–10. doi:10.1130/GSAT01711A.1
Bond, C. E., Philo, C., and Shipton, Z. K. (2011). When there isn’t a right answer: interpretation and reasoning, key skills for twenty‐first century geoscience. Int. J. Sci. Educ 33 (5), 629–652. doi:10.1080/09500691003660364
Boschi, E., Mulargia, F., Mantovani, E., Bonafede, M., Dziewonski, A. M., and Woodhouse, J. H. (1981). The Irpinia earthquake of november 23, 1980. Abstracts Eos Trans. AGU 6, 330.
Brozzetti, F., Lavecchia, G., Mancini, G., Milana, G., and Cardinali, M. (2009a). Analysis of the 9 September 1998 Mw 5.6 mercure earthquake sequence (southern Apennines, Italy): a multidisciplinary approach. Tectonophysics 476, 210–225. doi:10.1016/j.tecto.2008.12.007
Brozzetti, F., Boncio, P., Lavecchia, G., and Pace, B. (2009b). Present activity and seismogenic potential of a low-angle normal fault system (Città di Castello, Italy): constraints from surface geology, seismic reflection data and seismicity. Tectonophysics 463, 31–46. doi:10.1016/j.tecto.2008.09.023
Brozzetti, F., Cirillo, D., de Nardis, R., Cardinali, M., Lavecchia, G., Orecchio, B., et al. (2017a). Newly identified active faults in the Pollino seismic gap, southern Italy, and their seismotectonic significance. J. Struct. Geol 94, 13–31. doi:10.1016/j.jsg.2016.10.005
Brozzetti, F., Cirillo, D., Liberi, F., Piluso, E., Faraca, E., de Nardis, R., et al. (2017b). Structural style of quaternary extension in the crati valley (calabrian arc): evidence in support of an east-dipping detachment fault. Ital. J. Geosci 136, 434–453. doi:10.3301/IJG.2017.11
Brozzetti, F., Boncio, P., Cirillo, D., Ferrarini, F., de Nardis, R., Testa, A., et al. (2019). High‐resolution eldmapping and analysis of the August–October 2016 coseismic surface faulting(central Italy earthquakes): slip distri-bution, parameterization, and comparison with global earthquakes. Tectonics 38, 417–439. doi:10.1029/2018TC005305
Brozzetti, F., and Lavecchia, G. (1994). Seismicity and related extensional stress field: the case of the norcia seismic zone (Central Italy). Annales Tectonicæ 8, 36–57.
Brozzetti, F., Mondini, A. C., Pauselli, C., Mancinelli, P., Cirillo, D., Guzzetti, F., et al. (2020). Mainshock anticipated by intra-sequence ground deformations: insights from multiscale field and SAR Interferometric measurements. Geosciences 10, 186. doi:10.3390/geosciences10050186
Brozzetti, F., and Salvatore, A. (2006). La distensione nell’appennino campano‐lucano: nuovi dati sui bacini in tramontani della valle del tanagro, di S. gregorio magno e di muro lucano. Rend. Soc. Geol. Ital 2, 98–100
Brozzetti, F. (2011). The campania‐lucania extensional fault system, southern italy: a suggestion for a uniform model of active extension in the italian apennines. Tectonics 30, TC5009. doi:10.1029/2010TC002794
Brüstle, W., and Müller, G. (1983). Moment and duration of shallow earthquakes from Love-wave modelling for regional distances. Phys. Earth Planet In 32, 312–324. doi:10.1016/0031-9201(83)90031-6
Cagnetti, V., Caiaffa, E., Capocecera, P., Cervellati, R., and Cochi, C. (1981). Attività sismica dell’area irpina rilevata con la rete sismometrica del CNEN nel periodo Febbraio 1979-Novembre 1980Tech. Rept. Rome, Italy: CNEN-ENEL.
Cantalamessa, G., Dramis, F., Pambianchi, G., Romano, A., Santoni, A. M., and Tonnetti, G. (1981). Fenomeni franosi connessi con attività sismica nell’area compresa tra S. Giorgio La Molara e Bisaccia. Rend. Soc. Geol. It 4, 467–469.
Carafa, M., and Barba, S. (2013). The stress field in europe: optimal orientations with confidence limits. Geophys. J. Int 193, 531–548. doi:10.1093/gji/ggt024
Carmignani, L., Cello, G., Cerrina Peroni, A., Funiciello, R., Kalin, O., Mecchieri, M., et al. (1981). Analisi del campo di fratturazione superficiale indotta dal terremoto campano-lucano del 23/11/1980. Rend. Soc. Geol. It 4, 451–465.
Castaldo, R., de Nardis, R., De Novellis, V., Ferrarini, F., Lanari, R., Lavecchia, G., et al. (2018). Coseismic stress and strain field changes investigation through 3-D Finite Element modeling of DInSAR and GPS measurements and geological/seismological data: the l’aquila (Italy) 2009 earthquake case study. J. Geophys. Res. Solid Earth 123, 4193–4222. doi:10.1002/2017JB014453
Castello, B., Selvaggi, G., Chiarabba, C., and Amato, A. (2006). CSI Catalogo della sismicità italiana 1981-2002, versione 1.1. Roma: INGV-CNT.
Cello, G., Tondi, E., Micarelli, L., and Mattioni, L. (2003). Active tectonics and earthquake sources in the epicentral area of the 1857 Basilicata earthquake (southern Italy). J. Geodyn 36, 37–50. doi:10.1016/S0264-3707(03)00037-1
Chiarabba, C., De Gori, P., and Mele, F. M. (2015). Recent seismicity of Italy: active tectonics of the central Mediterranean region and seismicity rate changes after the Mw 6.3 l’aquila earthquake. Tectonophysics 638, 82–93. doi:10.1016/j.tecto.2014.10.016
Chiarabba, C., and De Gori, P. (2016). The seismogenic thickness in Italy: constraints on potential magnitude and seismic hazard. Terra. Nova 28, 402–408. doi:10.1111/ter.12233
Christophersen, A., Litchfield, N., Berryman, K., Thomas, R., Basili, R., Wallace, L., et al. (2015). Development of the global earthquake model’s neotectonic fault database. Nat. Hazards 79, 111–135. doi:10.1007/s11069-015-1831-6
Cinque, A., Patacca, E., Scandone, P., and Tozzi, M. (1993). Quaternary kinematic evolution of the southern apennines. relationship between surface geological features and lithospheric structures. Ann. Geofisc 36, 249–260. doi:10.4401/ag-4283
Cippitelli, G. (2007). The CROP-04 seismic profile. Interpretation and structural setting of the Agropoli–Barletta Geotraverse. Boll. Soc. Geo. It 7, 267–281.
Civico, R., Pucci, S., Villani, F., Pizzimenti, L., De Martini, P. M., Nappi, R., et al. (2018). Surface ruptures following the 30 October 2016 Mw 6.5 norcia earthquake, central Italy. J. Maps 14, 151–160. doi:10.1080/17445647.2018.1441756
Cocco, M., Chiarabba, C., Di Bona, M., Selvaggi, G., Margheriti, L., Frepoli, A., et al. (1999). The April 1996 Irpinia seismic sequence: evidence for fault interaction. J. Seismol 3, 105–117.
Crosson, R. S., Martini, M., Scarpa, R., and Key, S. C. (1986). The southern Italy earthquake of 23 November 1980: an unusual pattern of faulting. Bull. Seismol. Soc. Am 76, 381–394.
Dalla Via, G., De Natale, G., Troise, C., Pingue, F., Obrizzo, F., Riva, R., et al. (2003). First evidence of post-seismic deformation in the central mediterranean: crustal visco-elastic relaxation in the area of the 1980 Irpinia Earthquake (Southern Italy). Geophys. J. Int 154, F9–F14. doi:10.1046/j.1365-246X.2003.02031.x
De Landro, G., Amoroso, O., Stabile, T. A., Matrullo, E., Lomax, A., and Zollo, A. (2015). High-precision differential earthquake location in 3-D models: evidence for a rheological barrier controlling the microseismicity at the Irpinia fault zone in southern apennines. Geophys. J. Int 203, 1821–1831. doi:10.1093/gji/ggv397
De Matteis, R., Matrullo, E., Rivera, L., Stabile, A. T., Pasquale, G., and Zollo, A. (2012). Fault delineation and regional stress direction from the analysis of background microseismicity in the southern apennines, italy. Bull. Seismol. Soc. Am 102, 1899–1907. doi:10.1785/0120110225
De Paola, N., Collettini, C., Faulkner, D. R., and Trippetta, F. (2008). Fault zone architecture and deformation processes within evaporitic rocks in the upper crust. Tectonics 27, TC4017. doi:10.1029/2007TC002230
Del Pezzo, E., Iannacone, G., Martini, M., and Scarpa, R. (1983). The 23 november 1980 southern Italy earthquake. Bull. Seismol. Soc. Am 73, 187–200
Delvaux, D., and Sperner, B. (2003). New aspects of tectonic stress inversion with reference to the TENSOR program. Geol. Soc. Spec. Publ 212, 75–100. doi:10.1144/gsl.sp.2003.212.01.06
Deschamps, A., and King, G. C. P. (1984). Aftershocks of the campania-lucania (Italy) earthquake of 23 november 1980. Bull. Seismol. Soc. Am 74, 2483–2517
Deschamps, A., and King, G. C. P. (1983). The campania-lucania (southern Italy) earthquake of 23 november 1980. Earth Planet Sci. Lett 62, 296–304. doi:10.1016/0012-821X(83)90092-4
Devoti, R., Esposito, A., Pietrantonio, G., Pisani, A. R., and Riguzzi, F. (2011). Evidence of large-scale deformation patterns from GPS data in the italian subduction boundary. Earth Planet Sci. Lett 311, 230–241. doi:10.1016/j.epsl.2011.09.034
Di Luzio, E., Mele, G., Tiberti, M. M., Cavinato, G. P., and Parotto, M. (2009). Moho deepening and shallow upper crustal delamination beneath the central apennines. Earth Planet Sci. Lett 280, 1–12. doi:10.1016/j.epsl.2008.09.018
Di Naccio, D., Boncio, P., Brozzetti, F., Pazzaglia, F. J., and Lavecchia, G. (2013). Morphotectonic analysis of the lunigiana and garfagnana grabens (northern apennines, italy): implications for active normal faulting. Geomorphology 201, 293–311. doi:10.1016/j.geomorph.2013.07.003
DISS Working Group (2018). Database of individual seismogenic sources (DISS), version 3.2.1: a compilation of potential sources for earthquakes larger than M 5.5 in italy and surrounding areas istituto nazionale di geofisica e vulcanologia. Available at: http://diss.rm.ingv.it/diss/ (Accessed June, 2020).
D’Agostino, N. (2014). Complete seismic release of tectonic strain and earthquake recurrence in the apennines (italy). Geophys. Res. Lett 41, 1155–1162. doi:10.1002/2014GL059230
Ekström, G., Dziewonski, A. M., and Woodhouse, J. H. (1987). Centroid-moment tensor solutions for the 51 IASPEI selected earthquakes, 1980–1984. Phys. Earth Planet. In 47, 62–66. doi:10.1016/0031-9201(87)90067-7
Faure Walker, J. P., Roberts, G. P., Cowie, P. A., Papanikolaou, I., Michetti, A. M., Sammonds, P., et al. (2012). Relationship between topography, rates of extension and mantle dynamics in the actively-extending italian apennines. Earth Planet Sci. Lett 325–326, 76–84. doi:10.1016/j.epsl.2012.01.028
Ferranti, L., Palano, M., Cannavò, F., Mazzella, M. E., Oldow, J. S., Gueguen, E., et al. (2014). Rates of geodetic deformation across active faults in southern italy. Tectonophysics 621, 101–122. doi:10.1016/j.tecto.2014.02.007
Ferrarini, F., Lavecchia, G., de Nardis, R., and Brozzetti, F. (2015). fault geometry and active stress from earthquakes and field geology data analysis: the colfiorito 1997 and l’aquila 2009 cases (Central Italy). Pure Appl. Geophys 9, 1079–1103. doi:10.1007/s00024-014-0931-7
Ferrarini, F., Boncio, P., de Nardis, R., Pappone, G., Cesarano, M., Aucelli, P. P. C., et al. (2017). Segmentation pattern and structural complexities in seismogenic extensional settings: the north matese fault system (Central Italy). J. Struct. Geol 95, 93–112. doi:10.1016/j.jsg.2016.11.006
Festa, G., Adinolfi, G. M., Caruso, A., Colombelli, S., De Landro, G., Elia, L., et al. (2011). Rocca San Felice Seismic Sequence, Southern Apennines, Italy 04-06/07/2020, Special Report, Irpinia Near Fault Observatory. Available at: http://isnet.unina.it/.
Frepoli, A., Maggi, C., Cimini, G. B., Marchetti, A., and Chiappini, M. (2011). Seismotectonic of Southern Apennines from recent passive seismic experiments. J. Geodyn 51, 110–124.
Galli, P., and Bosi, V. (2003). “Analisi paleosismologiche lungo la faglia di caggiano (Monti della Maddalena, SA),” in Abstracts of the 22th congress of the national group of solid earth geophysics, Roma, November 18–20, 2003.
Galli, P., Bosi, V., Piscitelli, S., Giocoli, A., and Scionti, V. (2006). Late Holocene earthquakes in southern apennine: paleoseismology of the caggiano fault. Int. J. Earth Sci 95, 855–870. doi:10.1007/s00531-005-0066-2
Galli, P. (2010). “La storia sismica di conza,” in Conza storia arte fede. Editor E. Ricciardi (Calitri, Italy: Grafiche Pannisco), 23–70.
Galli, P., and Peronace, E. (2014). New paleoseismic data from the irpinia fault. a different seismogenic perspective for the southern apennines. Earth Sci. Rev 136, 175–201. doi:10.1016/j.earscirev.2014.05.013
Galli, P. (2020). Roman to middle age earthquakes sourced by the 1980 Irpinia fault: historical, archaeoseismological, and paleoseismological hints. Geosciences 10, 286. doi:10.3390/geosciences10080286
Gasparini, C., Iannacone, G., Scandone, P., and Scarpa, R. (1982). Seismotectonics of the calabriain arc. Tectonophysics 84, 267–286
Gasparini, C., Iannaccone, G., and Scarpa, R. (1985). Fault-plane solutions and seismicity of the Italian peninsula. Tectonophysics 117, 59–78. doi:10.1016/0040-1951(85)90236-7
Giano, S. I., and Martino, C. (2003). Assetto morfotettonico e morfostratigrafico di alcuni depositi continentali pleistocenici del bacino del pergola–melandro (Appennino Lucano). Quaternario 16 (2), 289–297.
Giardini, D. (1993). Teleseismic observation of the november 23 1980, irpinia earthquake. Ann. Geofisc 00, 17–25
Giardini, D., Basili, A., and Boschi, E. (1996). Applying the relative hypocentre location approach: where was the 1980 november 23 irpinia earthquake?. Geophys. J. Int 127, 605–615.
Heidbach, O., Tingay, M., Barth, A., Reinecker, J., Kurfeß, D., and Müller, B. (2010). Global crustal stress pattern based on the world stress map database release 2008. Tectonophysics 482, 3–15. doi:10.1016/0031-9201(87)90067-7
Heidbach, O., Rajabi, M., Cui, X., Fuchs, K., Müller, B., Reinecker, J., et al. (2018). The World Stress Map database release 2016: crustal stress pattern across scales. Tectonophysics 744, 484–498. doi:10.1016/j.tecto.2018.07.007
Hester, P. (2012). Epistemic uncertainty analysis: an approach using expert judgement and evidential credibility. Int. J. Qual. Stat. Reliab 2012, 617481. doi:10.1155/2012/617481
Iannaccone, G., Zollo, A., Elia, L., Convertito, V., Satriano, C., Martino, C., et al. (2010). A prototype system for earthquake early-warning and alert management in southern italy. Bull. Earthq. Eng 8, 1105–1129. doi:10.1007/s10518-009-9131-8
Improta, L., Iannaccone, G., Capuano, P., Zollo, A., and Scandone, P. (2000). Inferences on the upper crustal structure of southern apennines (Italy) from seismic refraction investigations and subsurface data. Tectonophysics 317, 273–298. doi:10.1016/S0040-1951(99)00267-X
Improta, L., Ferranti, L., De Martini, P. M., Piscitelli, S., Bruno, P. P., Burrato, P., et al. (2010). Detecting young, slow‐slipping active faults by geologic and multidisciplinary high‐resolution geophysical investigations: a case study from the apennine seismic belt. Italy. J. Geophys. Res 115, B11307. doi:10.1029/2010JB000871
Improta, L., De Gori, P., and Chiarabba, C. (2014). New insights into crustal structure, cenozoic magmatism, CO2 degassing, and seismogenesis in the southern apennines and irpinia region from local earthquake tomography. J. Geophys. Res. Solid Earth 119, 8283–8311. doi:10.1002/2013JB010890
Jackson, J. A., Gagnepain, J., Houseman, G., King, G. C. P., Papadimitriou, P., Soufleris, C., et al. (1982). Seismicity, normal faulting, and the geomorphological development of the gulf of corinth (Greece): the corinth earthquakes of february and march 1981. Earth Planet Sci. Lett 57, 377–397. doi:10.1016/0012-821X(82)90158-3
Kanamori, H., and Given, J. W. (1982). Use of long-period surface waves for rapid determination of earthquake source parameters 2. preliminary determination of source mechanisms of large earthquakes (MS≥6.5) in 1980. Phys. Earth Planet. In 30, 260–268. doi:10.1016/0031-9201(82)90112-1
Kim, W. Y., Kulhánek, O., and Meyer, K. (1984). Source processes of the 1981 gulf of corinth earthquake sequence from body-wave analysis. Bull. Seismol. Soc. Am 74, 459–477.
Lancieri, M., and Zollo, A. (2009). Simulated shaking maps for the 1980 Irpinia earthquake, Ms 6.9: insights on the observed damage distribution. Soil Dynam. Earthq. Eng 29, 1208–1219. doi:10.1016/j.soildyn.2009.01.007
Lavecchia, G. (1988). The tyrrhenian-apennines system: structural setting and seismotectogenesis. Tectonophysics 147, 263–296. doi:10.1016/0040-1951(88)90190-4
Lavecchia, G., Boncio, P., Brozzetti, F., De Nardis, R., Di Naccio, D., Ferrarini, F., et al. (2011). The April 2009 L'Aquila (central Italy) seismic sequence (Mw 6.3): a preliminary seismotectonic picture. Recent Prog. Earthquake Geol 2011, 1–17.
Lavecchia, G., Brozzetti, F., Barchi, M., Menichetti, M., and Keller, J. V. A. (1994). Seismotectonic zoning in east-central Italy deduced from an analysis of the neogene to present deformations and related stress fields. Geol. Soc. Am. Bull 106, 1170–1120. doi:10.1130/0016
Lavecchia, G., Castaldo, R., de Nardis, R., De Novellis, V., Ferrarini, F., Pepe, S., et al. (2016). Ground deformation and source geometry of the 24 August 2016 amatrice earthquake (Central Italy) investigated through analytical and numerical modeling of DInSAR measurements and structural-geological data. Geophys. Res. Lett 43, 12,389–12,398. doi:10.1002/2016GL071723
Lavecchia, G., Adinolfi, G. M., de Nardis, R., Ferrarini, F., Cirillo, D., Brozzetti, F., et al. (2017). Multidisciplinary inferences on a newly recognized active east-dipping extensional system in central italy. Terra. Nova 29, 77–89. doi:10.1111/ter.12251
Lavecchia, G., de Nardis, R., Ferrarini, F., Cirillo, D., Bello, S., and Brozzetti, F. (2021). “Regional seismotectonic zonation of hydrocarbon fields in active thrust belts: a case study from Italy,” in Building knowledge for geohazard assessment and management in the caucasus and other orogenic regions. Editors F. L. Bonali, F. Pasquaré Mariotto, and N. Tsereteli (the Netherlands: Springer). doi:10.1007/978-94-024-2046-3
Livio, F., Michetti, A. M., Vittori, E., Gregory, L., Wedmore, L., Piccardi, L., et al. (2016). Surface faulting during the august 24, 2016, central italy earthquake (Mw 6.0): preliminary results. Ann. Geophys [Epub ahead of print]. doi:10.4401/ag-7197
Locati, M., Camassi, R., Rovida, A., Ercolani, E., Bernardini, F., Castelli, V., et al. (2019). Database macrosismico italiano (DBMI15), versione 2.0: Istituto Nazionale di Geofisica e Vulcanologia (INGV). doi:10.13127/DBMI/DBMI15.2
Manighetti, I., Campillo, M., Sammis, C., Mai, P. M., and King, G. (2005). Evidence for self‐similar, triangular slip distributions on earthquakes: implications for earthquake and fault mechanics. J. Geophys. Res 110, B05302. doi:10.1029/2004JB003174
Martini, I. P., Sagri, M., and Colella, A. (2001). “Neogene quaternary basins of the inner apennines and calabrian arc,” in Anatomy of an orogen, the Apennines and adjacent mediterranean basins. Editors G. B. Vai, and I. P. Martini (Dordrecht, The Netherlands: Kluwer Acad.), 375–400.
Martini, M., and Scarpa, R. (1983). “Earthquakes in Italy in the last century,” in Earthquakes, Observation, Theory and Interpretation. North Holland, Amsterdam, 479–492.
Martino, C. (2007). Stima dei tassi di scorrimento delle faglie ed evoluzione tettonica quaternaria della valle del melandro (appennino campano‐lucano). Boll. Soc. Geol. Ital 126 (1), 37–53.
Maschio, L., Ferranti, L., and Burrato, P. (2005). Active extension in val d’agri area, southern apennines, italy: implications for the geometry of the seismogenic belt. Geophys. J. Int 162, 591–609. doi:10.1111/j.1365-246X.2005.02597.x
Menichetti, M., Piacentini, D., De Donatis, M., Roccheggiani, M., Tamburini, A., and Tirincanti, E. (2016). “Virtual outcrop and 3D structural analysis of monte vettore extensional active faults,” in Abstract of the 35th congress of the national group of solid earth geophysics, Lecce, Italy, November 22–24 2019.
Mirabella, F., Brozzetti, F., Lupattelli, A., and Barchi, M. R. (2011). Tectonic evolution of a low-angle extensional fault system from restored cross-sections in the northern apennines (Italy). Tectonics 30, TC6002. doi:10.1029/2011TC002890
Montone, P., and Mariucci, M. T. (2016). The new release of the Italian contemporary stress map. Geophys. J. Int 205, 1525–1531. doi:10.1093/gji/ggw100
Nakanishi, I., and Kanamori, H. (1984). Source mechanisms of twenty-six large, shallow earthquake (MS≧6.5) during 1980 from P-wave first motion and long-period rayleigh wave data. Bull. Seismol. Soc. Am 74, 805–818.
Nicholson, C., Plesch, A., Sorlien, C. C., Shaw, J. H., and Hauksson, E. (2015). “The SCEC community fault model version 5.0: an updated and expanded 3D fault set for southern california,” in 2015 pacific section AAPG joint meeting program (Oxnard, CA), Vol. 77, September 12–16.
Nicholson, G., Plesch, A., Sorlion, C. C., Shaw, J. H., and Hauksson, E. (2014). The SCEC 3D community fault model (CFM-v5): an updated and expanded fault set of oblique crustal deformation and complex fault interaction for southern california. Eos Trans. Am. Geophys. Union 95 (52). Abstract T31B-4584
Okabe, A., Boots, B., and Sugihara, K. (1992). Spatial tessellation concept and applications of voronoi diagrams. New York: John Wiley & Sons, 532.
Ortolani, F., and Torre, M. (1981). Guida all’escursione nell’area interessata dal terremoto del 23/11/1980. Rend. Soc. Geol. It 4, 173–214.
Oskin, M., Elliot, A., Benchum, D., Liu-Zeng, J., Liu, Z., Shao, Y., et al. (2015). Earthquake gates: linking ruptures length to geologically constrained dynamics of fault complexity, with examples from the altyn tagh and san andreas faults. Abstr. Progr. Geol. Soc. Am 47, 35.
Pantosti, D., and Valensise, G. (1990). Faulting mechanism and complexity of the november 23, 1980, campania-lucania earthquake, inferred from surface observation. J. Geophys. Res 95, 15319. doi:10.1029/jb095ib10p15319
Pantosti, D., and Valensise, G. (1993). Source geometry and long term behavior of the 1980, Irpinia earthquake fault based on field geologic observations. Ann. Geofisc 36, 41–49. doi:10.4401/ag-4299
Papanikolaou, I. D., and Roberts, G. P. (2007). Geometry, kinematics and deformation rates along the active normal fault system in the southern Apennines: implications for fault growth. J. Struct. Geol 29, 166–188. doi:10.1016/j.jsg.2006.07.009
Pasquale, G., De Matteis, R., Romeo, A., and Maresca, R. (2009). Earthquake focal mechanisms and stress inversion in the irpinia region (southern Italy). J. Seismol 13, 107–124. doi:10.1007/s10950-008-9119-x
Patacca, E., and Scandone, P. (2007). Geological interpretation of the CROP-04 seismic line (southern Apennines, Italy). results of the CROP project sub-project CROP-04 southern apennines (Italy). bollettino della società geologica italiana. Ital. J. Geosci. Spec. Issue 7, 297–315.
Pierdominici, S., Mariucci, M. T., and Montone, P. (2011). A study to constrain the geometry of an active fault in southern italy through borehole breakouts and downhole logs. J. Geodyn 52, 279–289. doi:10.1016/j.jog.2011.02.006
Pingue, F., De Natale, G., and Briole, P. (1993). Modelling of the 1980 Irpinia earthquake source: constraints from geodetic data. Ann. Geofisc 36, 27–40. doi:10.4401/ag-4296
Pingue, F., and De Natale, G. (1993). Fault mechanism of the 40 seconds subevent of the 1980 irpinia (southern Italy) earthquake from levelling data. Geophys. Res. Lett 20, 911–914. doi:10.1029/92GL02823
Plesch, A., Shaw, J. H., and Jordan, T. H. (2014). “Stochastic descriptions of basin velocity structure from analyses of sonic logs and the SCEC community velocity model (CVM-H),” in Presentation at 2014 SSA annual meeting, Palm Springs, CA, September 6–10.
Pondrelli, S., Salimbeni, S., Ekström, G., and Morelli, A. (2006). The Italian CMT dataset from 1977 to the present. Phys. Earth Planet. In 159, 286–303. doi:10.1016/j.pepi.2006.07.008
Porfido, S., Esposito, E., Vittori, E., Tranfaglia, G., Michetti, A. M., Blumetti, M., et al. (2002). Areal distribution of ground effects induced by strong earthquakes in the Southern Apennines (Italy). Surv. Geophys 23 (6), 529–562. doi:10.1023/A:1021278811749
Porreca, M., Fabbrizzi, A., Azzaro, S., Pucci, S., Del Rio, L., Pierantoni, P. P., et al. (2020). 3D geological reconstruction of the M. Vettore seismogenic fault system (Central Apennines, Italy): cross-cutting relationship with the M. Sibillini thrust. J. Struct. Geol 131, 103938. doi:10.1016/j.jsg.2019.103938
Porreca, M., Minelli, G., Ercoli, M., Brobia, A., Mancinelli, P., Cruciani, F., et al. (2018). Seismic reflection profiles and subsurface geology of the area interested by the 2016–2017 earthquake sequence (Central Italy). Tectonics 37, 1116–1137. doi:10.1002/2017TC004915
Rovida, A., Locati, M., Camassi, R., Lolli, B., and Gasperini, P. (2019). Catalogo Parametrico dei Terremoti Italiani (CPTI15), versione 2.0. Istituto Nazionale di Geofisica e Vulcanologia (INGV). doi:10.13127/CPTI/CPTI15.2
Salisbury, J. B., Haddad, D. E., Rockwell, T., Arrowsmith, J. R., Madugo, C., Zielke, O., et al. (2015). Validation of meter-scale surface faulting offset measurements from high-resolution topographic data. Geosphere 11, 1884–1901. doi:10.1130/GES01197.1
Scarpa, R., and Slejko, D. (1982). Some analyses of seismological data Southern Italy November 23, 1980 earthquake. Rome: The Italian Geodynamics Project of CNR, Publ., Vol. 503.
Scognamiglio, L., Tinti, E., and Quintiliani, M. (2006). Time Domain moment tensor [data set]: Istituto Nazionale di Geofisica e Vulcanologia (INGV). doi:10.13127/TDMT
Scrocca, D., Carminati, E., and Doglioni, C. (2005). Deep structure of the southern apennines, italy: thin-skinned or thick-skinned?. Tectonics 24, TC3005. doi:10.1029/2004TC001634
Scrocca, D., Carminati, E., Doglioni, C., and Marcantoni, D. (2007). “Slab retreat and active shortening along the central-northern apennines”,” in Thrust belts and foreland basins: from fold kinematics to hydrocarbon systems. Editors O. Locambe, J. Lavè, F. Roure, and J. Vergés (Berlin, Heidelberg: Springer), 471–487. doi:10.1007/978-3-540-69426-7
Scuderi, M. M., Niemeijer, A. R., Collettini, C., and Marone, C. (2013). Frictional properties and slip stability of active faults within carbonate–evaporite sequences: the role of dolomite and anhydrite. Earth Planet Sci. Lett 369-370, 220–232. doi:10.1016/j.epsl.2013.03.024
Servizio Geologico d’Italia (1970a). Foglio 186 (S. Angelo dei Lombardi) della Carta 1:100.000 dell’I. Roma: G.M.
Sgambato, C., Walker, J. P. F., and Roberts, G. P. (2020). Uncertainty in strain-rate from field measurements of the geometry, rates and kinematics of active normal faults: implications for seismic hazard assessment. J. Struct. Geol 131, 103934. doi:10.1016/j.jsg.2019.103934
Sperner, B., Müller, B., Heidbach, O., Delvaux, D., Reinecker, J., and Fuchs, K. (2003). Tectonic stress in the earth’s crust: advances in the world stress map project. Geol. Soc. London Spec. Publ 212, 101–116. doi:10.1144/GSL.SP.2003.212.01.07
Stabile, T. A., Satriano, C., Orefice, A., Festa, G., and Zollo, A. (2012). Anatomy of a microearthquake sequence on an active normal fault. Sci. Rep 2, 410. doi:10.1038/srep00410
Steckler, M. S., Agostinetti, N. P., Wilson, C. K., Roselli, P., Seeber, L., Amato, A., et al. (2008). Crustal structure in the southern apennines from teleseismic receiver functions. Geology 36, 155–158. doi:10.1130/G24065A.1
Trippetta, F., Collettini, C., Vinciguerra, S., and Meredith, P. G. (2010). Laboratory measurements of the physical properties of triassic Evaporites from central italy and correlation with geophysical data. Tecnophysics 492, 121–132. doi:10.1016/j.tecto.2010.06.001
Troise, C., De Natale, G., Pingue, F., and Petrazzuoli, S. M. (1998). Evidence for static stress interaction among earthquakes in the south–central apennines (Italy). Geophys. J. Int 134, 809–817. doi:10.1046/j.1365-246x.1998.00610.x
Vaccari, F., Suhadolc, P., and Panza, G. F. (1990). Irpinia, Italy, 1980 earthquake: waveform modelling of strong motion data. Geophys. J. Int 101, 631–647. doi:10.1111/j.1365-246x.1990.tb05575.x
Valensise, G. (1993). Summary of contributions on the 23 november 1980, Irpinia earthquake. Ann. Geofisc 00, 345–351.
Valensise, G., and Pantosti, D. (2001). The investigation of potential earthquake sources in peninsular Italy: a review. J. Seismol 5, 287–306. doi:10.1023/A:1011463223440
Vassallo, M., Festa, G., Bobbio, A., and Serra, M. (2016). Low shear velocity in a normal fault system imaged by ambient noise cross correlation: the case of the Irpinia fault zone, Southern Italy. J. Geophys. Res. Solid Earth 121, 4290–4305. doi:10.1002/2015JB012410
Villani, F., Pucci, S., Civico, R., De Martini, P. M., Cinti, F. R., and Pantosti, D. (2018). Surface faulting of the 30 October 2016 Mw 6.5 central Italy earthquake: detailed analysis of a complex coseismic rupture. Tectonics 37, 3378–3410. doi:10.1029/2018TC005175
Westaway, R. (1993). Fault rupture geometry for the 1980 Irpinia earthquake: a working hypothesis. Ann. Geofisc 36, 51–69.
Westaway, R., and Jackson, J. (1987). The earthquake of 1980 november 23 in campania-basilicata (southern Italy). Geophys. J. Roy. Astron. Soc 90, 375–443.
Keywords: Italy, active faulting, structural geology, kinematic analysis, seismotectonics, stress inversion, 3D fault model, Irpinia 1980 earthquake
Citation: Bello S, de Nardis R, Scarpa R, Brozzetti F, Cirillo D, Ferrarini F, di Lieto B, Arrowsmith RJ and Lavecchia G (2021) Fault Pattern and Seismotectonic Style of the Campania – Lucania 1980 Earthquake (Mw 6.9, Southern Italy): New Multidisciplinary Constraints. Front. Earth Sci. 8:608063. doi: 10.3389/feart.2020.608063
Received: 18 September 2020; Accepted: 25 November 2020;
Published: 20 January 2021.
Edited by:
Ioannis Kassaras, National and Kapodistrian University of Athens, GreeceReviewed by:
Alessandro Maria Michetti, University of Insubria, ItalyErhan Altunel, Eskisehir Osmangazi University, Turkey
Copyright © 2021 Bello, de Nardis, Scarpa, Brozzetti, Cirillo, Ferrarini, di Lieto, Arrowsmith and Lavecchia. This is an open-access article distributed under the terms of the Creative Commons Attribution License (CC BY). The use, distribution or reproduction in other forums is permitted, provided the original author(s) and the copyright owner(s) are credited and that the original publication in this journal is cited, in accordance with accepted academic practice. No use, distribution or reproduction is permitted which does not comply with these terms.
*Correspondence: S. Bello, simone.bello@unich.it; R. de Nardis, rita.denardis@unich.it