 Shuiqing Lai
 Jiarong Li2,3†
 Haixia Guan
- 1Department of Endocrinology, Guangdong Provincial People's Hospital, Guangdong Academy of Medical Sciences, Guangzhou, China
- 2Department of Endocrinology and Metabolism, The First Hospital of China Medical University, Shenyang, China
- 3Department of Endocrinology and Metabolism, The First People's Hospital of Ziyang, Ziyang, China
- 4Department of Physical Examination Center, The First Hospital of China Medical University, Shenyang, China
Background: Previous studies on the association between thyroid function and non‐alcoholic fatty liver disease (NAFLD) have contradicted. Acquired resistance to thyroid hormone theory might provide a reasonable explanation for these contradictions. We aimed to analyze the association between sensitivity to thyroid hormone indices with NAFLD.
Methods: A total of 4,610 individuals from the health medical center of the First Hospital of China Medical University were included in this study. The previously used thyroid feedback quantile-based index (TFQIFT4) was calculated. Also, we substituted free triiodothyronine (FT3) into the TFQI formulas to get the TFQIFT3 index. NAFLD was defined using abdominal ultrasound.
Results: Study results showed that FT3/FT4 and TFQIFT3 were positively correlated with the triglyceride (TG), total cholesterol (TC), and low-density lipoprotein cholesterol (LDL-C) levels (P<0.05) and negatively correlated with high-density lipoprotein cholesterol (HDL-C) level (P<0.05). In contrast, TFQIFT4 was positively correlated with HDL-C level (P < 0.05). After adjustment for multiple confounders, FT3, FT3/FT4, and TFQIFT3 were positively associated with the risks of dyslipidemia and NAFLD (P < 0.05). TFQIFT3 and FT3/FT4 performed better than TFQIFT4 on ROC analyses for NAFLD prediction, although the diagnostic sensitivity and specificity at the optimal cut-points were low. However, no association was observed between TFQIFT4 with the risks of dyslipidemia and NAFLD.
Conclusion: TFQIFT3 and FT3/FT4 can be used as new indicators for predicting dyslipidemia and NAFLD, although with low sensitivity and specificity at the optimal cut-points, while TFQIFT4 has insufficient evidence in predicting dyslipidemia and NAFLD.
Introduction
Non‐alcoholic fatty liver disease (NAFLD) includes a broad range of conditions from fat accumulation within the liver (simple steatosis), liver inflammation (non‐alcoholic steatohepatitis, NASH) through to liver fibrosis and cirrhosis, the latter having an increased risk for progression to hepatocellular carcinoma. What is more, emerging evidence has shown that NAFLD is related to extrahepatic complications such as obesity, type 2 diabetes, cardiovascular diseases, kidney diseases, malignancy, and all-cause mortality (1). Despite this alarming evidence, the nomenclature and the definition of NALFD have not been updated to reflect the latest knowledge. The heterogeneity of the population with NAFLD concerning its causal factors and the comorbidities represents an essential impediment to discovering highly effective medications. Thus, to more accurately reflect the heterogeneity of the disease, the international consensus panel has recently advised using metabolic associated with fatty liver disease (MAFLD) instead of NAFLD (2). Nevertheless, for the sake of this study, we will continue the use of NAFLD, which has been used in our previous data and has been widely accepted in the literature.
The liver plays an essential role in lipid metabolism, including the synthesis and transportation of cholesterol and triglycerides (3). Disorder of hepatic lipid metabolism may precipitate the fat retention within the liver and subsequent development of dyslipidemia and NAFLD. Thyroid function is one of the most important factors regulating liver lipid metabolism. Epidemiological data showed that the prevalence of NAFLD was 27.4–33.1% in the population with euthyroidism, 35.7–36.3% in the population with hypothyroidism, and 11.95-21.5% in the population with hyperthyroidism (4–6). Several studies also demonstrated that free thyroxine (FT4) and free triiodothyronine (FT3) serum levels were negatively associated with the risk of NAFLD and thyroid-stimulating hormone (TSH) serum levels were positively associated with the risk of NAFLD in the population with thyroid dysfunction (7–11). Furthermore, systematic reviews confirmed the positive association between hypothyroidism and NAFLD risk (12, 13). On the other side, thyroid dysfunctions both in the form of overt and subclinical hypothyroidism were more common among patients with NAFLD (14–16).
However, results from euthyroid patients were inconsistent. From a large cohort study, higher-normal serum FT3 and lower-normal serum TSH levels were independently related to a higher incidence of NAFLD (17). Thus, a mild acquired resistance to thyroid hormone might exist in the euthyroid population with NAFLD. So far, however, there has been little research on the association between sensitivity to thyroid hormone indices with the risk of NAFLD. Thyroid Feedback Quantile-based Index (TFQI) was proposed by Laclaustra, a novel index of central sensitivity to thyroid hormone. Laclaustra found that TFQI was related to cardiometabolic health characteristics in the general population (18). Therefore, this cross-sectional study aimed to investigate the direct association of central sensitivity to thyroid hormone (evaluated by TFQI) and peripheral sensitivity to thyroid hormone (evaluated by FT3/FT4) with dyslipidemia and NAFLD, trying to overcome current contradictions about the association between circulating thyroid hormone levels and hepatic alterations.
Methods
Subjects and Study Design
The participants consisted of 7,689 adults (age ≥ 14 years old) who completed health examinations at the health medical center of the First Hospital of China Medical University from January 1, 2017, to December 31, 2018. Exclusion criteria: 1) Age < 14 years old (n = 0); 2) Missing data (n = 499); 3) Patients with history of thyroid diseases (n = 292); 4) Thyroid antibody abnormalities (n = 2288). After exclusion, 4,610 participants were included in the final retrospective cross-sectional analysis (Figure 1). The study was approved by the Ethics Committee of the First Hospital of China Medical University. An informed consent waiver was obtained for using de-identified data.
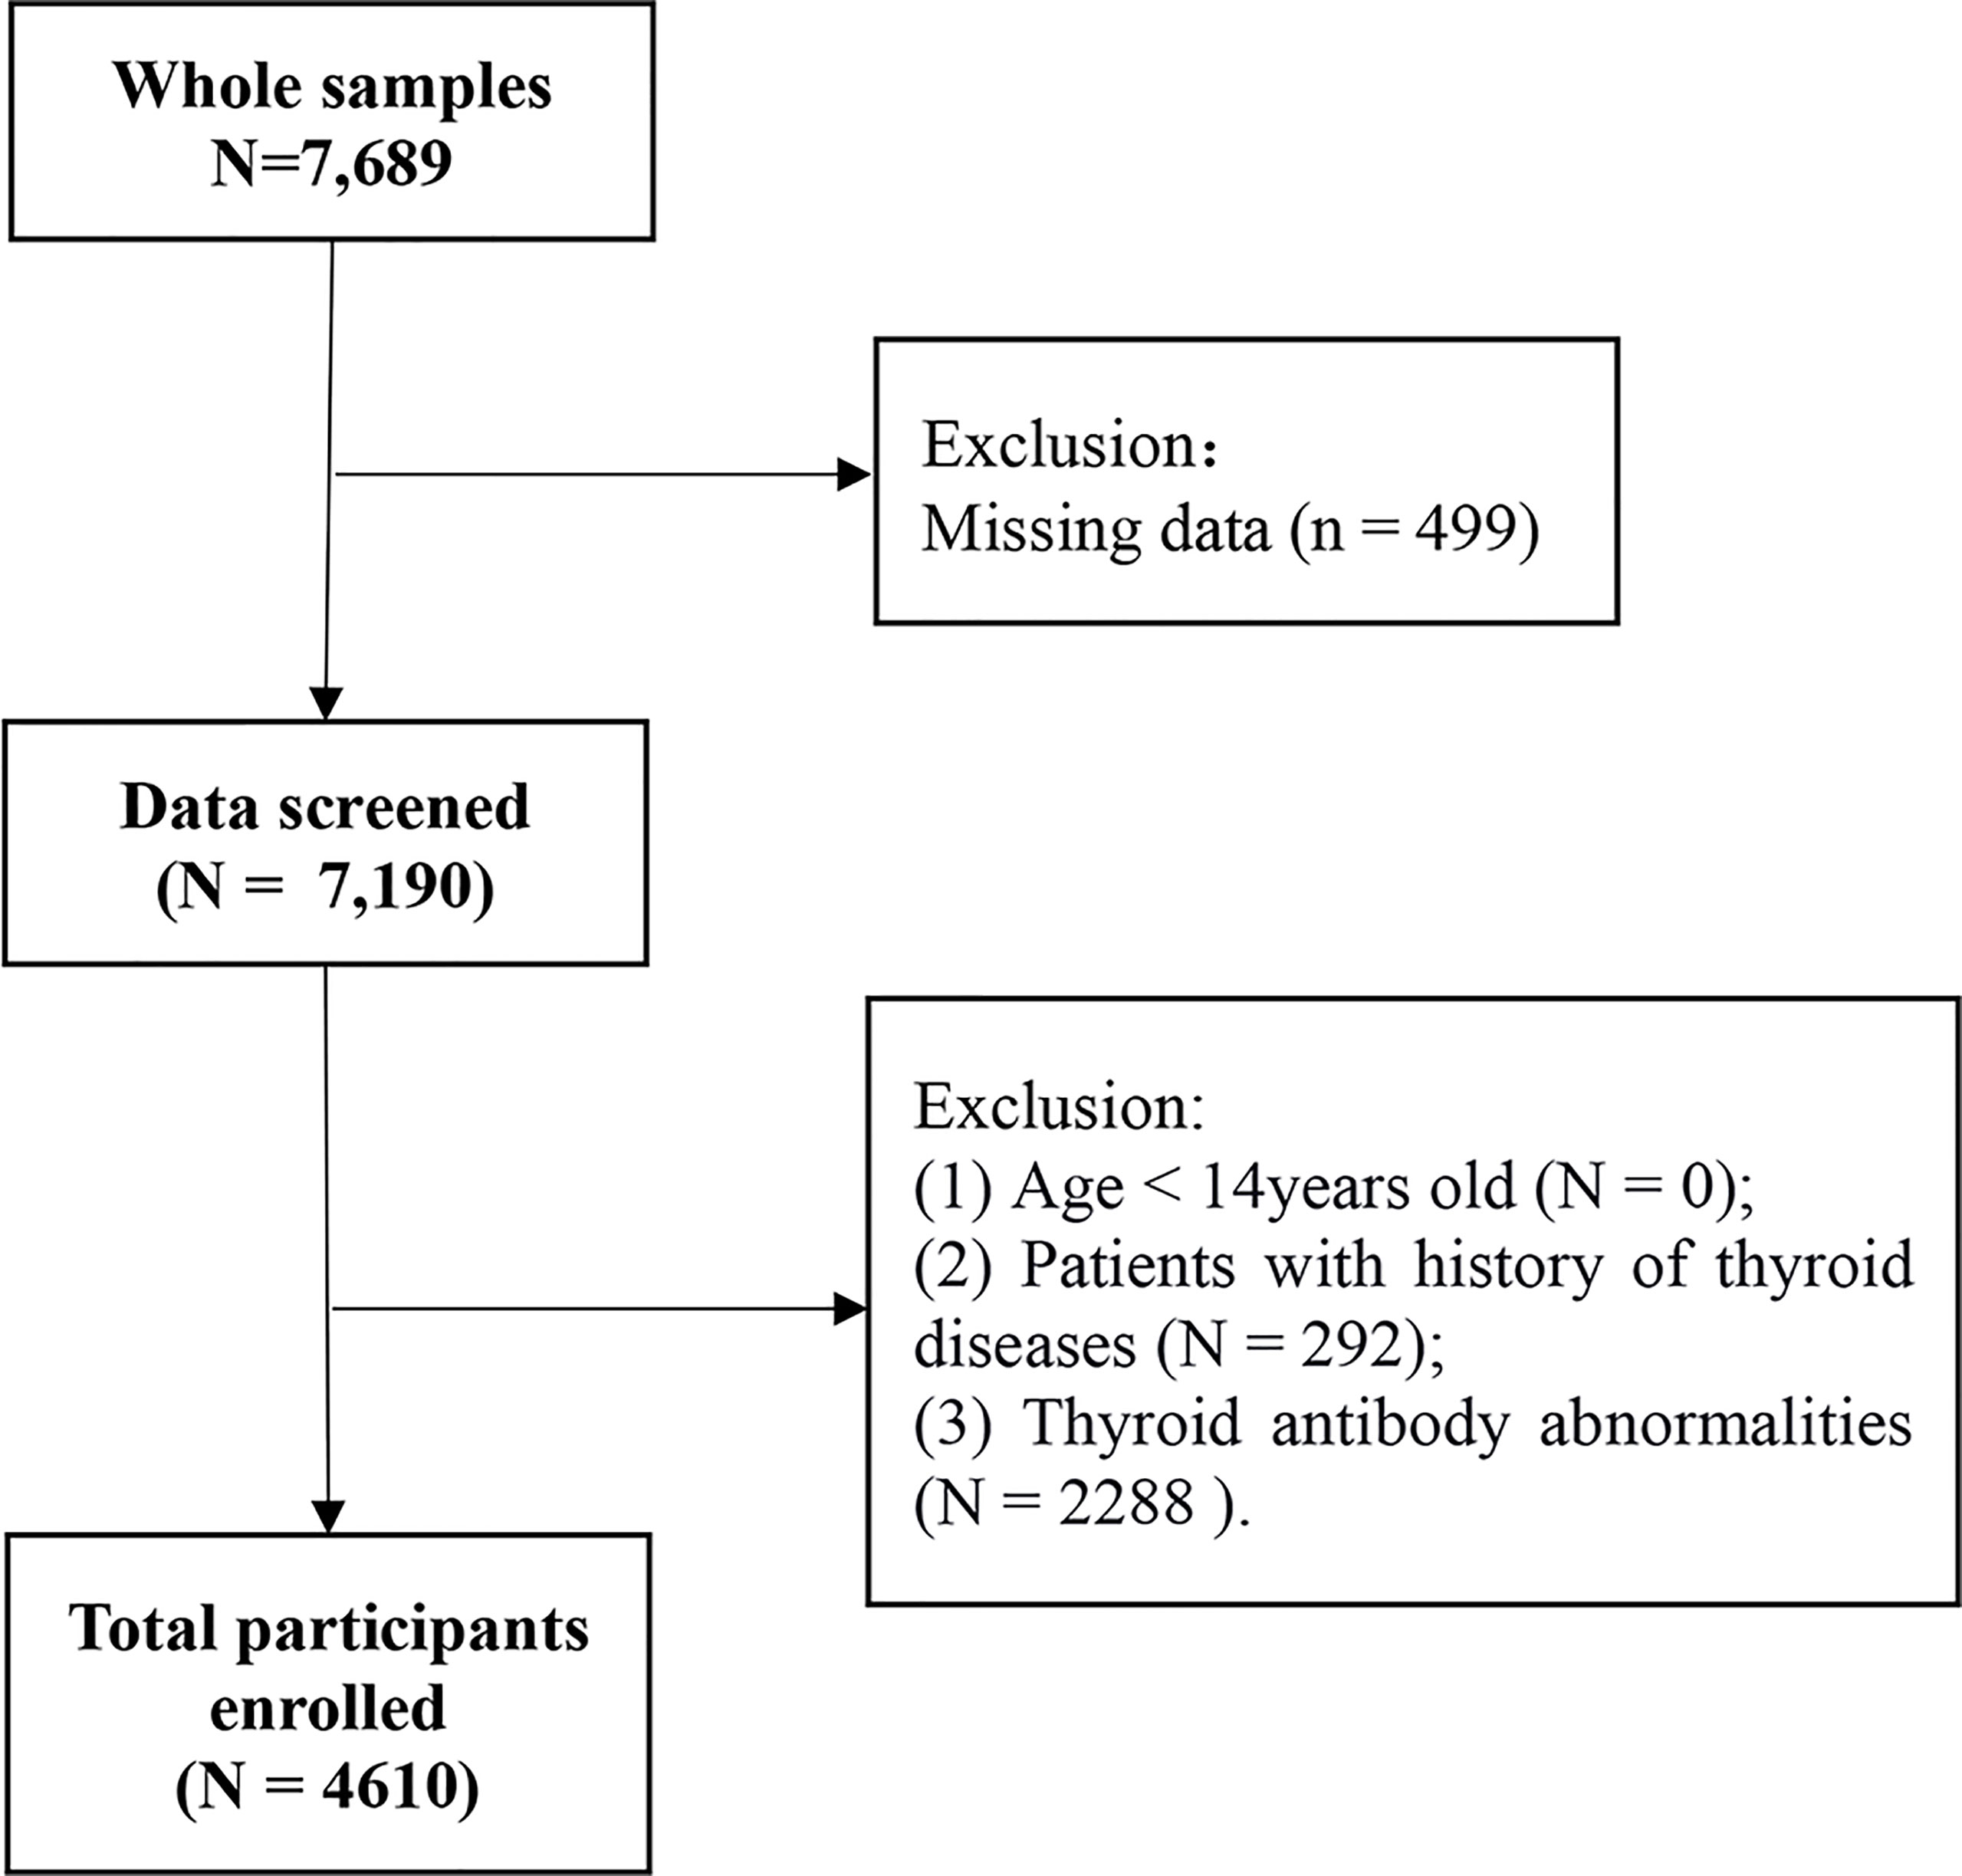
Figure 1 Flowchart of the inclusion and exclusion of participants.
Data Collection
The participants were examined after overnight fasting for 8-12h in the morning. 1) Gender, age (years), weight (kg), height (meter), waist circumference (WC), systolic blood pressure (SBP, mmHg), and previous medical history of the participants were measured and recorded. 2) Body mass index (BMI) is derived by dividing the weight in kilograms by the squared height in meters (kg/m2). 3) WC was determined at mid-abdomen (midpoint between subcostal and suprailiac landmarks according to WHO protocol) (19). 4) BP was measured after at least five minutes of rest and averaged twice BP reading measured at an interval of two minutes.
Biochemical Measurements
An automatic biochemical analyzer (Hitachi, Japan) was utilized for biochemical parameters measurement, including fasting plasma glucose (FPG), triglyceride (TG), total cholesterol (TC), high-density lipoprotein cholesterol (HDL-C), and low-density lipoprotein cholesterol (LDL-C) levels. Hyper-triglyceridemia (hyper-TG), hyper-cholesterolemia (hyper-TC), hypo-high-density lipoprotein cholesterolemia (hypo-HDL), hyper-low-density lipoprotein cholesterolemia (hyper-LDL) were defined as TG ≥ 1.7 mmol/L, TC ≥ 5.2 mmol/L, HDL-C < 1.0 mmol/L, and LDL-C ≥ 3.4 mmol/L, respectively, and dyslipidemia if any one of them (20). Serum levels of FT3, FT4, TSH, thyroid peroxidase antibody (TPOAb), and thyroglobulin antibody (TgAb) were determined by electrochemiluminescent immunoassays on Architect i2000SR (Abbott Laboratories, Chicago, IL, USA). The reference ranges of FT3, FT4, and TSH were 2.63-5.70 pmol/L, 9.01-19.05 pmol/L, and 0.35-4.94 mU/L, respectively. The thyroid antibody abnormality was defined as TPOAb ≥ 5.61 IU/ml and/or TGAb ≥ 4.11 IU/ml. TFQIFT4 is achieved by the algorithm TFQI = cumulative distribution function (cdfFT4) – (1 – cdfTSH) (18). In order to investigate the role of FT3 in this index, FT4 in TFQIFT4 formulas was replaced with FT3 to obtain TFQIFT3. The value of TFQI ranged from -1 to 1. For TFQI, negative values indicated that the hypothalamus-pituitary-thyroid axis was more sensitive to the change of thyroid hormones; positive values indicated low sensitivity; the value of 0 indicated a normal sensitivity.
Abdominal Ultrasonography and NAFLD Definition
Abdominal ultrasonography (USG) was used to test liver disease. All participants underwent abdominal USG (Siemens Acuson X300, German). NAFLD was defined by at least two of the following positive ultrasound finding (1. The liver near-field echogenicity is enhanced diffusely and is stronger than that of the kidney; 2. The structure of the intrahepatic duct is blurring; 3. The liver far-field echogenicity weakened gradually), and no history of heavy drinking (weekly alcohol intake ≤ 210g in males and ≤ 140g in females) (21).
Statistical Analysis
The data were processed using SPSS 22.0 statistical software. Continuous variables with normal distribution were shown as means ± standard deviation (SD), and the independent T-test was performed to compare groups. While continuous variables with skewed distribution were shown as medians (interquartile ranges), non-parametric Mann-Whitney tests were conducted to compare groups. All categorical variables were expressed as relative numbers, and the χ2 tests were used to compare groups. Kendall's tau-b was used to calculate the correlation coefficient. Correlation is generally defined as very weak if correlation coefficient (r) <0.2, weak if r ≥0.2 and <0.4, moderate if r ≥0.4 and <0.6, strong if r ≥0.6 and <0.8, and very strong if r ≥0.8. To evaluate the association between thyroid parameters with lipid profiles and NAFLD, logistic regression models were used. Model 1 adjusted for demographic factors, including gender and age; model 2 adjusted all the factors adjusted in model 1 plus metabolic factors, including BMI, WC, SBP, and FPG. To evaluate the performance of the indices, we examined the receiver operating characteristics curves (ROC), which plots sensitivity against 1-specificity, and calculated the cut-points from ROC results. All calculated P values were two-sided, and a P value < 0.05 was taken to indicate a significant difference.
Results
Clinical Characteristics of the Participants
The clinical baseline data of participants are shown in detail in Table 1. A total of 4,610 participants were included in the final analysis, 2681 men (58.2%) with an average age of 47.88 ± 11.19 years. The incidence of dyslipidemia was 62.4%, higher in men than in women (66.9% vs. 33.1%, P< 0.001). Compared with the normal lipid profiles group, the age, BMI, WC, SBP, FPG, FT3, FT3/FT4, TFQIFT3, TG, TC, and LDL-C levels in the dyslipidemia group were significantly higher (P < 0.01), the FT4 and HDL-C levels in the dyslipidemia group were significantly lower (P < 0.01). The difference of TSH and TFQIFT4 between the two groups was not statistically significant (P = 0.568, P = 0.130, respectively).
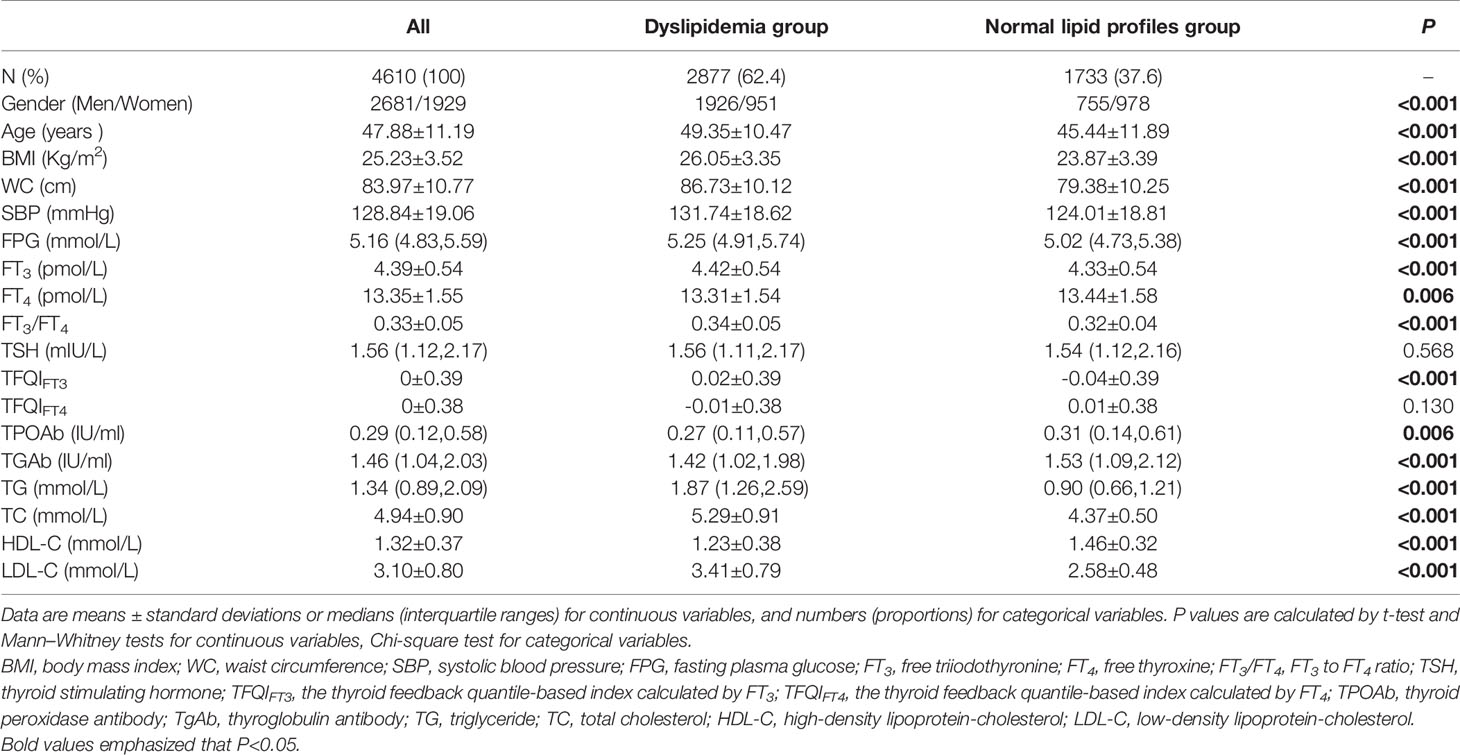
Table 1 Comparison of clinical characteristics between participants with and without dyslipidemia.
Table 2 showed that NAFLD incidence in the participants was 48.9%, higher in men than in women (75.5% vs. 24.5%, P < 0.001). Compared with the control group, the age, BMI, WC, SBP, FPG, FT3, FT3/FT4, TFQIFT3, TG, TC, and LDL-C levels in the NAFLD group were significantly higher, while the HDL-C levels in the NAFLD group were significantly lower (P < 0.01). There was no significant difference in FT4, TSH, and TFQIFT4 levels between the NAFLD group and the control group (P = 0.078, P = 0.320, P = 0.091, respectively).
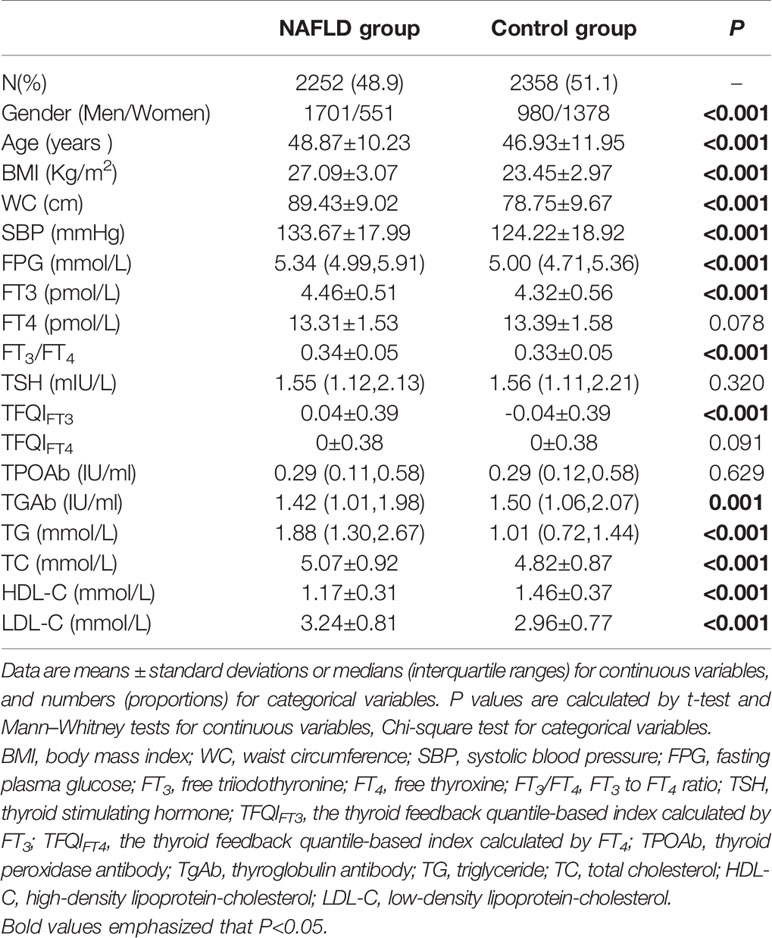
Table 2 Comparison of clinical characteristics between participants with and without NAFLD.
Correlation Between Thyroid Parameters and Lipid Profiles
FT3 levels were positively correlated with TG, TC, and LDL-C levels and negatively correlated with HDL-C levels (r = 0.109, P < 0.001, r = 0.031, P = 0.002, r = 0.048, P < 0.001, r = -0.084, P < 0.001, respectively). However, FT4 levels were negatively correlated with TG levels and positively correlated with HDL-C levels (r = -0.044, P < 0.001 and r = 0.023, P = 0.022, respectively). While TSH levels were positively correlated with TG and TC levels (r = 0.020, P = 0.040, r = 0.025, P = 0.012) (Table 3). FT3/FT4 was positively correlated with TG, TC, and LDL-C levels (r = 0.120, P < 0.001, r = 0.029, P = 0.003, r = 0.043, P < 0.001, respectively) and negatively correlated with HDL-C levels (r = -0.089, P < 0.001), results from TFQIFT3 were similar with FT3/FT4. In contrast, TFQIFT4 was only positively correlated with HDL-C levels (r = 0.03, P = 0.003).
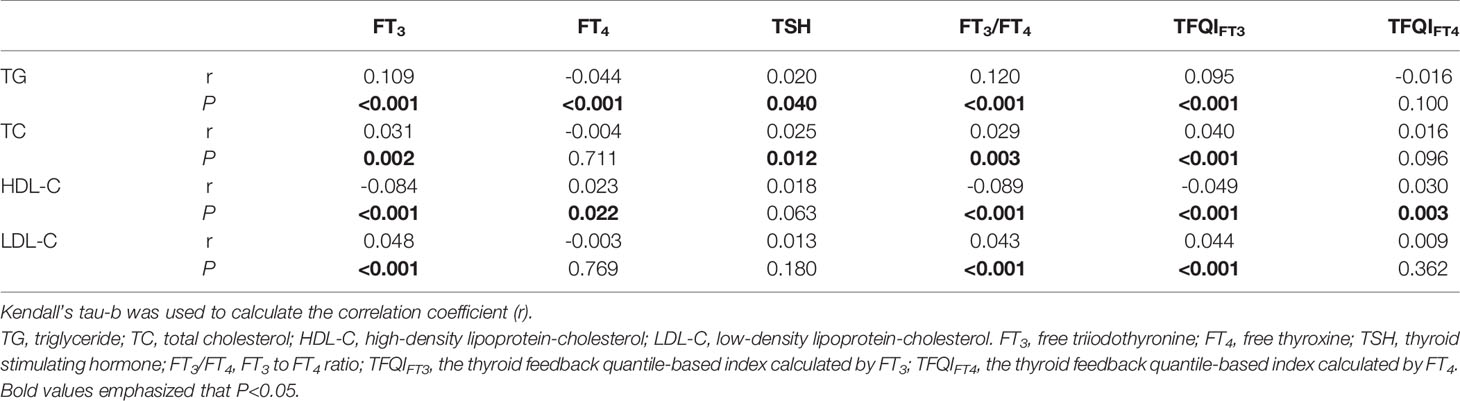
Table 3 Correlation between thyroid parameters and lipid profiles.
Association of Thyroid Parameters With Dyslipidemia and NAFLD
We performed gender and age-adjusted and multivariate-adjusted models with the inclusion of thyroid function parameters and sensitivity to thyroid hormone indices (Table 4). After adjustment for gender and age in model 1, we found that the FT3, FT3/FT4, and TFQIFT3 were positively associated with the risks of hyper-TG, hyper-TC, hyper-LDL, and NAFLD (P < 0.05). The TSH was also positively associated with risks of hyper-TG, hyper-TC, and hyper-LDL (P < 0.05), however, TSH was not significantly associated with the risk of NAFLD (P = 0.05). Moreover, FT4 showed a negative association with risks of hyper-TG and NAFLD (P < 0.05). Furthermore, all the results remained in model 2 except for the association between FT4 with the risk of NAFLD (P =0.163).
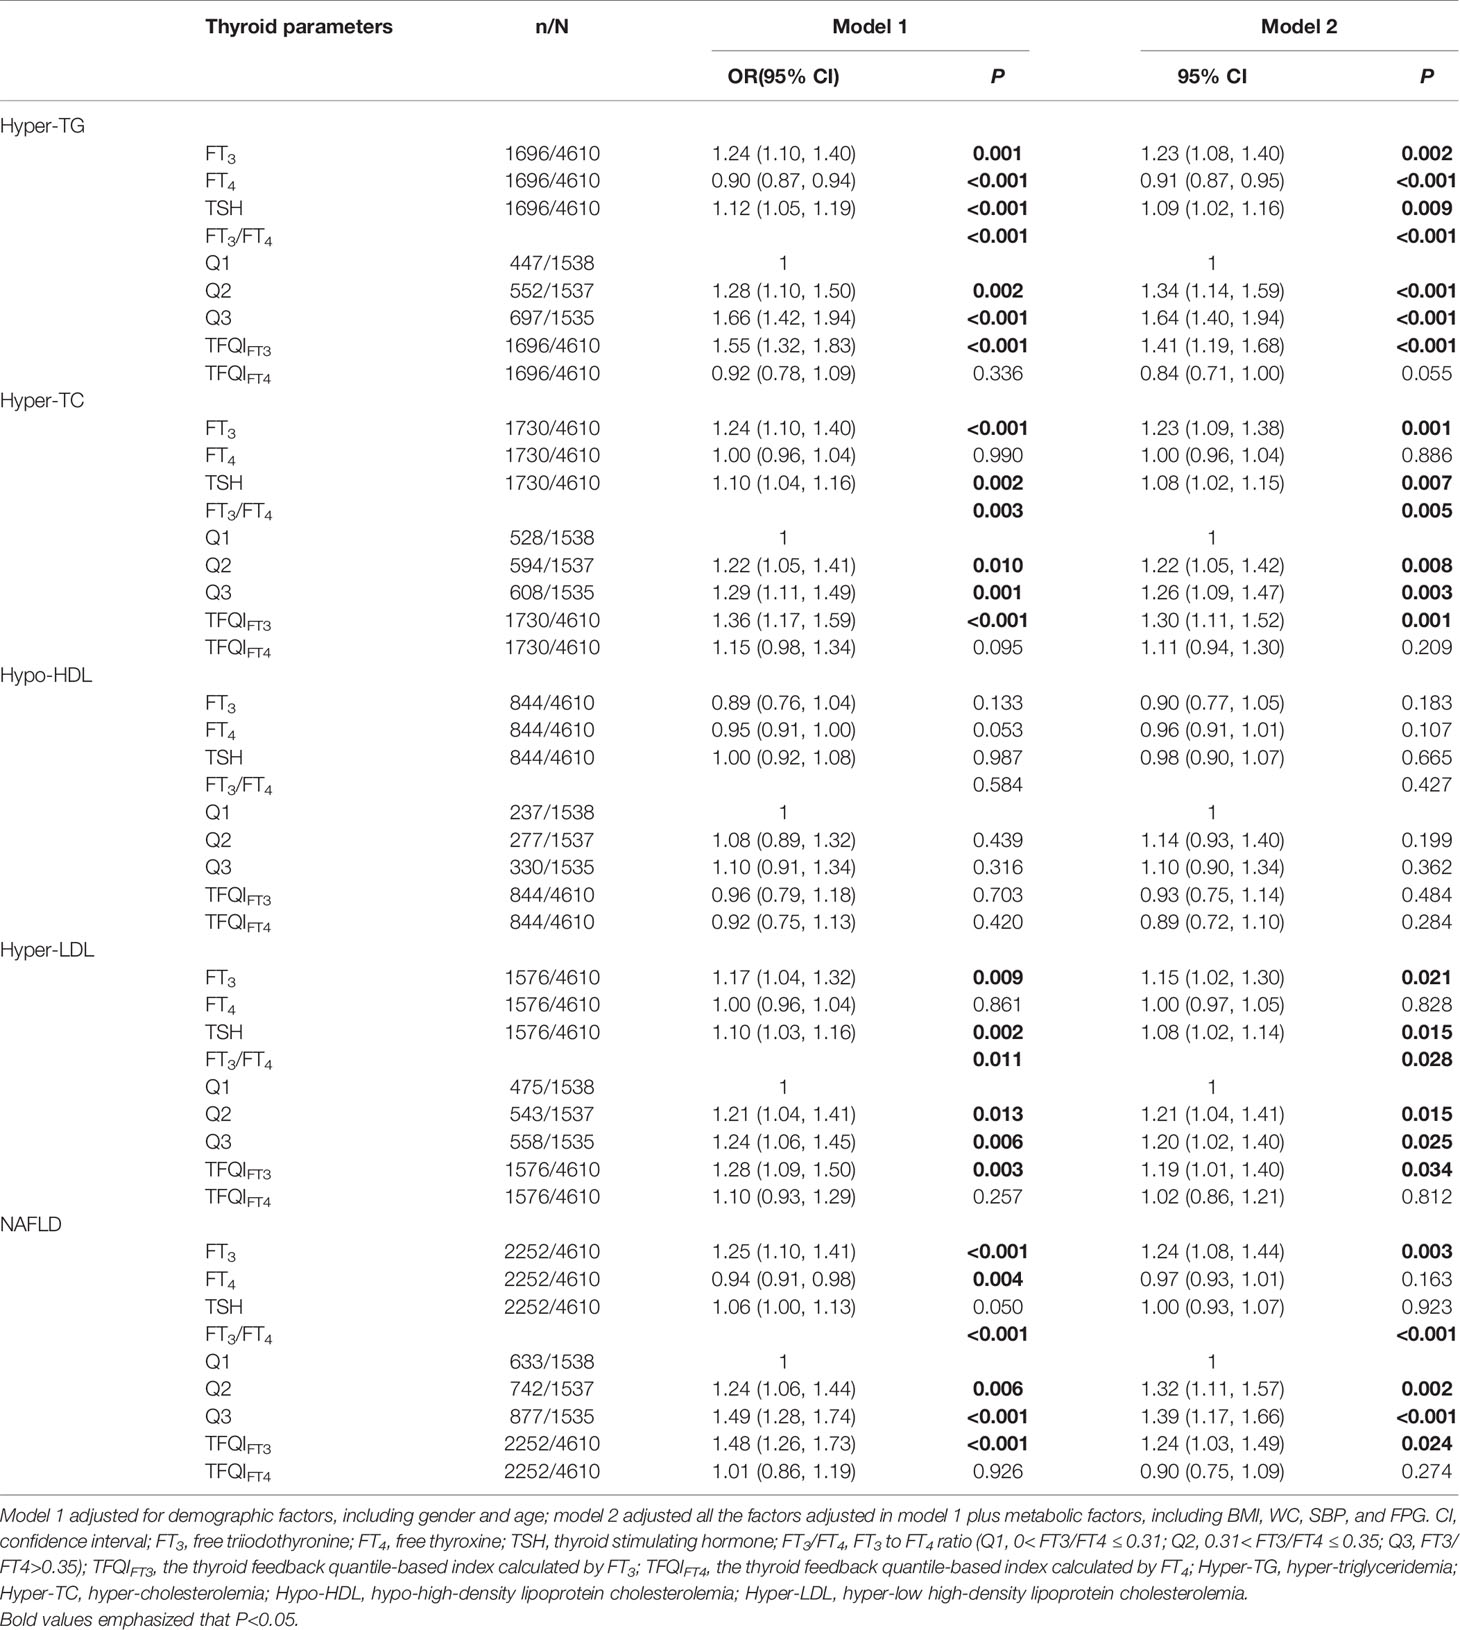
Table 4 Logistic regression analysis of the association between thyroid parameters with dyslipidemia and NAFLD.
ROC Curves for Optimal Cut-Points of TFQIFT3 and FT3/FT4
Figure 2 showed that TFQIFT3 and FT3/FT4 performed better than TFQIFT4 on ROC analyses for NAFLD prediction (area under ROC curve 0.557, P < 0.001; 0.579, P < 0.001; 0.488, P = 0.149 respectively). The optimal cut-points of TFQIFT3 and FT3/FT4 for NAFLD prediction were0.120 and 0.319.However, both TFQIFT3 and FT3/FT4 yielded very low diagnostic sensitivity and specificity for NAFLD prediction at the optimal cut-points (0.43, 0.66; 0.65, 0.47, respectively). Although TFQIFT3 and FT3/FT4 also performed better than TFQIFT4 on ROC analyses for dyslipidemia prediction, the area under ROC curve is relatively small (area under ROC curve 0.545, P < 0.001; 0.564, P < 0.001; 0.487, P = 0.131 respectively).
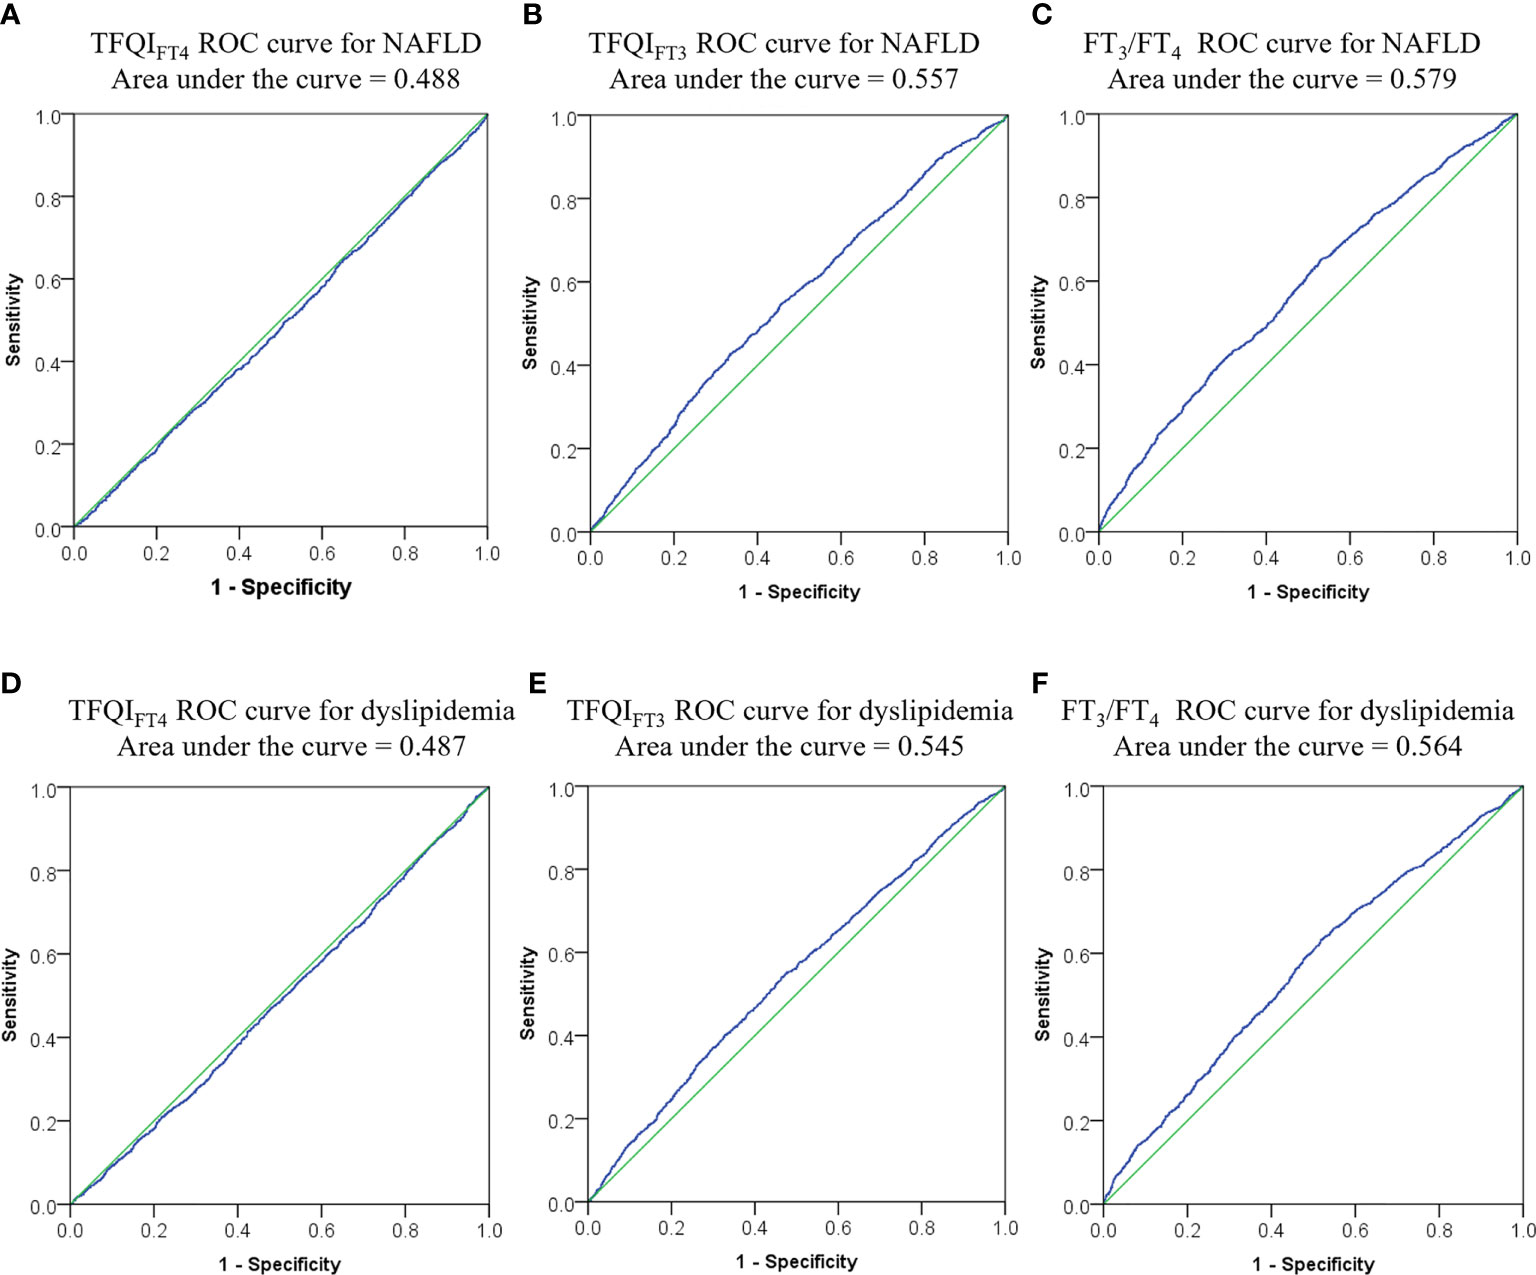
Figure 2 ROC curves for optimal cut-points of TFQIFT3, and FT3/FT4. (A–C) ROC curve for NAFLD from TFQIFT4, TFQIFT3, and FT3/FT4; (D–F) ROC curve for dyslipidemia from TFQIFT4, TFQIFT3, and FT3/FT4. ROC, receiver operating characteristic, FT3, free triiodothyronine; FT4, free thyroxine; FT3/FT4, FT3 to FT4 ratio; TFQIFT3, the thyroid feedback quantile-based index calculated by FT3; TFQIFT4, the thyroid feedback quantile-based index calculated by FT4.
Discussion
As far as we know, this is the first study to evaluate the association between central and peripheral sensitivity to thyroid hormone indices with the risk of NAFLD. This cross-sectional study demonstrated that FT3/FT4 and TFQIFT3 levels were positively associated with the risk of hyper-TG, hyper-TC, hyper-LDL, and NAFLD. In contrast, no association was observed between TFQIFT4 with the risks of dyslipidemia and NAFLD. The novelty of the present study is to apply the sensitivity of thyroid hormones indices rather than absolute circulating values of FT3, FT4, and TSH as a predictor of NAFLD risk, which could be more informative, directly correlating thyroid hormone resistance to hepatic metabolic alteration, giving advancement in current knowledge. Moreover, we introduced the TFQIFT3 index by substituting FT3 from the calculation of TFQIFT4. Such TFQIFT3 index along with FT3/FT4 is closely related to the risk of dyslipidemia and NAFLD.
Numerous previous studies have found that thyroid dysfunction, including hypothyroidism and hyperthyroidism, is significantly associated with dyslipidemia (22). Elevated plasma TC, LDL-C, TG level, and decreased plasma HDL-C level can be found in hypothyroidism. The plasma levels of TC and LDL-C show the most pronounced changes (23–25). In comparison, the opposite blood lipid level can be found in hyperthyroidism.
Thyroid hormones affect lipid metabolism manifold, such as synthesis, mobilization, and degradation (25). Thyroid hormones can stimulate 3-hydroxy-3methylglutarylcoenzyme A reductase, which initiates cholesterol biosynthesis (26). Additionally, triiodothyronine (T3) can bind to specific thyroid hormone-responsive elements to activate the LDL receptor gene, thus upregulates LDL receptors (27). Moreover, Thyroid hormones can regulate cholesterol metabolism by increasing the expression of the regulatory sterol element-binding protein-2 (SREBP-2) (28). Furthermore, Thyroid hormones can also regulate HDL metabolism; previous studies revealed that thyroid hormones exchanged cholesteryl esters from HDL2 to the very low-density lipoproteins and TGs in the opposite direction by increasing cholesteryl ester transfer activity (26). Another effect of T3 is to stimulate lipoprotein lipase, which catabolizes the TG-rich lipoproteins, leading to a decrease of TG (26).
It is biologically plausible that thyroid hormones exert significant effects on the development of NAFLD. As we mentioned above, thyroid hormones had multiple effects on lipid metabolism at both systemic and hepatic levels by virtue of their roles in regulating the circulating level of lipoprotein, TG, and TC, as well as hepatic TG accumulation and metabolism (7, 29). Recent studies showed that the expression of hepatic lipogenic genes was regulated by thyroid hormones, what is more, several genes whose expression is changed in NAFLD were also regulated by thyroid hormones (30, 31). Additionally, decreased hepatic levels of thyroid hormones and defective intrahepatic deiodinase expression were found in NAFLD (32). On the other side, the previous study showed that excessive hepatic fatty acids in NAFLD may damage the activity of thyroid hormone receptors (33). Moreover, this apparent local hypothyroid status promotes hepatic triglyceride accumulation by decreasing hepatic lipase activity (34). Furthermore, in vivo studies have shown that not only thyroid hormone administration but also thyroid hormone agonists ameliorates hepatic fat accumulation (35–37).
TSH level is one of the essential risk factors in the pathogenesis of NAFLD, independent of FT3 and FT4. Tahara et al. found that the serum TSH level was significantly associated with the risk of NAFLD, while FT4 was not significantly related to the risk of NAFLD in the subclinical hypothyroidism population (7). Chung et al. found that NAFLD was positively associated with TSH serum level. They revealed that subclinical hypothyroidism was closely associated with the risk of NAFLD in a TSH dose-dependent manner, even within the normal upper TSH level range (38). Liu et al. showed that the serum levels of TSH in patients with NASH or without NASH were different significantly. Furthermore, the NASH prevalence in patients with subclinical hypothyroidism was significantly higher than in the euthyroidism patients. In multivariate analyses, they concluded that elevated serum TSH levels predicted the risk of NASH independently (39). Additionally, Kim et al. reported that even within the normal range of T4, an increase in the TSH level was closely related to the biopsy-proven NASH and advanced fibrosis (40).
As we mentioned above, positive associations of FT3 and TSH level with the risk of NAFLD, negative associations of FT4 level with the risk of NAFLD suggest that the role of thyroid hormone in the development and progression of NAFLD is complex. This association is at odds with the physiological effects of thyroid hormones, which are considered capable of activating lipolysis. Thus, we speculate that the contradictory results may reflect the close association between sensitivity to thyroid hormone with NAFLD.
TSH, FT4, and FT3 are closely regulated and influenced by each other. Compared with a single index, the calculation of composite indices can systematically reflect the regulation of thyroid hormone homeostasis. Our results showed that FT3/FT4 was significantly positively associated with the risks of hyper-TG, hyper-TC, hyper-LDL, and NAFLD. FT4 can be converted to FT3 by deiodinase in the peripheral. Thus FT3/FT4 can be considered as an indicator of peripheral deiodinase activity. A previous study by Bilgin and Pirgon suggested that the augmented conversion from FT4 to FT3 by increasing deiodinase activity was a compensatory mechanism for fat excessively accumulation to ameliorate energy expenditure (41). Consistent with our study, Gokmen et al. found that the patients with NAFLD had significantly elevated FT3/FT4, and FT3/FT4 is a independent predictor of NAFLD in euthyroid patients and hyperthyroid patients (42).
In 2019, Laclaustra et al. proposed a new sensitivity to thyroid hormone index (TFQI) to detect mild levels of acquired thyroid hormone resistance in the population; the result showed that TFQI was more stable than the TSH index and TSH T4 index in evaluating sensitivity to thyroid hormone. That study also showed that TFQI values were related to obesity, diabetes, metabolic syndrome, and diabetes-related mortality (18). As we know, the prevalence of NAFLD is related to multiple metabolic risk factors, such as obesity, diabetes, and so on (4). NAFLD is also a strong determinant for the development of metabolic syndrome (43); what is more, metabolic abnormalities in metabolic syndrome, including diabetes, obesity, and hyperlipidemia, are critical metabolic risk factors for NAFLD (44, 45). Thus, in the present study, we proposed that TFQI might be related to NAFLD and might be a diagnostic predictor for NAFLD. In our study, sensitivity to thyroid hormone evaluation by the TFQIFT3 was significantly positively associated with the risk of hyper-TG, hyper-TC, hyper-LDL, and NAFLD. Moreover, TFQIFT3 and FT3/FT4 performed better than TFQIFT4 on ROC analysis; although, TFQIFT3 and FT3/FT4 yielded low diagnostic sensitivity and specificity. In comparison, no association was found between TFQIFT4 with the risk of dyslipidemia and NAFLD. Although the exact mechanisms remain unclear, the following aspect might be the possible explanation: serum level of FT3, which is mainly conversed from serum FT4 by deiodinase, can be considered as a compensatory mechanism for fat accumulation to improve energy expenditure and reflect better sensitivity of thyroid hormone (41). Thyroid function is also race-specific; in the present study, we only included Chinese participants. Therefore, the contradictory results in our study may be partly due to interethnic variations.
There are still some limitations in the present study: 1) The present study was designed cross-sectionally. Thus we only found the association between sensitivity to thyroid hormone indices with risk of NAFLD, and the design limited our ability to collect the follow-up data and evaluate the causality of associations;2) Liver biopsy was not used to accurately detect NAFLD, while ultrasonography was utilized to diagnosed NAFLD, there was limited accuracy for detecting mild hepatic lipid accumulation; 3) this study included only Chinese patients who completed health examinations at a single medical center. Since the limitation mentioned, the present results above still need further confirmation by longitudinal prospective studies in multiple race populations.
Conclusions
The present study showed that TFQIFT3 and FT3/FT4 were independently associated with the risk of dyslipidemia and NAFLD after multiple adjustments. TFQIFT3 and FT3/FT4 performed better than TFQIFT4 on ROC analyses for dyslipidemia and NAFLD prediction. Thus TFQIFT3 and FT3/FT4 can be used as new indicators for predicting dyslipidemia and NAFLD, although the diagnostic sensitivity and specificity at the optimal cut-points are very low, while TFQIFT4 has insufficient evidence in predicting dyslipidemia and NAFLD.
Data Availability Statement
The original contributions presented in the study are included in the article. Further inquiries can be directed to the corresponding authors.
Ethics Statement
The study was approved by the Ethics Committee of the First Hospital of China Medical University. The ethics committee waived the requirement of written informed consent for participation.
Author Contributions
SL, JL, and ZW conducted a literature search, assisted with study design, data collection, data analysis, data interpretation, and draft the manuscript. WW and HG participated in study design, and revised the manuscript. All authors contributed to the article and approved the submitted version.
Conflict of Interest
The authors declare that the research was conducted in the absence of any commercial or financial relationships that could be construed as a potential conflict of interest.
Publisher's Note
All claims expressed in this article are solely those of the authors and do not necessarily represent those of their affiliated organizations, or those of the publisher, the editors and the reviewers. Any product that may be evaluated in this article, or claim that may be made by its manufacturer, is not guaranteed or endorsed by the publisher.
References
1. Anstee QM, Targher G, Day CP. Progression of NAFLD to Diabetes Mellitus, Cardiovascular Disease or Cirrhosis. Nat Rev Gastroenterol Hepatol (2013) 10(6):330–44. doi: 10.1038/nrgastro.2013.41
2. Eslam M, Sanyal AJ, George J. MAFLD: A Consensus-Driven Proposed Nomenclature for Metabolic Associated Fatty Liver Disease. Gastroenterology (2020) 158(7):1999–2014.e1. doi: 10.1053/j.gastro.2019.11.312
3. Ipsen DH, Lykkesfeldt J, Tveden-Nyborg P. Molecular Mechanisms of Hepatic Lipid Accumulation in Non-Alcoholic Fatty Liver Disease. Cell Mol Life Sci: CMLS (2018) 75(18):3313–27. doi: 10.1007/s00018-018-2860-6
4. Wang B, Wang B, Yang Y, Xu J, Hong M, Xia M, et al. Thyroid Function and non-Alcoholic Fatty Liver Disease in Hyperthyroidism Patients. BMC Endocr Disord (2021) 21(1):27. doi: 10.1186/s12902-021-00694-w
5. Zelber-Sagi S, Nitzan-Kaluski D, Halpern Z, Oren R. Prevalence of Primary non-Alcoholic Fatty Liver Disease in a Population-Based Study and Its Association With Biochemical and Anthropometric Measures. Liver Int (2006) 26(7):856–63. doi: 10.1111/j.1478-3231.2006.01311.x
6. Xu C, Xu L, Yu C, Miao M, Li Y. Association Between Thyroid Function and Nonalcoholic Fatty Liver Disease in Euthyroid Elderly Chinese. Clin Endocrinol (2011) 75(2):240–6. doi: 10.1111/j.1365-2265.2011.04016.x
7. Tahara K, Akahane T, Namisaki T, Moriya K, Kawaratani H, Kaji K, et al. Thyroid-Stimulating Hormone Is an Independent Risk Factor of Non-Alcoholic Fatty Liver Disease. JGH Open (2020) 4(3):400–4. doi: 10.1002/jgh3.12264
8. Borges-Canha M, Neves JS, Mendonça F, Silva MM, Costa C, Cabral PM, et al. Thyroid Function and the Risk of Non-Alcoholic Fatty Liver Disease in Morbid Obesity. Front Endocrinol (2020) 11:572128. doi: 10.3389/fendo.2020.572128
9. Liu Y, Wang W, Yu X, Qi X. Thyroid Function and Risk of Non-Alcoholic Fatty Liver Disease in Euthyroid Subjects. Ann Hepatol (2018) 17(5):779–88. doi: 10.5604/01.3001.0012.3136
10. Kaltenbach TE, Graeter T, Oeztuerk S, Holzner D, Kratzer W, Wabitsch M, et al. Thyroid Dysfunction and Hepatic Steatosis in Overweight Children and Adolescents. Pediatr Obes (2017) 12(1):67–74. doi: 10.1111/ijpo.12110
11. Tao Y, Gu H, Wu J, Sui J. Thyroid Function is Associated With Non-Alcoholic Fatty Liver Disease in Euthyroid Subjects. Endocr Res (2015) 40(2):74–8. doi: 10.3109/07435800.2014.952014
12. Guo Z, Li M, Han B, Qi X. Association of non-Alcoholic Fatty Liver Disease With Thyroid Function: A Systematic Review and Meta-Analysis. Digestive Liver Dis (2018) 50(11):1153–62. doi: 10.1016/j.dld.2018.08.012
13. Mantovani A, Nascimbeni F, Lonardo A, Zoppini G, Bonora E, Mantzoros CS, et al. Association Between Primary Hypothyroidism and Nonalcoholic Fatty Liver Disease: A Systematic Review and Meta-Analysis. Thyroid (2018) 28(10):1270–84. doi: 10.1089/thy.2018.0257
14. Bjoro T, Holmen J, Krüger O, Midthjell K, Hunstad K, Schreiner T, et al. Prevalence of Thyroid Disease, Thyroid Dysfunction and Thyroid Peroxidase Antibodies in a Large, Unselected Population. The Health Study of Nord-Trondelag (HUNT). Eur J Endocrinol (2000) 143(5):639–47. doi: 10.1530/eje.0.1430639
15. Silveira MG, Mendes FD, Diehl NN, Enders FT, Lindor KD. Thyroid Dysfunction in Primary Biliary Cirrhosis, Primary Sclerosing Cholangitis and Non-Alcoholic Fatty Liver Disease. Liver Int (2009) 29(7):1094–100. doi: 10.1111/j.1478-3231.2009.02003.x
16. Pagadala MR, Zein CO, Dasarathy S, Yerian LM, Lopez R, McCullough AJ. Prevalence of Hypothyroidism in Nonalcoholic Fatty Liver Disease. Digestive Dis Sci (2012) 57(2):528–34. doi: 10.1007/s10620-011-2006-2
17. Gu Y, Wu X, Zhang Q, Liu L, Meng G, Wu H, et al. High-Normal Thyroid Function Predicts Incident Non-Alcoholic Fatty Liver Disease Among Middle-Aged and Elderly Euthyroid Subjects. J Gerontol Ser A Biol Sci Med Sci (2021) 3:glab037. doi: 10.1093/gerona/glab037
18. Laclaustra M, Moreno-Franco B, Lou-Bonafonte JM, Mateo-Gallego R, Casasnovas JA, Guallar-Castillon P, et al. Impaired Sensitivity to Thyroid Hormones Is Associated With Diabetes and Metabolic Syndrome. Diabetes Care (2019) 42(2):303–10. doi: 10.2337/dc18-1410
19. WHO. Obesity: Preventing and Managing the Global Epidemic. Report of a WHO Consultation. Vol. 894. Geneva, Switzerland: WHO (2000). pp. i–xii, 1-253.
20. Association CM. Guideline for Primary Care of Dyslipidemias: Practice Version (2019). Chin J Gen Pract (2019) 018(005):417–21. doi: 10.3760/cma.j.issn.1671-7368.2019.05.004
21. Fatty Liver Expert Committee CMDA. Guidelines of Prevention and Treatment for Nonalcoholic Fatty Liver Disease: A 2018 Update. Zhonghua ganzangbing zazhi = Chin J Hepatol (2018) 26(3):195–203. doi: 10.3760/cma.j.issn.1007-3418.2018.03.008
22. Duntas LH, Brenta G. The Effect of Thyroid Disorders on Lipid Levels and Metabolism. Med Clinics North America (2012) 96(2):269–81. doi: 10.1016/j.mcna.2012.01.012
23. Peppa M, Betsi G, Dimitriadis G. Lipid Abnormalities and Cardiometabolic Risk in Patients With Overt and Subclinical Thyroid Disease. J Lipids (2011) 2011:575840. doi: 10.1155/2011/575840
24. Ahi S, Amouzegar A, Gharibzadeh S, Delshad H, Tohidi M, Azizi F. Trend of Lipid and Thyroid Function Tests in Adults Without Overt Thyroid Diseases: A Cohort From Tehran Thyroid Study. PloS One (2019) 14(5):e0216389. doi: 10.1371/journal.pone.0216389
25. Jung KY, Ahn HY, Han SK, Park YJ, Cho BY, Moon MK. Association Between Thyroid Function and Lipid Profiles, Apolipoproteins, and High-Density Lipoprotein Function. J Clin Lipidol (2017) 11(6):1347–53. doi: 10.1016/j.jacl.2017.08.015
26. Rizos CV, Elisaf MS, Liberopoulos EN. Effects of Thyroid Dysfunction on Lipid Profile. Open Cardiovasc Med J (2011) 5:76–84. doi: 10.2174/1874192401105010076
27. Bakker O, Hudig F, Meijssen S, Wiersinga WM. Effects of Triiodothyronine and Amiodarone on the Promoter of the Human LDL Receptor Gene. Biochem Biophys Res Commun (1998) 249(2):517–21. doi: 10.1006/bbrc.1998.9174
28. Shin DJ, Osborne TF. Thyroid Hormone Regulation and Cholesterol Metabolism are Connected Through Sterol Regulatory Element-Binding Protein-2 (SREBP-2). J Biol Chem (2003) 278(36):34114–8. doi: 10.1074/jbc.M305417200
29. Sinha RA, Singh BK, Yen PM. Direct Effects of Thyroid Hormones on Hepatic Lipid Metabolism. Nat Rev Endocrinol (2018) 14(5):259–69. doi: 10.1038/nrendo.2018.10
30. Wang Y, Viscarra J, Kim SJ, Sul HS. Transcriptional Regulation of Hepatic Lipogenesis. Nat Rev Mol Cell Biol (2015) 16(11):678–89. doi: 10.1038/nrm4074
31. Bohinc BN, Michelotti G, Xie G, Pang H, Suzuki A, Guy CD, et al. Repair-Related Activation of Hedgehog Signaling in Stromal Cells Promotes Intrahepatic Hypothyroidism. Endocrinology (2014) 155(11):4591–601. doi: 10.1210/en.2014-1302
32. Sinha RA, Bruinstroop E, Singh BK, Yen PM. Nonalcoholic Fatty Liver Disease and Hypercholesterolemia: Roles of Thyroid Hormones, Metabolites, and Agonists. Thyroid (2019) 29(9):1173–91. doi: 10.1089/thy.2018.0664
33. Li QL, Yamamoto N, Inoue A, Morisawa S. Fatty Acyl-CoAs are Potent Inhibitors of the Nuclear Thyroid Hormone Receptor In Vitro. J Biochem (1990) 107(5):699–702. doi: 10.1093/oxfordjournals.jbchem.a123111
34. Fuchs CD, Claudel T, Trauner M. Role of Metabolic Lipases and Lipolytic Metabolites in the Pathogenesis of NAFLD. Trends Endocrinol Metab: TEM (2014) 25(11):576–85. doi: 10.1016/j.tem.2014.08.001
35. Mollica MP, Lionetti L, Moreno M, Lombardi A, De Lange P, Antonelli A, et al. 3,5-Diiodo-L-Thyronine, by Modulating Mitochondrial Functions, Reverses Hepatic Fat Accumulation in Rats Fed a High-Fat Diet. J Hepatol (2009) 51(2):363–70. doi: 10.1016/j.jhep.2009.03.023
36. Cable EE, Finn PD, Stebbins JW, Hou J, Ito BR, van Poelje PD, et al. Reduction of Hepatic Steatosis in Rats and Mice After Treatment With a Liver-Targeted Thyroid Hormone Receptor Agonist. Hepatol (Baltimore Md) (2009) 49(2):407–17. doi: 10.1002/hep.22572
37. Erion MD, Cable EE, Ito BR, Jiang H, Fujitaki JM, Finn PD, et al. Targeting Thyroid Hormone Receptor-Beta Agonists to the Liver Reduces Cholesterol and Triglycerides and Improves the Therapeutic Index. Proc Natl Acad Sci USA (2007) 104(39):15490–5. doi: 10.1073/pnas.0702759104
38. Chung GE, Kim D, Kim W, Yim JY, Park MJ, Kim YJ, et al. Non-Alcoholic Fatty Liver Disease Across the Spectrum of Hypothyroidism. J Hepatol (2012) 57(1):150–6. doi: 10.1016/j.jhep.2012.02.027
39. Liu L, Li P, Mi Y, Liu Y, Liu Y, Zhang P. Thyroid-Stimulating Hormone is Associated With Nonalcoholic Steatohepatitis in Patients With Chronic Hepatitis B. Medicine (2019) 98(46):e17945. doi: 10.1097/MD.0000000000017945
40. Kim D, Kim W, Joo SK, Bae JM, Kim JH, Ahmed A. Subclinical Hypothyroidism and Low-Normal Thyroid Function Are Associated With Nonalcoholic Steatohepatitis and Fibrosis. Clin Gastroenterol Hepatol (2018) 16(1):123–31.e1. doi: 10.1016/j.cgh.2017.08.014
41. Bilgin H, Pirgon Ö. Thyroid Function in Obese Children With Non-Alcoholic Fatty Liver Disease. J Clin Res Pediatr Endocrinol (2014) 6(3):152–7. doi: 10.4274/jcrpe.1488
42. Gökmen FY, Ahbab S, Ataoğlu HE, Türker B, Çetin F, Türker F, et al. FT3/FT4 Ratio Predicts Non-Alcoholic Fatty Liver Disease Independent of Metabolic Parameters in Patients With Euthyroidism and Hypothyroidism. Clinics (Sao Paulo Brazil) (2016) 71(4):221–5. doi: 10.6061/clinics/2016(04)08
43. Allen AM, Therneau TM, Larson JJ, Coward A, Somers VK, Kamath PS. Nonalcoholic Fatty Liver Disease Incidence and Impact on Metabolic Burden and Death: A 20 Year-Community Study. Hepatol (Baltimore Md) (2018) 67(5):1726–36. doi: 10.1002/hep.29546
44. Gonzalez-Cantero J, Martin-Rodriguez JL, Gonzalez-Cantero A, Arrebola JP, Gonzalez-Calvin JL. Insulin Resistance in Lean and Overweight non-Diabetic Caucasian Adults: Study of Its Relationship With Liver Triglyceride Content, Waist Circumference and BMI. PloS One (2018) 13(2):e0192663. doi: 10.1371/journal.pone.0192663
Keywords: thyroid function, sensitivity to thyroid hormone indices, thyroid feedback quantile-based index, dyslipidemia, non‐alcoholic fatty liver disease
Citation: Lai S, Li J, Wang Z, Wang W and Guan H (2021) Sensitivity to Thyroid Hormone Indices Are Closely Associated With NAFLD. Front. Endocrinol. 12:766419. doi: 10.3389/fendo.2021.766419
Received: 29 August 2021; Accepted: 18 October 2021;
Published: 05 November 2021.
Edited by:
Rosalba Senese, University of Campania Luigi Vanvitelli, ItalyReviewed by:
Hideyuki Iwayama, Aichi Medical University, JapanAntonia Giacco, University of Sannio, Italy
Copyright © 2021 Lai, Li, Wang, Wang and Guan. This is an open-access article distributed under the terms of the Creative Commons Attribution License (CC BY). The use, distribution or reproduction in other forums is permitted, provided the original author(s) and the copyright owner(s) are credited and that the original publication in this journal is cited, in accordance with accepted academic practice. No use, distribution or reproduction is permitted which does not comply with these terms.
*Correspondence: Haixia Guan, hxguan@vip.126.com; Wei Wang, 6899wangwei@163.com
†These authors have contributed equally to this work