Numerical Investigation on Hydrodynamic Performance of an OWC Wave Energy Device in the Stepped Bottom
 De-Zhi Ning
 Song Ke
 Robert Mayon
 Chongwei Zhang
- 1State Key Laboratory of Coastal and Offshore Engineering, Dalian University of Technology, Dalian, China
- 2Offshore Renewable Energy Research Centre, Dalian University of Technology, Dalian, China
The efficiency response of an oscillating water column (OWC) wave energy converter is analyzed by adopting a numerical approach and using various stepped bottom configurations for the seabed. A two-dimensional, fully non-linear higher-order boundary element method (HOBEM) model is developed to simulate the hydrodynamic characteristics and fluid structure interaction for a fixed OWC located in a numerical wave flume. A number of model tests are conducted for various regular incident wave conditions by modifying the wave amplitudes and wavelengths. The measured free surface elevation at the chamber center and the oscillatory air pressure generated by the fluctuating free surface within the chamber are recorded. The hydrodynamic efficiency of the OWC is determined using these parameters. The simulation results are validated by comparing against previously published experimental and numerical data. Good agreement is observed in both cases. The geometric dimensions of the step are modified by altering the step height and step length. Furthermore, by altering the step length, the location of the front face of the step relative to the front wall of the OWC is adjusted. Therefore, the positional significance of the step can also be analyzed in terms of its relative location to the OWC chamber and to the flow field development. It is shown that the geometry of the step and the position of the vertical face of the step relative to the OWC influences the hydrodynamic efficiency. The research demonstrates that by optimizing the step geometry and position for a given wave condition a higher operational efficiency can be achieved.
Introduction
Due to limited reserves and exploitation difficulty associated with fossil energy resources and the environmental problems that arises during to the hazardous chemical processing of fossil fuels, renewable energy resources have become more appealing to meet increasing global demands (Rezanejad et al., 2013; Veigas et al., 2014). Wave farm installations have the characteristics of high-energy flux density (2–3 kW/m2) which is potentially higher than solar parks (0.1–0.3 kW/m2) and wind farms (0.4–0.6 kW/m2) (Falnes, 2007; Khan et al., 2017). Furthermore, wave farms can remain operational over a longer harvesting period. Wave farms can function up to 90% of the time, making them potentially more efficient than solar parks and wind farms that typically generate power at 20–30% of the time (Khan et al., 2017). Wave farms present lower negative environmental impacts (Palha et al., 2010; Carballo and Iglesias, 2013), and are forecast to be one of the most favorable technologies to provide clean, renewable energy in the future.
Much research has been conducted on renewable wave energy harvesting devices. In order to encourage and expand the uptake of wave energy, thousands of wave-energy converter design concepts have been developed and patented (Falcão, 2010; Ning et al., 2015). These various technologies include oscillating buoys, pitching oscillating bodies, overtopping convertors, etc. (Falcão, 2010). Of all these designs, OWC (oscillating water column) devices are one of the most successful technologies. This is mainly due to their geometric and mechanical simplicity of operation, with few moving parts. However, for the traditional OWC devices, the hydrodynamic efficiency is still relatively low. With regard to the design and operating principles of wave energy converters, some reviews on these technologies can be found in Falnes (2007), Falcão (2010), Guedes Soares et al. (2012), and Cui et al. (2019). Specific OWC-WECs review studies have previously been performed by Heath (2012), Delmonte et al. (2016), and Falcão and Henriques (2016).
As a high-cost energy resource, improving the efficiency of wave energy converters is one of the important ways to reduce the operational expense and to ensure their acceptance as a viable technology. Applying the concept of cost sharing, some investigations proposed the integration of OWC-type devices into breakwater structures, thus having the dual function of damping wave forces and concurrently generating electricity (He et al., 2012, 2016; He and Huang, 2014; Mustapa et al., 2017; Xu and Huang, 2018; Zhao et al., 2019). On the other hand, some investigations have concentrated on methods to increase the hydrodynamic efficiency of the OWC devices. The main approach employed to augment the efficiency is usually by changing the geometric shape and structure of the OWC-WECs. A large number of numerical and experimental investigations focusing on the sea bottom profile, the chamber shape and the scale of the constituent parts of OWC devices have been carried out.
Ning et al. (2015) developed a two-dimensional (2-D) fully non-linear numerical wave flume (NWF) based on a time-domain higher-order boundary element method (HOBEM). This model used it to investigate the influence of the immergence and width of the front wall and the width of air chamber on the hydrodynamic performance of a fixed OWC wave energy device (Ning et al., 2016). Additionally, there have been some experimental models developed to investigate the hydrodynamic performance of OWC devices. Tseng et al. (2000) performed an experiment to investigate the hydrodynamic fluid behavior at a multi-resonant oscillating water column with an arc-shaped curve board in front of the caisson. Hong et al. (2007) investigated the influence of the geometry of a 2D OWC model on its hydrodynamic performance in their study of OWC devices. The hydrodynamic efficiency of a tilted OWC was studied experimentally by Dizadji and Sajadian (2011). Chang et al. (2016) developed an experiment to investigate the influence of the angle of the back wall, the front wall and the chamber width on the hydrodynamic performance of OWC devices. Mahnamfar and Altunkaynak (2017) performed some optimization analysis on the fixed OWC by changing the length and width of the air chamber and the angle of the chamber front wall. OWC-WECs with dual chambers were developed by He et al. (2017) and Ning et al. (2019) in their investigations to augment the operational efficiency of OWCs.
Rezanejad et al. (2013) used two dimensional, linear water wave theory to analyze the hydrodynamic efficiency of a fixed OWC with a stepped bottom. The observed analytical and numerical results were found to be in good agreement. Their results show that a suitable artificial step at the sea bottom may lead to a significantly increased capacity in power absorption by the device (Rezanejad et al., 2013). More recently, Rezanejad et al. (2015, 2016) investigated the dual chamber OWC device. Again, they incorporated the stepped sea bottom profile into their model. They investigated the hydrodynamic performance of the device and demonstrated that considerable improvements in the efficiency of the dual chamber OWC can be achieved by the addition of an appropriate step in the sea bottom. More recently, further experimental investigations were carried out to validate the numerical results as well as to investigate the efficiency improvements achieved through the addition of stepped sea bottom for various cases of incident wave heights and turbine damping (Rezanejad and Guedes Soares, 2018). They concluded that the device can be considered as a dual-mass oscillatory wave energy converter with significantly improved performance in comparison with conventional OWC device geometries (Rezanejad and Guedes Soares, 2018). However, in their study they focused on varying the wave conditions whilst maintaining an unaltered step geometry. Rezanejad et al. (2019) developed their numerical model using the 2D open source computational fluid dynamics (CFD) software package OpenFOAM to investigate the hydrodynamic performance and the influence of different incident wave height as well as the effects of damping by the power take-off unit on the performance of the device. They found that the numerical results for the hydrodynamic efficiency exhibit good agreement with the experimental data. Furthermore, they analyzed the power absorption mechanism as well as the flow pattern characteristics in the area adjacent to the step (Rezanejad et al., 2019). Hence, to extend the aforementioned studies, the aim of this research paper is to identify and investigate further the hydrodynamic behavior of the fluid flow at an OWC device with a stepped sea bottom using CFD simulations and various step geometries. This current research builds upon the previous research of Rezanejad and Guedes Soares (2018), as not only are various wave conditions considered but we also vary the step geometry for each of the various incident waves in our model.
The above reviews of papers show that the majority of the investigative research applies linear water wave theory to analyze the hydrodynamic performance of the OWC-WECs with a stepped bottom. However, the hydrodynamics of the wave interaction with an OWC device is complex and non-linear (Gkikas and Athanassoulis, 2014). Furthermore, previous investigations using OpenFOAM have not considered the influence of step height and step length on the hydrodynamic performance of the OWC devices. In this research, we consider the effects of non-linear waves interacting with the OWC device. The present study, based on the fully non-linear potential flow theory and higher-order boundary element method (HOBEM), numerically analyses the effects of the step geometrical parameters (i.e., the step height and step length) on the hydrodynamic performance of an OWC device.
The numerical model is described in section mathematical formulations. In section model verification the convergence verification and numerical validation of the model is presented. The influence of the step geometry on the hydrodynamic performance of the fixed OWC device are investigated in section numerical results. Conclusions are summarized in section conclusions.
Mathematical Formulations
A schematic diagram of the NWF (numerical wave flume) with a fixed OWC positioned at the right hand end is shown in Figure 1. A Cartesian coordinate system is established with the origin located at the edge of the damping zone on the undisturbed free surface where z = 0. The z-axis is positive in the upwards direction. As shown in Figure 1, h indicates the static water depth; a denotes the height and b the length of the stepped sea bottom, respectively; the width of the air duct orifice is represented by e, d is the immergence depth of the front wall, hc is the chamber height, B the chamber width and C is the OWC wall thickness. The corresponding boundary value problem defining the fluid motion is initiated letting t denote time and η the free surface elevation. The waves are generated by controlling the volume flux density of a vertical source distribution inside the model boundary (Brorsen and Larsen, 1987).
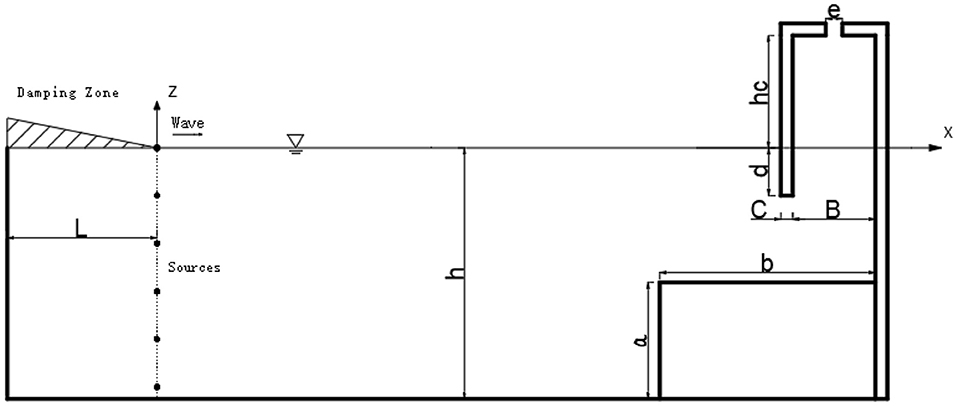
Figure 1. Sketch of the numerical wave flume.
In accordance with the potential flow model, it is assumed that the water is incompressible, inviscid, and the fluid flow is irrotational. Thus, the fluid motion can be described by a velocity potential φ (Ning et al., 2015). A two-dimensional fully non-linear numerical model developed using the potential flow theory and the time-domain HOBEM developed by Ning et al. (2015) is used to investigate the hydrodynamic performance of this stepped bottom OWC energy harvester. In the numerical simulation, the incident wave is generated by the inner-domain source, the strength of which is determined by the incident wave velocity. As shown in Figure 1, a wave damping region with a coefficient μ1(x) is implemented at the inlet of the numerical flume to absorb the waves that are reflected from the OWC device. The waves reflected from the structure can pass through the inner-domain sources (i.e., the wave generation surface) and are then dissipated at the damping zone region with minimal re-reflection. Therefore, governing equation is changed from the Laplace equation to the Poisson equation as follows
where ∇2 = ∂2/∂x2 + ∂2/∂z2 is the 2D Laplacian operator, and q*(xs, z, t) is the pulsating volume flux density of the internal wave generation source distribution, v is the horizontal flow velocity corresponding to the generated wave, xs is the horizontal location of the vertical inner domain source, and δ(x-xs) is the Dirac delta function.
In the previous study by Ning et al. (2016), an artificial viscous damping term with a coefficient μ2 was applied to the dynamic free surface boundary condition inside the OWC chamber. Then, the velocity potential also satisfied the following modified fully non-linear free surface boundary conditions
where φ is the velocity potential, X0 = (x0, 0) denotes the initial static position of the fluid, g is acceleration due to gravity, η is the free surface elevation, p is the fluid pressure and ρ is the density of the fluid. The damping coefficient μ1(x) is given by
where ω is the wave angular frequency, x1 is the horizontal location of the edge of the damping zone; L is the length of the damping zone. In the current study, the length of the damping zone is set to 1.5λ, where λ is the incident wavelength. The artificial viscous damping coefficient μ2 is determined by an optimization analysis and is only implemented at the free surface inside the OWC chamber.
At the free surface outside of the chamber, the air pressure p is set to zero (i.e., atmospheric pressure). Inside the chamber, the pneumatic pressure is given by
where Ddm is the quadratic pneumatic damping coefficient and Ud(t) denotes the airflow velocity through the ceiling orifice, Ning et al. (2019).
The domain boundaries at the tank base, the back wall and front wall are considered impermeable. Additionally, the walls forming the OWC structure are also considered solid. Therefore, the zero normal velocity condition is imposed on these boundaries as follows
where n is the outward unit normal vector at the solid boundary.
As Green's second identity is used throughout the fluid domain, the boundary value problem can be converted into the boundary integral equation (Cheng et al., 2018). In the present work, the mixed Eulerian-Lagrangian method is used to describe the evolution of the time-dependent free surface with moving nodes in both the horizontal and vertical directions. The fourth order Runge-Kutta method is used to update the wave surface and free surface velocity potential in the next time step.
The energy extracted by the OWC device from the incident waves in the numerical model can be calculated from
where T is the wave period, Q(t) is the volumetric air flux through the chamber orifice, B is the width of the chamber, is the time varying mean vertical velocity of the free surface at the interior of the chamber and A is free surface displacement inside the chamber. Further details regarding the development of the numerical model can be viewed in Ning et al. (2016).
According to linear wave theory, the average energy flux per unit width of the incident wave is expressed as follows
where Ai is the incident wave amplitude.
Thus, the hydrodynamic efficiency of an OWC device is given by.
Model Verification
It is necessary to conduct a convergence analysis on the numerical grid and on the time step discretisation to ensure confidence in both the accuracy and correct behavior of the model. To verify the present model we conduct a spatial and temporal discretisation convergence analysis. The length of the numerical flume is parametrically set to five times the wavelength (5.0 λ), of which 1.5 λ is used as the reflected wave damping zone at the left hand end of the flume. The OWC device has the same geometric parameters as described by Rezanejad et al. (2016). The static water depth h = 0.42 m, the air duct width e = 0.001 m, the front wall immersion draft d = 0.08 m, the air chamber height hc = 0.296 m, the chamber breadth B = 0.128 m and the OWC chamber wall thickness C = 0.02 m.
During the grid convergence, the size of the boundary elements in the horizontal and vertical directions are set as Δx and Δz = λ/20, λ/30, and λ/40, respectively, with a wave period T = 1.0 s and the wave amplitude Ai set to 0.02 m. The non-dimensionalized free surface elevation at the chamber center is show on Figure 2A, and the non-dimensionalized air pressure at the chamber is shown on Figure 2B. It can be observed from Figure 2A that the free surface elevation results have already converged at grid size Δx,Δz = λ/20, however the chamber pressure results converge at a mesh spacing of λ/30.
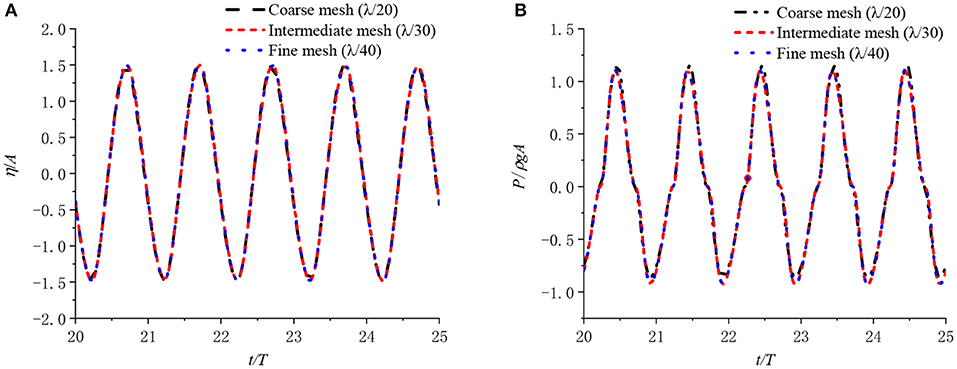
Figure 2. (A) The surface elevation at the chamber center and (B) the air pressure in the chamber for different spatial steps.
In conducting the temporal discretisation convergence, the time step is set as Δt = T/60, T/80, and T/90, also with the wave period set as T = 1.0 s. The corresponding results are shown in Figure 3. From the figure it can be seen that the results converge with the time step set to Δt = T/80.
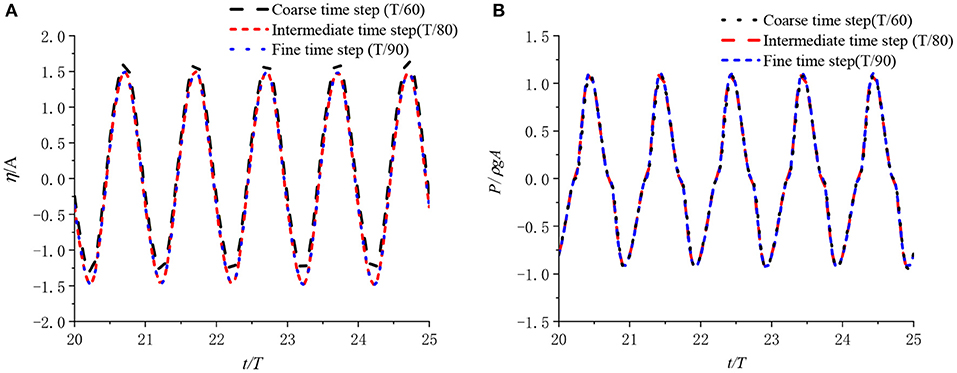
Figure 3. (A) The surface elevation at the chamber enter and (B) the air pressure in the chamber for different temporal steps.
After performing the spatial and temporal convergence analysis on the numerical grid and time step, the length of the boundary elements in the horizontal direction is set to Δx = λ/30 and the vertical direction element length is set to Δz = λ/30. For each simulation case, 30 wave periods are generated with a simulation time step of Δt = T/80.
Figure 4 shows an image of the wave profile along the wave flume with T = 1.0 s and t = 22T and 26T, respectively. It is shown that there is a good agreement between the two wave profiles, including the free surface elevation inside the chamber, at the weather side of the front wall and at the damping zone. Notably, the elevation of the reflected wave from the OWC device gradually tends to zero in damping zone. This confirms the wave absorbing ability of the damping zone.
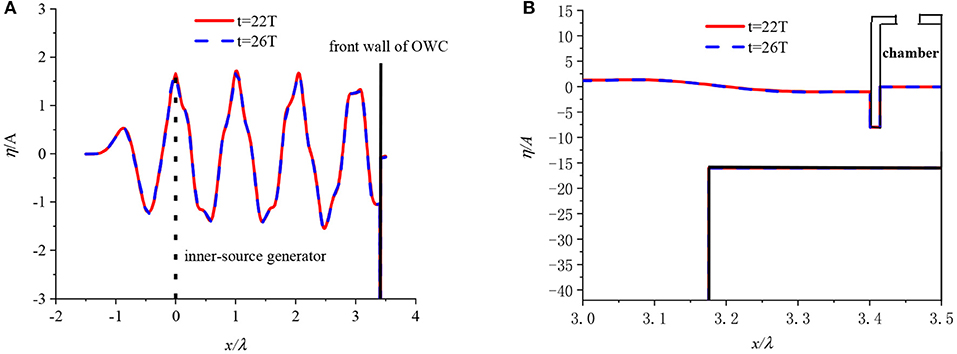
Figure 4. Image of free surface elevation along the wave flume at T = 1.0 s and t = 22T and 26T, respectively. (A) Overall view (B) enlarged view at stepped bottom.
In the model validation process, the model has been tested in regular wave conditions, with the period set from 1.0 s to 2.8 s and incident wave amplitudes from 0.01 m to 0.02 m. As the numerical model has been parametrically created, the length of the numerical flume varies in accordance to the varying wave period (wave flume length = 5.0λ). The viscous coefficient and the linear pneumatic damping coefficient in Equations (1) and (3) are set to μ2 = 0.57 and Cdm = 1.5, respectively. These coefficients are determined by a trial-and-error method and through correlation with the experimental study data from Ning et al. (2016). More details of this process can be found in Ning et al. (2016). Figure 5 presents the results from the model validation study.
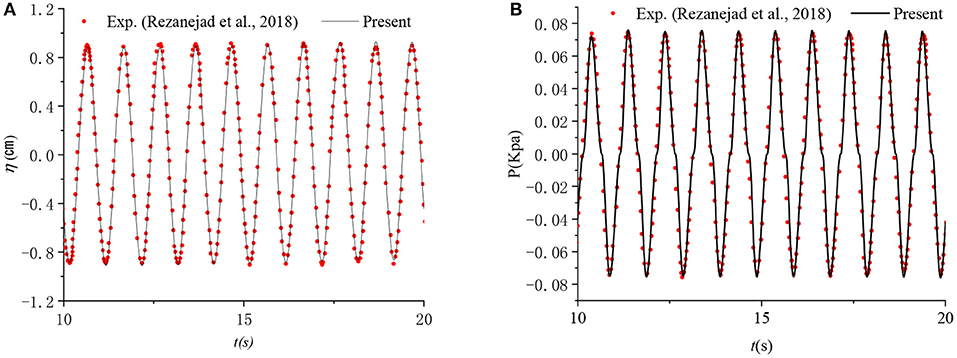
Figure 5. Time series of free surface elevation at the center of the chamber and oscillatory air pressure in the chamber. (A) Surface elevation in the chamber. (B) Air pressure in the chamber.
Figure 5A shows the time series for the free surface elevation recorded at the chamber center and Figure 5B displays the time series of air pressure in the chamber for the case of a = 0.26 m, b = 0.48 m, T = 1.0 s, and Ai = 0.02 m. From the figures, it can be seen that the present measurements show good agreement with the experiment results of Rezanejad and Guedes Soares (2018). Figure 6 presents the hydrodynamic efficiency, ξ, vs. the dimensionless infinite water-depth wave number Kh = khtanhkh (i.e., K = ω2/g) computed using the same values of a, b, T, and Ai. The comparison between the experimental data and the numerical data of the OpenFOAM model (Rezanejad and Guedes Soares, 2018) and the present numerical model are also shown in this figure. It can be observed that the present numerical model is in fair agreement with the experimental data in both the high and low frequency range but has a slight difference in the mid-frequency range, most noticeably between 0.7 ≤ Kh ≤ 1.2.
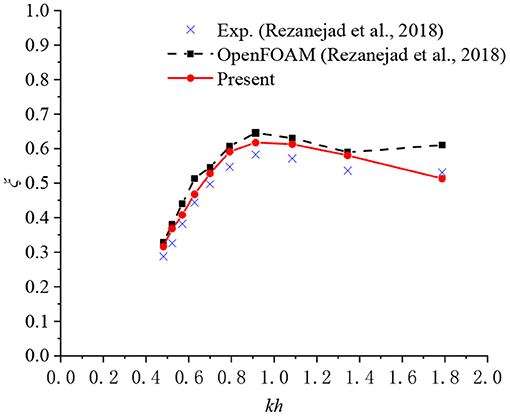
Figure 6. Hydrodynamic efficiency vs. dimensionless wave number.
Numerical Results
Influence of Geometrical Parameters of the Rectangular Step
In this section, the influence of the step geometrical parameters (i.e., the length and height of the step) on the free surface elevation and on the air pressure in the interior of the OWC chamber are analyzed.
Figure 7 shows the time series of the relative surface elevations at the center of the chamber and the air pressures in the chamber for step length b = 0.384 m (b/B = 3) and step height a = 0.273 m (a/h = 0.65) with different values of kh. From Figure 7A, it can be observed that a standing wave is generated and the free surface elevation at the chamber center increases with decreasing values of kh. It is shown that the maximum wave amplitude in the chamber can reach up to 2.08 times the incident wave amplitude when the value of kh = 0.57. This is because the incident waves with longer wavelength are more effectively transmitted through the front wall gap and into the OWC chamber. Moreover, the free surface elevation in the chamber can be further amplified due to the shallow water effect and sloshing effect. Figure 7B indicates that the air pressure in the chamber is at a maximum at kh = 1.08. This implies that the rate of air volume change in the chamber is greatest at kh = 1.08 which corresponds to the approximate resonant frequency as shown in Figure 11.
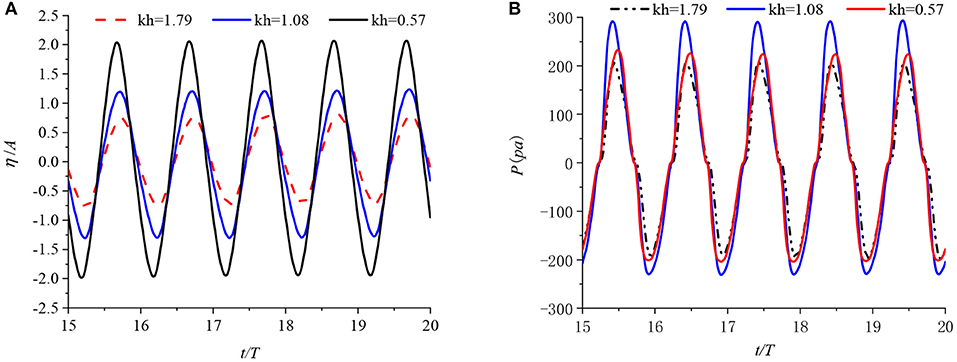
Figure 7. Time series of (A) the surface elevation at the chamber center and (B) the air pressure in the chamber.
Figure 8 shows the averaged maximum surface elevation and pressure crest (obtained by averaging 15 stable wave crests from 15 wave periods) vs. the dimensionless wave number kh for step height a = 0.21 m (a/h = 0.5) and four different relative step lengths b/B = 1, 2, 3, and 4. It is found that the free-surface elevation at the chamber center increases with the increase of step length b, however the influence is quite small. It can be observed that the dimensionless wave number has a large influence on free-surface elevation, which decreases as kh increases. However, the chamber air pressure exhibits a contrasting behavior. The air pressure increases with the elongation of the relative step length in the low frequency range, but the air pressure decreases in the high frequency range, most noticeably at b/B = 4. In addition, each relative step length b/B, yields the same qualitative behavior in chamber air pressure with a clearly identifiable peak pressure.
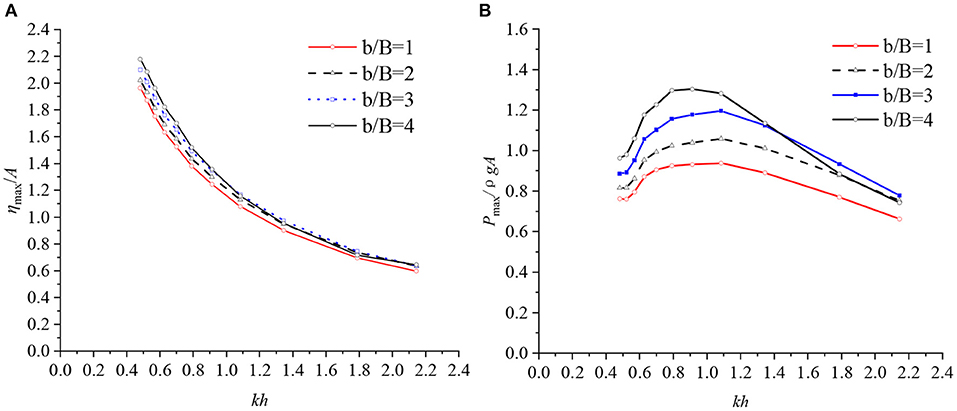
Figure 8. (A) Maximum surface elevation crest heights for different step lengths. (B) Maximum air pressure crest values for different step lengths.
Figure 9 presents the influence of the step length, b, on the hydrodynamic efficiency, ξ, with a/h = 0.5. These four relative step lengths of b/B = 1, 2, 3, and 4 correspond to step lengths of b = 0.128, 0.256, 0.384, and 0.512 m, respectively. The shortest step length does not extended past the external face of the front wall of the chamber. The hydrodynamic efficiency, ξ, increases with the increase of step lengths in the low-frequency region. However, the hydrodynamic efficiency, ξ, visibly decreases in the case of the longest step length in the high-frequency region. The resonant frequency shifts from a higher frequency region to a lower frequency region with the increases of step length where the step extends outside of the chamber. This phenomenon can be explained by the third resonance mechanism presented by Rezanejad et al. (2016) and by the approximated natural frequency formula calculated for the step extended beyond of the chamber front wall as follows
Figure 10 shows the averaged maximum surface elevation and pressure crest (which is obtained by averaging 15 stable crest from 15 wave periods) vs. the dimensionless wave number kh for four different relative step heights a/h = 0.2, 0.35, 0.5, and 0.65 with the step length b = 0.384 m (b/B = 3). It is shown that the free-surface elevation at the chamber center increases with the increase of step height a, but again the influence is small. The dimensionless wave number has a large influence on free-surface elevation and the elevation decreases as kh increases as shown in Figure 10A. However, once again the air pressure exhibits a contrasting behavior. The air pressure increases with increasing relative step height and for every relative step height a/h, there is a distinct peak pressure.
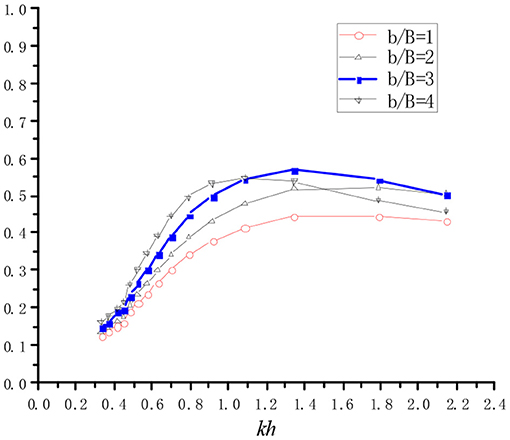
Figure 9. Hydrodynamic conversion efficiency vs. dimensionless wave number for different step length.
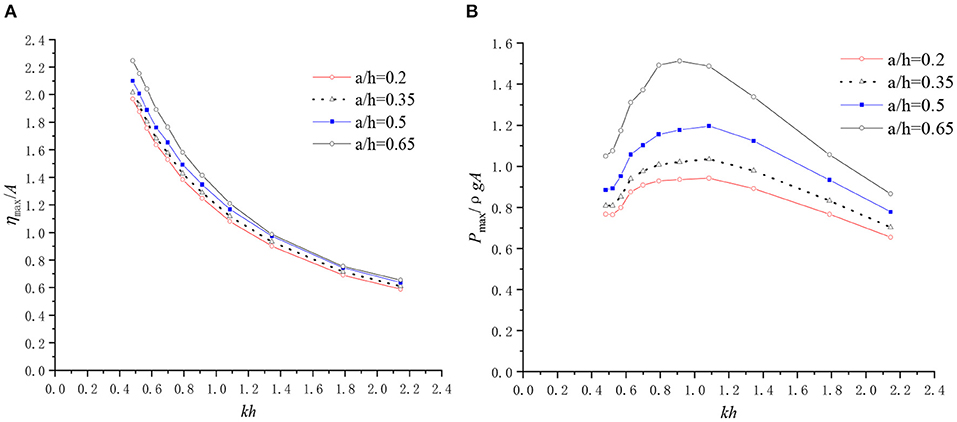
Figure 10. (A) The surface elevation crest. (B) The air pressure crest for different step heights.
Figure 11 shows the influence of the step height, a, on the hydrodynamic efficiency, ξ, with b/B = 3. These four relative step heights of a/h = 0.2, 0.35, 0.5, and 0.65 correspond to step heights a = 0.084, 0.147, 0.210, and 0.273 m, respectively. The hydrodynamic efficiency, ξ, increases with the increase in step heights in the analyzed wavelength region. This is due to the fact that the higher step can intensify the shallow water effect and enhance the piston like motion of the free surface in the chamber. The resonant frequency moves from a high frequency region to lower frequency region with the increases of step height. However, this shift in resonant frequency is slightly more sensitive to changes in step length as shown in Figure 9. This phenomenon can also be explained by the third resonance mechanism and the approximated natural frequency formula as demonstrated in Equation (9).
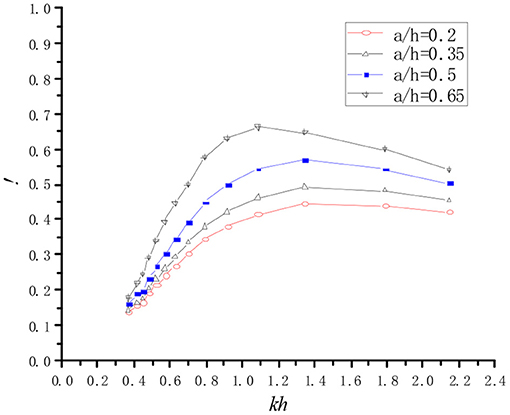
Figure 11. Hydrodynamic conversion efficiency vs. dimensionless wave number for different step heights.
Figure 12 shows the distribution of the free surface wave elevation along the numerical flume adjacent to the OWC chamber with kh = 1.345 and 0.914 at the same time instant. As kh increases, the wave trough and crest become sharper and the secondary harmonic wave becomes more obvious due to the strong non-linearity.
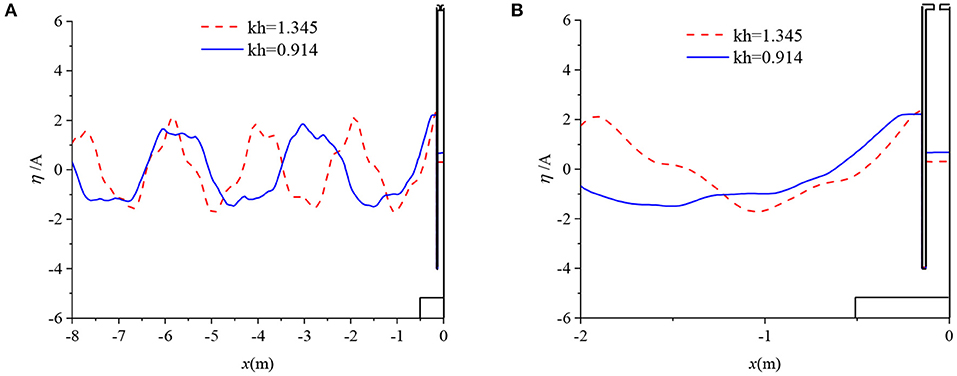
Figure 12. Image of wave elevation along the wave flume at a/h = 0.21, b/B = 4. (A) Overall view (B) local view.
Figures 13A,B show the non-dimensionalized time series of the free surface elevation measured at a location 1.8 m from the front face of the chamber wall and at the chamber center, respectively. It is clearly shown in Figure 13A that the non-linear HOBEM model can capture the higher order harmonic peaks outside the OWC chamber. However, because the pneumatic model that is used to simulate the flow of air thorough the orifice is a linear model, the interaction between the higher order wave harmonics (visible in Figure 13A) and the air pocket within the chamber cannot be captured. As a result, in the current model the higher order wave harmonics are not observed at the free surface within the OWC chamber. This effect is further discussed in Ning et al. (2016). Figures 14A,B presents the frequency spectra obtained by Fourier Transform for the free surface signals shown in Figures 13A,B, respectively. The existence of higher order wave harmonics is clearly shown in the signal recorded at the location 1.8 m outside the chamber front wall; however, there is an absence of these higher order harmonics in the wave signal observed at the OWC chamber center.
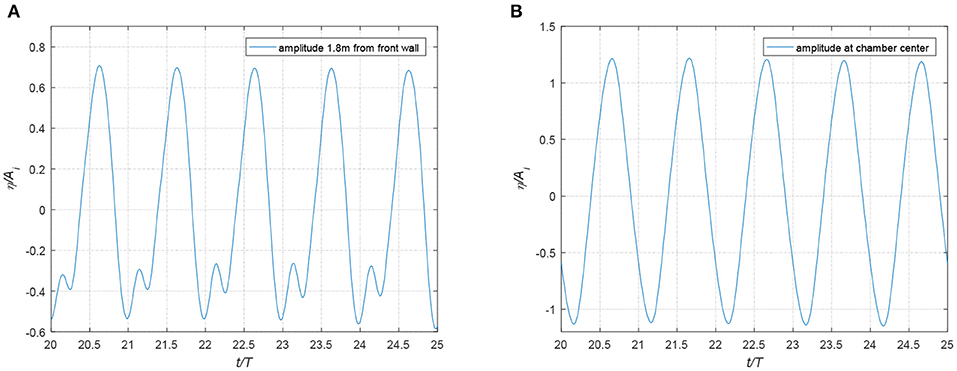
Figure 13. Non-dimensionalized free surface elevation (A) at a position 1.8 m from the front wall of OWC chamber (B) at the chamber center.
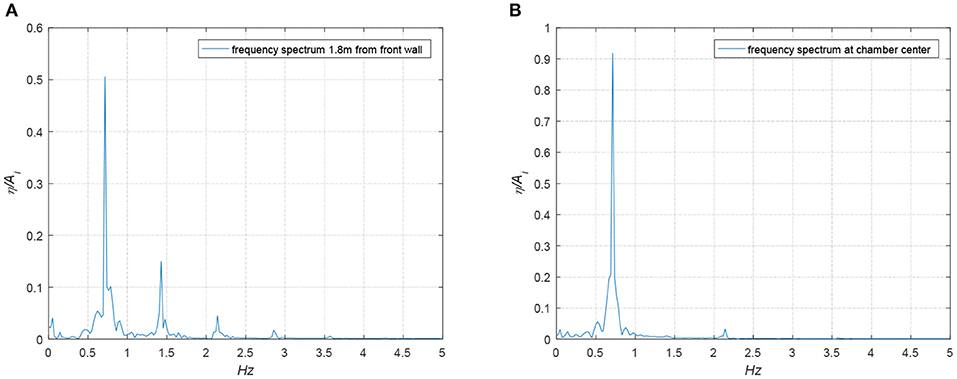
Figure 14. Spectral analysis of surface elevations (A) at a position 1.8 m from the front wall of OWC chamber (B) at the chamber center.
Conclusions
In the present work, the hydrodynamic performance of a fixed OWC wave energy converter with a stepped bottom is numerically investigated. Using the time-domain HOBEM, a 2D fully non-linear numerical wave flume with an OWC device having a stepped seabed was developed. This model was used to study the effects of the step geometric parameters on the OWC hydrodynamic efficiency, the free-surface development and the air pressure oscillations inside the OWC chamber. In the numerical simulation, the inner-source technique was used to generate the incident wave. A damping zone was defined to avoid wave re-reflection and the mixed Eulerian-Lagrangian technique with the 4th-order Runge-Kutta method was implemented as the time marching scheme. A linear relationship between the air pressure inside the chamber and the air velocity at the orifice was assumed to establish the pneumatic model. The numerical results indicate that the predictive free surface elevation at the chamber center, the air pressure inside the chamber and hydrodynamic efficiency agree well with the published experimental data.
In previous studies on OWCs in the stepped bottom condition, the research focused mainly on varying the incident wave conditions, and the subsequent effect on the OWC efficiency. These previous studies were conducted for a single step geometry. In the current investigation, the effects of varying the step length and step height on the hydrodynamic efficiency was examined for various wave conditions. It was found that as the step length increases, the resonant frequency shifts to a lower frequency region. This occurs only if the step is extended beyond to the chamber front wall. In contrast, when the step is situated inside of the chamber, the resonant frequency exhibits negligible variance. It is observed that there is an optimal relative step length of approximately b/B = 3.
It is demonstrated that the step height adjacent to the OWC has a significant influence on hydrodynamic efficiency in the analyzed wavelength range. With an increase in the step height, the resonant frequency shifts into a lower frequency region.
We have shown that the operational efficiency of an OWC can be increased through the introduction of a stepped bottom condition, and that the step has an optimal shape. In this research we demonstrated that the step length should be three times the chamber width for the particular OWC chamber geometry analyzed; however this finding may not hold for all OWC chamber geometries. Further research is currently ongoing into developing a relationship between optimized step topologies and various OWC chamber geometries.
Data Availability Statement
The datasets generated for this study are available on request to the corresponding author.
Author Contributions
D-ZN developed the concept and the design for the research work. SK performed the numerical analysis and data processing. RM compiled and wrote the final draft of the paper. CZ provided research guidance and advice. D-ZN, SK, RM, and CZ wrote sections of the manuscript. All authors contributed to the manuscript revisions, read, and approved the submitted version.
Funding
This work was supported by the National Key R&D Program of China (Grant No. 2018YFB151905) and National Natural Science Foundation of China (Grant No. 51679036).
Conflict of Interest
The authors declare that the research was conducted in the absence of any commercial or financial relationships that could be construed as a potential conflict of interest.
References
Brorsen, M., and Larsen, J. (1987). Source generation of nonlinear gravity waves with the boundary integral equation method. Coast. Eng. 11, 93–113. doi: 10.1016/0378-3839(87)90001-9
Carballo, R., and Iglesias, G. (2013). Wave farm impact based on realistic wave-WEC interaction. Energy 51, 216–229. doi: 10.1016/j.energy.2012.12.040
Chang, C., Chou, F. N. F., Chen, Y., Hsieh, Y., and Chang, C. (2016). Analytical and experimental investigation of hydrodynamic performance and chamber optimization of oscillating water column system. Energy 113, 597–614. doi: 10.1016/j.energy.2016.06.117
Cheng, Y., Ji, C. Y., Zhai, G. J., and Oleg, G. D. (2018). Numerical investigation of water entry of a wedge into waves with current effects using a fully nonlinear HOBEM. Ocean Eng. 153, 33–52. doi: 10.1016/j.oceaneng.2018.01.092
Cui, Y., Liu, Z., Zhang, X., and Xu, C. (2019). Review of CFD studies on axial-flow self-rectifying turbines for OWC wave energy conversion. Ocean Eng. 175, 80–102. doi: 10.1016/j.oceaneng.2019.01.040
Delmonte, N., Barater, D., Giuliani, F., Cova, P., and Buticchi, G. (2016). Review of oscillating water column converters. IEEE T. Ind. Appl. 52, 1698–1710. doi: 10.1109/TIA.2015.2490629
Dizadji, N., and Sajadian, S. E. (2011). Modeling and optimization of the chamber of OWC system. Energy 36, 2360–2366. doi: 10.1016/j.energy.2011.01.010
Falcão, A. F. D. O. (2010). Wave energy utilization: a review of the technologies. Renew. Sust. Energ. Rev. 14, 899–918. doi: 10.1016/j.rser.2009.11.003
Falcão, A. F. O., and Henriques, J. C. C. (2016). Oscillating-water-column wave energy converters and air turbines: a review. Renew. Energ. 85, 1391–1424. doi: 10.1016/j.renene.2015.07.086
Falnes, J. (2007). A review of wave-energy extraction. Mar. Struct. 20, 185–201. doi: 10.1016/j.marstruc.2007.09.001
Gkikas, G. D., and Athanassoulis, G. A. (2014). Development of a novel nonlinear system identification scheme for the pressure fluctuation inside an oscillation water column-wave energy convertor part I: theoretical background and harmonic excitation case. Ocean Eng. 80, 84–99. doi: 10.1016/j.oceaneng.2013.05.028
Guedes Soares, C., Bhattacharjee, J., Tello, M., and Pietra, L. (2012). Review and Classification of Wave Energy Converters. Lisbon: CRC Press/Balkema. doi: 10.1201/b12726-82
He, F., and Huang, Z. (2014). Hydrodynamic performance of pile-supported OWC-type structures as breakwaters: an experimental study. Ocean Eng. 88, 618–626. doi: 10.1016/j.oceaneng.2014.04.023
He, F., Huang, Z., and Wing-Keung Law, A. (2012). Hydrodynamic performance of a rectangular floating breakwater with and without pneumatic chambers: an experimental study. Ocean Eng. 51, 16–27. doi: 10.1016/j.oceaneng.2012.05.008
He, F., Leng, J., and Zhao, X. (2017). An experimental investigation into the wave power extraction of a floating box-type breakwater with dual pneumatic chambers. Appl. Ocean Res. 67, 21–30. doi: 10.1016/j.apor.2017.06.009
He, F., Li, M., and Huang, Z. (2016). An experimental study of pile-supported OWC-type breakwaters: energy extraction and vortex-induced energy loss. Energies 9:540. doi: 10.3390/en9070540
Heath, T. V. (2012). A review of oscillating water columns. Philos. Trans. A Math. Phys. Eng. Sci. 370, 235–245. doi: 10.1098/rsta.2011.0164
Hong, K., Shin, S., Hong, D., Choi, H., and Hong, S. (2007). “Effects of shape parameters of OWC chamber in wave energy absorption,” in International Offshore and Polar Engineering Conference Proceedings (Lisbon), 428–433.
Khan, N., Kalair, A., Abas, N., and Haider, A. (2017). Review of ocean tidal, wave and thermal energy technologies. Renew. Sust. Energ. Rev. 72, 590–604. doi: 10.1016/j.rser.2017.01.079
Mahnamfar, F., and Altunkaynak, A. (2017). Comparison of numerical and experimental analyses for optimizing the geometry of OWC systems. Ocean Eng. 130, 10–24. doi: 10.1016/j.oceaneng.2016.11.054
Mustapa, M. A., Yaakob, O. B., Ahmed, Y. M., Rheem, C. K., Koh, K. K., and Adnan, F. A. (2017). Wave energy device and breakwater integration: a review. Renew. Sust. Energ. Rev. 77, 43–58. doi: 10.1016/j.rser.2017.03.110
Ning, D., Shi, J., Zou, Q., and Teng, B. (2015). Investigation of hydrodynamic performance of an OWC (oscillating water column) wave energy device using a fully nonlinear HOBEM (higher-order boundary element method). Energy 83, 177–188. doi: 10.1016/j.energy.2015.02.012
Ning, D., Wang, R., Chen, L., and Sun, K. (2019). Experimental investigation of a land-based dual-chamber OWC wave energy converter. Renew. Sust. Energ. Rev. 105, 48–60. doi: 10.1016/j.rser.2019.01.043
Ning, D., Wang, R., Zou, Q., and Teng, B. (2016). An experimental investigation of hydrodynamics of a fixed OWC wave energy converter. Appl. Energ. 168, 636–648. doi: 10.1016/j.apenergy.2016.01.107
Palha, A., Mendes, L., Fortes, C. J., Brito-Melo, A., and Sarmento, A. (2010). The impact of wave energy farms in the shoreline wave climate: Portuguese pilot zone case study using Pelamis energy wave devices. Renew. Energ. 35, 62–77. doi: 10.1016/j.renene.2009.05.025
Rezanejad, K., Bhattacharjee, J., and Guedes Soares, C. (2013). Stepped sea bottom effects on the efficiency of nearshore oscillating water column device. Ocean Eng. 70, 25–38. doi: 10.1016/j.oceaneng.2013.05.029
Rezanejad, K., Bhattacharjee, J., and Guedes Soares, C. (2015). Analytical and numerical study of dual-chamber oscillating water columns on stepped bottom. Renew. Energ. 75, 272–282. doi: 10.1016/j.renene.2014.09.050
Rezanejad, K., Bhattacharjee, J., and Soares, C. G. (2016). Analytical and numerical study of nearshore multiple oscillating water columns. J. Offshore Mech. Arct. Eng. 138, 021901-1–021901-7. doi: 10.1115/1.4032303
Rezanejad, K., Gadelho, J. F. M., and Guedes Soares, C. (2019). Hydrodynamic analysis of an oscillating water column wave energy converter in the stepped bottom condition using CFD. Renew. Energ. 135, 1241–1259. doi: 10.1016/j.renene.2018.09.034
Rezanejad, K., and Guedes Soares, C. (2018). Enhancing the primary efficiency of an oscillating water column wave energy converter based on a dual-mass system analogy. Renew. Energ. 123, 730–747. doi: 10.1016/j.renene.2018.02.084
Tseng, R., Wu, R., and Huang, C. (2000). Model study of a shoreline wave-power system. Ocean Eng. 27, 801–821. doi: 10.1016/S0029-8018(99)00028-1
Veigas, M., López, M., and Iglesias, G. (2014). Assessing the optimal location for a shoreline wave energy converter. Appl. Energ. 132, 404–411. doi: 10.1016/j.apenergy.2014.07.067
Xu, C., and Huang, Z. (2018). A dual-functional wave-power plant for wave-energy extraction and shore protection: a wave-flume study. Appl. Energ. 229, 963–976. doi: 10.1016/j.apenergy.2018.08.005
Keywords: oscillating water column, efficiency, stepped bottom, optimization, numerical simulation
Citation: Ning D-Z, Ke S, Mayon R and Zhang C (2019) Numerical Investigation on Hydrodynamic Performance of an OWC Wave Energy Device in the Stepped Bottom. Front. Energy Res. 7:152. doi: 10.3389/fenrg.2019.00152
Received: 22 October 2019; Accepted: 06 December 2019;
Published: 20 December 2019.
Edited by:
Siming Zheng, University of Plymouth, United KingdomReviewed by:
Bingyong Guo, Maynooth University, IrelandXuanlie Zhao, Harbin Engineering University, China
Copyright © 2019 Ning, Ke, Mayon and Zhang. This is an open-access article distributed under the terms of the Creative Commons Attribution License (CC BY). The use, distribution or reproduction in other forums is permitted, provided the original author(s) and the copyright owner(s) are credited and that the original publication in this journal is cited, in accordance with accepted academic practice. No use, distribution or reproduction is permitted which does not comply with these terms.
*Correspondence: Robert Mayon, rmayon@dlut.edu.cn