Assessing Embodied Carbon Emission and Its Intensities in the ICT Industry: The Global Case
 Xiucheng Dong1,2
  Jianda Wang
- 1School of International Trade and Economics, University of International Business and Economics, Beijing, China
- 2UIBE Belt & Road Energy Trade and Development Center, University of International Business and Economics, Beijing, China
With the intensification of globalization, the information and communication technologies (ICT) sector, as one of the emerging industrial sectors, has played an important role in reducing carbon emissions in regional trade and improving the energy efficiency of traded products. This article uses a multi-regional input-output (MRIO) model to explore the flow of embodied carbon emissions and embodied carbon emission intensities in the ICT sector triggered by trade in 15 major economies around the world from 2000 to 2014. The article further discusses the emission-reduction strategies of each ICT sector. The results show that: (1) The overall embodied carbon emissions of ICT have demonstrated a significant downward trend, but the proportion of embodied carbon emissions caused by trade is increasing; (2) The embodied carbon emissions in the ICT sector of most developed countries in 2014 are significantly lower than in 2000, but in developing countries such as China and India they show an upward trend during this period; (3) The ICT sector’s export embodied carbon emission intensity in Indonesia is much higher than that of other countries, and the embodied carbon emissions of ICT exported by Mexico have increased significantly; (4) The manufacture of computer, electronic and optical products (S1) is the main contributor to the ICT sector’s embodied carbon emissions, while import embodied carbon emission intensities among publishing activities (S2) are increasing significantly in most countries. The conclusion of this paper has important implications for how to reduce ICT’s embodied carbon emissions of major countries.
Introduction
With global warming and frequent disasters, countries are increasingly starting to realize the severity of climate change (Sun et al., 2020; Hou et al., 2021). Studies have shown that carbon dioxide (CO2), as the most important greenhouse gas, has always been the main influencing factor of global warming, and has caused the global temperature to rise by nearly 1°C since the pre-industrial era (Peters et al., 2019; Tiwari et al., 2021). The continuous increase in CO2 emissions is the result of an increase in global energy demand associated with the growth in global trade (Li and Hewitt, 2008; Lu et al., 2020). Peters and Hertwich (2008) indicate that carbon emissions caused by globally traded products accounted for 21.5% of global emissions. Wu et al. (2020) also point out that the transfer of emissions embodied in interregional trade comprises around 40% of global carbon emissions.
Many scholars are also actively exploring corresponding emission reduction strategies, including the use of clean energy or renewable energy to replace fossil fuels (Dong et al., 2017, 2018, Dong K. et al., 2020), optimizing the industrial structure (Dong et al., 2019, Dong B. et al., 2020; Zhu and Zhang, 2021), and increasing energy efficiency (He et al., 2021; Xu and Tan, 2021). Some scholars have also proposed that technological innovation can help industrial sectors achieve low-carbon development while taking into account economic improvement (Zhang et al., 2016; Wang R. et al., 2020). As a new type of industry, the information and communication technologies (ICT) industry can partially replace high-energy-consuming products, and its success in this respect and its ability to reduce carbon emissions and use energy efficiently have received widespread attention from scholars. Moyer and Hughes (2012) believe ICT can improve economic productivity, reduce energy intensity, and exert downward pressure on renewable energy costs. Global Energy Statistical Yearbook (2014) also points out that ICT have an important role to play in reducing the energy intensity and increasing energy efficiency of the economy.
However, ICT are facing issues of uneven development among regions, and even a digital divide (Anwar, 2019; Wang et al., 2021). The process of globalization and the imbalance of regional development will cause the rapid promotion of international trade. The ICT sector will flow from regions with developed industries to regions with immature ICT technology. Vogiatzoglou (2009) points out that exports of ICT products have persistently accounted for 15% of global commodity exports in the past decade. Meanwhile, trade products have also triggered the flow of carbon emissions. Since the establishment of the World Trade Organization (WTO) in 1995, policy makers have considered the impact of international trade on the economy, and have increasingly investigated its impact on the environment (Honma and Yoshida, 2020). As an important component of international trade, ICT not only promotes economic growth, but also causes a large amount of carbon emission transfer and flow (Azam et al., 2021). With the liberalization of international trade, some scholars have also highlighted an increasing transfer of CO2 emissions from developed countries to developing countries (Schaeffer and de Sá, 1996).
Although many scholars have studied the relationship between the ICT industry and carbon emissions (Moyer and Hughes, 2012; Amri et al., 2019; Shahnazi and Dehghan Shabani, 2019; Zhou et al., 2019; Nguyen et al., 2020), few scholars have conducted in-depth research on carbon emissions caused by the flow of products in the ICT sector caused by global trade. As the ICT industry is one of the important global development sectors in the future (Li et al., 2019), it is necessary to measure its embodied carbon emissions flow and embodied carbon emission intensities, and provide corresponding cross-regional emission reduction strategies. Therefore, this paper uses a multi-regional input-output (MRIO) model to explore the flow and network relationships of embodied carbon emissions and intensities by trade in the ICT sector of the world’s major economies, and proposes emission reduction strategies for each country.
Above all, three main features distinguish this study from previous studies and contribute to filling the gap in the literature. First, we explore the embodied carbon emissions of the global ICT industry and the embodied carbon emissions of imports and exports of major economies, which is necessary to understand the developing trend and emission reduction direction of the global ICT industry; Second, we measure the mutual flow and intensities of embodied carbon emissions among major economies in the world, which can better evaluate the embodied carbon emissions in export and import, and conducive to the policy formulation and negotiation of cross-regional carbon emission reduction; Third, the embodied carbon emissions and intensities of various ICT industries have also been calculated by this study, which shows heterogeneity in the ICT sector’s carbon emissions and provides a good reference for government to formulate emission-reduction strategies for enterprises.
This paper is structured as follows: Section “Literature review” organizes the literature on the relationship between embodied carbon emissions, intensities and ICT sectors. Section “Methodology and data” presents the methodology and data. Section “Results and discussion” analyzes the global carbon emissions and intensities in 15 major economies. Section “Further discussion” provides further analysis of the emissions and intensities of each ICT sector. Section “Conclusions and policy implications” addresses the policy implications and concludes the paper.
Literature Review
Due to the rise of the ICT sector in recent years and the intensification of digital activities on a global scale, scholars have increasingly started to pay attention to research on the relationship between the ICT sectors and global embodied carbon emissions. This study intends to discuss the extant literature under two strands of research: (1) Studying the relationship between carbon emissions and ICT sectors; and (2) studying the relationship between carbon emission intensity and ICT sectors.
Carbon Emissions and ICT Sectors
Information and communication technologies contributes substantially to global greenhouse gas (GHG) pollutant emissions, but scant research has quantified the impact of ICT products on carbon emissions. From the perspective of the products themselves, the types of ICT products included are very complex, and traditional industries also include many ICT sector products, making quantification difficult (Teehan and Kandlikar, 2013). However, with the development of digital industries and the intensification of the global greenhouse effect, more and more scholars have started to pay attention to the impact of the ICT industry on carbon emissions.
Some scholars analyze the embodied carbon emissions of the ICT sector of specific countries. Zhou et al. (2019) summarize China’s embodied carbon emissions of ICT and point out that the ICT sector is far from being environment friendly while considering its embodied carbon impacts, which are dozens of times greater than the direct impacts. Shahnazi and Dehghan Shabani (2019) analyze the correlation between the development of the ICT industry and carbon emissions in Iran’s provinces, and their results show that an increase in ICT in a province first leads to an increase and then a decrease in CO2 emissions in other provinces. Due to the prominence of the ICT sectors of some developed countries and the associated advantages of ICT for economic development, these countries have become a good target for many scholars to study ICT and embodied carbon emissions growth (Malmodin et al., 2014; Malmodin and Lundén, 2016). For example, Malmodin and Lundén (2016) conduct a detailed study of embodied carbon emissions of the ICT sector in Sweden from 1990 to 2015. They point out that although the embodied carbon emissions of the ICT sectors in that country have decreased since their peak in 2010, embodied carbon emissions from their manufacturing processes abroad are the largest source of ICT-related carbon emissions in Sweden.
Some scholars have expanded their research to the global region and analyze the relationship between the development of the global ICT industry and the impact of carbon emissions, and quantified the potential reduction of emissions in ICT (Moyer and Hughes, 2012; Bastida et al., 2019). Malmodin and Bergmark (2015) explore possible reductions globally within a 2030 timeframe, and predict a potential reduction of total GHG emissions by 2030 of about 8 Gtonnes CO2 or 12% of global GHG emissions due to ICT solutions. Asongu (2018) investigates how ICT counteracts the negative influence of globalization on CO2 emissions in his study of 44 Sub-Saharan African countries over the period 2000–2012. The author finds that ICT can be employed to dampen the potentially negative effect of globalization on environmental degradation through CO2 emissions. Malmodin and Lundén (2018) analyze carbon emissions of the global ICT sectors for 2010-2015, and point out that the ICT sectors have turned their previously growing carbon footprints into shrinking ones.
However, related research on the embodied carbon emissions of the ICT sector caused by global trade is relatively insufficient. With the rapid development of globalization and the systematic construction of global industrial chains and value chains, this will be a very important component.
Carbon Emission Intensities and ICT Sectors
Energy intensity and carbon emission intensity are two important indicators for studying the environmental impact of industries. Some scholars are concerned about the interaction between the ICT industry and energy intensity. And the Global Energy Statistical Yearbook (2014) points out that the ICT industry plays an important role in reducing energy intensity and improving industrial efficiency, but few scholars pay attention to the energy intensity of the ICT industry itself. Wang and Han (2016) study the impact of ICT on energy intensity in China, and point out that the impact of ICT investment in energy intensity is significantly negative in western and central regions in China.
However, relatively speaking, the intensity of carbon emissions caused by energy is more representative and has been widely studied by scholars (Pan et al., 2019; Liu et al., 2021a). However, research on carbon emission intensity and ICT-related research is relatively rare, and we can only find some relevant evidence in some research on the industrial framework or emerging technology industry. For example, Liu et al. (2021b) have shed light on the effect of Artificial Intelligence (AI) on carbon emission intensity. Their results show that AI tends to have a greater effect in reducing carbon emission intensity in the labor-intensive and tech-intensive industries. Chen et al. (2019) investigate the impact of ICT on CO2 emission intensity by using Internet penetration and mobile phone penetration as proxies in China, and point out that the reduction effect of Internet penetration on CO2 emission intensity in China’s eastern and central provinces is more obvious. In contrast with the reduction effect of Internet penetration on CO2 emission intensity in China’s eastern provinces, it is greater in China’s central provinces.
Few scholars have demonstrated concern about the intensive impact of global embodied carbon emissions. Although Jiang and Liu (2015) quantify the flow of embodied carbon emissions from the global ICT industry and trade, they do not highlight the impact of trade intensity under the global value chain system, and the research period is relatively lagging. This article will build a research framework on embodied carbon emissions and carbon emission intensities of global ICT trade in the context of global value chains. The paper will also analyze the volume and technical advantages and disadvantages of major economies’ embodied carbon emissions, and recommend cross-regional emission-reduction strategies.
Furthermore, we will absorb the research experience of the above-mentioned scholars, based on previous studies on carbon emissions and carbon emission intensities in the ICT industry, and expand the analysis of embodied carbon emissions and the measurement of embodied carbon emission intensities from the perspective of global value chains in major economies around the world. Furthermore, this study will explore in detail the dynamic changes of the embodied carbon emissions and intensities of each ICT sector.
Methodology and Data
Multiregional Input–Output Model
The basic methodology used in this study is the multi-regional input-output (MRIO) model from the perspective of both the environment and the global value chain. This model put forward by Moses (1955), can depict economic links among regions. The row equivalent of the MRIO can be expressed as:
Where is denoted as the total output of sector i in region r. is the direct requirement coefficient of sector i in region r for sector j in region s, which can be calculated by , and is the intermediate use of sector i in region r for sector j in region s; is the final demand of region s by sector i in region r. And the basic model of MRIO can be expressed in matrix form:
where , , .
And we define as the carbon emission intensity generated by the unitary output of sector i in region r. Embodied carbon emissions of an economy can be expressed as:
where , the embodied carbon emissions from sector i in region r to sector j in region s can be calculated as:
Therefore, the element of domestic embodied carbon emissions diagonal matrix can be calculated as:
The element of export embodied carbon emissions from sector i in region r to sector j to region s can make up the export embodied carbon emissions matrix , which can be represented as:
The element of import embodied carbon emissions from sector i in region r to sector j to region s can make up the import embodied carbon emissions matrix , which can be represented as:
Next, we define as the value-added coefficients generated by the unitary output of sector i in region r, which can be calculated by , where denotes the value added of sector i in region r. According to the global value flow analysis method (Fan et al., 2021), the element of embodied value-added cross countries matrix can be calculated as:
And the element of embodied carbon emission intensity of sector i in region r flowing into sector j in region s can make up the matrix , which can be calculated as:
Similarly, the domestic embodied carbon emission intensity of sector i in region r can make up the diagonal matrix , which can be calculated as:
The export embodied carbon emission intensity of sector i in region r can make up the diagonal matrix , which can be calculated as:
And the export carbon emission intensity from region r to region s can be calculated as:
The import embodied carbon emission intensity of sector i in region r can make up the diagonal matrix , which can be calculated as:
And the import carbon emission intensity from region r to region s can be calculated as:
Data
Here we will use the MRIO model to measure the embodied carbon emissions of global ICT sectors. The World Input–output tables coming from the World Input–output database (WIOD) are released in 2016. The 2016 version covers 43 countries for the period 2000–2014 (Timmer et al., 2015). We have selected 15 major countries as the research objects of this study, and other countries are classified as other countries (ROW)1, the country names and abbreviations are shown in Table 1. In order to make comparative prices, the multiregional input–output tables are processed at constant 2010 prices, and use a double-shrink method to select the price indexes for each sector’s products (Miller and Peter, 2009). The price indexes are selected as the consumer price index of countries from the World Bank (2020). And the data of the 56 sectors are classified according to the International Standard Industrial Classification Revision 4 (ISIC Rev.4). We select five sectors as ICT departments, including one ICT manufacturing sector and four ICT service sectors, which are shown in Table 2.
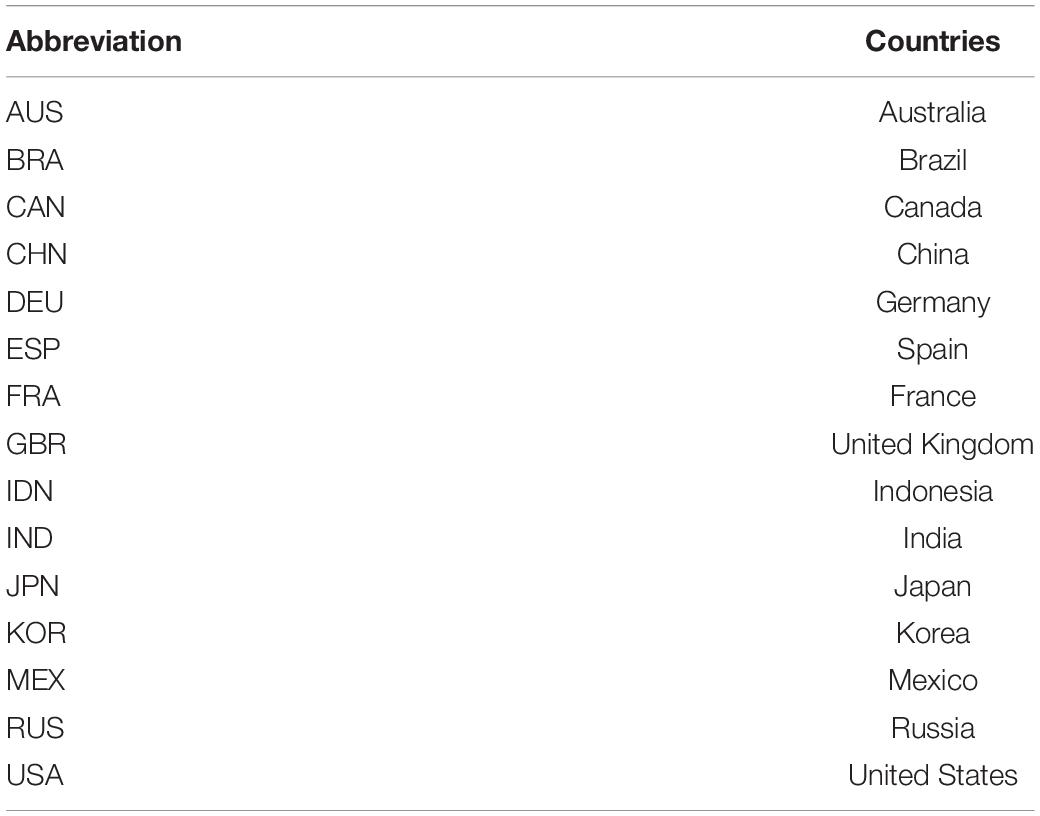
Table 1. Major countries and their abbreviations.
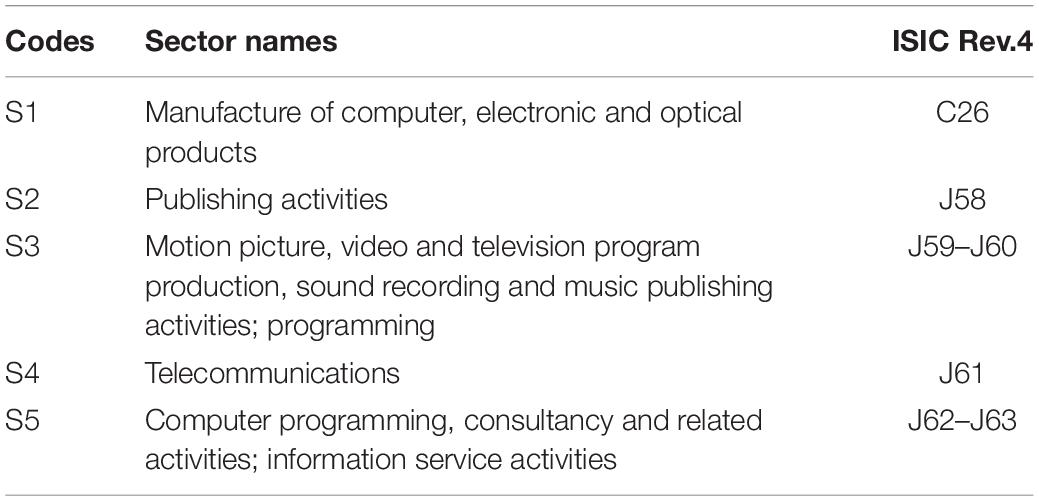
Table 2. Information and communication technologies sectors in WIOD.
The direct carbon emissions come from Corsatea et al. (2019), and the data fit perfectly with WIOD and are applied to this study.
Results and Discussion
Global ICT Embodied Carbon Emissions
Calculated based on Eq. (3), the embodied carbon emissions of global ICT sectors and their proportion of global embodied carbon emissions have been shown in Table 3. In 2001, the embodied carbon emissions of the ICT sectors reach their highest point – 118.16 Mt. Since then, carbon emissions have been reduced year by year. In 2009, affected by the financial crisis, the embodied carbon emissions of ICT reach a historical low of 89.86 Mt. After 2009, there is a slight increase in ICT’s carbon emissions. From the perspective of the percentage of ICT’s embodied carbon emissions, there is a decreasing trend year by year after 2001, from 0.53% in 2001 to 0.30% in 2014.
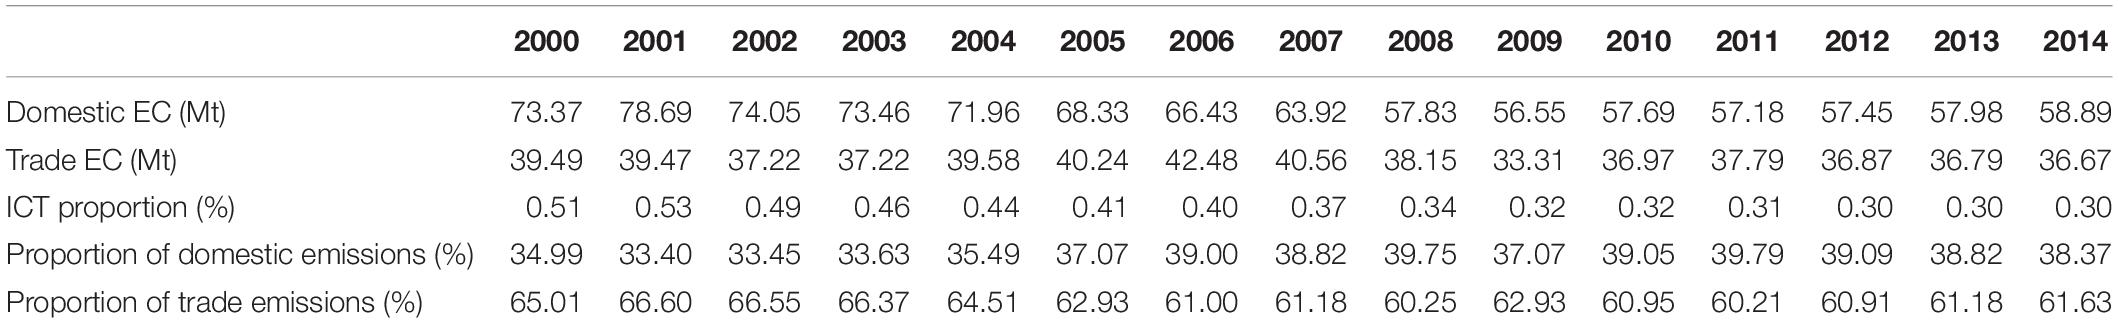
Table 3. Information and communication technologies domestic and trade carbon emissions and its proportion.
From the perspective of the composition of embodied carbon emissions, domestic embodied carbon emissions accounted for the main part of ICT’s embodied carbon emissions, reaching 58.89 Mt in 2014, and accounting for 61.63%. Although trade-embodied carbon emissions are not a major component, their share has been slowly increasing, from 34.99% in 2000 to 38.37% in 2014. With the gradual expansion of the ICT sectors, the carbon emissions caused by their trade will gradually occupy the main part.
Domestic, Export, and Import Embodied Carbon Emissions and Intensities of Major Countries
Embodied Carbon Emissions
Figure 1 shows the ICT’s embodied carbon emissions [calculated by Eqs. (5–7)] and embodied carbon emission [calculated by Eqs. (10–11) and Eq. (13)] intensities of 15 major countries in 2000 and 2014. From the perspective of ICT’s embodied carbon emissions, the amount of ICT emissions in most developed countries reduces significantly in 2014. For example, domestic, export, and import embodied carbon emissions of ICT in France decreased from 4.56, 1.70, and 1.44 Mt in 2000 to 0.82, 0.41, and 1.30 Mt in 2014, respectively. The ICT’s domestic, export and import embodied carbon emissions of the United States decreased from 30.34, 6.40, and 9.41 Mt in 2000 to 20.09, 3.08, and 6.31 Mt in 2014. Even so, the United States has the highest embodied carbon emissions of ICT in the world, which reflects its leading role and considerable investment in internal communications technology on a global scale (Adedoyin et al., 2020). However, some developing countries, such as China, India, Brazil, etc., have shown an increase trend in embodied carbon emissions. For example, China’s domestic and export embodied carbon emissions of ICT increase from 3.12 and 2.39 Mt in 2000 to 6.37 and 7.24 Mt in 2014. India’s export and import embodied carbon emissions of ICT increase from 0.31 and 0.43 Mt in 2000 to 1.22 and 0.52 Mt in 2014, respectively. Brazil’s domestic and import embodied carbon emissions of ICT also increase from 1.19 and 0.57 Mt in 2000 to 1.65 and 0.78 Mt in 2014, respectively. This reflects that these countries are at an important stage of economic development, and are in the process of rapid expansion, although their new technologies and digital industry technologies are not fully mature (Wang H. et al., 2020; Sahoo et al., 2021). Nevertheless, the growth of these countries’ ICT industries is reflected in their domestic and export products, which have increased embodied carbon emissions. The China Academy of Information and Communications Technology (CAICT) reports that China’s digital economy accounted for 34.8% of GDP in 2018, and 36.2% in 2019 (CAICT, 2020). And according to a report by McKinsey in 2017, China has been one of the world’s largest investors and adopters of digital technologies. For example, there are 731 million Internet users in 2016 in China, which is 1.7 times as many users as there are in India and the European Union, and 2.5 times as many users as there are in the United States that year (McKinsey, 2017). China’s export embodied carbon emissions of ICT in 2014 surpass the domestic embodied carbon emissions, and become the main growth force of its ICT embodied carbon emissions. In the future, as China’s technology continues to improve, export embodied carbon emissions will become China’s main source of carbon emissions growth.
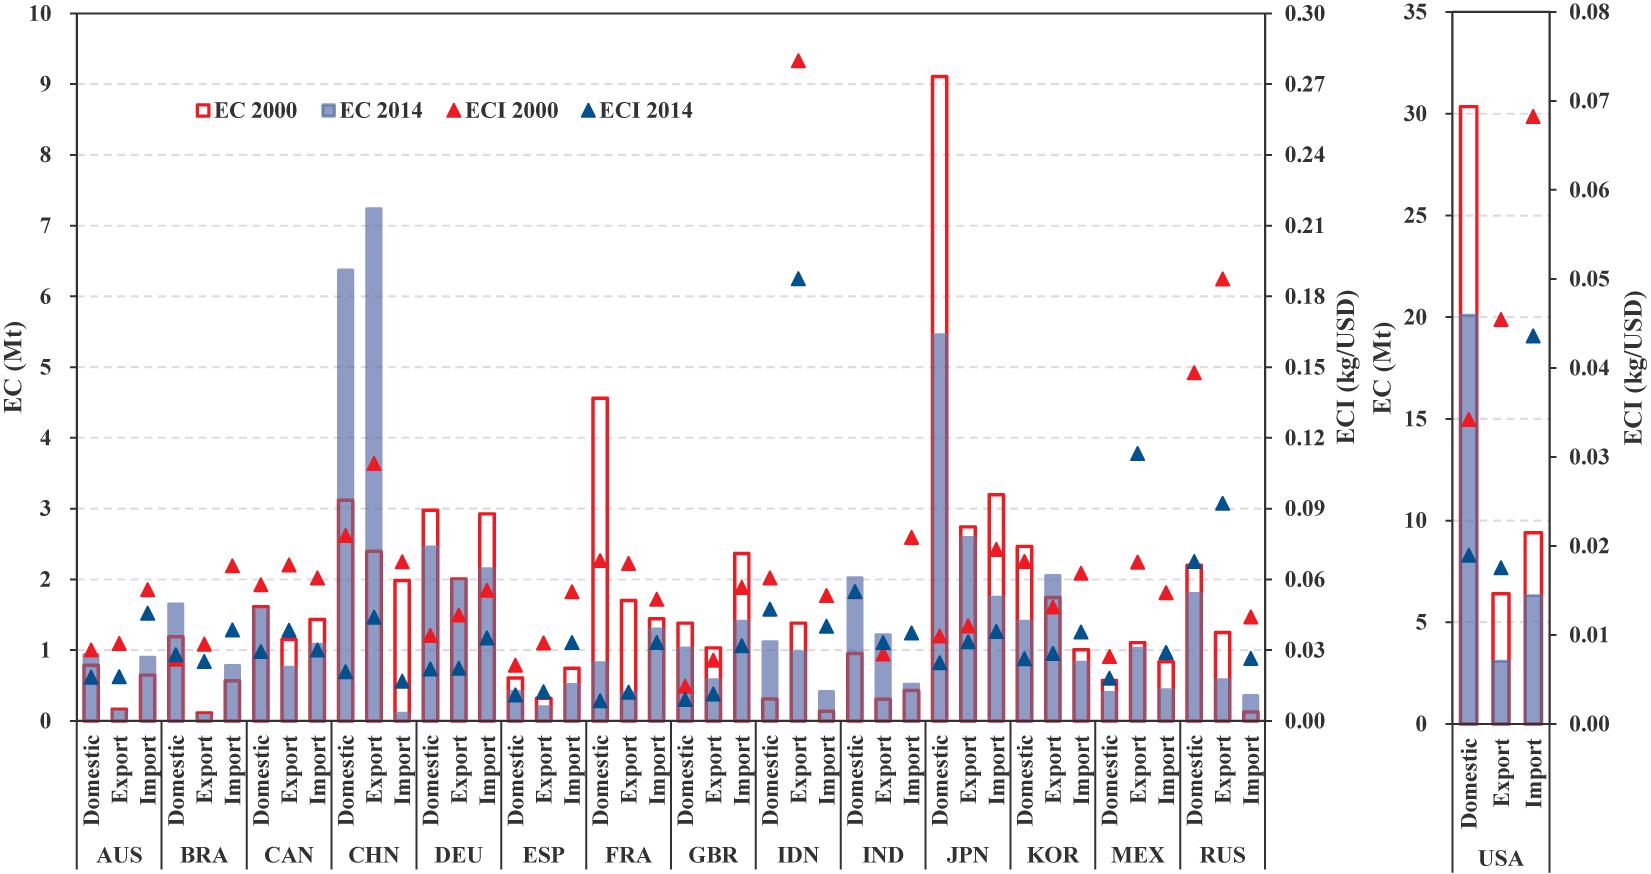
Figure 1. The ICT’s embodied carbon emissions and intensities of major countries in 2000 and 2014. Note: EC represents the embodied carbon emissions, ECI represents the embodied carbon emission intensities.
Embodied Carbon Emission Intensities
The carbon emission intensities of trade reflect to a certain extent the technological differences in a country’s trade products and can provide intuitive emission reduction strategies. From the perspective of embodied carbon emission intensities (Figure 1), the amount of such emission intensities in most countries in 2014 show a downward trend compared with that in 2000. For example, the ICT’s export embodied carbon emission intensities of France decrease from 0.07 kg/USD in 2000 to 0.01 kg/USD in 2014. Export and import embodied carbon emission intensities of ICT in China decrease from 0.11 kg/USD and 0.07 kg/USD in 2000 to 0.04 kg/USD and 0.02 kg/USD in 2014. The United States decreases its export and import embodied carbon emission intensities from 0.05 kg/USD and 0.07 kg/USD in 2000 to 0.02 kg/USD and 0/04 kg/USD in 2014. This reflects to a certain extent that the progress of production technology has promoted the process of carbon emission reduction in the ICT sector. However, it must be noted that India’s domestic embodied carbon emission intensity and export embodied carbon emission intensity of ICT have both increased slightly, which requires the attention of local government departments. From the selected countries, Indonesia’s export embodied carbon emission intensity of ICT is much higher than that of other countries. Even though there is a significant decrease in 2014 compared to 2000, the export embodied carbon emission intensities of 0.19 kg/USD should still receive the attention of the authorities. For example, key considerations for Indonesia will be to find ways of optimizing the energy structure of products in the export sector and the industrial energy consumption intensity of its ICT sector. The country will also need to improve its energy poverty environment (Setyowati, 2021). In 2000, Russia’s domestic and export embodied carbon emission intensities of ICT are relatively high, reaching 0.15 kg/USD and 0.19 kg/USD respectively, but in 2014 the export embodied carbon emission intensities decrease to 0.07 kg/USD and 0.09 kg/USD, respectively.
Embodied Carbon Emission and Intensity Flows Among Major Countries
Embodied Carbon Emission Flows
Calculated based on Eq. (6–7), the embodied carbon emission flows of the ICT industry in 2000 and 2014 within the world’s 15 major countries and other countries (ROW) are shown in Figure 2. On the whole, ICT’s embodied carbon emissions have shown a downward trend, especially in European countries and the United States. For example, the ICT’s embodied carbon emissions of France’s exports to Germany decrease from 0.208 Mt in 2000 to 0.034 Mt in 2014, and the ICT’s embodied carbon emissions of United States exports to Germany decrease from 0.472 Mt in 2000 to 0.173 Mt in 2014. Relatively speaking, embodied carbon emissions in the Asia-Pacific region have shown an increasing trend. The embodied carbon emissions of China’s exports to other countries are more obvious. For example, the ICT’s embodied carbon emissions of China’s exports to the United States increases from 0.727 Mt in 2000 to 1.573 Mt in 2014, and exports to Japan increases from 0.267 Mt in 2000 to 0.644 Mt in 2014. The ICT’s embodied carbon emissions of Japan and South Korea’s exports to China also show significant growth, from 0.187 and 0.125 Mt in 2000 to 0.646 and 0.642 Mt in 2014, respectively.
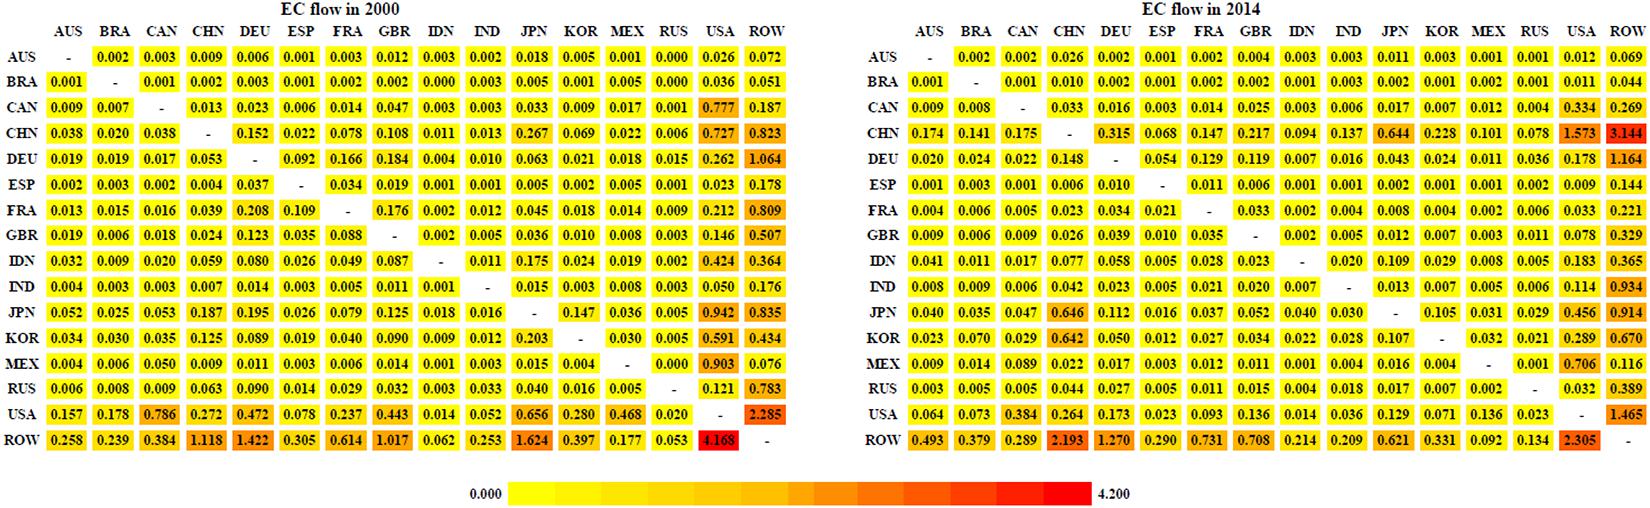
Figure 2. Information and communication technologies embodied carbon emissions flow among major countries in 2000 and 2014. Note: EC represents the embodied carbon emissions, ECI represents the embodied carbon emission intensities.
Embodied Carbon Intensity Flows
Calculated based on Eq. (12) and Eq. (14), the embodied carbon intensities of global ICT industry trade in 2000 and 2014 are shown in Figure 3. In 2000, the embodied emission intensities of Indonesia and Russia’s exports to other countries are significantly higher than those of other countries. For example, the embodied emission intensities of Indonesia’s exports to Germany, France, the United Kingdom, and the United States all reach 0.30 kg/USD, and the embodied carbon intensity of ICT products export from Russia to India reaches 0.28 kg/USD. In 2014, embodied carbon intensity showed a significant downward trend, but relatively speaking, the ICT’s embodied carbon intensities of Indonesia’s exports to other countries are still higher than those of other countries in 2014, 0.29 kg/USD from Indonesia to Germany, and 0.25 kg/USD from Indonesia to Canada, which should have aroused the attention of the relevant government departments. The embodied carbon intensities of Mexico’s exports of ICT products have shown an increasing trend. For example, the embodied carbon intensity of Mexico’s exports to the United States increases from 0.07 kg/USD in 2000 to 0.12 kg/USD in 2014, and exports to China also increase from 0.06 kg/USD in 2000 to 0.10 kg/USD in 2014. This shows that the export of ICT products may not reduce the carbon intensity to achieve emission reduction due to technical restrictions, which has caused the significant spillover effect2 of export carbon emissions (Liu and Liu, 2019; Wang and Li, 2019). Relatively speaking, the embodied carbon intensities of European countries, such as Spain, France, and the United Kingdom, are at the low level. The ICT’s embodied carbon intensities of their exports to other countries are all about 0.01 kg/USD, reflecting the technological advantages and emission reduction driving forces of ICT products in these European countries.
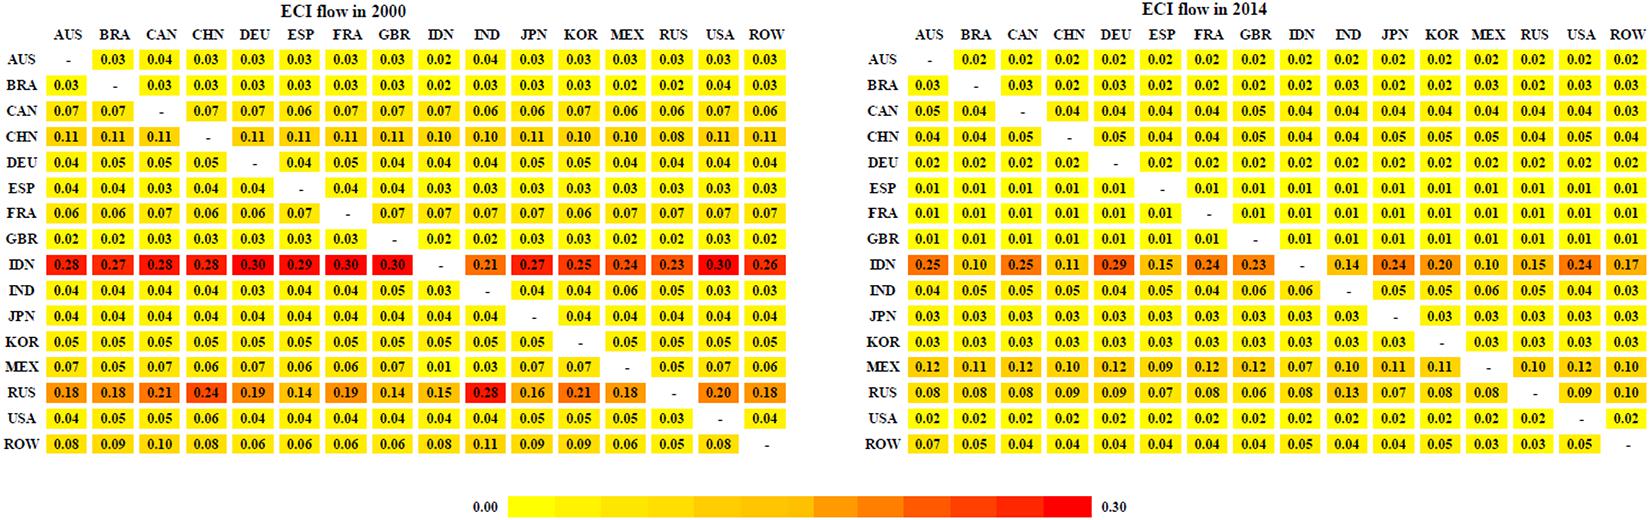
Figure 3. Information and communication technologies embodied carbon intensities among major countries in 2000 and 2014. Note: EC represents the embodied carbon emissions, ECI represents the embodied carbon emission intensities.
Further Discussion
After investigating the embodied carbon emissions and embodied carbon emission intensities of the ICT sector in various countries, we find that there is relatively little understanding of the internal ICT sector, and the internal ICT manufacturing products or services that have caused the increase in embodied carbon emissions are worthy of attention. Therefore, we continue to explore the impact of each ICT sector.
Embodied Carbon Emissions of ICT Sectors
Figure 4 shows the global embodied carbon emissions of each ICT sector from 2000 to 2014 and their proportions in 2000 and 2014. The sector that manufacture of computer, electronic and optical products (S1) produces the most embodied carbon emissions from 2000 to 2014, and the changing trend almost reveals a ‘W’ shape. In 2006, the sector of manufacture of computer, electronic and optical products (S1) is the top producer of embodied carbon emissions (30.39 Mt). However, the proportion of embodied carbon emissions produced by the sector decrease from 68.6% in 2000 to 62.2% in 2014. Other ICT sectors, all of which belong to ICT services, have relatively low embodied carbon emissions. For example, the embodied carbon emissions of computer programming, consultancy and related activities and information service activities (S5) are 8.00 Mt in 2014, accounting for 21.8% of global ICT embodied carbon emissions that year. By 2000, although these emissions have increased, they represented 18.2% of global ICT embodied carbon emissions. The embodied carbon emissions of publishing activities (S2) are 2.96 Mt in 2014. This represents 8.1% of global ICT embodied carbon emissions, up from 2.7% in 2000. The sector representing motion picture, video and television program production, sound recording and music publishing activities, programming (S3) and telecommunications (S4) show a decreasing proportions of embodied carbon emissions, from 7.7 and 2.8% in 2000 to 5.6 and 2.3%, respectively.
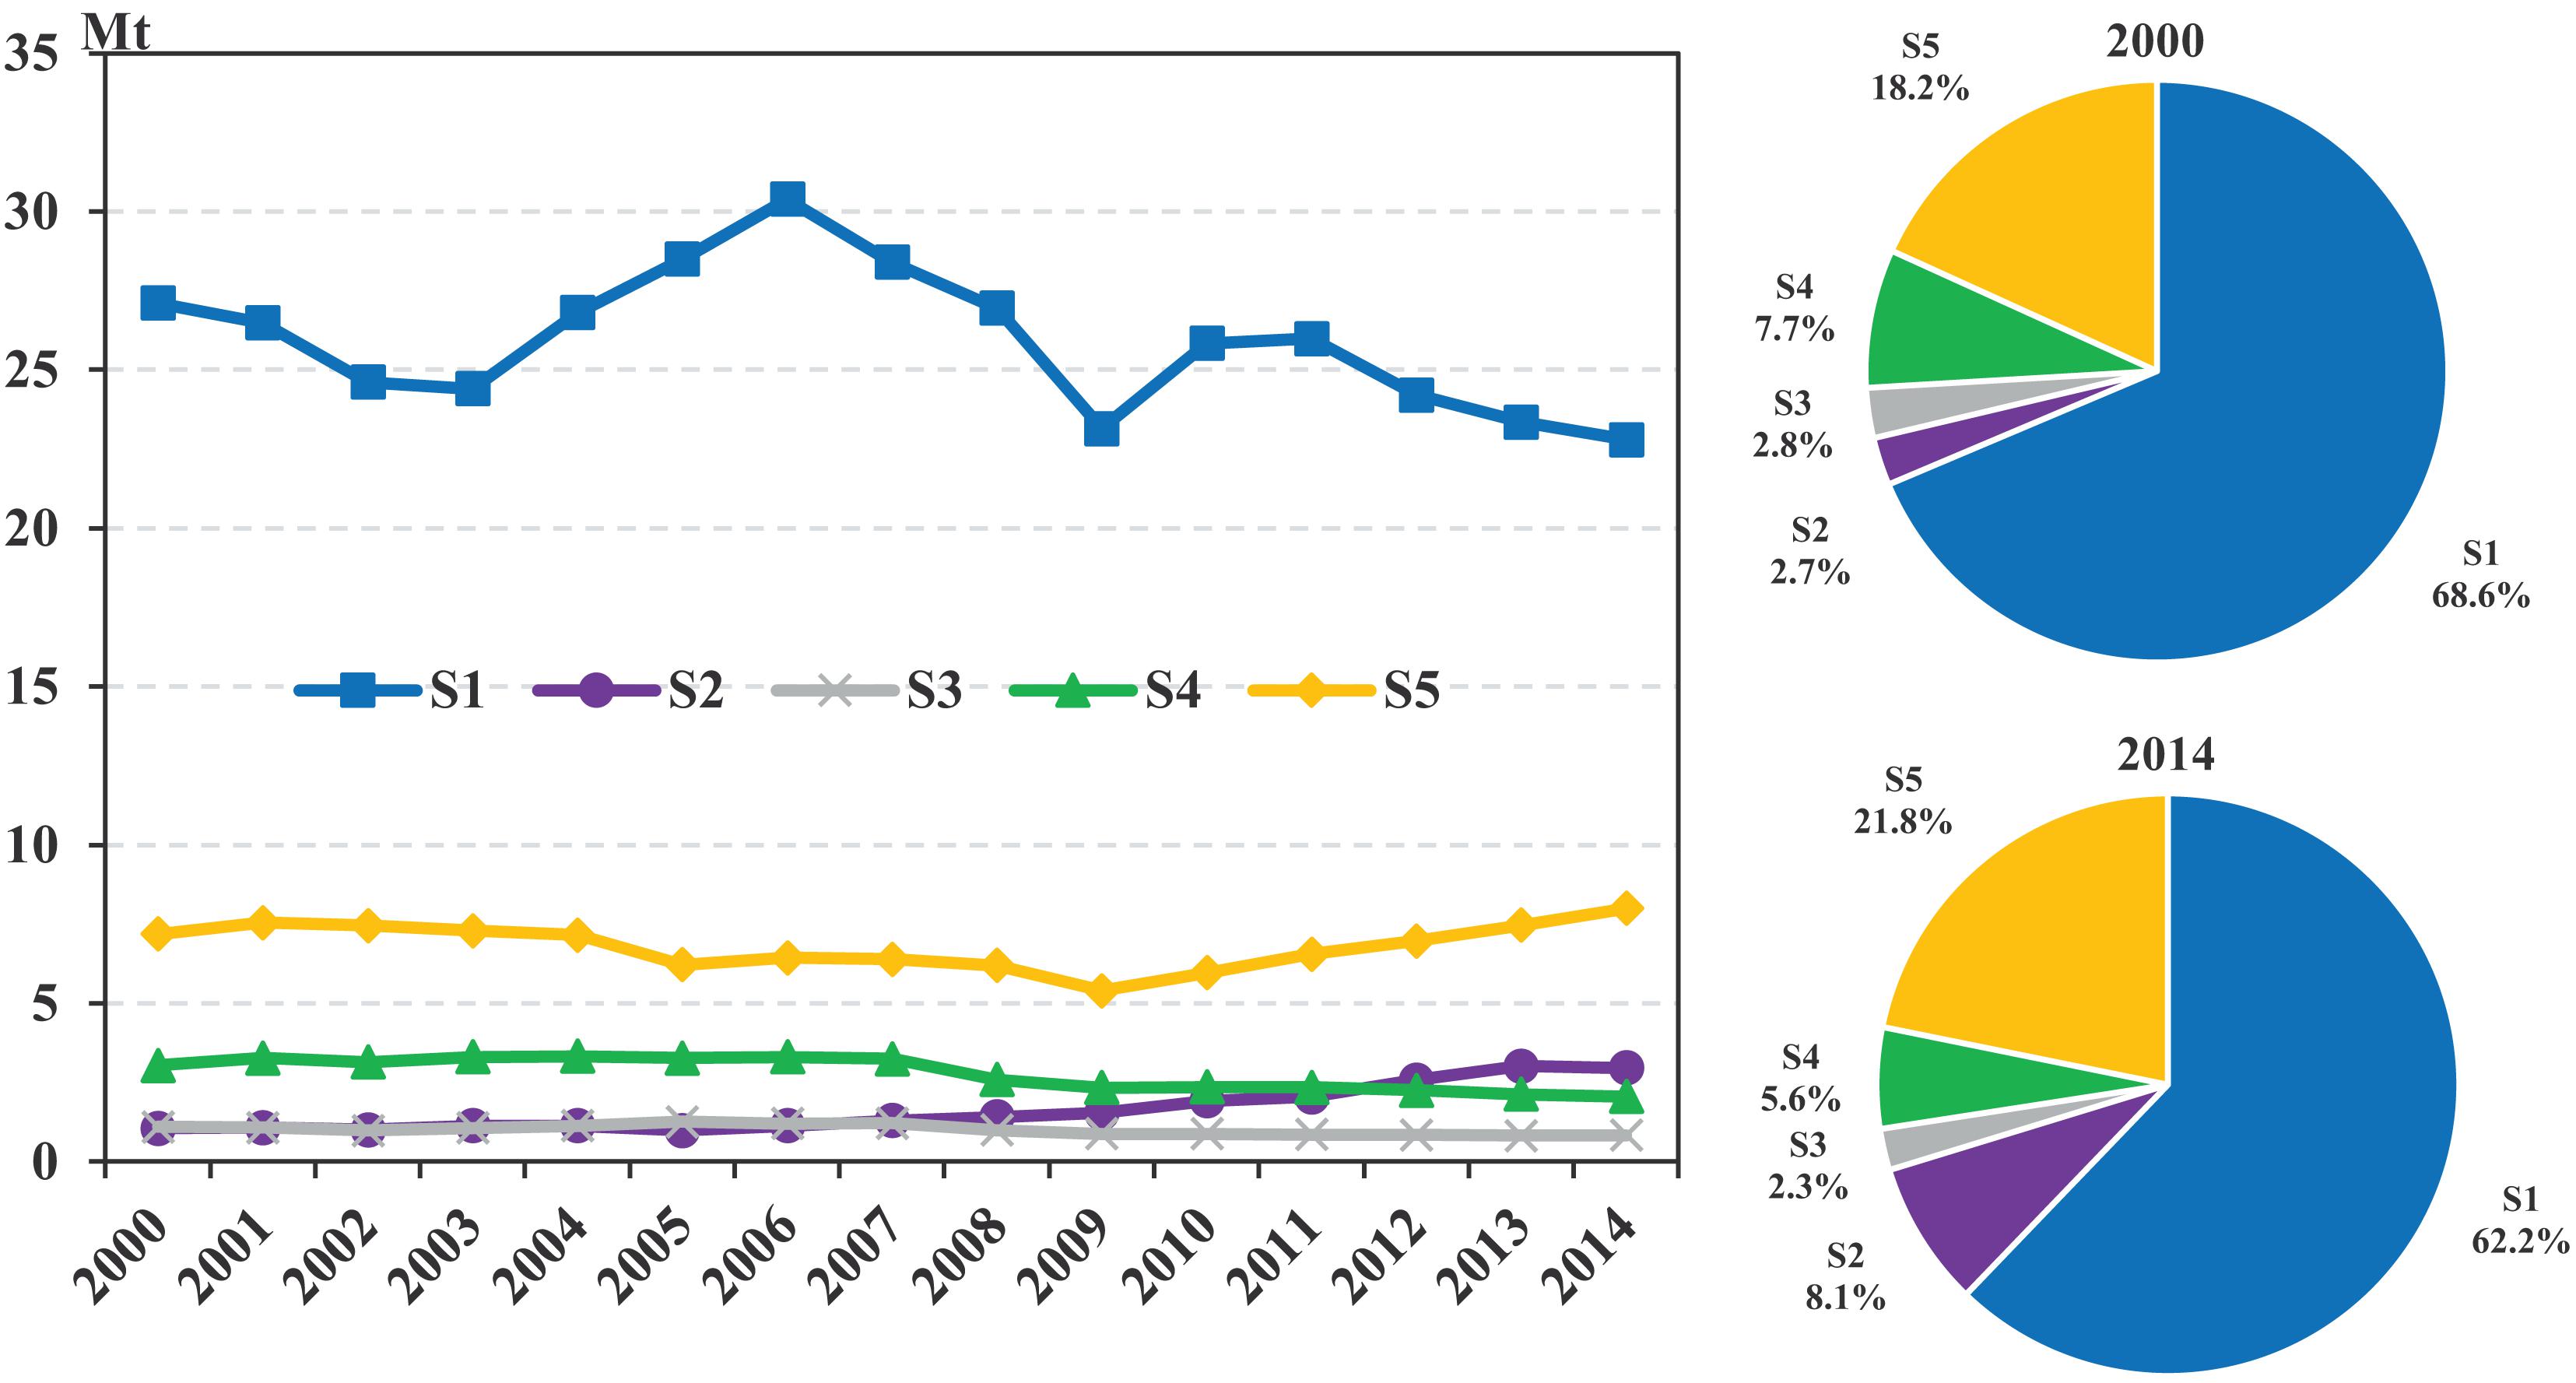
Figure 4. The global embodied carbon emissions of each ICT sector and their proportions in 2000 and 2014.
Embodied Carbon Emissions and Intensities of Each ICT Sector in Various Countries
Figure 5 shows the embodied carbon emissions and intensities of ICT sectors in each country in 2000 and 2014. From a quantitative point of view, the embodied carbon emissions of the sector of manufacture of computer, electronic and optical products (S1) in most countries are much higher than those of other sectors, and the amount in 2014 is less than that in 2000. The import and export embodied carbon emissions of manufacture of computer, electronic and optical products (S1) in China have both risen significantly, and Brazil’s import embodied carbon emissions have increased. The embodied carbon emissions of manufacture of computer, electronic and optical products (S1) in other countries show a downward trend from 2000 to 2014. What is more anomalous is that in 2000, the embodied carbon emission of the telecommunications (S4) sector is the highest in India at 0.141 Mt. In 2014, the computer programming, consultancy and related activities; information service activities (S5) sector has the highest embodied carbon emissions at 0.806 Mt.
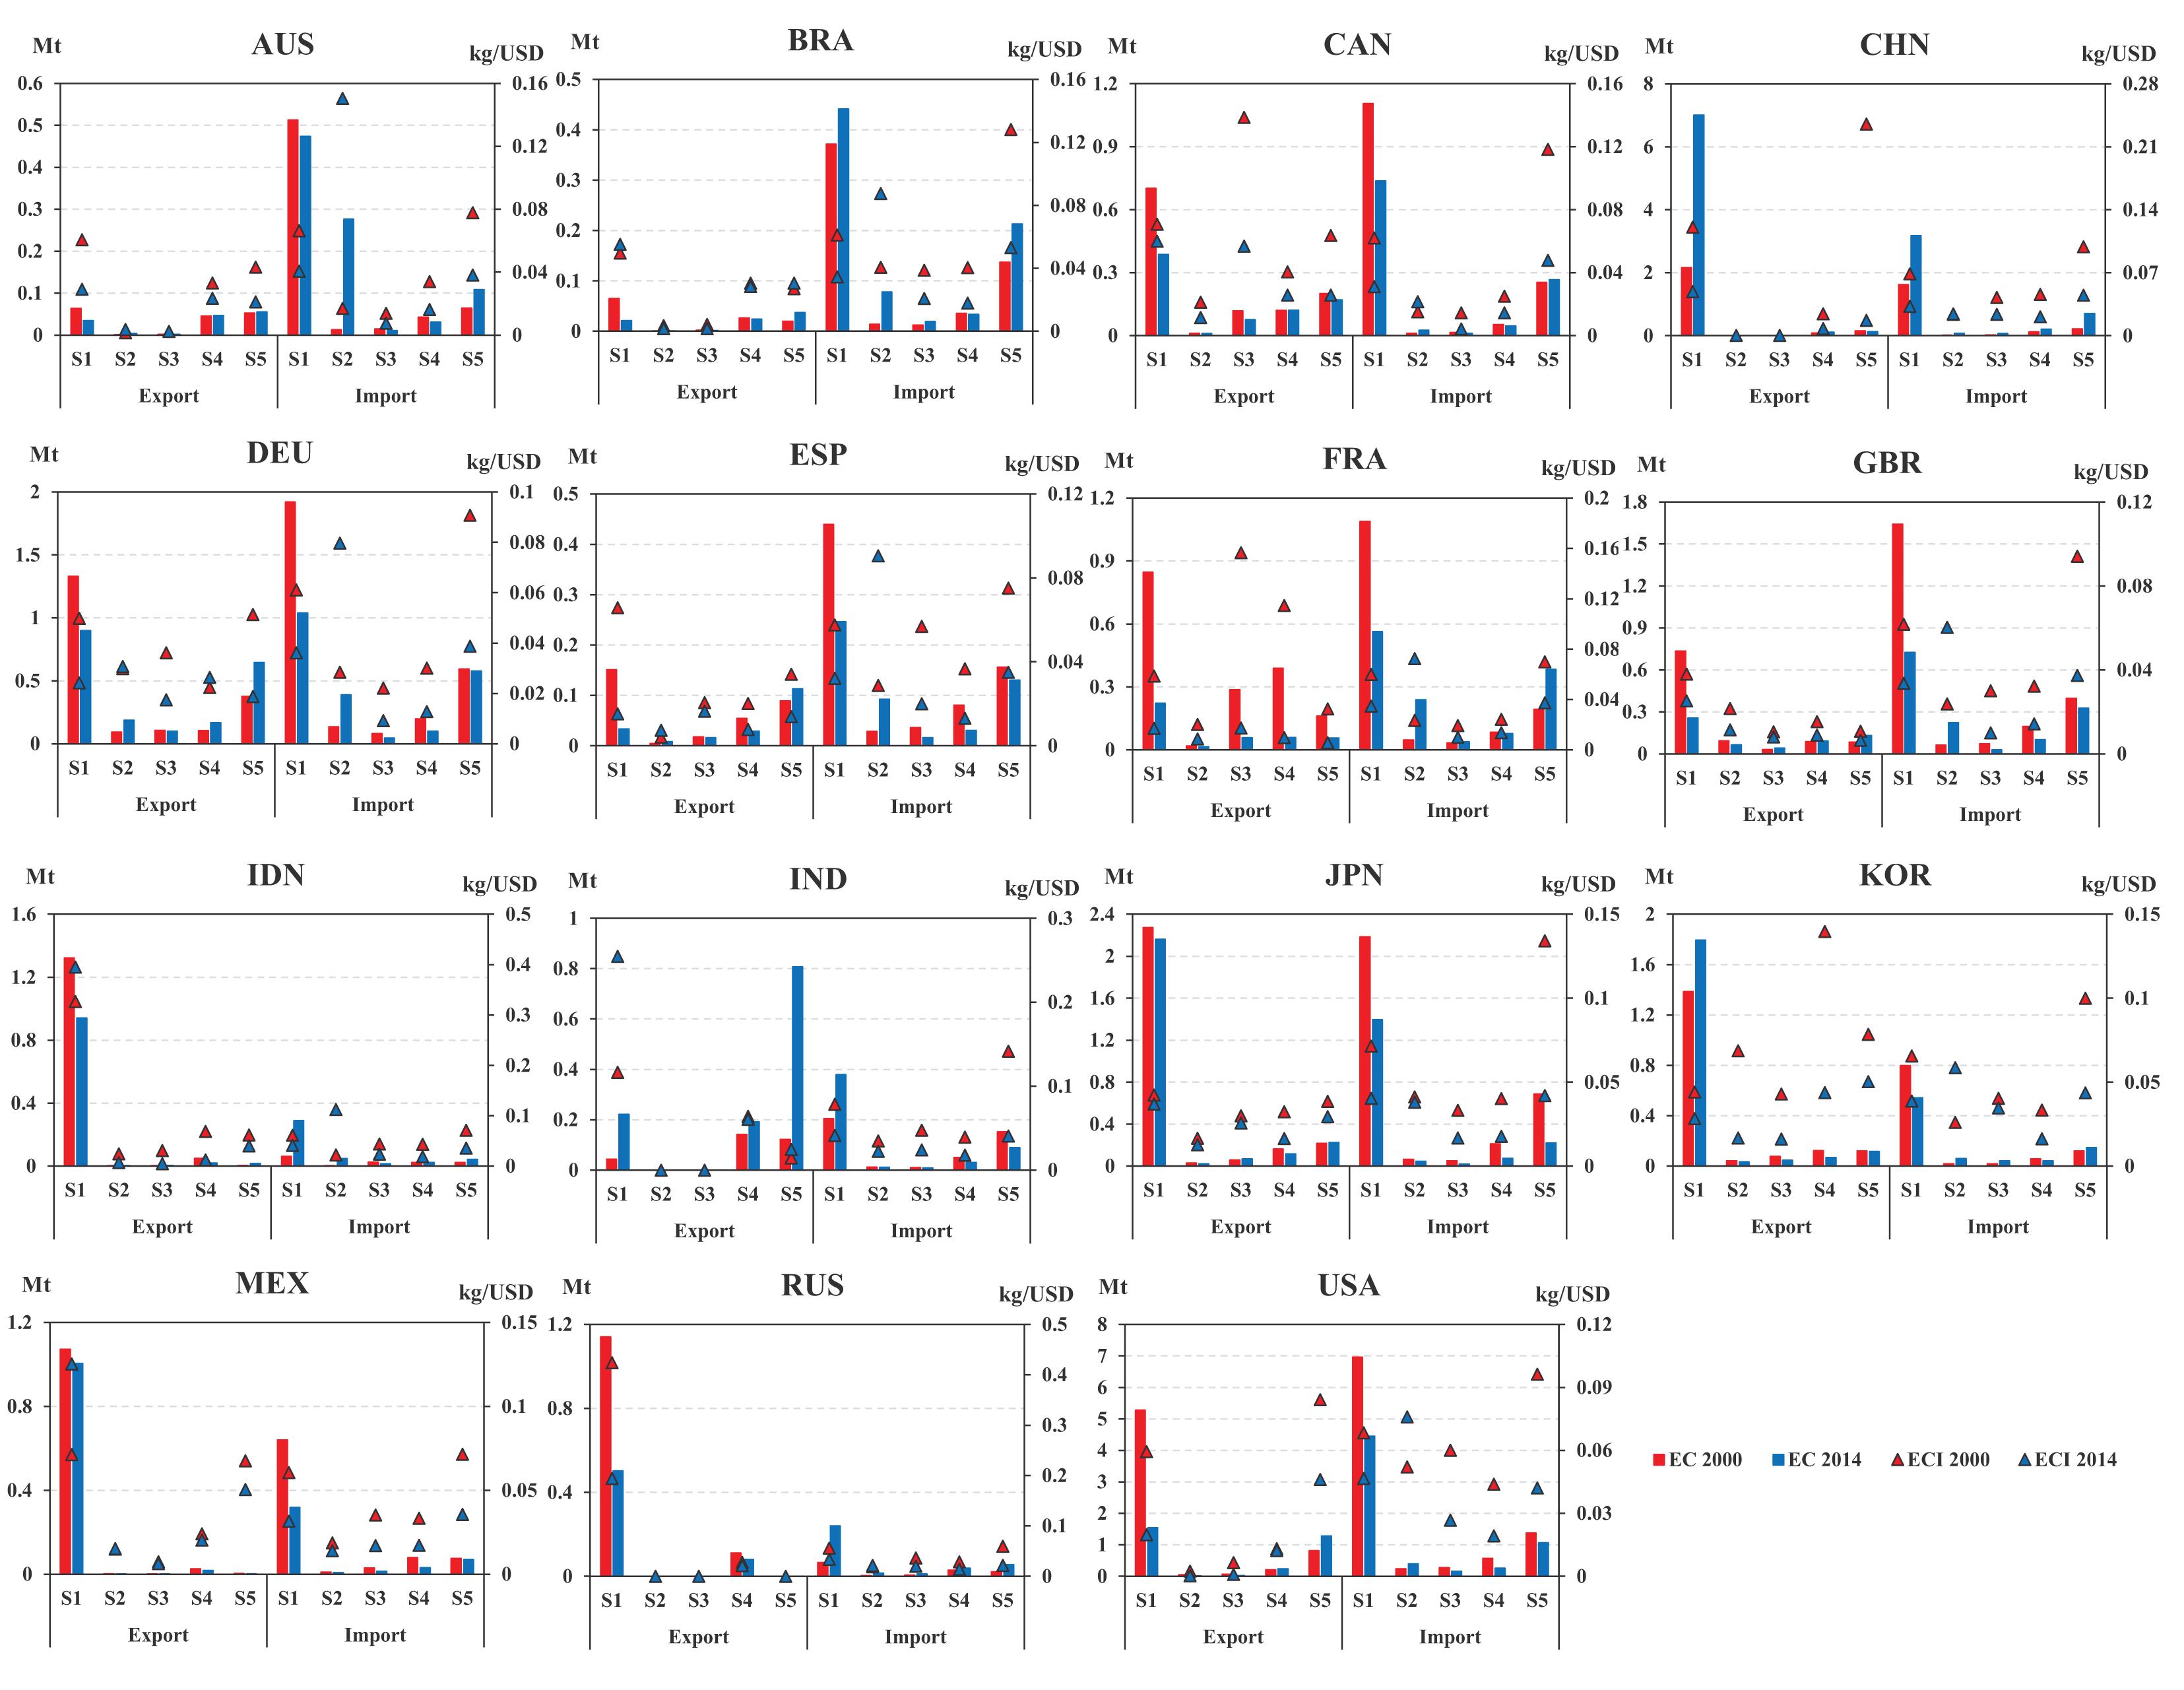
Figure 5. The embodied carbon emissions and intensities of the ICT sectors in each country in 2000 and 2014. Note: EC represents the embodied carbon emissions, ECI represents the embodied carbon emission intensities.
From the perspective of carbon emission intensities, the export carbon emission intensity of the publishing activities (S2) sector in many countries has increased significantly by 2014. For example, Australia increases its export carbon emission intensity of the S2 sector from 0.02 kg/USD in 2000 to 0.15 kg/USD in 2014. Germany increases from 0.03 kg/USD in 2002 to 0.08 kg/USD in 2014. The import carbon emission intensities of the other four sectors have shown varying degrees of downward trends. The export carbon emission intensities of ICT sectors in most countries have shown a significant downward trend, reflecting the rapid progress of ICT products exported by these countries. For example, the export carbon emission intensity of China’s manufacture of computer, electronic and optical products (S1) sector decrease from 0.12 kg/USD to 0.05 kg/USD in 2000, and the export carbon emission intensities of the S1 sector in the United States decrease from 0.06 kg/USD to 0.02 kg/USD. India and Indonesia are relatively special; their sector of manufacture of computer, electronic and optical products (S1) has shown an upward trend in export carbon emission intensity, indicating that the export technology of its ICT manufacturing sector has not yet shown much carbon emission reduction potential.
Conclusion and Policy Implications
Conclusion
This article explores the embodied carbon emissions and carbon emission intensities of 15 major countries around the world, and further discusses the changes in various industrial sectors in each country. Accordingly, the main conclusions are as follows:
(1) In 2001, global ICT carbon emissions reach the highest value in our study. Since then, in terms of quantity, the share of ICT embodied carbon in the world has slowly declined. The proportion of ICT embodied carbon emissions decrease from 0.53% in 2001 to 0.30% in 2014. The proportion of domestic carbon emissions caused by own consumption is relatively high. In 2014, this part of carbon emissions accounts for 61.63% of global ICT embodied carbon emissions. However, the ICT’s embodied carbon emissions caused by trade gradually increase, from 34.99% in 2000 to 38.27% in 2014.
(2) From the perspective of the ICT’s embodied carbon emissions and embodied carbon emission intensities of various countries, the embodied carbon emissions of ICT in the United States have been much higher than those of other countries. In 2000, the embodied carbon emissions of exports and imports are 6.40 and 9.41 Mt, respectively. But by 2014, there are a significant downward trend in the embodied carbon emissions of exports and imports, which reach 3.08 and 6.31 Mt, respectively. Similarly, the embodied carbon emissions of most countries in 2014 are significantly lower than in 2000. However, in some developing countries, such as India, China, and Brazil, embodied carbon emissions have shown an upward trend. China’s export embodied carbon emissions in 2014 exceed domestic embodied carbon emissions, becoming the main growth force of carbon emissions in its ICT sector. From the perspective of carbon emission intensities, the embodied carbon emission intensities of most countries have decreased slightly. However, India’s domestic embodied carbon emissions and export embodied carbon emissions have shown a slight increase. The embodied carbon emission intensity of Indonesia’s exports is much higher than that of other countries, and should receive attention from the government.
(3) From the perspective of regional trade, the embodied carbon emissions of ICT products in the Asia-Pacific region are increasing. The embodied carbon emissions of ICT products exported from China to other countries have increased, as have those of Japan and South Korea’s ICT products exported to China. In 2000, the embodied carbon emission intensities of ICT products exported from Indonesia and Russia to other countries show a trend higher than that of other countries. However, by 2014, the embodied carbon emission intensity of the ICT sector in most countries has declined. The embodied carbon emission intensity of ICT products exported by Mexico has shown an increasing trend in contrast to the embodied carbon emission intensities of ICT product exports from European countries, which have been at a low level.
(4) From the perspective of the embodied carbon emissions and intensities of various ICT industry sectors, the sector of manufacture of computer, electronic and optical products (S1) is the main embodied carbon component of the ICT sectors, both globally and locally for each country. However, with the passage of time, the percentage of embodied carbon emissions in the ICT manufacturing industry (S1) has been decreasing year by year. In comparison, the embodied carbon emissions of the ICT service industries (S2–S5) have been increasing year by year. As far as countries are concerned, the embodied carbon emissions of India’s ICT service industry are higher than those of the manufacturing industry, which is reflected in the sectors of telecommunications (S4) and computer programming, consultancy and related activities; information service activities (S5). In addition, the import embodied carbon emission intensities of the publishing activities (S2) sector in most countries have increased significantly, reflecting the technical disadvantages of imported products in this sector. The embodied carbon emission intensities of exports of various countries and ICT sectors have shown a significant downward trend.
Policy Implications
(1) Although the embodied carbon emissions of the global ICT sector are not high, the sector has already demonstrated its technological advantages and has shown a special advantage in reducing carbon emissions. However, the promotion of trade carbon emissions needs to attract the attention of local governments. It should be noted that the control of the embodied carbon emission intensities of exports can reduce the growth of embodied carbon emissions, and that the ICT sector can further reduce its carbon emissions.
(2) Developing countries such as China, India, and Brazil need to pay special attention to the significant increase in embodied carbon emissions from the ICT sector. China needs to pay attention to the embodied carbon emissions of the export sector, while India needs to pay attention to the embodied carbon emission intensity changes of exports, and realize that maintaining a downward trend is conducive to achieving emission reductions. This requires above countries to enhance the competitiveness of their enterprises in carbon reduction technologies. The Indonesian government needs to focus on the high embodied carbon emission intensity of exports, which is much higher than other countries and is the main driving force behind the embodied carbon emissions of the country’s ICT sector.
(3) From the perspective of regional coordinated emission reduction, the embodied carbon emissions of the ICT sector in the Asia-Pacific region remain high, mainly in China, Japan, and South Korea. A coordinated development policy in the Asia-Pacific region could help accelerate the process of regional carbon emission reduction. The growth of embodied carbon intensity in Mexico’s exports and the high level of embodied carbon intensity in Indonesia have both reminded local governments to strengthen the regulation of ICT exports, improve the energy efficiency of these products, and learn more from the experience of European countries in achieving low-carbon intensity development.
(4) Regarding the ICT sector, carbon emissions caused by trade in the manufacturing industry account for a relatively high proportion, while carbon emissions caused by trade in the service industry are on the rise. This requires countries to optimize the export carbon intensities of ICT-manufactured products and strengthen supervision of the export of ICT service industries. The Indian government should pay particular attention to the export of ICT services, mainly the embodied carbon emissions of telecommunications (S4) and computer programming, consultancy and related activities; information service activities (S5).
Data Availability Statement
The raw data supporting the conclusions of this article will be made available by the authors, without undue reservation.
Author Contributions
XD: conceptualization, validation, investigation, resources, data curation, and funding acquisition. QJ: conceptualization, writing – review and editing. JW: methodology, software, visualization, writing – original draft, writing – review and editing. All authors contributed to the article and approved the submitted version.
Funding
This manuscript was supported by the National Social Science Foundation of China (Grant No. 18VDL017), and the Innovation Methods Special Foundation of the Chinese Ministry of Science and Technology (Grant No. 2018IMO40100). Certainly, all remaining errors are our own.
Conflict of Interest
The authors declare that the research was conducted in the absence of any commercial or financial relationships that could be construed as a potential conflict of interest.
Footnotes
- ^ The ROW is different from ROW of WIOD, it includes 28 countries and ROW countries in WIOD.
- ^ The flow of embodied carbon emissions in one region affects the level of carbon emissions in other regions.
References
Adedoyin, F. F., Bekun, F. V., Driha, O. M., and Balsalobre-Lorente, D. (2020). The effects of air transportation, energy, ICT and FDI on economic growth in the industry 4.0 era: evidence from the United States. Technol. Forecast. Soc. Chang. 160:120297. doi: 10.1016/j.techfore.2020.120297
Amri, F., Zaied, Y. B., and Lahouel, B. B. (2019). ICT, total factor productivity, and carbon dioxide emissions in Tunisia. Technol. Forecast. Soc. Chang. 146, 212–217. doi: 10.1016/j.techfore.2019.05.028
Anwar, M. A. (2019). “Connecting South Africa: ICTs, uneven development and poverty debates,” in The Geography of South Africa. World Regional Geography Book Series, eds J. Knight and C. Rogerson (Cham: Springer).
Asongu, S. A. (2018). ICT, openness and CO2 emissions in Africa. Environ. Sci. Pollut. Res. 25, 9351–9359. doi: 10.1007/s11356-018-1239-4
Azam, A., Rafiq, M., Shafique, M., and Yuan, J. (2021). An empirical analysis of the non-linear effects of natural gas, nuclear energy, renewable energy and ICT-Trade in leading CO2 emitter countries: policy towards CO2 mitigation and economic sustainability. J. Environ. Manag. 286:112232. doi: 10.1016/j.jenvman.2021.112232
Bastida, L., Cohen, J. J., Kollmann, A., Moya, A., and Reichl, J. (2019). Exploring the role of ICT on household behavioural energy efficiency to mitigate global warming. Renew. Sustain. Energy Rev. 103, 455–462. doi: 10.1016/j.rser.2019.01.004
CAICT (2020). White Paper of China’s Digital Economy Development (2020). Beijing: China Academy of Information and Communications Technology.
Chen, X., Gong, X., Li, D., and Zhang, J. (2019). Can information and communication technology reduce CO2 emission? A quantile regression analysis. Environ. Sci. Pollut. Res. 26, 32977–32992. doi: 10.1007/s11356-019-06380-8
Corsatea, T. D., Lindner, S., Arto, I., Román, M. V., Rueda-Cantuche, J. M., Velázquez Afonso, A., et al. (2019). World Input-Output Database Environmental Accounts. Update 2000-2016. Luxembourg: Publications Office of the European Union.
Dong, B., Ma, X., Zhang, Z., Zhang, H., Chen, R., Song, Y., et al. (2020). Carbon emissions, the industrial structure and economic growth: evidence from heterogeneous industries in China. Environ. Pollut. 262:114322. doi: 10.1016/j.envpol.2020.114322
Dong, K., Dong, X., and Jiang, Q. (2020). How renewable energy consumption lower global CO2 emissions? Evidence from countries with different income levels. World Econ. 43:12898. doi: 10.1111/twec.12898
Dong, K., Dong, X., and Dong, C. (2019). Determinants of the global and regional CO2 emissions: what causes what and where? Appl. Econ. 51, 5031–5044. doi: 10.1080/00036846.2019.1606410
Dong, K., Sun, R., and Hochman, G. (2017). Do natural gas and renewable energy consumption lead to less CO2 emission? Empirical evidence from a panel of BRICS countries. Energy 141, 1466–1478. doi: 10.1016/j.energy.2017.11.092
Dong, K., Sun, R., Jiang, H., and Zeng, X. (2018). CO2 emissions, economic growth, and the environmental Kuznets curve in China: what roles can nuclear energy and renewable energy play? J. Clearn Product. 196, 51–63. doi: 10.1016/j.jclepro.2018.05.271
Fan, J., Zhang, X., Wang, J., and Wang, Q. (2021). Measuring the impacts of international trade on carbon emissions intensity: a global value chain perspective. Emerg. Mark. Finan. Trade 57, 972–988. doi: 10.1080/1540496X.2019.1662783
Global Energy Statistical Yearbook (2014). Addressing the Challenge of Energy Efficiency through Information and Communication Technologies. Brussels: Commission of the European Communities.
He, Y., Fu, F., and Liao, N. (2021). Exploring the path of carbon emissions reduction in China’s industrial sector through energy efficiency enhancement induced by R&D investment. Energy 225:120208. doi: 10.1016/j.energy.2021.120208
Honma, S., and Yoshida, Y. (2020). An empirical investigation of the balance of embodied emission in trade: industry structure and emission abatement. Econ. Model. 92, 277–294. doi: 10.1016/j.econmod.2020.01.008
Hou, H., Wang, J., Yuan, M., Liang, S., Liu, T., Wang, H., et al. (2021). Estimating the mitigation potential of the Chinese service sector using embodied carbon emissions accounting. Environ. Impact Assess. Rev. 86:106510. doi: 10.1016/j.eiar.2020.106510
Jiang, X., and Liu, Y. (2015). Global value chain, trade and carbon: case of information and communication technology manufacturing sector. Energy Sustain. Dev. 25, 1–7. doi: 10.1016/j.esd.2014.12.001
Li, Y., and Hewitt, C. N. (2008). The effect of trade between China and the UK on national and global carbon dioxide emissions. Energy Policy 36, 1907–1914. doi: 10.1016/j.enpol.2008.02.005
Li, Y., Lee, S. G., and Kong, M. (2019). The industrial impact and competitive advantage of China’s ICT industry. Serv. Bus. 13, 101–127. doi: 10.1007/s11628-018-0368-7
Liu, F., and Liu, C. (2019). Regional disparity, spatial spillover effects of urbanisation and carbon emissions in China. J. Clean. Product. 241:1182226. doi: 10.1016/j.jclepro.2019.118226
Liu, J., Li, S., and Ji, Q. (2021a). Regional differences and driving factors analysis of carbon emission intensity from transport sector in China. Energy 224:120178. doi: 10.1016/j.energy.2021.120178
Liu, J., Liu, L., Qian, Y., and Song, S. (2021b). The effect of artificial intelligence on carbon intensity: evidence from China’s industrial sector. Soc. Econ. Plan. Sci. 2021:101002. doi: 10.1016/j.seps.2020.101002
Lu, Q., Fang, K., Heijungs, R., Feng, K., Li, J., Wen, Q., et al. (2020). Imbalance and drivers of carbon emissions embodied in trade along the belt and road initiative. Appl. Energy 280:115934. doi: 10.1016/j.apenergy.2020.115934
Malmodin, J., and Bergmark, P. (2015). “Exploring the effect of ICT solutions on GHG emissions in 2030,” in Proceedings of the Environmental Information and ICT for Sustainability 2015, (Paris: Atlantis Press), 37–46.
Malmodin, J., and Lundén, D. (2016). “The energy and carbon footprint of the ICT and E&M sector in Sweden 1990-2015 and beyond,” in Proceedings of the ICT for Sustainability 2016, (Paris: Atlantis Press), 209–218.
Malmodin, J., and Lundén, D. (2018). The energy and carbon footprint of the global ICT and E&M sectors 2010–2015. Sustainability 10:3027. doi: 10.3390/su10093027
Malmodin, J., Lundén, D., Moberg, Å, Andersson, G., and Nilsson, M. (2014). Life cycle assessment of ICT. J. Industr. Ecol. 18, 829–845. doi: 10.1111/jiec.12145
Miller, R. E., and Peter, D. (2009). Input-Output Analysis: Foundations and Extensions. Cambridge: Cambridge university press.
Moses, L. N. (1955). The stability of interregional trading patterns and input-output analysis. Am. Econ. Rev. 45, 803–826.
Moyer, J. D., and Hughes, B. B. (2012). ICTs: do they contribute to increased carbon emissions? Technol. Forecast. Soc. Chang. 79, 919–931. doi: 10.1016/j.techfore.2011.12.005
Nguyen, T. T., Pham, T. A. T., and Tram, H. T. X. (2020). Role of information and communication technologies and innovation in driving carbon emissions and economic growth in selected G-20 countries. J. Environ. Manag. 261:110162. doi: 10.1016/j.jenvman.2020.110162
Pan, X., Uddin, M. K., Ai, B., Pan, X., and Saima, U. (2019). Influential factors of carbon emissions intensity in OECD countries: evidence from symbolic regression. J. Clean. Product. 220, 1194–1201. doi: 10.1016/j.jclepro.2019.02.195
Peters, G. P., Andrew, R. M., Canadell, J. G., Friedlingstein, P., and Peregon, A. (2019). Carbon dioxide emissions continue to grow amidst slowly emerging climate policies. Nat. Clim. Chang. 10, 1–4. doi: 10.1038/s41558-019-0659-6
Peters, G. P., and Hertwich, E. G. (2008). CO2 Embodied in international trade with implications for global climate policy. Environ. Sci. Technol. 42, 1401–1407. doi: 10.1021/es072023k
Sahoo, M., Gupta, M., and Srivastava, P. (2021). Does information and communication technology and financial development lead to environmental sustainability in India? An empirical insight. Telemat. Inform. 60:101598. doi: 10.1016/j.tele.2021.101598
Schaeffer, R., and de Sá, A. (1996). The embodiment of carbon associated with Brazilian imports and exports. Energy Convers. Manag. 37, 955–960. doi: 10.1016/0196-8904(95)00283-9
Setyowati, A. B. (2021). Mitigating inequality with emissions? Exploring energy justice and financing transitions to low carbon energy in Indonesia. Energy Res. Soc. Sci. 71:101817. doi: 10.1016/j.erss.2020.101817
Shahnazi, R., and Dehghan Shabani, Z. (2019). The effects of spatial spillover information and communications technology on carbon dioxide emissions in Iran. Environ. Sci. Pollut. Res. 26, 24198–24212. doi: 10.1007/s11356-019-05636-7
Sun, C., Chen, L., and Zhang, F. (2020). Exploring the trading embodied CO2 effect and low-carbon globalization from the international division perspective. Environ. Impact Assess. Rev. 83:106414. doi: 10.1016/j.eiar.2020.106414
Teehan, P., and Kandlikar, M. (2013). Comparing embodied greenhouse gas emissions of modern computing and electronics products. Environ. Sci. Technol. 47, 3997–4003. doi: 10.1021/es303012r
Timmer, M. P., Dietzenbacher, E., Los, B., Stehrer, R., and de Vries, G. J. (2015). An illustrated user guide to the world input–output database: the case of global automotive production. Rev. Intern. Econ. 23, 575–605. doi: 10.1111/roie.12178
Tiwari, A. K., Abakah, E. J. A., Le, T. N. L., and Leyva-de la Hiz, D. I. (2021). Markov-switching dependence between artificial intelligence and carbon price: the role of policy uncertainty in the era of the 4th industrial revolution and the effect of COVID-19 pandemic. Technol. Forecast. Soc. Chang. 163:120434. doi: 10.1016/j.techfore.2020.120434
Vogiatzoglou, K. (2009). Determinants of Export Specialization in ICT Products: A Cross-Country Analysis. International Network for Economic Research - INFER. Available online at: https://infer-research.eu/wp-content/uploads/2020/09/yltv2bsdihkrb3rou3cyi00opy24m0fy1467292017.pdf (accessed March 15, 2021).
Wang, D., and Han, B. (2016). The impact of ICT investment on energy intensity across different regions of China. J. Renew. Sustain. Energy 8:055901. doi: 10.1063/1.4962873
Wang, D., Zhou, T., and Wang, M. (2021). Information and communication technology (ICT), digital divide and urbanization: evidence from Chinese cities. Technol. Soc. 64:101516. doi: 10.1016/j.techsoc.2020.101516
Wang, H., Ding, L., Guan, R., and Xia, Y. (2020). Effects of advancing internet technology on Chinese employment: a spatial study of inter-industry spillovers. Technol. Forecast. Soc. Chang. 161:120259. doi: 10.1016/j.techfore.2020.120259
Wang, R., Mirza, N., Vasbieva, D. G., Abbas, Q., and Xiong, D. (2020). The nexus of carbon emissions, financial development, renewable energy consumption, and technological innovation: what should be the priorities in light of COP 21 Agreements? J. Environ. Manag. 271:111027. doi: 10.1016/j.jenvman.2020.111027
Wang, Y., and Li, J. (2019). Spatial spillover effect of non-fossil fuel power generation on carbon dioxide emissions across China’s provinces. Renew. Energy 136, 317–330. doi: 10.1016/j.renene.2019.01.012
Wu, X. D., Guo, J. L., Li, C., Chen, G. Q., and Ji, X. (2020). Carbon emissions embodied in the global supply chain: intermediate and final trade imbalances. Sci. Total Environ. 707:134670. doi: 10.1016/j.scitotenv.2019.134670
Xu, M., and Tan, R. (2021). Removing energy allocation distortion to increase economic output and energy efficiency in China. Energy Policy 150:112110. doi: 10.1016/j.enpol.2020.112110
Zhang, N., Wang, B., and Liu, Z. (2016). Carbon emissions dynamics, efficiency gains, and technological innovation in China’s industrial sectors. Energy 99, 10–19. doi: 10.1016/j.energy.2016.01.012
Zhou, X., Zhou, D., Wang, Q., and Su, B. (2019). How information and communication technology drives carbon emissions: a sector-level analysis for China. Energy Econ. 81, 380–392. doi: 10.1016/j.eneco.2019.04.014
Keywords: embodied carbon emissions, embodied carbon emission intensity, MRIO, trade, ICT
Citation: Dong X, Jiang Q and Wang J (2021) Assessing Embodied Carbon Emission and Its Intensities in the ICT Industry: The Global Case. Front. Energy Res. 9:685021. doi: 10.3389/fenrg.2021.685021
Received: 24 March 2021; Accepted: 13 April 2021;
Published: 13 May 2021.
Edited by:
Muhammad Imran Khan, CECOS University of Information Technology and Emerging Sciences, PakistanReviewed by:
Jiawei Hu, Technical University of Berlin, GermanyKk Kiin, Institutes of Science and Development, Chinese Academy of Sciences, China
Jiaquan Li, Beijing Institute of Technology, China
Copyright © 2021 Dong, Jiang and Wang. This is an open-access article distributed under the terms of the Creative Commons Attribution License (CC BY). The use, distribution or reproduction in other forums is permitted, provided the original author(s) and the copyright owner(s) are credited and that the original publication in this journal is cited, in accordance with accepted academic practice. No use, distribution or reproduction is permitted which does not comply with these terms.
*Correspondence: Jianda Wang, wangjd1993@163.com