Air quality forecasting system for Southeastern Brazil
 Maria de Fatima Andrade1*
  Rita Y. Ynoue1
  Edmilson Dias Freitas1
  Enzo Todesco1
  Angel Vara Vela1
  Sergio Ibarra1
  Leila Droprinchinski Martins2
  Jorge Alberto Martins2
  Vanessa Silveira Barreto Carvalho3
- 1Department of Atmospheric Sciences, Institute of Astronomy, Geophysics and Atmospheric Sciences, University of São Paulo, São Paulo, Brazil
- 2Federal Technological University of Parana, Paraná, Brazil
- 3Institute of Natural Resources, Federal University of Itajubá, Minas Gerais, Brazil
Southeastern Brazil, the most populous and developed region of the country, faces various environmental problems associated with the growth of its population in urban areas. It is the most industrialized area in the country, comprising the metropolitan areas of São Paulo, Rio de Janeiro, Belo Horizonte, and other major cities. Air quality is a major concern, because the reported concentrations of certain regulated pollutants, typically ozone and fine particulate, have exceeded national standards. Due to the difficulty in taking measurements over many different areas, air quality modeling is a useful tool to estimate air pollutant concentrations. For southeastern Brazil, air quality modeling has been performed mostly with the Brazilian Regional Atmospheric Modeling System with Simplified Photochemical Module and the Weather Research and Forecast with Chemistry models. One of the main objectives was to study the evolution of air quality associated with improved vehicle emission factors in urban areas, the impact of climate change on air quality, and the relationship between pollutant concentrations and health. Knowledge of mobile source emission factors has been continuously expanded by in-tunnel measurements and dynamometer protocols, which provide accurate data as inputs to photochemical air quality models. The spatial distribution of the mobile source emissions was constructed based on open access data related to the streets and traffic distribution. The mobile emission module was combined to the chemistry modeling and this implementation can be an example to be applied to other places that do not have a spatial distribution of this source. Forecasts of pollutant concentrations can inform public policies, including those addressing the effects of pollutants on health of the general population, and studies of the impacts of using different fuels and implementation of emissions regulations programs.
Introduction
In southeastern Brazil, the Weather Research and Forecasting model with Chemistry (WRF/Chem) system has been used in the analysis of regulated pollutants and air quality forecasting, validated against ground-based measurements and ozone soundings, since 2011. Although the meteorological fields have been well-represented in the modeling, the pollutant concentration data present biases that are probably related to the estimated emissions inventory. Andrade et al. (2004) have shown the impact of considering the official emission inventory for NOx and VOC in the ozone simulation. The ratio between the two pollutants resulted in no ozone formation. Since 2004, the Brazilian Regional Atmospheric Modeling System with Simplified Photochemical Module (BRAMS-SPM) modeling system has been applied in the Metropolitan Area of São Paulo (MASP) to evaluate the impact that increases in the size and population of urban areas have on the weather-based forecast of air quality.
Studies concerning air quality and its effect on climate and health have been conducted in the MASP since the 1970s, the first such studies focusing on regulated pollutants, concentrations of particles, and speciation. The MASP presents particular characteristics in terms of atmospheric pollutant sources, climate, land use, and land occupation, when compared with other megacities in the world.
In the 1960s, the MASP received large numbers of immigrants from other states in Brazil, attracted by job opportunities related to industrial expansion in the region. As a consequence, there was a degradation of air quality conditions with high concentrations of pollutants, mainly SO2 and CO, emitted by industrial activities, and there were at that time no controls on the emissions of air pollutants. In the late 1990s, the vehicle fleet showed rapid growth due to tax cuts, the availability of credit, an increase in the size of the working population, and higher incomes. Vehicle emissions are currently the main source of air pollution in the urban areas of Brazil. The light-duty fleet runs on ethanol, gasohol (85% gasoline and 25% hydrous ethanol), or natural gas, whereas heavy-duty vehicles (busses and trucks) run on diesel. There are also the so-called “flex-fuel” vehicles that can run on gasohol or ethanol.
In comparison with other urban areas of Brazil, the MASP has the best network of air quality monitoring stations, which therefore provide data with the highest spatial resolution. Air quality monitoring began in the late 1970s with the measurement of particulate matter of less than 10 μm in diameter (PM10) and SO2 by the São Paulo State Companhia de Tecnologia de Saneamento Ambiental (CETESB, Environmental Protection Agency). Orsini et al. (1986) were the first to analyze the composition of particulate matter in the MASP, using particle-induced X-ray emission analysis of polycarbonate membranes sampled with cascade impactors and sequential samplers. Sources were identified by receptor modeling, vehicle emissions being identified as the main source of fine particles, which remains the case. The receptor modeling approach has been applied for many years, producing significant results related to source apportionment in the MASP. In other regions of Brazil, air quality issues have only recently come to be considered a major concern. The World Health Organization (WHO) recently evaluated the worldwide impact of particulate matter on health and estimated that, in 2011, 7 million people died as a result of high atmospheric concentrations of particles, mainly in developing countries such as China and India, which are the most populous countries and have high concentrations of pollutants, 4.3 million of those deaths being associated with indoor pollution and 3.7 million being associated with atmospheric pollution from rural and urban sources (WHO, 2014).
The application of air quality models is considered to be a powerful tool for the study, description and forecasting of air pollution in areas affected by urban pollution, biomass burning, and resuspended soil dust, as described by Krzyzanowski et al. (2014). According to those authors, the concentrations of pollutants can be estimated through the use of three-dimensional models, combined with direct measurements and analysis of satellite images. The three-dimensional air quality models describe the chemistry, emissions, and transport of pollutants. The representation of emissions on a grid of adequate size provides a great deal of certainty. The modeling approach taken in different cities in the southeastern region of Brazil has been evolving, and most of the efforts have been focused on the construction of a comprehensive emissions inventory. In the MASP, the emissions inventory is based on vehicle emission factors (dynamometer measurements) and tunnel measurements performed in the city of São Paulo in 2001 and 2004 (Martins et al., 2006; Sánchez-Ccoyllo et al., 2009), as well as on experiments conducted in 2011 (Nogueira et al., 2014; Pérez-martínez et al., 2014).
Due to a lack of information from CETESB and from the Brazilian National Department of Transplantation (DENATRAN), various strategies have been employed in order to determine the spatial distribution of emission sources in the MASP. One such strategy is the use of nocturnal satellite data to describe the distribution of sources by their density, on the basis of pixel density, as described in Martins et al. (2012). After the changes in fuel composition that occurred between 2004 and 2011, that approach was used in regional studies aimed at analyzing the impact that those changes have had on the behavior of ozone concentrations (Vara Vela, 2013). Mazzoli (2013) analyzed how tropospheric ozone concentrations in the MASP would respond to the climate change scenarios described in the Fourth Assessment Report by the Intergovernmental Panel on Climate Change, as well as to projected changes in the local emissions of pollutants, showing that, in 2030 and 2050, changes in the size of the vehicle fleet and in vehicle emission factors would have an effect of greater magnitude than that related to the predicted changes in temperature and humidity.
Although many photochemical modeling studies have been performed in Brazil, most have been conducted in the MASP, although some have been conducted in the city of Rio de Janeiro. Godoy et al. (2009), using receptor modeling, found that vehicle emissions constitute the main source of pollutants in the city of Rio de Janeiro. Luna et al. (2014), using neural network analysis, developed a system for ozone prediction. In all such initiatives, one important objective is to provide a tool that can be used by governmental agencies to predict events of high pollutant concentrations, which will make it possible to issue alerts and prepare emergency rooms to receive cases related to the poor air quality. Other cities in South America, such as Santiago, Chile, have action plans for such eventualities (Saide et al., 2011). In Brazil, there are national air quality standards for regulated pollutants. However, the state of São Paulo has changed its standards to be more restrictive, in accordance with the WHO guidelines (CETESB, 2014). The state standards will be changed gradually, in three phases, the last of which involves setting the maximum allowable concentrations of regulated pollutants to the values recommended by the WHO.
Air quality modeling can be an effective tool to meet the challenge of describing the chemistry of secondary pollutant formation, specifically that of ozone and fine particles. In the MASP, the study of the formation of ozone and other gaseous photochemical compounds started with the off-line use of the California Institute of Technology air quality model (McRae et al., 1982). In two studies employing that model (Andrade et al., 2004; Vivanco and Andrade, 2006), the atmosphere of the MASP was found to have a high potential to form ozone and that the concentrations of nitrogen oxides (NOx) in the official emissions inventory are twice as high as those that would be expected on the basis of modeling results and the concentrations measured at air quality monitoring stations. Important aspects of ozone formation in the MASP were studied by Martins et al. (2006), who identified the main precursors of tropospheric ozone, and by Martins and Andrade (2008a), who demonstrated an increase in the reactivity of the ozone precursors in the region.
The impact of meteorological conditions on ozone formation in the MASP was evaluated by Sánchez-Ccoyllo et al. (2006, 2007), who used the California Institute of Technology air quality model under NOx- or volatile organic compound (VOC)-limited atmospheric conditions. Martins and Andrade (2008b) analyzed various scenarios of the use of pure ethanol, gasohol, and diesel in the MASP, concluding that an increase in the use of ethanol, with a consequent decrease in the use of the gasohol currently available in Brazil, would reduce ozone formation. However, when the analysis involved “better” gasohol (with lower fractions of olefins, aromatics, and benzene) the difference between two scenarios (ethanol vs. standard gasohol and ethanol vs. better gasohol) was small and shifted between positive and negative values, indicating that the use of gasohol containing fewer olefins and aromatics would be more efficient in decreasing ozone concentrations than would be a shift toward greater ethanol use. The modeling capability has been increased by experimental studies aimed at improving the emissions inventory and describing the atmospheric processes. Such experiments consist of measurements of ozone precursors (Nogueira et al., 2014); fine and ultrafine particles (Almeida et al., 2014); and emission factors (Nogueira et al., 2014; Pérez-martínez et al., 2014). Combining all the efforts that have been applied to the representation of pollutants with air quality models in the MASP, an operation was implemented in order to forecast the concentrations of ozone, carbon monoxide, and particles. The forecasts are run daily and are available for consultation at the site: http://www.lapat.iag.usp.br/aerossol/wrf9/index.php. The air quality modeling platform established for southeastern Brazil represents efforts to meet a variety of challenges in the atmospheric sciences: the description of the chemistry of reactive species; the characterization of transport by advection and diffusion; and the development of reliable emissions inventories. Air quality is being forecast with two different tools: the WRF/Chem (Grell et al., 2005); and the BRAMS-SPM (Freitas et al., 2005, 2009). The modeling is an example of combination of measurements of emission factors and ambient concentrations, and the spatial representation of emission using the traffic and street maps as a proxy, to construct the module of mobile emission. This modeling approach can be considered for other places impacted by the pollutants emitted by the vehicular fleet that do not have the spatial and temporal distribution of the mobile sources.
Materials and Methods
The approach adopted to provide the air quality forecasting for the Southeast region of Brazil was the use of eulerian photochemical modeling. Two modeling systems are being used: WRF-Chem [Weather Research and Forecasting System with Chemistry, described in Grell et al. (2005)] and BRAMS-SPM [Brazilian developments on the Regional Atmospheric Modeling System with Simplified Photochemical Module, described by Freitas et al. (2005) and Freitas et al. (2009)]. The implementation of the modeling system had the objective of forecasting regulated pollutants and the study of secondary pollutants formation and health impacts. The photochemical modeling system was integrated to an emission module developed to describe the real conditions of traffic distribution over the modeled area.
Study Region
The modeling area includes the states of São Paulo and Rio de Janeiro, as well as parts of the states of Paraná, Minas Gerais, Espirito Santo e Santa Catarina (Figure 1). It is the most industrialized area in the country, comprising the metropolitan areas of São Paulo (19,683,975 inhabitants), Rio de Janeiro (11,835,708 inhabitants), Belo Horizonte (5,414,701 inhabitants), and other major cities. The region accounts for 55% of the national gross domestic product, being the state of São Paulo alone accounting for approximately 33% of it. It encompasses 150 points in longitude and 100 points in latitude. The model has a horizontal grid spacing of approximately 9 km, 35 vertical levels, and 84 h of integration. The horizontal grid spacing was established based on the size of the urbanized area (approximately 80 km in the W–E direction and 40 km in the N–S direction) in order to satisfactorily represent mesoscale circulations due to the urban heat island, the local topography and the sea-breeze that are frequently observed in the region and are fundamental to the processes involving pollution dispersion, such as horizontal advection, re-circulation, vertical transport, deposition, and others.
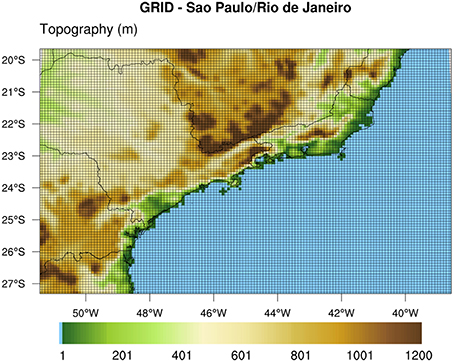
Figure 1. Area considered in the simulations, showing elevations (m).
BRAMS-SPM Modeling
As part of Brazilian efforts to develop numerical tools for weather and air quality forecasting in tropical regions, especially in South America, the Regional Atmospheric Modeling System (RAMS) adapted for use in Brazil (Cotton et al., 2003; Freitas et al., 2009) was augmented with a module designated the Simplified Photochemical Module described in Freitas et al. (2005). This version of the model is being called the BRAMS-SPM and is running in an operational mode at the Institute of Astronomy, Geophysics and Atmospheric Sciences of the University of São Paulo (IAG-USP), with the goal of forecasting the concentrations of tropospheric ozone, nitrogen oxides, VOCs, sulfur dioxide, and small particles (PM10 and PM2.5) over the MASP, in a 48–72 h time frame. Considering its application over very large urban regions, the BRAMS-SPM is also capable of representing in a very consistent way the effects of the urban structure, as well as those of anthropogenic heat and moisture emissions, by using the Town Energy Budget parameterization, as initially proposed by Masson (2000) and first introduced into the RAMS model by Rozoff et al. (2003), in conjunction with the soil-vegetation-atmosphere transfer scheme, the Land Ecosystem-Atmosphere Feedback model, version 2 (Walko et al., 2000). This is a very important feature, because urban air quality is highly dependent on mesoscale circulations generated by anomalous urban heating and roughness, creating the so called urban heat island effect, mentioned in studies conducted in various countries (Oke, 1987; Yoshikado and Tsuchida, 1996; Ichinose et al., 1999; Baik et al., 2001; Cenedese and Monti, 2003; Gedzelman et al., 2003; Childs and Raman, 2005; Jonsson, 2005; Freitas et al., 2007; Roth, 2007). Urban traffic behavior is simulated by considering pollutants and anthropogenic fluxes (of heat and moisture). Rush hours are taking into account by superposing two normal distributions, each centered on the peak hours during the morning and the afternoon, respectively, as described by Freitas et al. (2007).
As proposed by Masson (2000), the model uses the urban canyon approach, in which a street or road is flanked by two facing walls that are similar in terms of height, width, and roughness, as well as thermal properties such as albedo, conductivity, and emissivity). Although the urban canyon approach uses the properties of the buildings in an urban area, the main differences found in urban areas are also considered in the model by defining four different urban types in Land Use/Land Class (LULC) images. Figure 2 shows the LULC image, adapted from Gouvêa (2007), for the MASP. As can be seen, the LULC image for the MASP defines four different urban or suburban types. Each of the urban types has a different structure. Table 1 shows the characteristics of the urban/suburban types defined for the MASP and used in the BRAMS-SPM model. The model is also equipped with important physical parameterizations, including turbulence; deep and shallow convection; microphysics; and soil-vegetation-atmosphere interaction. The main physical parameterizations frequently used during air quality simulations are presented in Table 2.
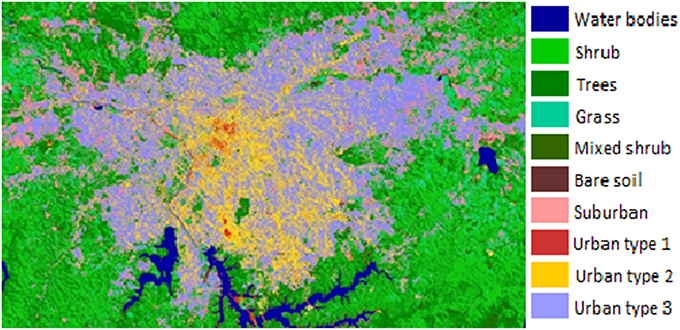
Figure 2. Land Use/Land Class image used in the BRAMS-SPM model for the Metropolitan Area of São Paulo. Adapted from Gouvêa (2007).
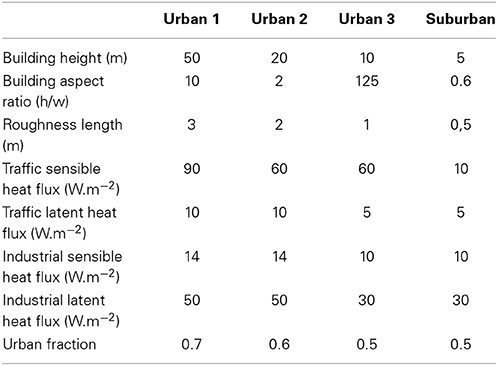
Table 1. Some values of Town Energy Budget parameters used in the BRAMS-SPM model to differentiate characteristics based on the urban canyon concept.
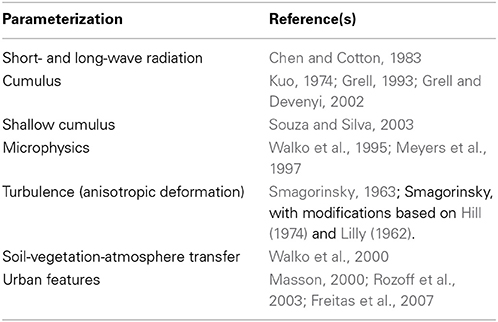
Table 2. Physical parameterizations used in the BRAMS-SPM.
WRF/Chem Modeling
The WRF/Chem is a non-hydrostatic mesoscale numerical weather prediction system designed for use in atmospheric research and operation forecasting. The system was developed through a collaborative effort among institutions and is available at http://www.mmm.ucar.edu/wrf/users (Skamarock et al., 2008). As described by Grell et al. (2005), the WRF/Chem has a meteorological component coupled with a chemistry module. This chemistry module is an atmospheric chemistry approach to representing gaseous, aerosol, and aqueous chemistry processes. Various user-selected combinations of chemistry schemes are available to represent the chemical and physical processes of gasses and aerosols, such as dry deposition; biogenic and anthropogenic emissions (from stack and vehicular sources); biomass burning; and aerosol schemes.
In WRF/Chem a preprocessing scheme (WPS), with the grid system and geographical data (i.e., topography, land use, ground cover, etc.) are defined and used in order to prepare the fields. For this task WRF/Chem uses the High Resolution Land Data Assimilation System (HRLDAS) which prepares surface initial fields in agreement with the grid domain and horizontal grid spacing. Details of this procedure can be found at http://www.ral.ucar.edu/research/land/technology/lsm/noah/hrldas/HRLDAS_USERS_GUIDE.pdf. The model is managed by a namelist type file (namelist.input), in which users can chose and setup the chemical and physical parameterizations, as well as the time step, simulation period, grid configuration, output time, and types of emissions (such as biogenic, anthropogenic, biomass burning, dust, and industrial stack emissions). The last step is the post processing, which can be done using the ARW program or a similar program in order to visualize the outputs. The computer system used is an SGI Altix XE 1300 Cluster. The system is composed by 8 computing nodes, each of them having 2 Intel Xeon 6 core 2—12 threads @ 3.07 GHz processors. During the simulations, we use 48 threads (2 nodes—4 processors) and the mean computational coast is approximately 13 min of processing for each simulated hour. In order to simulate 84 fours we spend about 18 h of processing.
The configurations that are being considered in the version of the model that is running operationally are presented in Table 3. The chemistry mechanism for the gas phase is the carbon-bond mechanism, version Z [CBM-Z, Zaveri and Peters (1999)], and the Model for Simulating Aerosol Interactions and Chemistry [MOSAIC, Zaveri et al. (2008)] is being used in the description of aerosols. The CBM-Z considers 67 prognostic species and 164 reactions with lumped hydrocarbons. The MOSAIC scheme considers the main aerosol species, including sulfate, nitrate, ammonium, sodium, calcium, black carbon, organic carbon, and liquid water with a sectional representation for the size distributions. This combination (CBMZ/8-bin MOSAIC) allows ethanol and other oxygenated compounds to be represented explicitly. Figure 3 presents the characteristic intervals for the size distribution of the fine and coarse aerosol considered in the MOSAIC scheme for the aerosols in the MASP, according to the data collected with a rotating cascade impactor and analyzed to provide the mass size distribution of the aerosol concentration and its composition in metals, sulfate, nitrate, ammonium, black carbon, organic carbon, and other compounds that can be explicitly represented in the model.
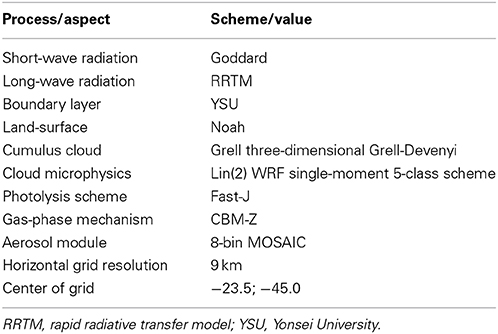
Table 3. Model configuration options in the WRF/Chem simulations.
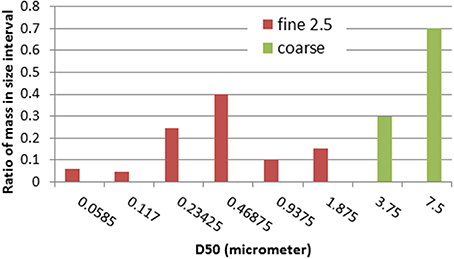
Figure 3. Proportion of the aerosol mass distributed at each size interval considered in the MOSAIC approach applied to the simulations.
Data Sources
Anthropogenic Emissions
The main source of atmospheric pollutants in the metropolitan areas of southeastern Brazil is vehicle emissions. In this study, we collected information from CETESB, from the IAG-USP Laboratory of Atmospheric Processes, and from DENATRAN. Emission factors for different vehicle types (motorcycles, light-duty vehicles, and heavy-duty vehicles) and different fuel types (gasohol, ethanol, combination of any proportion of gasohol and ethanol, and diesel), as well as intensity of use were obtained from CETESB reports (CETESB, 2012). Studies conducted at the IAG-USP Laboratory of Atmospheric Processes provided emission factors estimated from in-tunnel field campaigns, as well as temporal distribution (Martins et al., 2006; Sánchez-Ccoyllo et al., 2009; Nogueira et al., 2014; Pérez-martínez et al., 2014). Information on the numbers of vehicles in the different categories is available on the DENATRAN website (http://www.denatran.gov.br/frota.htm). For the spatial distribution, we assumed that the vehicles within the modeling domain were distributed proportional to the road length in each grid cell. Road length was calculated as the sum of various types of road within each grid cell. The road map is available on the OpenStreetMap website (http://www.openstreetmap.org). Initially, the total number of vehicles was calculated, on the basis of DENATRAN data for 2014, for each state within the modeling domain (Table 4). The proportional distribution of vehicles, by fuel type, is shown in Table 5. For each type of vehicle/fuel combination, an average intensity of use was estimated from CETESB data (CETESB, 2012), as shown in Table 6.
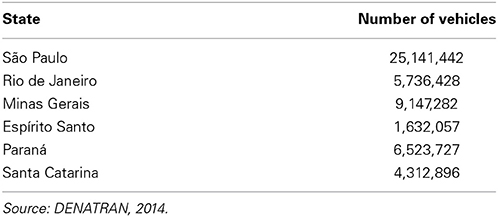
Table 4. Total number of vehicles in each of the states within the modeling domain.
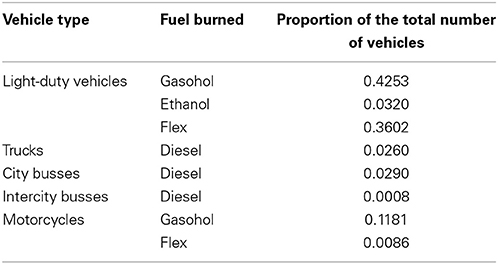
Table 5. Vehicle types and proportional use of fuels.
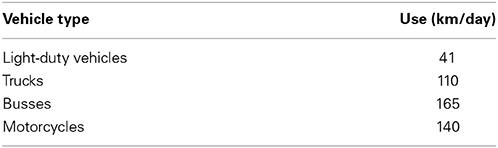
Table 6. Intensity of use, by vehicle type.
Emission factors were preferentially taken from the tunnel experiments. However, when those were not available, CETESB (2010) emission factors were used if they corresponded to the same period evaluated in the tunnel experiments. Figure 4 shows the emissions factors for CO, NOx, SO2, and PM10, whereas Figure 5 shows the VOC emission factors related to exhaust, evaporative, and liquid emissions for vehicles running with gasohol and flex fuel vehicles (as they can run with ethanol and gasohol). The VOC speciation was made considering measurements performed in tunnels and with dynamometers.
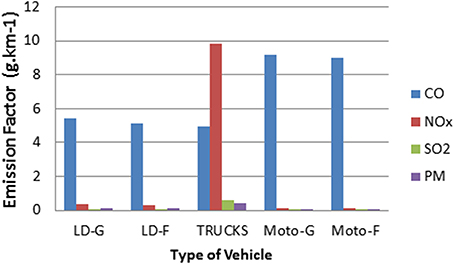
Figure 4. Emission factors for CO, NOx, SO2, and particles for different vehicle type/fuel combinations. LD-G, light-duty vehicles burning gasohol; LD-F, light-duty vehicles flex-fuel; Moto-G, motorcycles burning gasohol; Moto-F, motorcycles flex-fuel.
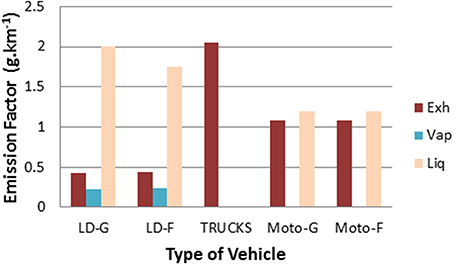
Figure 5. VOC emission factors from exhaust, evaporative and liquid emissions. Exh, exhaust; Eva, evaporative; Liq, liquid; LD-G, light-duty vehicles burning gasohol; LD-F, light-duty vehicles flex-fuel; Moto-G, motorcycles burning gasohol; Moto-F, motorcycles flex-fuel.
Figure 6 presents the relative fractions of VOC emissions from different processes and fuels. These fractions are the proportions emitted considering the VOC emission, which is calculated based on the emission factors presented in Figure 4. Because large amounts of ethanol are consumed in Brazil, we represent explicitly the emission of ethanol, formaldehyde, and acetaldehyde from exhaust. The values used were 0.25 g/km, 0.01 g/km, and 0.03 g/km, respectively, for vehicles burning ethanol. We assumed that all the grid cells would have the same temporal distribution of emissions. Figure 7 shows the normalized average vehicles counts from the tunnel experiments. Finally, road length (the sum of motorway, trunk, primary, secondary, and tertiary types of roads) was calculated for each grid cell, as shown in Figure 8.
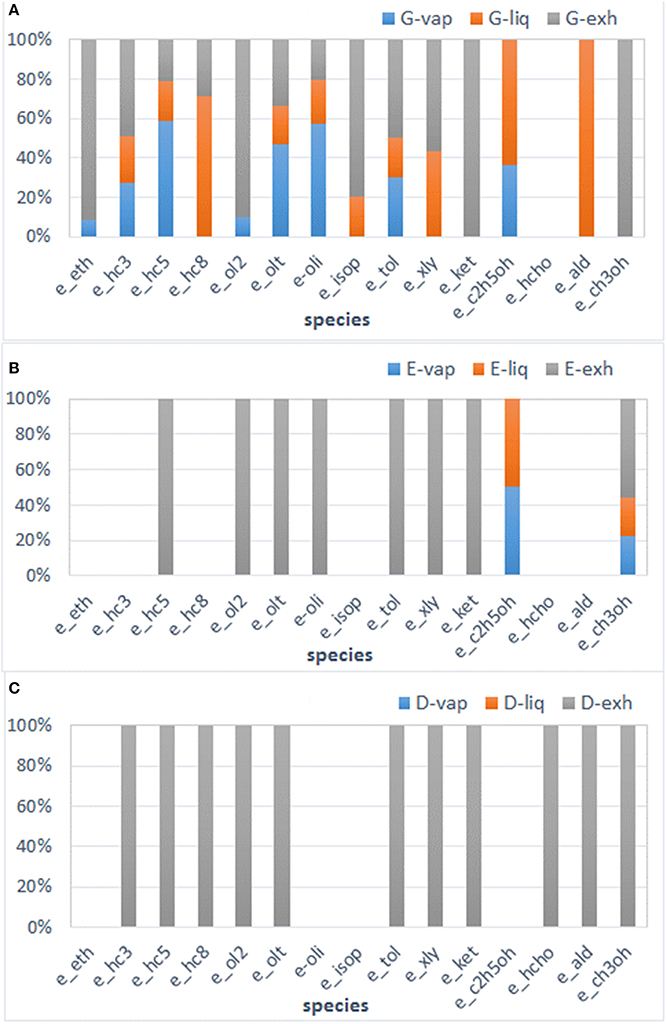
Figure 6. VOC fractions for exhaust, evaporative, and liquid emissions from gasohol (A), ethanol (B), and diesel (C). G, gasohol; E, ethanol; D, diesel; -vap, evaporative; -liq, liquid; -exh, exhaust; e_eth, ethane and alkanes with kOH < 0.5 × 10³ ppm−1 min−1; e_hc3, propane and alkanes with kOH 0.5 × 10³–5.0 × 10³ ppm−1 min−1; e_hc5, alkanes with kOH 5.0 × 10³–1.0 × 10⁴ ppm−1 min−1; e_hc8, alkanes with kOH > 1.0 × 10⁴ ppm−1 min−1; e_ol2, ethylene; e_olt, propylene and alkenes with <2.0 × 10⁴ ppm−1 min−1; _e_oli, dienes and alkenes with >2.0 × 10⁴ ppm−1 min−1; e_isop, isoprene; e_tol, benzene and aromatics with <2.0 × 10⁴ ppm−1 min−1; e_xly, xylenes and aromatics with >2.0 × 10⁴ ppm−1 min−1; e_ket, ketones; e_c2h5oh, ethanol; e_hcho, formaldehyde; e_ald, acetaldehyde and other aldehydes; e_ch3oh, methanol.
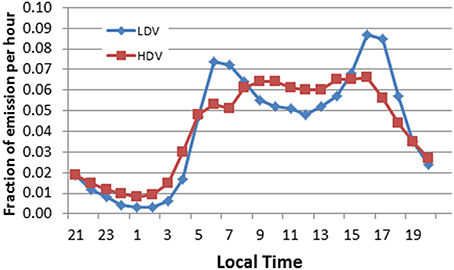
Figure 7. Temporal distribution of emissions for light-duty vehicles (LDV, including motorcycles) and heavy-duty vehicles (HDV).
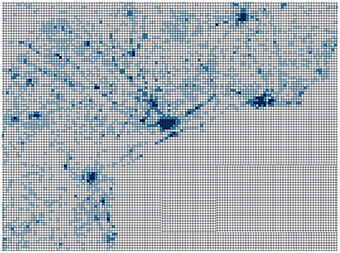
Figure 8. Road length (in km) for each 9 × 9 km grid cell.
Air Quality and Meteorological Data
The modeling is being evaluated by comparing experimental data (meteorological parameters and pollutant concentrations, measured at different points in the area) and simulation data. The air quality data that is being considered for comparison in the MASP is provided by the CETESB air quality network. The location of the air quality stations and the parameters measured are presented in Table 7. Other information regarding the measurement of hydrocarbons, ozone precursors, and particles are from experimental campaigns carried out at different sites, mainly in the MASP, and from the IAG-USP Laboratory of Atmospheric Processes. To evaluate particle size distributions for mass, number distribution of fine particles, and cloud condensation nuclei, a micro-orifice uniform deposit impactor was employed (Ynoue and Andrade, 2004), whereas particle concentrations and composition were evaluated with receptor modeling (Andrade et al., 2012b; Miranda et al., 2012).
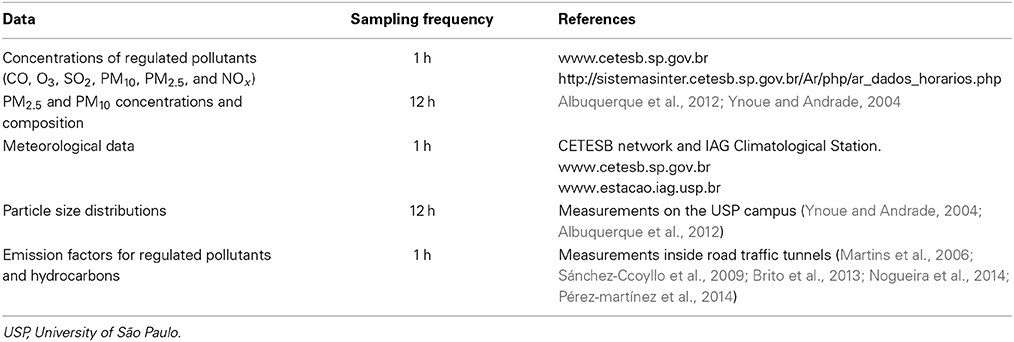
Table 7. Surface data available for evaluation of the modeling results.
To study the vertical profile of ozone, ozonesondes have being launched in the downtown area of the city of São Paulo. There were two experimental campaigns, one conducted in 2006 (Andrade et al., 2012a), with eight soundings in the fall (from May 15 to May 18) and eight in the spring (from October 29 to November 1), and another conducted in 2013 (Andrade et al., 2014), 10 ozonesondes being launched between October 29 and November 4. The parameters analyzed were ozone concentration, wind direction, wind velocity, and temperature. Simulations with WRF-Chem for the period when the ozonesondes were launched, from October 29 to November 4 were performed in order to determine the quality of the simulations by comparing the modeled and measured data. Figure 9 shows the comparison between modeling and measurement for ozone concentration and temperature, on November 2. The major differences were in ozone concentration near the surface, which could be associated with the great uncertainty in the emissions inventory. One important point was the presence of clouds affecting ozone formation near the surface on that day.
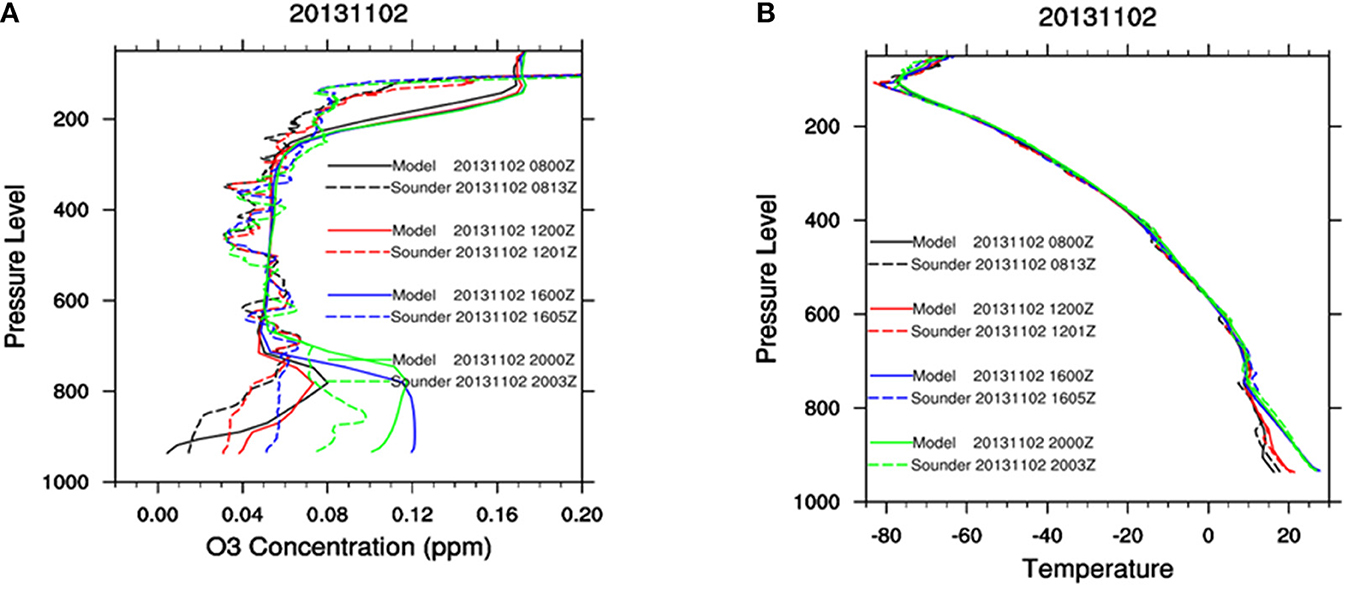
Figure 9. Comparison between sounding and modeling for ozone (A) and temperature (B), on November 2, 2013.
Results from the WRF-Chem Model
Hourly data collected from 2011 until the present have been compared with the measurements of NOx, CO, ozone, and particles, to evaluate the performance of the model. The incorporation of better descriptions of the emission profiles and a representation of the atmospheric chemistry have made it possible to provide a forecast (www.lapat.iag.usp.br/). Some results of a recent case study are presented in order to illustrate the importance of forecasting the behavior of pollutants.
Case Study: Summer 2013/2014
The comparison between measurement and modeling is presented for the period of January–February 2014. The summer of 2013/2014 was chosen because it was a period when there was considerably less precipitation and humidity than would be expected on the basis of the historical climatological data (for 1933–2013). During the summer months of December 2013, January 2014, and February 2014, the total rainfall was 352.5 mm, compared with the climatological mean of 634.8 mm. Total rainfall was 199.3 mm in January and 81.1 mm in February, compared with the climatological means of 231.9 mm and 212.5 mm, respectively. In the summer of 2013/2014, the temperature was also above the climatological mean. In February, the relative humidity was below 40% on 17 days, whereas the historical mean is 2 days. During the summer of 2013/2014 as a whole, there were 27 days on which the relative humidity was below 40%.
The quality of the simulation, in comparison with direct measurement, was evaluated with the statistical parameters correlation, bias, root mean square decomposed into two components: systematic RMSDs and unsystematic RMSDu, and agreement index, according to Willmott et al. (1985) and Lu et al. (1997). The statistical parameters for ozone, NOx, and PM2.5 are presented in Table 8 for the station located at the Institute for Energy Research and Nuclear Science on the campus of the University of São Paulo, IPEN station (23°33'S; 46°44'W). The strongest and weakest correlations found were for ozone and PM2.5, respectively. Figure 10 shows the comparison between the measured and simulated values (with the standard deviation) for O3, NOx, and PM2.5 for the January–February 2014 period for the IPEN station. The high concentrations during that period are associated with the favorable atmospheric conditions of less precipitation and high temperatures. The panels (A, B, C) illustrate the concentration and standard deviation of measured and simulated O3, NOx, and PM2.5, respectively, panels (D, E, F) illustrate the Root-Mean-Square-Deviation (RMSD) separate in systematic (RMSDs) and unsystematic (RMSDu) for the same pollutants, and (G, H, I) illustrate the agreement index for the studied pollutants. The RMSDs, the linear bias, explains most of the RMSD for the PM2.5, while for O3 the RMSDu, the accuracy of the simulations is lower. The agreement indices indicate that the ozone pattern simulations in the afternoon are in good agreement with observations, but for NOx and PM2.5 the model is not accurately representing the concentrations measured.
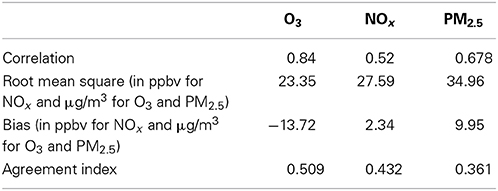
Table 8. Statistical parameters indicating the quality of the simulation for the period of January–February 2014.
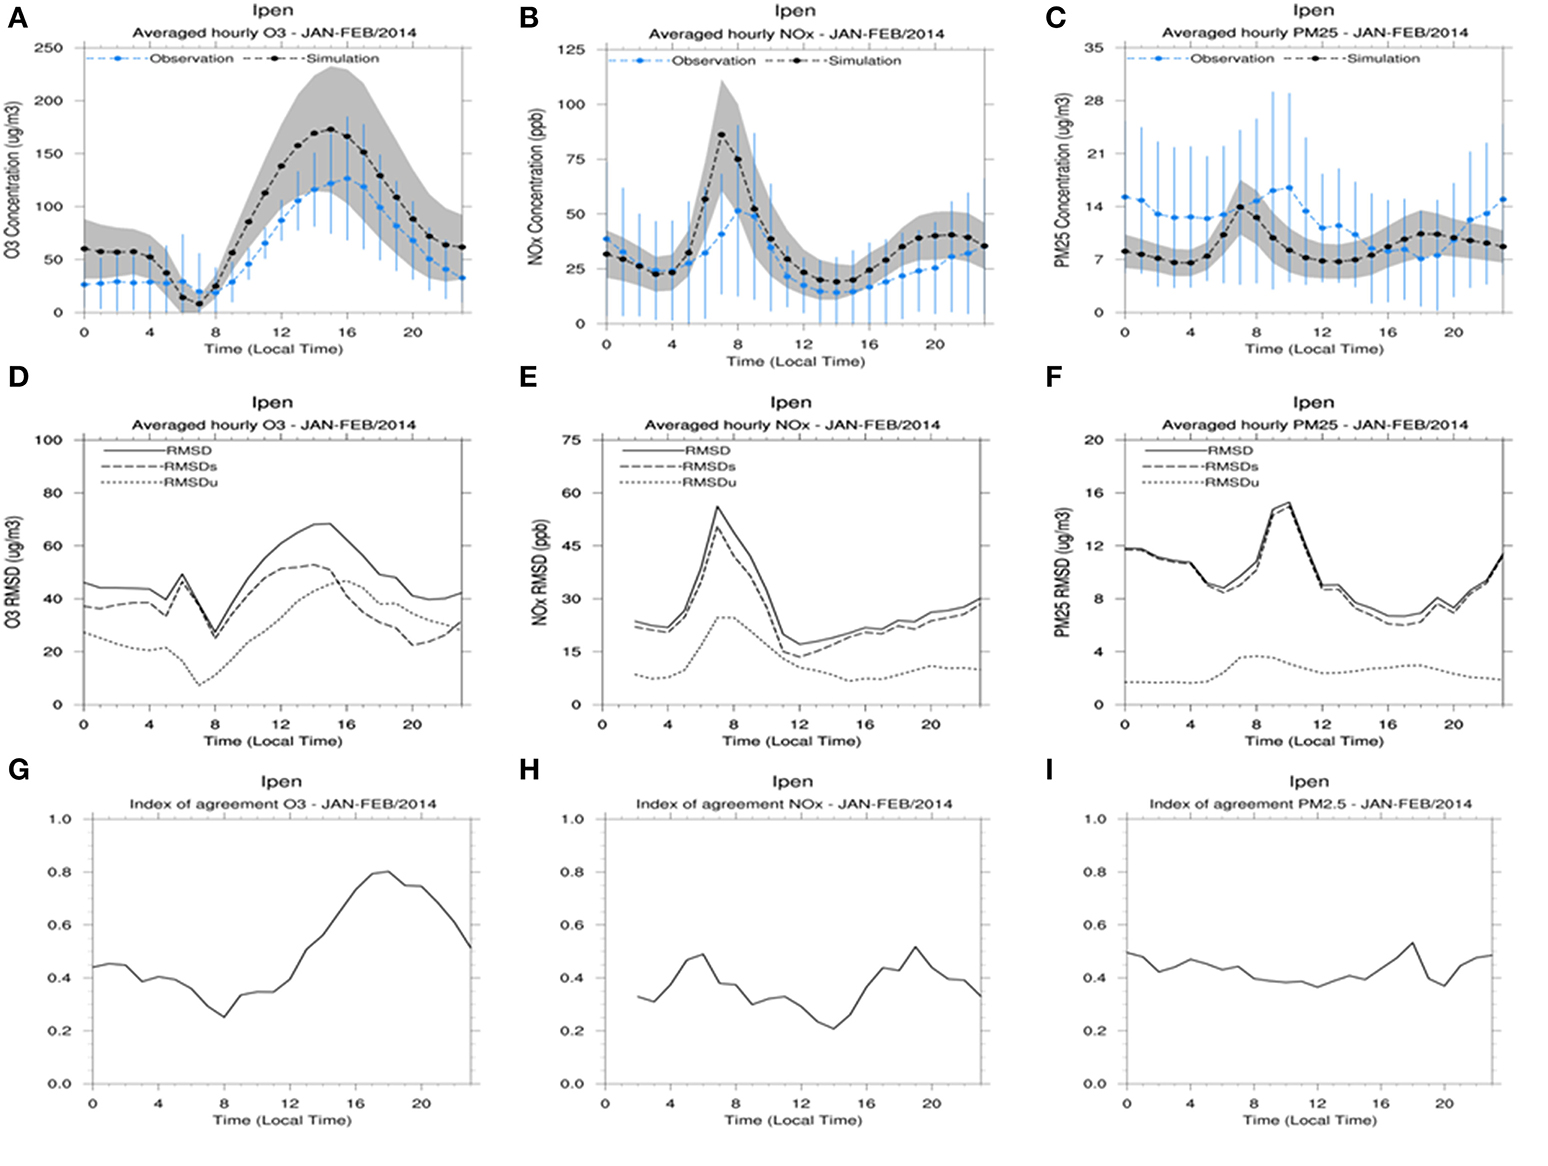
Figure 10. Comparison between modeled and simulated values for O3, NOx, and PM2.5 during the January–February 2014 period for the air quality monitoring station at the Instituto de Pesquisas Energéticas e Nucleares (IPEN, Institute for Energy Research and Nuclear Science) on the campus of the University of São Paulo. (A–C) Illustrate the concentration and standard deviation of measured and simulated O3, NOx, and PM2.5, (D–F) illustrate the Root-Mean-Square-Deviation (RMSD) separate in systematic and unsystematic, and (G–I) illustrate the agreement index for the studied pollutants.
The spatial distribution of the pollutants illustrates the role that wind plays in the transport and position of the highest concentrations of the secondary compounds. Figure 11 presents the concentrations of NOx and ozone at 6:00 a.m., 12:00 p.m., and 6:00 p.m. on January 3 for the entire grid. The metropolitan areas are sources of pollutants that affect the surrounding areas according to the topography and meteorological systems. The coast of the southeastern coast of Brazil region induces the sea-breeze circulation, and the proximity with mountains to the northwest trap the plume in that direction. The highest concentration of ozone was to the southeast, induced by the strong solar radiation during the period and wind circulation to the southeast, which is in agreement with patterns of (mesoscale) wind circulation at this time.
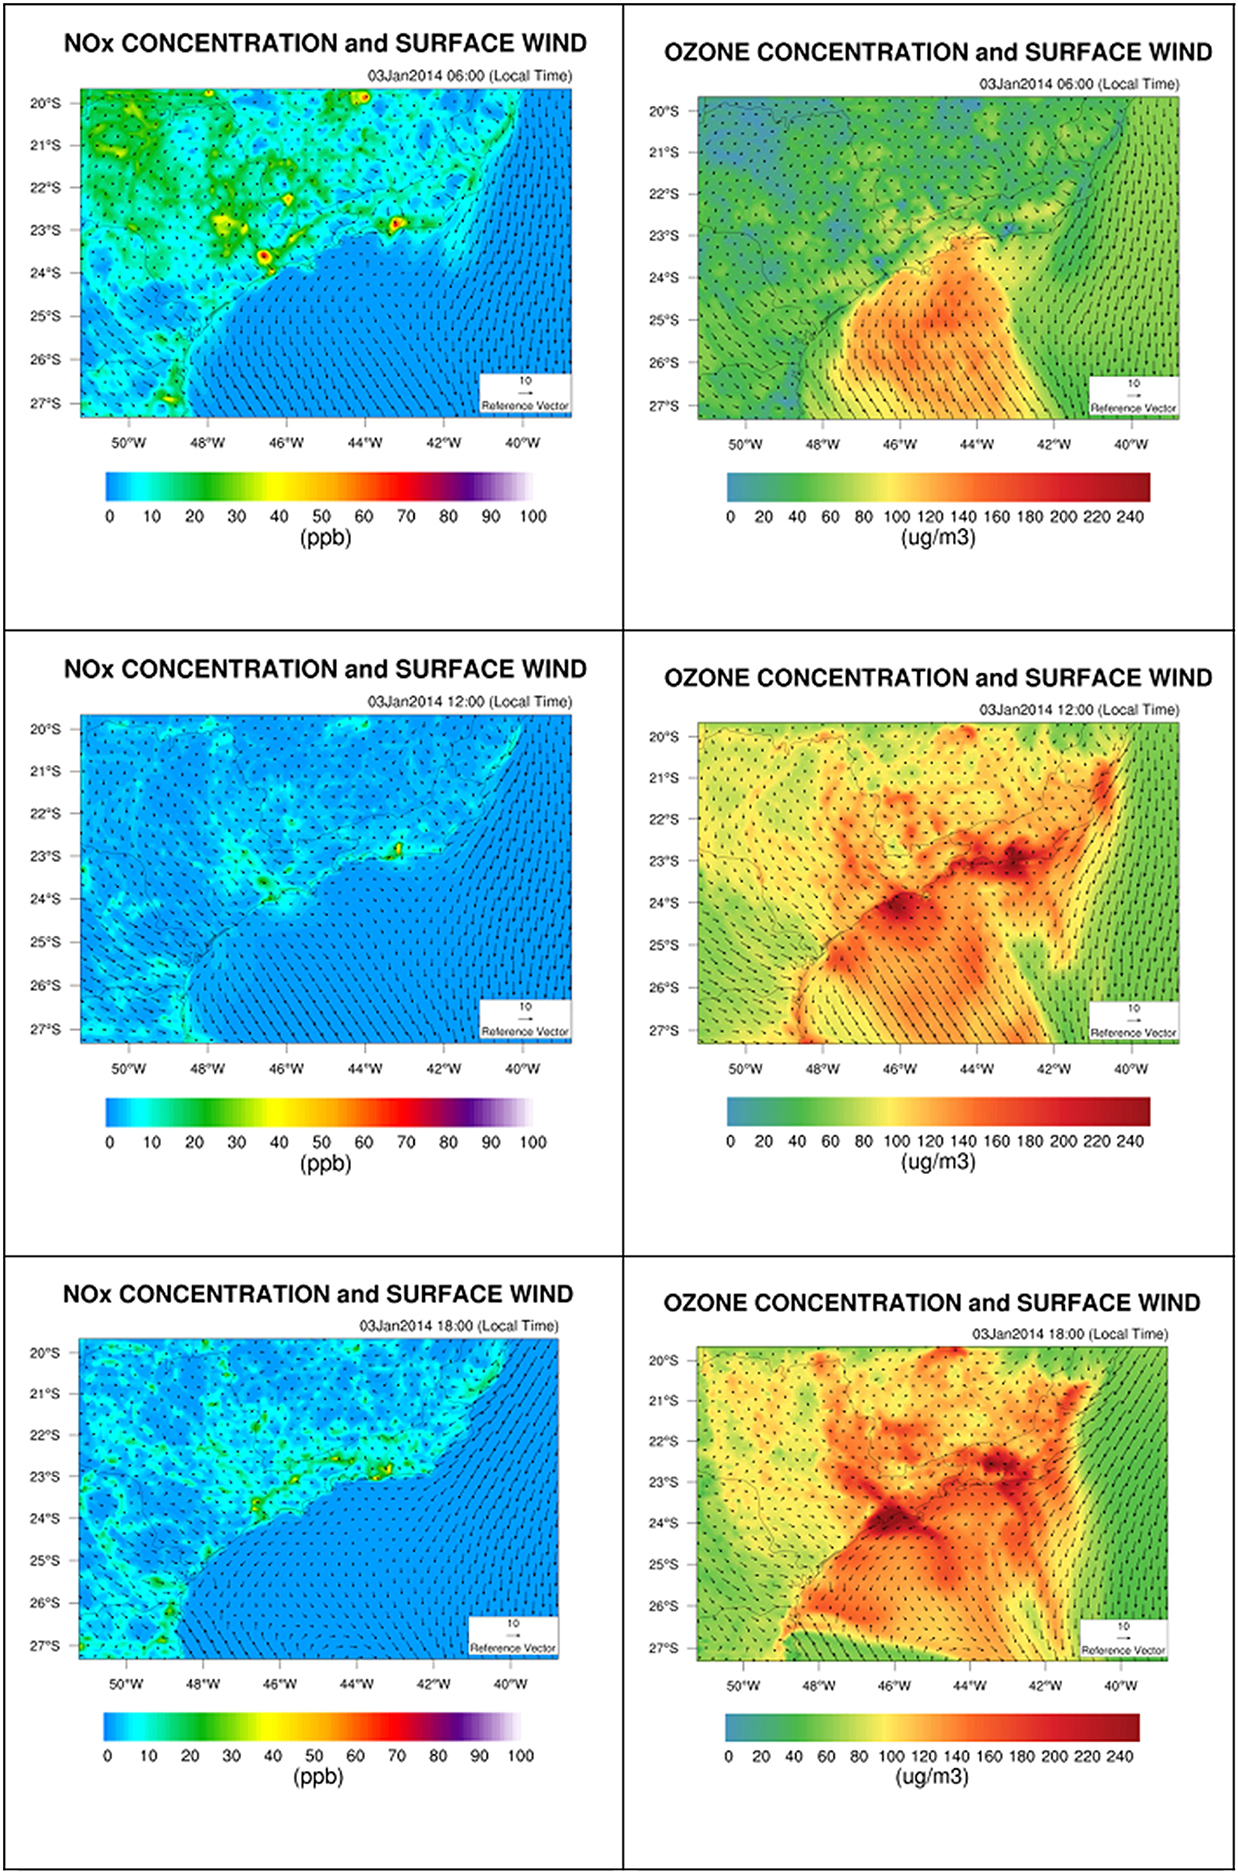
Figure 11. Spatial distribution of NOx (left side) and ozone (right side), for the modeling area as a whole, at 6:00 a.m. (top), 12:00 p.m. (middle), and 6:00 p.m. (bottom) on January 3, 2014.
Results from the BRAMS-SPM Model
In recent years, the BRAMS-SPM model has been applied in a large number of studies conducted in Brazil, most focusing on the atmosphere over the MASP, over the Metropolitan Area of Rio de Janeiro, or over the central region of the country (Vendrasco et al., 2009). For example, Carvalho (2010) applied the BRAMS-SPM model for the study of ozone concentrations near the surface over the Metropolitan Area of Rio de Janeiro during the summer and autumn of 2007. Industrial and vehicle emissions during the simulations were provided by the Rio de Janeiro State Environmental Agency, and their spatial distribution is shown in Figure 12. The vehicular emissions input files in the SPM-BRAMS model were built based in the urban areas identification and emission data available. Industrial emissions were added through a text file addressed in the model namelist (RAMSIN File).
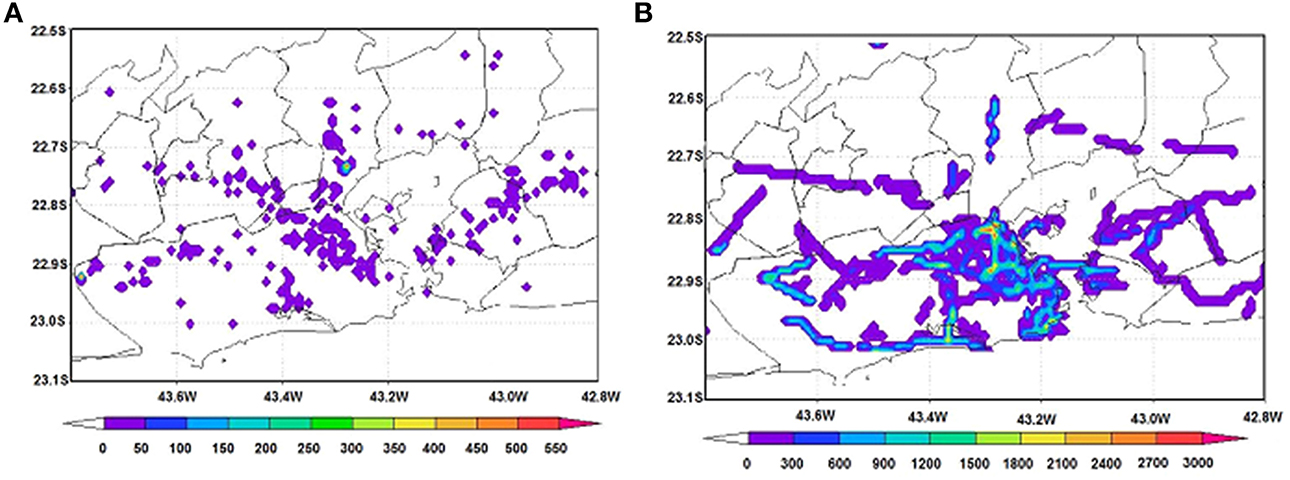
Figure 12. Spatial distribution of industrial emissions of SO2 (A) and vehicle emissions of CO (B) over the Metropolitan Area of Rio de Janeiro in 2007. Sources: Rio de Janeiro State Environmental Agency; Carvalho (2010).
The diurnal cycle of vehicle emissions was based on the mean cycle of carbon oxide emissions between 2000 and 2008. Figure 13, obtained from Carvalho (2010), shows very good agreement between the observed and modeled values for ozone over a 10-day simulation period.
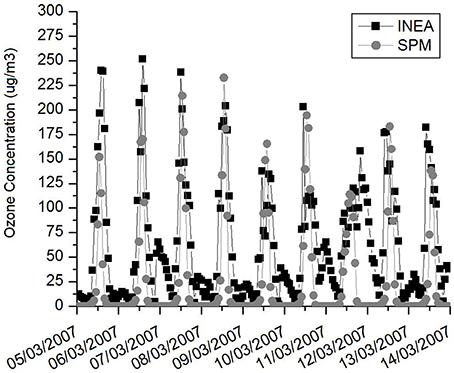
Figure 13. BRAMS-SPM-simulated values for ozone over two sites in the Metropolitan Area of Rio de Janeiro between March 5 and March 14 2007. Sources: Rio de Janeiro Instituto Estadual do Ambiente (INEA), State Environmental Agency; Carvalho (2010).
Discussion
We have presented operational tools, developed using the WRF/Chem and BRAMS-SPM models as platforms, for forecasting pollutant concentrations in the southeastern region of Brazil and for studying the photochemical formation of pollutants and secondary particles. Major efforts have been applied to describe the emissions inventory considering the real conditions of vehicular traffic in the metropolitan areas of the region. To that end, we applied a novel scheme using data from traffic counts and road distributions. With this recent implementation, the performance of the WRF/Chem model has improved. The statistical tests applied to compare simulation and measurement showed good quality for ozone but that it is necessary to improve the representation of the NOx and fine particles; the correlation between measured and simulated ozone concentrations was 0.84 with a bias of –13.7, showing that the model is representing the behavior of the pollutant but not the highest values. For fine particles the model is estimating average concentrations 10 μg/m3 higher than the measured values. NOx is a primary pollutant very difficult to evaluate due to the impact of local emissions from mobile sources to the concentrations measured at the air quality stations. With this performance, the modeling system can be applied to evaluate public policies concerning fuels and the distribution of urban sources of emissions. In order to achieve this objective the emission inventory module must be continuously updated with emissions factors and activity information for the mobile source. The uncertainties in the boundary conditions constitute important aspects that have to be correct evaluated, specifically to correctly represent the vertical profiles of the studied pollutants. Measurements of particulate matter size distributions of concentrations and compositions are important for the description of microphysics process of cloud formation and radiation scattering and absorption.
Conclusions
The forecasts of pollutant concentrations can be accessed by the community and authorities interested in air quality and its effects on public health. The implementation of the modeling system with an emphasis on vehicle emissions is important for the metropolitan areas in Brazil, because such emissions constitute a major source of air contamination. Consumer switching between ethanol and gasohol in response to fluctuations in their prices underscores the need for an accurate representation of the chemistry of the gas phase, including oxygenated compounds. In the metropolitan areas of Brazil, concentrations of fine particles and ozone are major concerns, which call for the ongoing improvement of the emission scheme. The emission scheme approximation for the spatial distribution of the mobile source developed in this study can be applied to other regions that would like to develop air quality modeling but don't have available the information needed to construct the mobile emission field.
Conflict of Interest Statement
The authors declare that the research was conducted in the absence of any commercial or financial relationships that could be construed as a potential conflict of interest.
Acknowledgments
The authors thank the CAPES (Coordenação de Aperfeiçoamento de Pessoal de Nível Superior) and FAPESP (São Paulo State Research Foundation), Research Program on Global Climate Change, for the financial support of this work (Processes 2008/58104-8). We also thank the State Company for the Environment CETESB. Finally the authors thank Mr. Jefferson Boyles for the revision of the text.
References
Albuquerque, T. T., Andrade, M. F., and Ynoue, R. Y. (2012). Characterization of atmospheric aerosols in the city of São Paulo, Brazil: comparisons between polluted and unpolluted periods. Environ. Monit. Assess. 184, 969–984. doi: 10.1007/s10661-011-2013-y
Pubmed Abstract | Pubmed Full Text | CrossRef Full Text | Google Scholar
Almeida, G. P., Brito, J., Morales, C. A., Andrade, M. F., and Artaxo, P. (2014). Measured and modelled cloud condensation nuclei (CCN) concentration in São Paulo, Brazil: the importance of aerosol size-resolved chemical composition on CCN concentration prediction. Atmos. Chem. Phys. 14, 7559–7572. doi: 10.5194/acp-14-7559-2014
Andrade, M. F., Fornaro, A., Freitas, E. D., Mazzoli, C. R., Martins, L. D., Boian, C., et al. (2012a). Ozone sounding in the Metropolitan Area os São Paulo, Brazil: wet and dry season campaigns of 2006. Atmos. Environ. 61, 627–640. doi: 10.1016/j.atmosenv.2012.07.083
Andrade, M. F., Miranda, R. M., Fornaro, A., Kerr, A., Oyama, B., André, P. A., et al. (2012b). Vehicle emissions and PM2.5 mass concentrations in six Brazilian cities. Air Qual. Atmos. Health 5, 79. doi: 10.1007/s11869-010-0104-5
Pubmed Abstract | Pubmed Full Text | CrossRef Full Text | Google Scholar
Andrade, M. F., Quintão, D. A., Biazon, B., Nogueira, T., Lopes, F., Todesco, E., et al. (2014). “The impact of local pollutants emissions to the vertical ozone profile in the Metropolitan Area of São Paulo,” in 13th IGAC Science Conference and 13th Quadrennial iCACGP Symposium (Natal).
Andrade, M. F., Ynoue, R. Y., Harley, R., and Miguel, A. H. (2004). Air quality model simulating photochemical formation of pollutants: the Sao Paulo Metropolitan Area, Brazil. Int. J. Environ. Pollut. 22, 460–475. doi: 10.1504/IJEP.2004.005681
Baik, J. J., Kim, Y. H., and Chun, H. Y. (2001). Dry and moist convection forced by an urban heat island. J. Appl. Meteorol. 40, 1462–1475. doi: 10.1175/1520-0450(2001)040<1462:DAMCFB>2.0.CO;2
Brito, J., Rizzo, L. V., Herckes, P., Vasconcellos, P. C., Caumo, S. E. S., Fornaro, A., et al. (2013). Physical-chemical characterization of the particulate matter inside two road tunnels in the São Paulo Metropolitan Area. Atmos. Chem. Phys. Discuss. 13, 20839–20883. doi: 10.5194/acpd-13-20839-2013
Carvalho, V. S. B. (2010). O Impacto Das Megacidades na Qualidade do ar em Escala Local e Regional: os Casos Das Regiões Metropolitanas de São Paulo e do Rio de Janeiro. Ph.D. Thesis, University of São Paulo, Institute of Astronomy, Geophysics and Atmospheric Sciences (IAG), 237.
Cenedese, A., and Monti, P. (2003). Interaction between an Inland Urban Heat Island and a sea-breeze flow: a laboratory study. J. Appl. Meteorol. 42, 1569–1583. doi: 10.1175/1520-0450(2003)042<1569:IBAIUH>2.0.CO;2
CETESB. (2010). Relatório de Qualidade do ar no Estado de São Paulo 2009 (Air Quality Report in São Paulo State 2009). Série Relatórios/CETESB, CETESB.
CETESB. (2012). Emissões Veiculares no Estado de São Paulo 2011 (Vehicular Emissionsin Sao Paulo State, 2011). Séries Relatórios/CETESB, Companhia Ambiental do Estado de São Paulo (Environmental Agency for São Paulo State).
CETESB. (2014). Qualidade do ar no Estado de São Paulo 2009 (Air Quality in São Paulo State 2013). Série Relatórios/CETESB, CETESB.
Chen, C., and Cotton, W. R. (1983). A one-dimensional simulation of the stratocumulus-capped mixed layer. Bound. Lay. Meteorol. 25, 289–321. doi: 10.1007/BF00119541
Childs, P. P., and Raman, S. (2005). Observations and numerical simulations of Urban Heat Island and sea breeze circulations over New York City. Pure Appl. Geophys. 162, 1955–1980. doi: 10.1007/s00024-005-2700-0
Cotton, W. R., Pielke, R. A., Walko, R. L., Liston, G. E., Tremback, C. J., Jiang, H., et al. (2003). RAMS 2001: current status and future directions. Meteorol. Atmos. Phys. 82, 5–29. doi: 10.1007/s00703-001-0584-9
Freitas, E. D., Martins, L. D., Silva Dias, P. L., and Andrade, M. F. (2005). A simple photochemical module implemented in RAMS for tropospheric ozone concentration forecast in the metropolitan area of Sao Paulo, Brazil: coupling and validation. Atmos. Environ. 39, 6352–6361. doi: 10.1016/j.atmosenv.2005.07.017
Freitas, E. D., Rozoff, C. M., Cotton, W. R., and Dias, P. L. S. (2007). Interactions of an urban heat island and sea-breeze circulations during winter over the metropolitan area of Sao Paulo, Brazil. Bound. Lay. Meteorol. 122, 43–65. doi: 10.1007/s10546-006-9091-3
Freitas, E. D., Silva Dias, P. L., Carvalho, V. S. B., Mazzoli, C. R., Martins, L. D., Martins, J. A., et al. (2009). “Factors involved in the formation and development of severe weather conditions over the Megacity of São Paulo,” in Proceedings of the 89th AMS Annual Meeting, 2009 (Phoenix, AZ).
Gedzelman, S. D., Austin, S., Cermak, R., Stefano, N., Partridge, S., Quesenberry, S., et al. (2003). Mesoscale aspects of the urban heat Island around New York city. Theor. Appl. Climatol. 75, 29–42. doi: 10.1007/s00704-002-0724-2
Godoy, M. L. D. P., Godoy, J. M., Roldão, L. A., Soluri, D. S., and Donagemma, R. A. (2009). Coarse and fine aerosol source apportionment in Rio de Janeiro, Brazil. Atmos. Environ. 43, 2366–2374. doi: 10.1016/j.atmosenv.2008.12.046
Gouvêa, M. L. (2007). Scenarios of Surface Properties Impacts over the Human Thermal Comfort in the City of São Paulo. Master Degree Dissertation, University of São Paulo, Institute of Astronomy, Geophysics and Atmospheric Sciences (IAG), 87.
Grell, G. A. (1993). Prognostic evaluation of assumptions used by cumulus parameterizations. Mon. Wea. Rev. 121, 764–787.
Grell, G. A., and Devenyi, D. (2002). A generalized approach to parameterizing convection combining ensemble and data assimilation techniques. Geophys. Res. Lett. 29, 38-1–38-4. doi: 10.1029/2002GL015311
Grell, G. A., Peckham, S. E., Schmitz, R., McKeen, S. A., Frost, G., Skamarock, W. C., et al. (2005). Fully coupled “online” chemistry within the WRF model. Atmos. Environ. 39, 6957–6975. doi: 10.1016/j.atmosenv.2005.04.027
Hill, G. E. (1974). Factors controlling the size and spacing of cumulus clouds as revealed by numerical experiments. J. Atmos. Sci. 31, 646–673.
Ichinose, T., Shimodozono, K., and Hanaki, K. (1999). Impact of anthropogenic heat on urban climate in Tokyo. Atmos. Environ. 33, 3897–3909. doi: 10.1016/S1352-2310(99)00132-6
Jonsson, P. (2005). Urban Climate and Air Quality in Tropical Cities. Göteborg: Göteborg University.
Krzyzanowski, M., Apte, J. S., Bonjour, S. P., Brauer, M., Cohen, A. J., and Prüss-Ustun, A. M. (2014). Air pollution in the mega-cities. Curr. Environ. Health Rep. 1, 185–191. doi: 10.1007/s40572-014-0019-7
Kuo, H. L. (1974). Further studies of the parameterization of the influence of cumulus convection on large-scale flow. J. Atmos. Sci. 31, 1232–1240.
Lilly, D. K. (1962). On the numerical simulation of buoyant convection. Tellus 14, 148–172. doi: 10.1111/j.2153-3490.1962.tb00128.x
Lu, R., Turco, P., and Jacobson, M. Z. (1997). An integrated air pollution modeling system for urban and regional scales: 2. Simulations for SCAQS 1987. J. Geophys. Res. 102, 6081–6098. doi: 10.1029/96JD03502
Luna, A. S., Paredes, M. L. L., de Oliveira, G. C. G., and Corrêa, S. M. (2014). Prediction of ozone concentration in tropospheric levels using artificial neural networks and support vector machine at Rio de Janeiro, Brazil. Atmos. Environ. 98, 98–104. doi: 10.1016/j.atmosenv.2014.08.060
Martins, J. A., Uzêda, T. R., Brand, V. S., Bernardo, N. M. R., Martins, L. D., Hallak, R., et al. (2012). Development of High-Resolution Motor Vehicle Emission Inventories for South America, 8th International Conference on Air Quality Science and Application. Hatfield: University of Hertfordshire, Athens, Greece.
Martins, L. D., and Andrade, M. F. (2008a). Emission Scenario Assessment of Gasohol Reformulation Proposals and Ethanol use in the Metropolitan Area of Sao Paulo. Open Atmos. Sci. J. 2, 166–175. doi: 10.2174/1874282300802010166
Martins, L. D., and Andrade, M. F. (2008b). Ozone formation potentials of volatile organic compounds and ozone sensitivity to their emission in the megacity of São Paulo, Brazil. Water Air Soil Pollut. 195, 201–213 doi: 10.1007/s11270-008-9740-x
Martins, L. D., Andrade, M. F. D., Freitas, E., Pretto, A., Gatti, L. V., Junior, O. M. A., et al. (2006). Emission factors for gas-powered vehicles traveling through road tunnels in Sao Paulo, Brazil. Environ. Sci. Technol. 40, 6722–6729. doi: 10.1021/es052441u
Pubmed Abstract | Pubmed Full Text | CrossRef Full Text | Google Scholar
Masson, V. (2000). A physically-based scheme for the urban energy budget in atmospheric models. Bound. Lay. Meteorol. 94, 357–397. doi: 10.1023/A:1002463829265
Mazzoli, C. R. (2013). Numerical Study of Climate Change and Urban Emissions Influence over Tropospheric Ozone in the Metropolitan Area of São Paulo. PhD Thesis, University of São Paulo, Institute of Astronomy, Geophysics and Atmospheric Sciences (IAG), 162.
McRae, G., Goodin, W., and Seinfeld, J. (1982). Development of a second-generation mathematical model for urban air pollution- I. Model formulation. Atmos. Environ. 16, 679–696. doi: 10.1016/0004-6981(82)90386-9
Meyers, M. P., Walko, R. L., Harrington, J. Y., and Cotton, W. R. (1997). New RAMS cloud microphysics parameterization. Part II: the two-moment scheme. Atmos. Res. 45, 3–39. doi: 10.1016/S0169-8095(97)00018-5
Miranda, R. M., Andrade, M. F., Fornaro, A., Astolfo, R., Andre, P. A., and Saldiva, P. (2012). Urban air pollution: a representative survey of PM2.5 mass concentrations in six Brazilian cities. Air Qual. Atmos. Health 5, 63–77. doi: 10.1007/s11869-010-0124-1
Pubmed Abstract | Pubmed Full Text | CrossRef Full Text | Google Scholar
Nogueira, T., Dominutti, P. A., Carvalho, L. R. F., Fornaro, A., and Andrade, M. F. (2014). Formaldehyde and acetaldehyde measurements in urban atmosphere impacted by the use of ethanol biofuel: Metropolitan Area of Sao Paulo (MASP), 2012–2013. Fuel 134C, 505–513. doi: 10.1016/j.fuel.2014.05.091
Orsini, C., Tabacniks, M., Artaxo, P., Andrade, F., and Kerr, A. (1986). Characteristics of fine and coarse particles of natural and urban aerosols of Brazil. Atmos. Environ. 20, 2259–2269. doi: 10.1016/0004-6981(86)90316-1
Pérez-martínez, P. J., Miranda, R. M., Nogueira, T., Guardani, M. L., Fornaro, A., Ynoue, R., et al. (2014). Emission factors of air pollutants from vehicles measured inside road tunnels in São Paulo: case study comparison. Environ. Sci. Technol. 11, 2155–2168. doi: 10.1007/s13762-014-0562-7
Roth, M. (2007). Review of urban climate research in (sub)tropical regions. Int. J. Climatol. 27, 1859–1873. doi: 10.1002/joc.1591
Rozoff, C. M., Cotton, W. R., and Adegoke, J. O. (2003). Simulation of St. Louis, Missouri, Land use impacts on thunderstorms. J. Appl. Meteorol. 42, 716–738. doi: 10.1175/1520-0450(2003)0422.0.CO;2
Saide, P. E., Carmichael, G. R., Scott, N. S., Gallardo, L., Osses, A., Mena-carrascp, M., et al. (2011). Forecasting urban PM10 and PM2.5 pollution episodes in very stable nocturnalconditions and complex terrain using WRFeChem CO tracer model. Atmos. Environ. 45, 2769–2780 doi: 10.1016/j.atmosenv.2011.02.001
Sánchez-Ccoyllo, O. R., Martins, L. D., Ynoue, R. Y., and Andrade, M. F. (2007). The impact on tropospheric ozone formation on the implementation of a program for mobile emissions control: a case study in São Paulo, Brazil. Environ. Fluid Mech. 7, 95–119. doi: 10.1007/s10652-007-9018-7
Sánchez-Ccoyllo, O. R., Ynoue, R., Martins, L., and Andrade, M. F. (2006). Impacts of ozone precursor limitation and meteorological variables on ozone concentration in Sao Paulo Brasil. Atmos. Environ. 40, S552–S562. doi: 10.1016/j.atmosenv.2006.04.069
Sánchez-Ccoyllo, O. R., Ynoue, R. Y., Martins, L. D., Astolfo, R., Miranda, R. M., Freitas, E. D., et al. (2009). Vehicular particulate matter emissions in road tunnels in Sao Paulo, Brazil. Environ. Monit. Assess. 149, 241–249. doi: 10.1007/s10661-008-0198-5
Pubmed Abstract | Pubmed Full Text | CrossRef Full Text | Google Scholar
Skamarock, W. C., Klemp, J. B., Dudhia, J., Gill, D. O., Barker, D. M., Duda, M. G., et al. (2008). A Description of the Advanced Research WRF Version 3, NCAR/Tech Notes. Boulder, CO: National Center for Atmospheric Research (NCAR). doi: 10.5065/D68S4MVH
Smagorinsky, J. (1963). General circulation experiments with the primitive equations: 1. The basic experiment. Mon. Wea. Rev. 91, 99–164.
Souza, E. P., and Silva, E. M. (2003). Impacto da implementação de uma parametrização de convecção rasa em um modelo de mesoescala. Descrição e testes de sensibilidade do esquema. Rev. Bras. Meteorol. 18, 33–42. Available online at: http://www.rbmet.org.br/port/revista/revista_artigo.php?id_artigo=20
Vara Vela, A. (2013). Avaliação do Impacto da Frota Veícular na Formação de Ozônio e Partículas Finas na Atmosfera da Região Metropolitana de São Paulo: Comparação Entre 2004 e 2011. Master Dissertation. Master Thesis, University of São Paulo, Institute of Astronomy, Geophysics and Atmospheric Sciences (IAG), 96.
Vendrasco, E. P., Dias, P. L. S., and Freitas, E. D. (2009). A case study of the direct radiative effect of biomass burning aerosols on precipitation in the Eastern Amazon. Atmos. Res. 94, 409–421 doi: 10.1016/j.atmosres.2009.06.016
Vivanco, M. G., and Andrade, M. F. (2006). Validation of the emission inventory in Sao Paulo. Atmos. Environ. 40, 1189–1198. doi: 10.1016/j.atmosenv.2005.10.041
Walko, R. L., Band, L. E., Baron, J., Kittel, T. G. F., Lammers, R., Lee, T. J., et al. (2000). Coupled atmosphere-biophysics-hydrology models for environmental modeling. J. Appl. Meteorol. 39, 931–944. doi: 10.1175/1520-0450(2000)039<0931:CABHMF>2.0.CO;2
Pubmed Abstract | Pubmed Full Text | CrossRef Full Text | Google Scholar
Walko, R. L., Cotton, W. R., Meyers, M. P., and Harrington, J. Y. (1995). New RAMS cloud microphysics parameterization Part I: the single-moment scheme. Atmos. Res. 38, 29–62. doi: 10.1016/0169-8095(94)00087-T
WHO. (2014). Global Health Observatory [Internet]. Geneva: World Health Organization (WHO, 2014). Available online at: http://apps.who.int/gho/data/node.main.134?lang=en. (Accessed November 10, 2014).
Willmott, C. J., Ackleson, S. G., Davis, R. E., Feddema, J. J., Klink, K. M., Legates, D. R., et al. (1985). Statistics for the evaluation and comparison of models. J. Geophys. Res. 90, 8995–9005.
Ynoue, R. Y., and Andrade, M. F. (2004). Size resolved mass balance of aerosol particles over São Paulo Metropolitan Area, Brazil. J. Aerosol Sci. Technol. 38, 52–62. doi: 10.1080/02786820490466756
Yoshikado, H., and Tsuchida, M. (1996). High levels of winter air pollution under the influence of the urban heat island along the shore of Tokyo Bay. J. Appl. Meteorol. 35, 1804–1813.
Zaveri, R. A., Easter, R. C., Fast, J. D., and Peters, L. K. (2008). Model for Simulating Aerosol Interactions and Chemistry (MOSAIC). J. Geophys. Res. 113, 2156–2202. doi: 10.1029/2007JD008782
Keywords: air quality modeling, Sao Paulo megacity, chemistry transport model for Southeast of Brazil, impact of vehicular emission on air quality, tropospheric ozone
Citation: Andrade MF, Ynoue RY, Freitas ED, Todesco E, Vara Vela A, Ibarra S, Martins LD, Martins JA and Carvalho VSB (2015) Air quality forecasting system for Southeastern Brazil. Front. Environ. Sci. 3:9. doi: 10.3389/fenvs.2015.00009
Received: 30 November 2014; Paper pending published: 12 January 2015;
Accepted: 03 February 2015; Published online: 23 February 2015.
Edited by:
Ernesto Dos Santos Caetano Neto, National Autonomous University of Mexico, MexicoReviewed by:
Nathaniel K. Newlands, Federal Government of Canada, CanadaAgustin Reynoso Garcia, National Autonomous University of Mexico, Mexico
Copyright © 2015 Andrade, Ynoue, Freitas, Todesco, Vara Vela, Ibarra, Martins, Martins and Carvalho. This is an open-access article distributed under the terms of the Creative Commons Attribution License (CC BY). The use, distribution or reproduction in other forums is permitted, provided the original author(s) or licensor are credited and that the original publication in this journal is cited, in accordance with accepted academic practice. No use, distribution or reproduction is permitted which does not comply with these terms.
*Correspondence: Maria de Fatima Andrade, Instituto de Astronomia, Geofísica e Ciências Atmosféricas, Rua do Matão, 1226, Cidade Universitária, São Paulo, SP 05508-090, Brazil e-mail: mftandra@model.iag.usp.br