Spatial Control of Carbon Dynamics in Soil by Microbial Decomposer Communities
 Holger Pagel1*
  Björn Kriesche2
  Marie Uksa3
  Christian Poll3
  Ellen Kandeler3
  Volker Schmidt2 Thilo Streck1
- 1Biogeophysics, Institute of Soil Science and Land Evaluation, University of Hohenheim, Stuttgart, Germany
- 2Institute of Stochastics, Ulm University, Ulm, Germany
- 3Soil Biology, Institute of Soil Science and Land Evaluation, University of Hohenheim, Stuttgart, Germany
Trait-based models have improved the understanding and prediction of soil organic matter dynamics in terrestrial ecosystems. Microscopic observations and pore scale models are now increasingly used to quantify and elucidate the effects of soil heterogeneity on microbial processes. Combining both approaches provides a promising way to accurately capture spatial microbial-physicochemical interactions and to predict overall system behavior. The present study aims to quantify controls on carbon (C) turnover in soil due to the mm-scale spatial distribution of microbial decomposer communities in soil. A new spatially explicit trait-based model (SpatC) has been developed that captures the combined dynamics of microbes and soil organic matter (SOM) by taking into account microbial life-history traits and SOM accessibility. Samples of spatial distributions of microbes at μm-scale resolution were generated using a spatial statistical model based on Log Gaussian Cox Processes which was originally used to analyze distributions of bacterial cells in soil thin sections. These μm-scale distribution patterns were then aggregated to derive distributions of microorganisms at mm-scale. We performed Monte-Carlo simulations with microbial distributions that differ in mm-scale spatial heterogeneity and functional community composition (oligotrophs, copiotrophs, and copiotrophic cheaters). Our modeling approach revealed that the spatial distribution of soil microorganisms triggers spatiotemporal patterns of C utilization and microbial succession. Only strong spatial clustering of decomposer communities induces a diffusion limitation of the substrate supply on the microhabitat scale, which significantly reduces the total decomposition of C compounds and the overall microbial growth. However, decomposer communities act as functionally redundant microbial guilds with only slight changes in C utilization. The combined statistical and process-based modeling approach derives distribution patterns of microorganisms at the mm-scale from microbial biogeography at microhabitat scale (μm) and quantifies the emergent macroscopic (cm) microbial and C dynamics. Thus, it effectively links observable process dynamics to the spatial control by microbial communities. Our study highlights a powerful approach that can provide further insights into the biological control of soil organic matter turnover.
Introduction
Microorganisms drive biochemical processes such as C cycling in soil (Falkowski et al., 2008). There is growing consensus that soil organic matter dynamics and stability are strongly controlled by microbial processing and associated bioenergetics constraints (Schmidt et al., 2011; Lehmann and Kleber, 2015; Williams and Plante, 2018). Yet, understanding how microbial community characteristics affect rates of biogeochemical processes remains a major research challenge. Further progress to quantitatively describe spatial arrangements between microorganisms in their micro-environment and their corresponding substrate is needed (Graham et al., 2016; Baveye et al., 2018).
Categorizing microbial communities based on life-history strategies (e.g., copiotrophs/oligotrophs, r-/K-stategists, autochtonous/zymogenous microorganisms, or competitors/stress tolerators/ruderals) is useful to link microbial community characteristics to biogeochemical processes (Fierer et al., 2007; Kuzyakov et al., 2009; Martiny et al., 2015; Fierer, 2017; Blankinship et al., 2018; Hall et al., 2018). These frameworks are based on the transfer of macroscale ecology concepts to microbial ecology. A recent study refined the competitor-stress tolerator-ruderal concept from plant ecology and suggested to define three microbial life history strategies: resource acquisition, stress tolerance, and high yield (Malik et al., 2020). Life-history strategies embrace combinations and trade-offs of microbial community traits related to maximum growth rate, dormancy, substrate affinity, production of specific enzymes, or stress tolerance mechanisms (Webb et al., 2010; Fierer et al., 2014; Trivedi et al., 2016; Alster et al., 2018; Rath et al., 2019; Malik et al., 2020). Mineralization of soil C could be seen as an emergent process that is regulated by functional traits of soil microorganisms and microbiological interactions (Addiscott, 2010). Therefore, decomposition of C compounds is controlled by dynamics of assemblages of somewhat functionally redundant organisms organized in microbial guilds with characteristic life-history strategies (Schimel and Schaeffer, 2012).
Including measured functional traits of plants as well as soil microorganisms and fauna in biogeochemical modeling is a promising approach to improve predictions of biogeochemical cycling in soil (Fry et al., 2019). Biogeochemical C models increasingly include metabolic and physiological traits as well as life-history strategies to account for microbial regulation of decomposition processes (Garnier et al., 2001; Ingwersen et al., 2008; Neill and Guenet, 2010; Allison, 2012; Bouskill et al., 2012; Pagel et al., 2014, 2016; Perveen et al., 2014; Wang et al., 2014; Le Roux et al., 2016). Including microbial dormancy of microbes in models has been shown to improve the prediction of soil organic C dynamics (He et al., 2015) as did accounting for copiotrophic and oligotrophic microorganisms as physiologically distinct functional groups (Wieder et al., 2015). A model-based analysis demonstrated that adaptive microbial responses to C limitation and water stress might emerge from microbial traits related to dormancy and production of extracellular polymeric substances (Brangarí et al., 2018). The importance of community-level regulation and microbial trait trade-offs was highlighted by trait-based modeling of litter decomposition (Kaiser et al., 2015; Allison and Goulden, 2017).
Further integration of trait-based and spatial explicit approaches is, however, essential to advance the quantitative description of microbial C utilization, because microbial activity is controlled by spatial characteristics. Physical accessibility of organic compounds to microorganisms strongly affects substrate supply and microbial community functioning (Brookes et al., 2017; Nunan et al., 2017; Schimel, 2018). It has been conjectured that at the pore-scale, which is relevant for microbial processes, the supply of assimilable C (low molecular weight compounds <600 Da) to microorganisms is mainly regulated by (i) physical accessibility of soil organic matter, (ii) exoenzymatic decomposition of C compounds that are not directly assimilable (high molecular weight compounds ≥ 600 Da), and (iii) diffusive transport of assimilable C in the soil solution from locations of exoenzymatic action to microbial cells (Lehmann and Kleber, 2015; Schimel et al., 2017; Blankinship et al., 2018; Sokol et al., 2019).
Quantitative measurements of microbial distribution and processes at the pore-scale are extremely challenging. Though there is limited, albeit growing, experimental data on the spatial organization and activity of microorganisms in soils, a number of mechanistic models have been applied to understand and predict the impact of spatial heterogeneity in soil on microbial and physico-chemical processes (Baveye et al., 2018). Raynaud and Nunan (2014) analyzed the spatial distribution of bacterial cells in soil thin sections and described the spatial structure of observed bacterial distributions as aggregated point patterns using a Log Gaussian Cox process as spatial statistical model. Their analysis indicated that distributions of bacterial cells in soils are clustered and non-random at the μm-scale, most probably as a result of heterogeneity in soil structure and pore network architecture. Recent experimental evidence from combined X-ray microtomography and fluorescence microscopy at different sampled spatial scales (0.2, 1, 5 mm) indicates that pore characteristics might effectively influence the distribution of bacteria in soil mainly at a spatial scale of ~5 mm (Juyal et al., 2019). Most rapid decomposition rates were associated with pores of neck diameters of 15–90 μm. This was attributed to optimal microbial habitat conditions with respect to nutrient and oxygen supply and organism motility (Strong et al., 2004; Kravchenko and Guber, 2017). There is some experimental evidence that pore characteristics and microenvironmental conditions control the relative contributions of specific functional microbial groups to decomposition of C compounds and the extent of their functional redundancy (Ruamps et al., 2013; Negassa et al., 2015; Kravchenko and Guber, 2017; Nunan et al., 2017).
A few recent models linked mechanistic descriptions of a soil's pore structure with trait-based microbial dynamics. Experimental work using artificial micrometric pore networks etched in glass combined with modeling has demonstrated that oxygen-carbon counter-gradients (as commonly found in microbial hotspots like the rhizosphere or detritusphere) induce the spatial organization of aerobic and anaerobic bacteria and promote their stable coexistence (Borer et al., 2018). Scenario simulations using a multi-species 3D pore-scale soil C model have indicated microscale (μm) control of bacterial diversity driven by the degree of heterogeneity in the spatial distribution of organic matter (Portell et al., 2018). In these simulations, the spatial heterogeneity of organic matter affected the succession of functional bacterial types differing in growth rates and substrate affinities. Irrespective of the spatial SOM distribution, however, the small-scale (mm) C turnover was similar. This indicates functional redundancy with respect to C cycling. While there are some first successful attempts to derive mechanistic effective rate laws for specific biogeochemical processes at pedon to landscape scale from pore-scale modeling (e.g., Ebrahimi and Or, 2018; Schmidt et al., 2018), the upscaling of microbial processes and their control from pore scale to macroscopic scales (pedon to landscape), which are practically relevant and accessible to direct observation, remains a largely unresolved research challenge (Baveye et al., 2018).
This theoretical study aims to elucidate the control of emerging C dynamics in soil at the macroscale (cm) by the pore-scale (μm) distribution of decomposer communities consisting of microorganisms with differing life-history traits. A new trait-based soil C model was utilized in combination with a spatial statistical model of microbial biogeography (Raynaud and Nunan, 2014) to test two hypotheses: (i) increasing spatial heterogeneity in the distribution of microbial decomposers results in an increase in diffusion-limited C availability and lower C turnover and (ii) with increasing spatial heterogeneity, the composition of decomposer communities shifts to a higher proportion of oligotrophic organisms that can outcompete copiotrophs at low C availability.
Materials and Methods
Model Rationale and Main Assumptions
The 2D spatially explicit trait-based soil C model (SpatC) has been developed to study the effects of mm-scale heterogeneous distribution of functionally diverse microbial communities on C cycling in soil. Following the conceptual soil continuum model of soil organic matter cycling (Lehmann and Kleber, 2015), SpatC distinguishes three conceptual carbon pools with respect to their assimilability by microorganisms (Figure 1). Microbial communities are grouped into three functional types that distinguish different life-history strategies according to ecological categorizations, a technique used similarly in other models (e.g., Allison, 2012; Kaiser et al., 2015). This structure reflects fundamentally different life-history strategies according to functional-ecological frameworks such as the copiotrophy–oligotrophy continuum or Grime's competitor–stress tolerator–ruderal concept (Fierer et al., 2007; Krause et al., 2014; Fierer, 2017; Ho et al., 2017; Huang et al., 2018; Fry et al., 2019; Maynard et al., 2019). The biomass of all microbial groups is regulated by growth of predators that utilize microbial pools as C and energy sources. SpatC thereby explicitly considers exploitative competition (interception of a common resource), interference competition (direct interactions between microorganisms), and predator-mediated competition (top-down control of microorganisms by selective predation) between the three functional microbial groups (see Buchkowski et al., 2017).
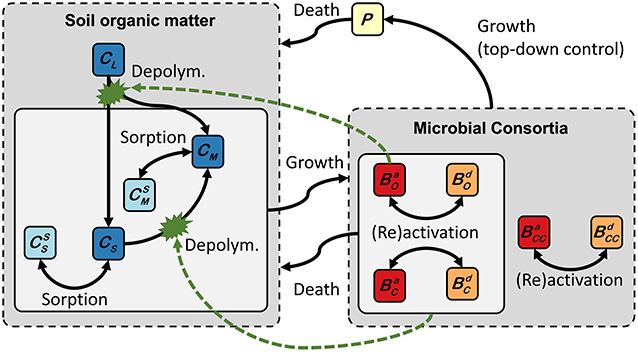
Figure 1. Conceptual scheme of coupled carbon turnover and biochemical interactions implemented in the 2D spatially explicit trait-based soil C model (SpatC). Solid arrows indicate carbon fluxes. Dashed green arrows depict the controls on extracellular depolymerisation reactions. CM, CS, and CL stands for monomers, small polymers, and large polymers, respectively. Superscript “S” indicates sorbed phase concentration of CM and CS. Monomers and small polymers may be transported by 2D diffusion (not shown). Microbial communities consist of active (superscript “a”) and dormant (superscript “d”) oligotrophs (BO), copiotrophs (BC), and copiotophic cheaters (BCC). P stands for predators.
Governing Equations and Fluxes
SpatC is formulated as a set of coupled partial and ordinary differential equations. All C pools are based on the C mass balance in soil and expressed in mg g−1. We assumed and at all boundaries (with n denoting the outward facing normal vector), i.e., there was no flux of CS and CM out of the considered domain. Model parameters are given in Tables 1, 2. Fluxes and functions are specified in Section Fluxes and Functions. A concise description of all model equations is given in the Supplementary Material.
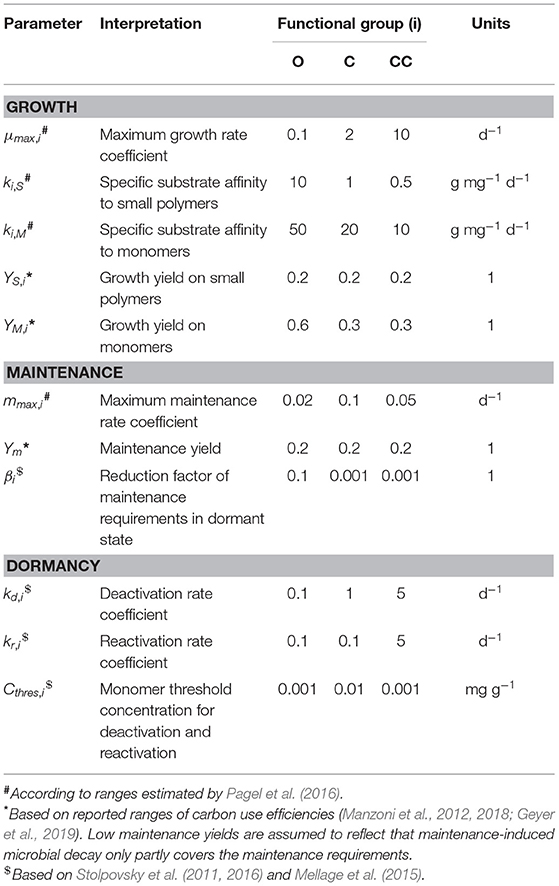
Table 1. Parameterization of functional microbial traits.
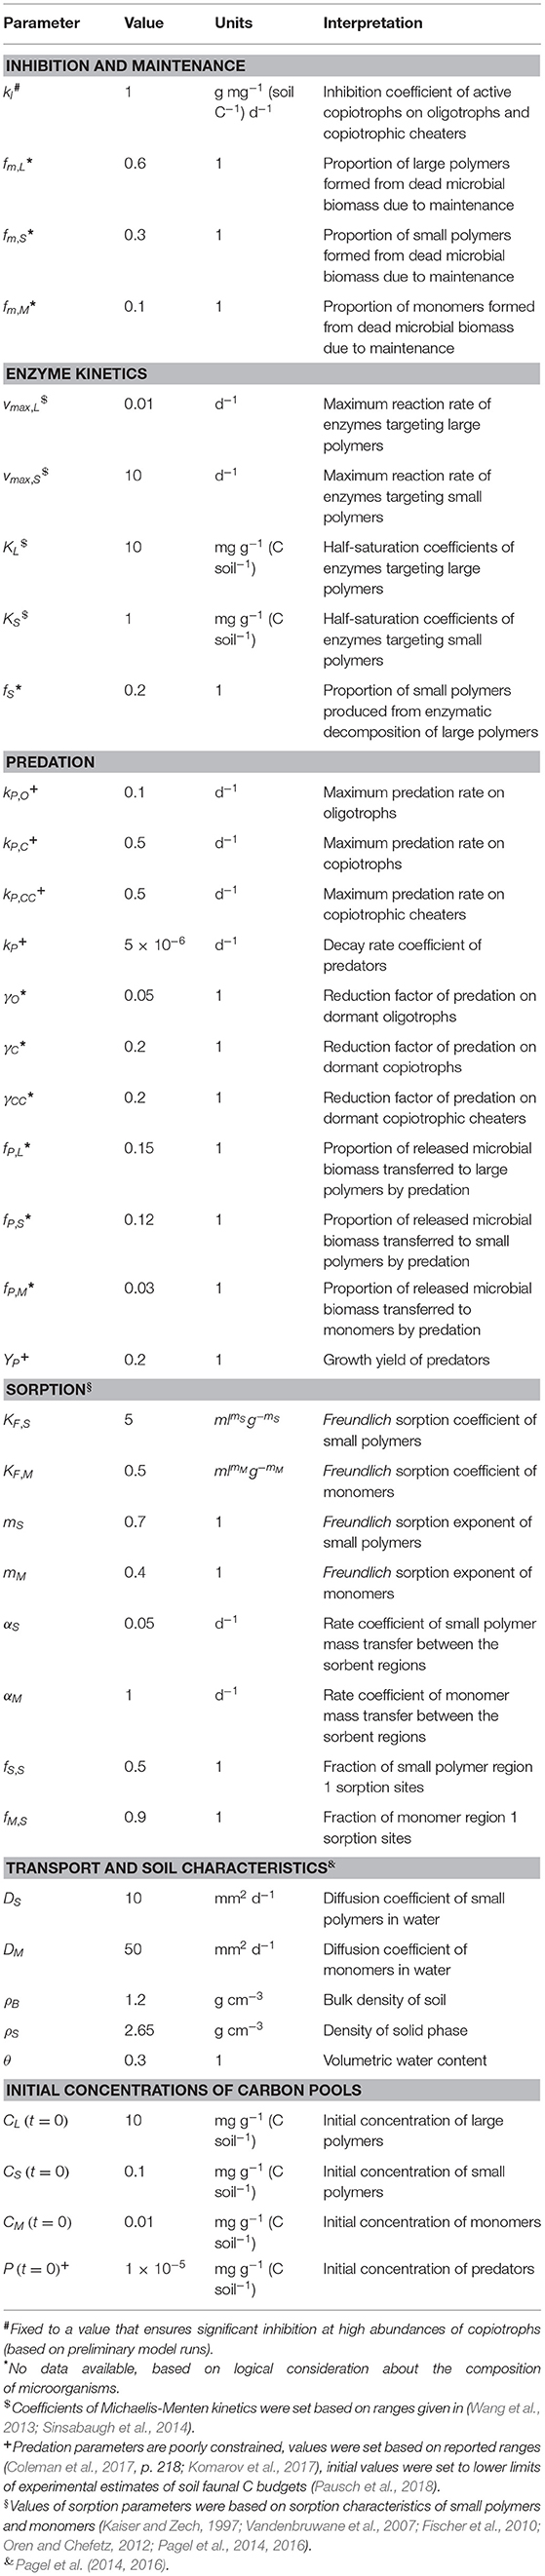
Table 2. Inhibition, maintenance, and non-microbial parameters and initial values of SpatC model simulations.
Non-microbial Carbon
Large biopolymers (CL, Equation 1) are not directly assimilable by microorganisms, but need to be first depolymerized by extracellular enzymes to dissolved small biopolymers (CS, Equation 2) and monomers (CM, Equation 3). Small biopolymers are similarly prone to extracellular depolymerisation. This enzymatic process is simulated using Michaelis-Menten kinetics without explicitly considering enzyme dynamics. The depolymerization rate of large and small polymers is instead directly controlled by microbial biomass (Equation 21). Small polymers and monomers are directly consumed by microorganisms. The decay of microorganisms and predators leads to C input of non-microbial C to CL, CS, and CM. While large biopolymers are not transported, SpatC accounts for transport of small polymers and monomers by diffusion. Using the approach of Streck et al. (1995), the bioavailability of CS and CM is further constrained by rate-limited, two-stage, non-linear sorption (Equations 4–6).
Equilibrium sorption is considered using a Freundlich isotherm. Sorbed phase concentrations of small biopolymers and monomers at sorption sites in region 1 are accordingly expressed as:
Kinetic sorption is expressed as mass transfer between sorption sites in region 1 and region 2:
Total sorbed phase concentrations are given by the sum of sorbed phase concentrations in region 1 and 2, each weighted by the fraction of sorption sites in both regions:.
Functional Microbial Groups
SpatC accounts for three functional microbial types: oligotrophs (BO), copiotrophs (BC) and copiotrophic cheaters (BCC) (Equations 7–11). All microbial groups are considered to be able to switch from an active to a dormant physiological state (Lennon and Jones, 2011; Blagodatskaya and Kuzyakov, 2013; Joergensen and Wichern, 2018) with different parameterizations for different functional types (Table 1, Figure 2). Active microorganisms use dissolved small biopolymers and monomers for growth, while dormant microorganisms do not grow. Maintenance energy requirements of microorganisms are assumed to be fulfilled through the uptake of monomers at sufficient substrate supply and are met from biomass when monomers become limiting (Wang and Post, 2012). That is, microorganisms switch from exogenous to endogenous maintenance (see Equation 18) leading to microbial decay at low substrate availability. We consider that endogenous maintenance proportionally results in the formation of dead microbial biomass and CO2 (Equations 1–3 and 14). Additionally, microbial biomass decays due to predation. Thereby, microbial C is used for growth of predators (Equation 13), reallocated to non-microbial C pools in soil (Equations 1–3) and lost to CO2 (Equation 14).
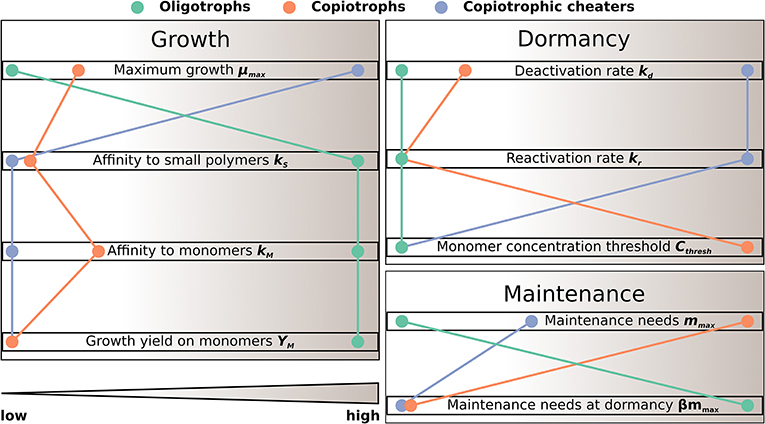
Figure 2. Schematic illustration of trade-off in functional microbial traits as implemented in SpatC (see also Table 1).
Dynamics of active microorganisms are expressed as follows:
Dynamics of dormant microorganisms are given by:
Dynamics of predators are modeled using first-order growth and decay. It is considered that only part of the killed microbial biomass is actually taken up by predators. A fraction of C from killed microorganisms (fP, Equation 20) is directly released to the soil solution and reallocated to non-microbial soil pools:
Formation of carbon dioxide (CO2) results from energy metabolism by aerobic respiration during microbial growth and maintenance as well as growth of predators:
Fluxes and Functions
The following flux equations define the C flows between soil organic matter pools and soil biota. All fluxes are expressed in mg g−1d−1.
Predation and maintenance fluxes were combined into column vectors. These were then used in the governing equations (Equations 1–14) as a scalar product with a row vector of ones for an effective description of the model:
A multi-substrate Monod kinetic (Lendenmann and Egli, 1998) is used to simulate grow of functional microbial types on small polymers and monomers (Equation 15). Following the proposed application of Grime's competitor–stress tolerator–ruderal concept to soil bacterial heterotrophs (Fierer, 2017), copiotrophs are parameterized as competitors. They are assumed to be most competitive by inhibiting the growth of oligotrophs and copitrophic cheaters. This is implemented using a first-order inhibition term (Buchkowski et al., 2017):
Switching between dormant and active state was modeled as first-order process (Equation 16) based on the approach of Mellage et al. (2015). Deactivation and reactivation rates are triggered by the concentration of dissolved monomers using a switching function (Equation 17). This function approaches zero if the monomer concentration is below a trait-specific threshold value and takes a value of one above the threshold. The shape parameter α controls the sharpness of the transition. It was fixed to a value of 0.1 to reflect a relatively sharp switching from and to dormancy.
Total required maintenance uptake is given by the product of the trait-specific maximum maintenance rate coefficient and microbial biomass. Reduced maintenance needs of dormant microorganisms are considered using a reduction factor (β) of maximum maintenance rate coefficients. The relative C flux needed for maintenance that can be fulfilled from dissolved monomers (exogenous maintenance) is calculated using a Michealis-Menten type rate law (Lendenmann and Egli, 1998).
Predation of microorganisms and the associated growth of predators as well as the decay of predators is reflected by first-order expressions. Decreased predation of dormant microorganisms is considered by reduction factors (γ) of predation rate coefficients:
The proportion of C lost to non-microbial C pools by predation is given by:
Enzymatic breakdown of large and small biopolymers is modeled using Michaelis-Menten kinetics. Oligotrophs control the depolymerisation of large and small polymers, while copiotrophs only affect the depolymerisation of small polymers (Equation 21). This was done to implicitly reflect a higher metabolic versatility of oligotrops than copiotrophs. Copiotrophic cheaters fully rely on the direct uptake of small polymers and monomers and do not affect extracellular depolymerization of polymers:
Retardation factors of dissolved small polymers and monomers to consider non-linear equilibrium sorption are calculated as follows (see Jury and Horton, 2004):
Effective diffusion coefficients of small polymers and monomers in soil are derived from corresponding aqueous diffusion coefficients by accounting for unsaturated porous media permeability (after Millington and Quirk, 1961):
Parameterization
Parameters of SpatC and default values used in all simulations are given in Tables 1, 2. We used uniformly distributed initial concentrations of SOM pools and predators. Parameter values were derived from available data if possible and based on logical consideration elsewhere. All microorganisms were assumed to be initially in a dormant state, i.e., initial values of active microorganisms were set to zero. We set a low initial abundance of dormant microbial biomass in the order of 10−4 mg g−1 (C soil−1) to assure the detection of emerging behavior of microbial groups due to growth in the simulation. Uniform initial SOM pools and a homogeneous medium with isotropic transport and sorption properties were assumed in order to clearly derive effects of spatial distribution of functional microbial groups on C dynamics. Spatial heterogeneity was restricted to microbial distributions. Diffusion coefficients (Table 2) were set to values which reflect a higher molecular weight of CS than of CM (Worch, 1993; Hendry et al., 2003).
Parameter values of functional microbial groups were chosen to reflect ecological trade-offs between growth, dormancy and maintenance traits (Figure 2, Table 1). Oligotrophs were parameterized as slowest growers with most efficient substrate uptake and usage. In contrast, copiotrophic cheaters can grow fastest, but are characterized by least efficient substrate uptake and usage. Copiotrophs grow slower than cheaters and have higher maintenance requirements, but are more competitive due to their more efficient substrate uptake in combination with their ability to depolymerize small polymers and inhibit other microorganisms. Oligotrophs were considered to stay active at low substrate supply with lowest maintenance requirements in active state, but highest in dormant state. Copiotrophic cheaters can switch fastest from and to dormancy and switching is triggered already at a low monomer threshold, i.e., they respond fastest to monomer supply. Copiotrophs reactivate and deactivate at a relatively high monomer threshold concentration, but respond much more slowly to insufficient substrate supply than copiotrophic cheaters.
Initialization and Scenario Simulations
Initial pool sizes of dormant functional microbial types were set up in two steps based on a spatial statistical model of microbial biogeography. A Log Gaussian Cox process (LGCP) (Moller et al., 1998) was used as a spatial stochastic model to generate point patterns of microbial cells in a 100 × 100 mm2 soil domain. The LGCP model is characterized by three parameters; the mean (μ), the variance (σ2), and the scale (β) of the Gaussian random measure. Following Raynaud and Nunan (2014), an isotropic exponential covariance function C(r) = σ2e−r/β with distance variable r was used to model the Gaussian process. All parameters were related to the μm-scale. The mean initial density of microbial cells was set to 20 cells mm−2 (close to the lower limit observed by Raynaud and Nunan, 2014; and Juyal et al., 2019). This is equivalent to an average intensity of the LGCP points μm−2. The spatial heterogeneity of microbial cell distributions was determined by σ2 values. Point patterns of increasing spatial heterogeneity and clustering were simulated using four different σ2 values: 0.1, 0.5, 2, 6. Corresponding μ values were calculated as to: −10.82, −10.94, −12.82, −28.82. The scale parameter β was fixed to 25 μm in all simulations corresponding to average estimates of Raynaud and Nunan (2014).
The generated point patterns of total microbial cells were then aggregated to 1 mm2 resolution by discretizing the 100 × 100 mm2 soil domain into 10,000 squares of 1 mm2. The total number of cells at 1 mm2 resolution was then randomly split into three subsets to derive average cell densities (cells mm−2) for the three functional microbial groups (BO, BC, BCC). Initial pool sizes of dormant functional microbial types in mg g−1 (C soil−1) were calculated from these cell densities by assuming a soil bulk density (ρS) of 1.2 g cm−3, a bacterial cell mass of 10−11 mg (McMahon and Parnell, 2014), and a representative layer thickness of 10−3 mm (see also Raynaud and Nunan, 2014). Thus, the average total initial microbial biomass was 1.67 × 10⁻⁴ mg g−1 (C soil−1).
In total, 400 simulations comprising 100 realizations per σ2 value were performed. All simulations were run for 100 days. This simulation time was chosen as an adequate trade-off between computational effort and process insight.
Technical Implementation
Simulations of the described LGCPs and the aggregation of the generated point patterns were performed using the package spatstat (Baddeley, 2015) and the statistical computing environment R (R Core Team, 2018). The coupled system of partial and ordinary differential equations was implemented and solved using the multipurpose finite element code COMSOL Multiphysics® in combination with the COMSOL® module LiveLink™ for MATLAB®.
Continuous spatial distributions of all state variables were discretized using finite elements. The computational mesh was constructed by converting and refining a regular quadrilateral mesh with 10,000 elements of 1 mm edge length such that every 1 mm square is further discretized by 16 tetrahedral elements (Supplementary Figure 1). As a result the 100 × 100 mm2 domain was represented by 160,000 tetrahedral finite elements with an area of 62.5 μm2 each. The initial distribution of microorganisms at 1 mm2 resolution was mapped on the finite element mesh using nearest-neighbor interpolation as implemented in COMSOL. Test simulations using finer and coarser meshes showed that the chosen mesh resolution provided accurate results at a reasonable computation time.
The equations were solved numerically using an adaptive implicit time-stepping scheme with a backward differentiation formula of varying order from 1 to 5. Newton's method was used to linearize the system of equations. A flexible generalized minimum residual iterative method (Saad, 1993) was used in combination with a geometric multigrid solver (Hackbusch, 1985) to solve the final system of linear equations. The multigrid solver utilized successive over-relaxation for pre- and post-smoothing and a parallel sparse direct method as coarse solver. MATLAB® was used to set the initial distribution patterns of dormant functional microbial pools, to control the model runs and for post-processing of simulation results.
The derived discrete initial pool sizes of functional microbial groups at 1 mm2 resolution could not be directly used for initializing the simulation, because strong differences between individual 1 mm2 squares would have required a highly resolved computational mesh for numerical accuracy. Therefore, the initial discrete spatial bacterial distributions were slightly smoothed by running a reduced version of the full model that only simulated slight diffusion of bacterial cells. By this procedure, sharp fronts were removed by an initializing COMSOL model run. The resulting smooth bacterial density fields were then used to initialize the functional microbial types for running the actual SpatC COMSOL® model.
We explored the effect of biokinetic parameterization by varying some key biokinetic parameters within reasonable bounds by running SpatC with one stochastic realization in a 1 × 10 mm2 soil domain (Supplementary Figures 2, 25–27).
Results
Spatiotemporal Dynamics
Spatial clustering of initial microbial communities resulted in the emergence of coupled spatial patterns of C pools and microbial succession (Figure 3, see also Supplementary Figures 4–24 for spatial distributions of soil pools at all degrees of heterogeneity). The spatial distribution of large polymers (Supplementary Figures 6, 7), however, was largely unaffected by microbial distribution. Largely homogenously distributed initial microbial communities (σ2 = 0.1) led to a uniform decline of monomers and small polymers. Strong spatial clustering (σ2 = 6) induced local depletion zones of small polymers and zones of increased monomer concentrations after 20 and 40 days at spots of high abundance of microbial biomass (Figure 3, Supplementary Figures 25, 26). Higher diffusive transport of monomers compared to small polymers resulted in sharper spatial concentration gradients of small polymers at certain local spots.
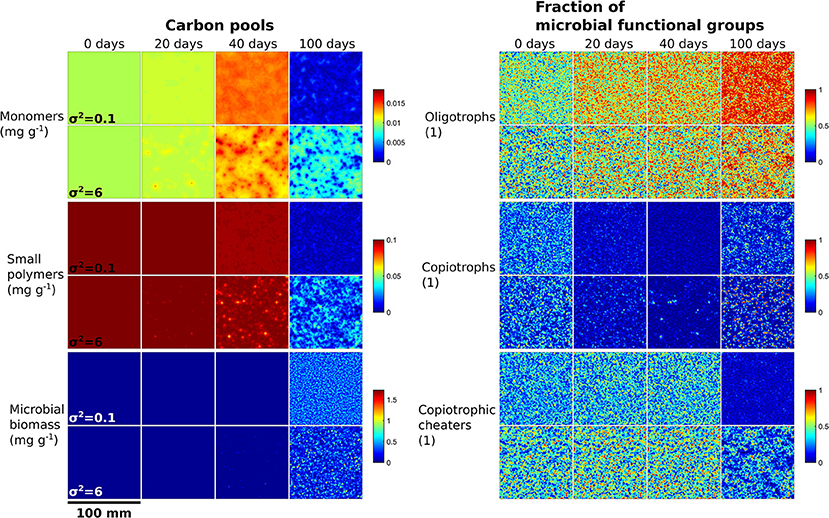
Figure 3. Microbial biogeography triggers the emergence of spatial patterns of carbon utilization and microbial succession. Each square exemplifies the spatial distribution of C pools (left) and the fraction of microbial functional groups of the total microbial biomass (right) for low (σ2 = 0.1) and strong (σ2 = 6) initial spatial clustering of microbial communities within a 100 × 100 mm2 soil domain for one stochastic realization.
Spatial clustering of initial microbial communities (σ2 = 6) led to distinct spots of high microbial abundance. At these spots, also predators became highly abundant (Supplementary Figure 24). The distribution of oligotrophs was characterized by relatively large and more uniformly distributed spots in comparison to the other microbial functional groups (Figure 3). Spots of high abundant copiotrophs were most segregated (Figure 3) and associated with low abundances of the other two functional groups (Supplementary Figure 27). Thus, copiotrophs outcompeted oligotrophs and copiotrophic cheaters and their biomass increased until the end of the simulation period. This pattern emerged as a direct consequence of the simulated interference competition of copiotrophs' inhibition of microbial growth.
Aggregated C Turnover
Heterogeneity in the initial distribution of microbial communities affected aggregated C turnover in soil, but microbial distribution triggered only slight changes in C utilization (Figure 4). For all initial spatial distributions of microorganisms (σ2 = 0.1, 0.5, 2, 6), decomposition of small polymers coincided with microbial growth. The concentration of large polymers remained close to the initial value of 10 mg g−1. As a result of microbial death, it showed only a slight increase of <0.015 mg g−1. Monomers showed a concentration peak after about 50 days as a result of enzymatic breakdown of small polymers triggered by the activity of copiotrophs and oligotrophs. While the maximum monomer concentration decreased from homogenous (σ2 = 0.1, 0.5) to heterogeneous (σ2 = 2, 6) microbial distributions, the monomer concentration peak became broader with increasing spatial clustering. The variability of all C pools increased with increasing spatial heterogeneity of decomposer communities.
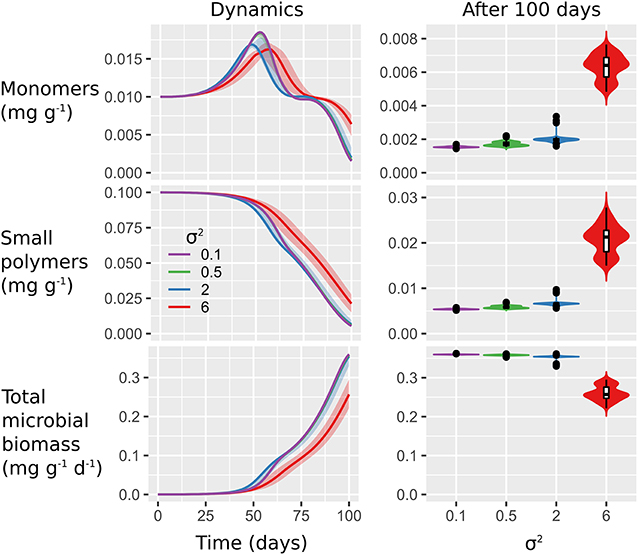
Figure 4. Microbial biogeography triggers only small changes in carbon utilization. Plots show C turnover dynamics (left) and final values (right) of dissolved monomers and small polymers as well as total microbial biomass C in response to spatial heterogeneity of the initial distribution of microorganisms (σ2 = 0.1, 0.5, 2, 6). Values are aggregated over the 100 × 100 mm2 soil domain. Lines indicate the medians of 100 realizations and shaded areas show minimum and maximum values (left). Violin plots (right) are scaled to the same width and show the relative distribution of final values. In the inserted box plots, horizontal lines indicate median values, boxes show interquartile ranges (IQR) and whiskers reflect values within maximum 1.5 × IQR.
Moderate spatial clustering (σ2 = 2) led to fastest monomer production, degradation of small polymers, and microbial growth. Strong spatial clustering (σ2 = 6) resulted in slowest decomposition of small polymers and monomers in combination with the slowest increase in total microbial biomass. As a consequence, final aggregated concentrations of monomers and small polymers were higher and final microbial biomass was lower at σ2 = 6 compared to the other scenarios.
Microbial Succession
The aggregated SpatC simulation results revealed a characteristic succession of microbial functional groups in response to available substrates (Figure 5). Copiotrophic cheaters reacted first, directly followed by copiotrophs. These two functional groups simultaneously grew most rapidly on the available monomers and small polymers. Copiotropic cheaters were outcompeted by copiotrophs and oligotrophs as monomers and small polymers became limiting. Copiotrophs switched from active to dormant and maintained the largest portion of their biomass in a dormant state at the end of the simulation. In contrast, active oligotrophs and copiotrophic cheaters showed net growth until the end of the simulation.
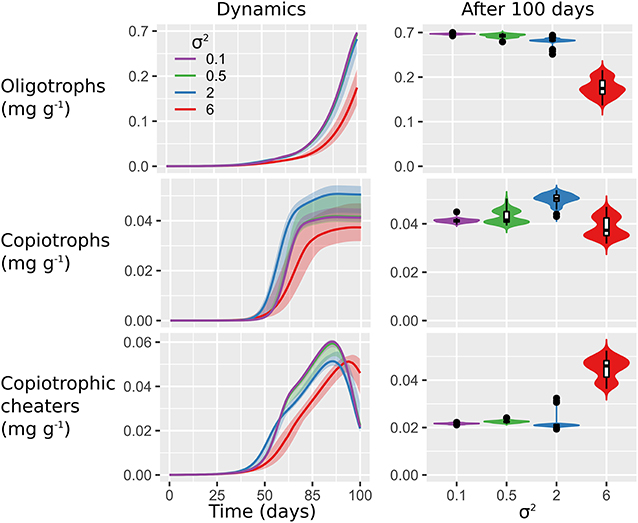
Figure 5. Microbial biogeography most strongly affects dynamics of fast-growing copiothrophs. Plots show the succession (left) and final values (right) of microbial functional groups (total biomass) in response to spatial heterogeneity of the initial distribution of microorganisms (σ2 = 0.1, 0.5, 2, 6). Values are aggregated over the 100 × 100 mm2 soil domain. Lines indicate the medians of 100 realizations and shaded areas show minimum and maximum values (left). Violin plots (right) are scaled to the same width and show the relative distribution of final values. In the inserted box plots, horizontal lines indicate median values, boxes show interquartile ranges (IQR), and whiskers reflect values within maximum 1.5 × IQR.
The top-down control by predators played only a minor role. While the median abundance of predators was only slightly affected by microbial distribution, strong spatial clustering of microorganisms resulted in relatively high variability in simulated predator biomass (data not shown).
Moderate spatial clustering (σ2 = 2) promoted the growth of copiotrophs and triggered the fastest growth response of copiotrophic cheaters. Strong spatial clustering (σ2 = 6) delayed and reduced growth for all microbial functional groups. The variability of all microbial functional groups increased proportional to the initial degree of spatial heterogeneity. Copiotrophs showed the highest sensitivity to spatial heterogeneity of their initial localization. This was evident by the highest variability of the stochastic simulation output compared to oligotrophic and copiotrophic cheaters (Figure 5).
Spatial clustering of microbial communities only slightly affected the relative contribution of functional groups to total biomass (Figure 6, first row). Oligotrophs clearly dominated and were similarly competitive independent of spatial clustering. While copiotrophs reached maximum contribution to total biomass at moderate spatial clustering (σ2 = 2), copiotrophic cheaters gained highest maximum contributions at low spatial clustering (σ2 = 0.1, 0.5).
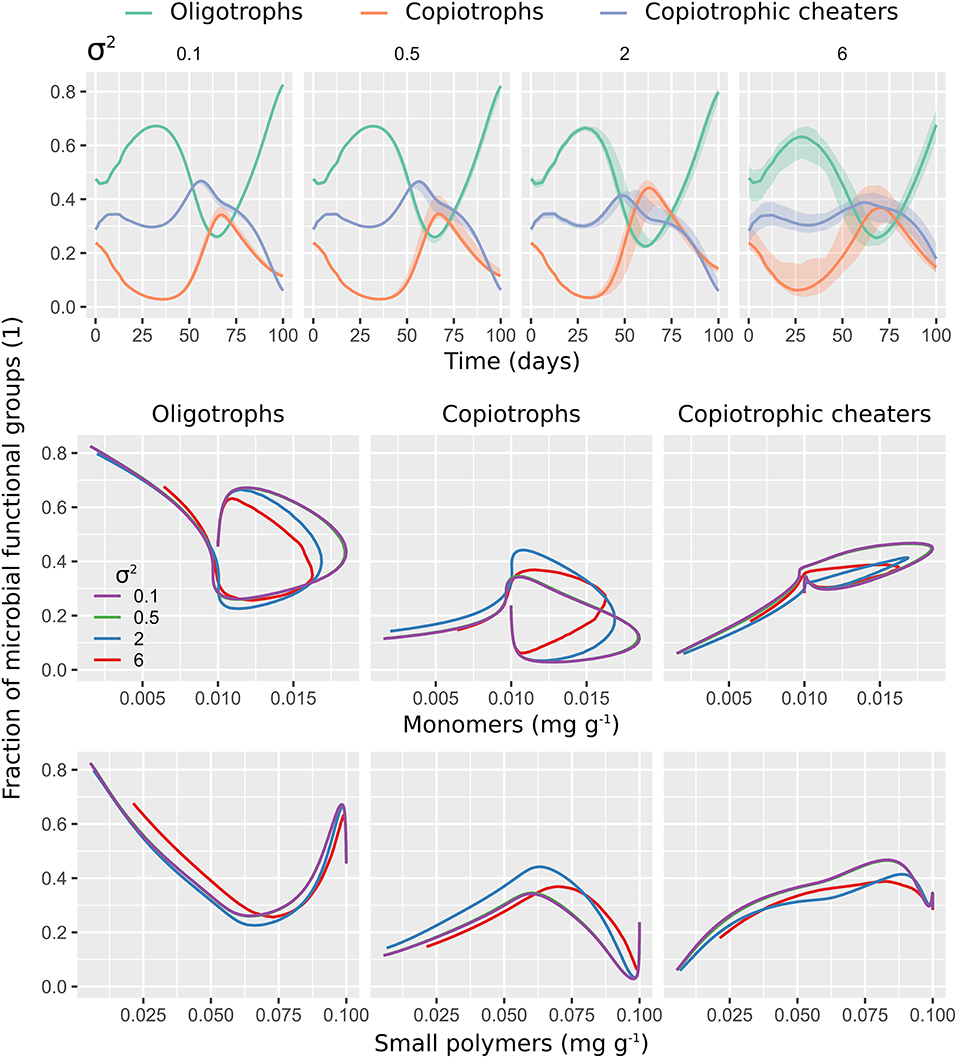
Figure 6. Spatial clustering of microbial decomposers limits activity and access to monomers by copiotrophic cheaters. Moderate clustering facilitates the access to monomers of copiotrophs and their contribution to total biomass. The first row shows the contribution of microbial functional groups (active and dormant biomass) to total microbial biomass with respect to time. The second and the third row show a phase-space plot of microbial functional group fractions against dissolved monomers (second row) and dissolved small polymers (third row). Each model output is shown in response to the spatial heterogeneity of the initial distribution of microorganisms (σ2 = 0.1, 0.5, 2, 6). Lines indicate medians of 100 realizations (aggregated over the 100 × 100 mm2 soil domain). Shaded areas (first row) show minimum and maximum values.
The relative contributions of microbial functional groups with respect to dissolved monomer and small polymer concentrations (Figure 6, second and third row) highlights that spatial clustering of microorganisms differently affects the access of microbial functional groups to substrate. Oligotrophs were relatively more competitive at monomer concentrations >0.1 mg g−1 with decreasing spatial clustering and at concentration of small polymers <0.6 mg g−1 with strong spatial clustering (σ2 = 6). Copiotrophs benefited most from moderate spatial clustering (σ2 = 2) with monomers >0.1 mg g−1 and small polymers <0.75 mg g−1. Copiotrophic cheaters performed best at low spatial clustering (σ2 = 0.1, 0.5), independent of substrate concentration.
Discussion
Simulation results indicate that low and moderate initial spatial clustering of microbial decomposers exert some control over the functional composition of microbial communities, whereas the overall C turnover is only slightly affected. Oligotrophs, copiotrophs, and copiotrophic cheaters predominantly act as functionally redundant microbial guilds with respect to decomposition of C compounds. This fits well with conceptual view that C turnover is a “broad” soil process that is carried out by phylogenetically diverse but functionally redundant organisms (Schimel and Schaeffer, 2012; Nunan et al., 2017). Strong spatial clustering of microbial communities, however, induces diffusion-limited C availability at the microhabitat scale which translates into lower decomposition of C compounds and microbial growth at the cm scale. This finding corroborates previous results indicating that the spatial separation of substrates and decomposers can be compensated to a certain degree by shifts in the functional composition of the microbial community (Kaiser et al., 2015), but that if critical diffusion lengths are reached, diffusive transport strongly controls C turnover at the microhabitat scale (Folse and Allison, 2012; Manzoni et al., 2014; Portell et al., 2018).
Oligotrophs are observed to be most competitive regardless of spatial organization. Their competitive advantage results from higher substrate affinities to small polymers and monomers in combination with lower maintenance costs and predation than copiotrophs and copiotrophic cheaters. Copiotrophic cheaters successfully compete with oligotrophs for monomers and small polymers as long as substrate availability remains high enough. They can only sustain relatively low total biomass under unfavorable conditions by switching to dormancy. Interestingly, our results suggest that moderate spatial heterogeneity (σ2 = 2) is beneficial for copiotrophs. Moderate spatial clustering induces the formation of large areas of high monomer concentration by extracellular decomposition of small polymers. Copiotrophs become active and grow rapidly under relatively high concentrations of monomers while inhibiting the growth of other microorganisms. Thus, relatively more micro-environments of competitive advantage to copiotrophs against oligotrophs and copiotrophic cheaters are created in comparison to lower and higher spatial clustering. In addition, copiotrophs sustain themselves under less beneficial conditions by quickly switching to a dormant state, which drastically reduces maintenance costs and biomass decay by predation.
The simulated behavior of microbial functional groups supports experimental evidence of the importance of metabolic activation/deactivation strategies by microbial functional groups for regulating C turnover in soil (Placella et al., 2012; Joergensen and Wichern, 2018; Salazar et al., 2019). Our finding that interactions between microbial functional groups are controlled by the spatial localization of microorganisms is in agreement with previous results from individual-based modeling (Allison, 2005; Kaiser et al., 2015; Portell et al., 2018). SpatC model results, however, suggest a less severe impact of cheaters on microbial functioning and C turnover. In addition, our approach is able to considerably extend the total spatial dimension typically covered by individual-based modeling approaches (Allison, 2005; Folse and Allison, 2012; Kaiser et al., 2015) by several orders of magnitude, from ≤1 mm2 to 100 cm2. The INDISIM-SOM model (Banitz et al., 2015) is conceptually similar to SpatC but adopts an individual-based approach. INDISIM-SOM-NL simulates C and N dynamics in soil and splits the spatial domain into 30 × 30 grid cells of 310 μm, each containing two functional groups of microorganisms: heterotrophs and autotrophs. Despite assuming an individual-based approach, the spatial extend of INDISIM-SOM-NL is similar to the one covered in the present contribution. This is achieved by using the “superindividual” formalism, which assumes fewer individuals summarizing the properties and being representative of larger ensembles of microorganisms. Nonetheless, compared to INDISIM-SOM-NL, SpatC provides a higher temporal and spatial resolution, and considers three functional types of heterotrophic microorganisms.
SpatC scenario simulations provide predictions of the emergent macroscopic (cm) microbial and C dynamics resulting from small-scale (mm) distribution characteristics of microbial functional decomposer communities. Microbial biogeography at the microhabitat scale (μm) is thereby considered by using a spatial stochastic model to derive microbial distribution patterns at the μm-scale, which are aggregated to mm-scale distributions of microbial communities. The combination of statistical and process-based modeling applied with SpatC provides an upscaling approach that can consider feedbacks between microhabitats, microbial communities and soil microbial and physical processes up to the pedon scale. Hence, our study contributes to resolving the challenge of upscaling microbial regulation mechanisms from the microhabitat scale to larger scales relevant for soil management and global environmental change (Baveye et al., 2018). SpatC predictions of microbial and C dynamics are, however, dependent on the assumed biokinetic rate laws at the mm-scale, which have been shown to differ from rate laws at μm-scale (Chakrawal et al., 2019; Wang and Allison, 2019). Similarly, an exploratory analysis of SpatC revealed a very high sensitivity of model dynamics to some key biokinetic parameters that partly increased the observed mild effect of spatial heterogeneity (Supplementary Figures 28–30). The maximum growth rate of oligotrophs (μmax, O) strongly controlled the coexistence of functional microbial pools independent of spatial heterogeneity (Supplementary Figure 28). Higher values of μmax, O resulted in the fast depletion of small polymers and monomers and strongly reduced growth of copiotrophs and copiotrophic cheaters. In contrast, increasing depolymerisation rate coefficients of small polymers induced dominant growth of copiotrophs in combination with stronger effects of spatial distributions of microorganisms on microbial and C dynamics (Supplementary Figure 28). Parameters related to dormancy of oligotrophs and copiotrophic cheaters had a minor impact on model results, only a very high dormancy concentration threshold slightly affected dynamics (Supplementary Figure 29). As expected, less maintenance requirements of oligotrophs and less severe inhibition by copiotrophs resulted in higher biomass of oligotrophs in combination with faster and more complete degradation of small polymers and monomers (Supplementary Figure 30), but the effect of spatial heterogeneity did not significantly change.
The developed SpatC model considers the control of C turnover by spatial heterogeneity of functional microbial groups. However, SpatC currently simplifies the micro-scale distribution of organic C, which probably has a strong impact on C dynamics at larger scales. The simulated spatial patterns in organic matter decomposition are in alignment with experimentally observed patterns of extracellular enzyme activity (Kravchenko et al., 2019). Experimental evidence further suggests that C turnover is strongly determined by pore characteristics (Kravchenko and Guber, 2017; Juyal et al., 2019) and microbial activity is highest in pores between 10 and 300 μm (Kravchenko et al., 2019). Thus, an improved description of microbial C turnover could be gained by integrating realistic descriptions of soil pore structure based on X-ray computed tomography data (see e.g., Portell et al., 2018) in combination with a meaningful correlation structure of substrate and microbial group distribution using evidence-based spatial statistical modeling. In addition, the representation of biological community interactions remains limited. Crucial extensions could include the explicit representation of enzyme dynamics (Burns et al., 2013; Moyano et al., 2018; Wang and Allison, 2019) and the implementation specific fungal traits (Yang and van Elsas, 2018). Similarly, microbial dispersal and chemotactic behavior (Valdés-Parada et al., 2009; see e.g., Gharasoo et al., 2014; Locey et al., 2017; König et al., 2018) should be included in future. Other promising extensions are quorum sensing (Williams et al., 2007; Melke et al., 2010; Mund et al., 2016; McBride and Strickland, 2019; Schmidt et al., 2019) as regulator of biological interactions, as well as to improve the modeling of top-down control of microbial communities by predators and viruses (Pratama and van Elsas, 2018; Thakur and Geisen, 2019). Extensions along these lines will provide further insights into the biological controls on soil organic matter turnover by generating model-based hypotheses that can be tested against experimental evidence.
Soil organic matter formation is an emergent process. It cannot be directly predicted from community composition, but arises from non-linear feedbacks and interactions between microbial community members. To understand and predict these biogeochemical feedbacks it is crucial to combine microbial traits with the spatial arrangements between microorganisms in their micro-environment and their corresponding substrate. A key finding of our work is that the degree of spatial heterogeneity of microbial communities may control the relative contribution of functional microbial groups to biogeochemical processes and the degree of functional redundancy within microbial communities. Our simulation results suggest that metabolic activation/deactivation strategies of microbial functional groups may be a key control of C turnover in soil. These model-based implications could be tested with targeted experiments that enable spatially resolved measurements of microbial community composition and C fluxes at the microhabitat scale by extending existing approaches (e.g., Poll et al., 2006) and using novel techniques such as flow cells (Krueger et al., 2018) in combination with functional multilayered omics approaches (Jansson and Hofmockel, 2018; Sergaki et al., 2018).
Data Availability Statement
The raw data supporting the conclusions of this study will be made available by the authors, without undue reservation, to any qualified researcher.
Author Contributions
MU, EK, CP, TS, VS, and HP contributed the conception and design of the study. BK and VS performed Log Gaussian Cox Process simulations and provided aggregated point patterns. HP developed the model, performed the simulations, analyzed the data, and wrote the first draft of the manuscript. All authors contributed to manuscript revision, read, and approved the submitted version.
Funding
This study was financially supported by the Ellrichshausen Foundation and the Collaborative Research Center 1253 CAMPOS (DFG Grant Agreement SFB 1253/1 2017). The authors acknowledge support by the state of Baden-Württemberg through bwHPC.
Conflict of Interest
The authors declare that the research was conducted in the absence of any commercial or financial relationships that could be construed as a potential conflict of interest.
Acknowledgments
The authors are grateful for the excellent and stimulating feedback from three reviewers on the first manuscript version.
Supplementary Material
The Supplementary Material for this article can be found online at: https://www.frontiersin.org/articles/10.3389/fenvs.2020.00002/full#supplementary-material
References
Addiscott, T. M. (2010). Soil mineralization: an emergent process? Geoderma 160, 31–35. doi: 10.1016/j.geoderma.2010.03.016
Allison, S. D. (2005). Cheaters, diffusion and nutrients constrain decomposition by microbial enzymes in spatially structured environments. Ecol. Lett. 8, 626–635. doi: 10.1111/j.1461-0248.2005.00756.x
Allison, S. D. (2012). A trait-based approach for modelling microbial litter decomposition. Ecol. Lett. 15, 1058–1070. doi: 10.1111/j.1461-0248.2012.01807.x
Allison, S. D., and Goulden, M. L. (2017). Consequences of drought tolerance traits for microbial decomposition in the DEMENT model. Soil Biol. Biochem. 107, 104–113. doi: 10.1016/j.soilbio.2017.01.001
Alster, C. J., Weller, Z. D., and von Fischer, J. C. (2018). A meta-analysis of temperature sensitivity as a microbial trait. Glob. Change Biol. 24, 4211–4224. doi: 10.1111/gcb.14342
Baddeley, A. (2015). Spatial Point Patterns: Methodology and Applications with R, 1st Edn. New York, NY: Chapman and Hall/CRC.
Banitz, T., Gras, A., and Ginovart, M. (2015). Individual-based modeling of soil organic matter in NetLogo: Transparent, user-friendly, and open. Environ. Model. Softw. 71, 39–45. doi: 10.1016/j.envsoft.2015.05.007
Baveye, P. C., Otten, W., Kravchenko, A., Balseiro-Romero, M., Beckers, É., Chalhoub, M., et al. (2018). Emergent properties of microbial activity in heterogeneous soil microenvironments: different research approaches are slowly converging, yet major challenges remain. Front. Microbiol. 9:1929. doi: 10.3389/fmicb.2018.01929
Blagodatskaya, E., and Kuzyakov, Y. (2013). Active microorganisms in soil: critical review of estimation criteria and approaches. Soil Biol. Biochem. 67, 192–211. doi: 10.1016/j.soilbio.2013.08.024
Blankinship, J. C., Berhe, A. A., Crow, S. E., Druhan, J. L., Heckman, K. A., Keiluweit, M., et al. (2018). Improving understanding of soil organic matter dynamics by triangulating theories, measurements, and models. Biogeochemistry 140, 1–13. doi: 10.1007/s10533-018-0478-2
Borer, B., Tecon, R., and Or, D. (2018). Spatial organization of bacterial populations in response to oxygen and carbon counter-gradients in pore networks. Nat. Commun. 9:769. doi: 10.1038/s41467-018-03187-y
Bouskill, N. J., Tang, J., Riley, W. J., and Brodie, E. L. (2012). Trait-based representation of biological nitrification: model development, testing, and predicted community composition. Front. Microbiol. 3:364. doi: 10.3389/fmicb.2012.00364
Brangarí, A. C., Fernàndez-Garcia, D., Sanchez-Vila, X., and Manzoni, S. (2018). Ecological and soil hydraulic implications of microbial responses to stress – a modeling analysis. Adv. Water Resour. 116, 178–194. doi: 10.1016/j.advwatres.2017.11.005
Brookes, P. C., Chen, Y., Chen, L., Qiu, G., Luo, Y., and Xu, J. (2017). Is the rate of mineralization of soil organic carbon under microbiological control? Soil Biol. Biochem. 112, 127–139. doi: 10.1016/j.soilbio.2017.05.003
Buchkowski, R. W., Bradford, M. A., Grandy, A. S., Schmitz, O. J., and Wieder, W. R. (2017). Applying population and community ecology theory to advance understanding of belowground biogeochemistry. Ecol. Lett. 20, 231–245. doi: 10.1111/ele.12712
Burns, R. G., DeForest, J. L., Marxsen, J., Sinsabaugh, R. L., Stromberger, M. E., Wallenstein, M. D., et al. (2013). Soil enzymes in a changing environment: current knowledge and future directions. Soil Biol. Biochem. 58, 216–234. doi: 10.1016/j.soilbio.2012.11.009
Chakrawal, A., Herrmann, A. M., Koestel, J., Jarsjö, J., Nunan, N., Kätterer, T., et al. (2019). Dynamic upscaling of decomposition kinetics for carbon cycling models. Geosci. Model Dev. doi: 10.5194/gmd-2019-133
Coleman, D. C., Callaham, M. A. Jr., and Crossley, D. A Jr. (2017). Fundamentals of Soil Ecology, 3rd Edn. London: Elsevier Inc.
Ebrahimi, A., and Or, D. (2018). On upscaling of soil microbial processes and biogeochemical fluxes from aggregates to landscapes. J. Geophys. Res. Biogeosciences 123, 1526–1547. doi: 10.1029/2017JG004347
Falkowski, P. G., Fenchel, T., and Delong, E. F. (2008). The microbial engines that drive earth's biogeochemical cycles. Science 320, 1034–1039. doi: 10.1126/science.1153213
Fierer, N. (2017). Embracing the unknown: disentangling the complexities of the soil microbiome. Nat. Rev. Microbiol. 15, 579–590. doi: 10.1038/nrmicro.2017.87
Fierer, N., Barberán, A., and Laughlin, D. C. (2014). Seeing the forest for the genes: using metagenomics to infer the aggregated traits of microbial communities. Front. Microbiol. 5:614. doi: 10.3389/fmicb.2014.00614
Fierer, N., Bradford, M. A., and Jackson, R. B. (2007). Toward an ecological classification of soil bacteria. Ecology 88, 1354–1364. doi: 10.1890/05-1839
Fischer, H., Ingwersen, J., and Kuzyakov, Y. (2010). Microbial uptake of low-molecular-weight organic substances out-competes sorption in soil. Eur. J. Soil Sci. 61, 504–513. doi: 10.1111/j.1365-2389.2010.01244.x
Folse, H. J. III, and Allison, S. D. (2012). Cooperation, competition, and coalitions in enzyme-producing microbes: social evolution and nutrient depolymerization rates. Front. Microbiol. 3:338. doi: 10.3389/fmicb.2012.00338
Fry, E. L., De Long, J. R., Álvarez Garrido, L., Alvarez, N., Carrillo, Y., Castañeda-Gómez, L., et al. (2019). Using plant, microbe, and soil fauna traits to improve the predictive power of biogeochemical models. Methods Ecol. Evol. 10, 146–157. doi: 10.1111/2041-210X.13092
Garnier, P., Néel, C., Mary, B., and Lafolie, F. (2001). Evaluation of a nitrogen transport and transformation model in a bare soil. Eur. J. Soil Sci. 52:253. doi: 10.1046/j.1365-2389.2001.00374.x
Geyer, K. M., Dijkstra, P., Sinsabaugh, R., and Frey, S. D. (2019). Clarifying the interpretation of carbon use efficiency in soil through methods comparison. Soil Biol. Biochem. 128, 79–88. doi: 10.1016/j.soilbio.2018.09.036
Gharasoo, M., Centler, F., Fetzer, I., and Thullner, M. (2014). How the chemotactic characteristics of bacteria can determine their population patterns. Soil Biol. Biochem. 69, 346–358. doi: 10.1016/j.soilbio.2013.11.019
Graham, E. B., Knelman, J. E., Schindlbacher, A., Siciliano, S., Breulmann, M., Yannarell, A., et al. (2016). Microbes as engines of ecosystem function: when does community structure enhance predictions of ecosystem processes? Front. Microbiol. 7:214. doi: 10.3389/fmicb.2016.00214
Hackbusch, W. (1985). Multi-Grid Methods and Applications. Berlin, Heidelberg: Springer. Available online at: http://www.springerlink.com/content/978-3-662-02427-0 (accessed November 6, 2019).
Hall, E. K., Bernhardt, E. S., Bier, R. L., Bradford, M. A., Boot, C. M., Cotner, J. B., et al. (2018). Understanding how microbiomes influence the systems they inhabit. Nat. Microbiol. 3, 977–982. doi: 10.1038/s41564-018-0201-z
He, Y., Yang, J., Zhuang, Q., Harden, J. W., McGuire, A. D., Liu, Y., et al. (2015). Incorporating microbial dormancy dynamics into soil decomposition models to improve quantification of soil carbon dynamics of northern temperate forests. J. Geophys. Res. G Biogeosciences 120, 2596–2611. doi: 10.1002/2015JG003130
Hendry, M. J., Ranville, J. R., Boldt-Leppin, B. E. J., and Wassenaar, L. I. (2003). Geochemical and transport properties of dissolved organic carbon in a clay-rich aquitard. Water Resour. Res. 39:SBH91. doi: 10.1029/2002WR001943
Ho, A., Lonardo, D. P. D., and Bodelier, P. L. E. (2017). Revisiting life strategy concepts in environmental microbial ecology. FEMS Microbiol. Ecol. 93:fix006. doi: 10.1093/femsec/fix006
Huang, Y., Guenet, B., Ciais, P., Janssens, I. A., Soong, J. L., Wang, Y., et al. (2018). ORCHIMIC (v1.0), a microbe-mediated model for soil organic matter decomposition. Geosci. Model Dev. 11, 2111–2138. doi: 10.5194/gmd-11-2111-2018
Ingwersen, J., Poll, C., Streck, T., and Kandeler, E. (2008). Micro-scale modelling of carbon turnover driven by microbial succession at a biogeochemical interface. Soil Biol. Biochem. 40, 872–886. doi: 10.1016/j.soilbio.2007.10.018
Jansson, J. K., and Hofmockel, K. S. (2018). The soil microbiome — from metagenomics to metaphenomics. Curr. Opin. Microbiol. 43, 162–168. doi: 10.1016/j.mib.2018.01.013
Joergensen, R. G., and Wichern, F. (2018). Alive and kicking: why dormant soil microorganisms matter. Soil Biol. Biochem. 116, 419–430. doi: 10.1016/j.soilbio.2017.10.022
Jury, W. A., and Horton, R. (2004). Soil Physics. Hoboken, NJ: Wiley. Available online at: http://swbplus.bsz-bw.de/bsz112245498cov.htm
Juyal, A., Otten, W., Falconer, R., Hapca, S., Schmidt, H., Baveye, P. C., et al. (2019). Combination of techniques to quantify the distribution of bacteria in their soil microhabitats at different spatial scales. Geoderma 334, 165–174. doi: 10.1016/j.geoderma.2018.07.031
Kaiser, C., Franklin, O., Richter, A., and Dieckmann, U. (2015). Social dynamics within decomposer communities lead to nitrogen retention and organic matter build-up in soils. Nat. Commun. 6:8960. doi: 10.1038/ncomms9960
Kaiser, K., and Zech, W. (1997). About the sorption of dissolved organic matter to forest soils. Über Sorptionseigenschaften Von Waldbà den Bezüglich Gelà ster Org. Subst. 160:295.
Komarov, A., Chertov, O., Bykhovets, S., Shaw, C., Nadporozhskaya, M., Frolov, P., et al. (2017). Romul_Hum model of soil organic matter formation coupled with soil biota activity. I. Problem formulation, model description, and testing. Ecol. Model. 345, 113–124. doi: 10.1016/j.ecolmodel.2016.08.007
König, S., Worrich, A., Banitz, T., Centler, F., Harms, H., Kästner, M., et al. (2018). Spatiotemporal disturbance characteristics determine functional stability and collapse risk of simulated microbial ecosystems. Sci. Rep. 8:9488. doi: 10.1038/s41598-018-27785-4
Krause, S., Le Roux, X., Niklaus, P. A., van Bodegom, P. M., Lennon, J. T., Bertilsson, S., et al. (2014). Trait-based approaches for understanding microbial biodiversity and ecosystem functioning. Front. Microbiol. 5:251. doi: 10.3389/fmicb.2014.00251
Kravchenko, A. N., and Guber, A. K. (2017). Soil pores and their contributions to soil carbon processes. Geoderma 287, 31–39. doi: 10.1016/j.geoderma.2016.06.027
Kravchenko, A. N., Guber, A. K., Razavi, B. S., Koestel, J., Blagodatskaya, E. V., and Kuzyakov, Y. (2019). Spatial patterns of extracellular enzymes: combining X-ray computed micro-tomography and 2D zymography. Soil Biol. Biochem. 135, 411–419. doi: 10.1016/j.soilbio.2019.06.002
Krueger, J., Heitkötter, J., Leue, M., Schlüter, S., Vogel, H.-J., Marschner, B., et al. (2018). Coupling of interfacial soil properties and bio-hydrological processes: The flow cell concept: the Flow Cell Concept. Ecohydrology 11:e2024. doi: 10.1002/eco.2024
Kuzyakov, Y., Blagodatskaya, E., and Blagodatsky, S. (2009). Comments on the paper by Kemmitt et al. (2008) “Mineralization of native soil organic matter is not regulated by the size, activity or composition of the soil microbial biomass - A new perspective” [Soil Biology & Biochemistry 40, 61-73]: The biology of the Regulatory Gate. Soil Biol. Biochem. 41, 435–439. doi: 10.1016/j.soilbio.2008.07.023
Le Roux, X., Bouskill, N. J., Niboyet, A., Barthes, L., Dijkstra, P., Field, C. B., et al. (2016). Predicting the responses of soil nitrite-oxidizers to multi-factorial global change: a trait-based approach. Front. Microbiol. 7:628. doi: 10.3389/fmicb.2016.00628
Lehmann, J., and Kleber, M. (2015). The contentious nature of soil organic matter. Nature 528, 60–68. doi: 10.1038/nature16069
Lendenmann, U., and Egli, T. (1998). Kinetic models for the growth of Escherichia coil with mixtures of sugars under carbon-limited conditions. Biotechnol. Bioeng. 59, 99–107. doi: 10.1002/(SICI)1097-0290(19980705)59:1<99::AID-BIT13>3.0.CO;2-Y
Lennon, J. T., and Jones, S. E. (2011). Microbial seed banks: The ecological and evolutionary implications of dormancy. Nat. Rev. Microbiol. 9, 119–130. doi: 10.1038/nrmicro2504
Locey, K. J., Fisk, M. C., and Lennon, J. T. (2017). Microscale insight into microbial seed banks. Front. Microbiol. 7:2040. doi: 10.3389/fmicb.2016.02040
Malik, A. A., Martiny, J. B. H., Brodie, E. L., Martiny, A. C., Treseder, K. K., and Allison, S. D. (2020). Defining trait-based microbial strategies with consequences for soil carbon cycling under climate change. ISME J. 14, 1–19. doi: 10.1038/s41396-019-0510-0
Manzoni, S., Capek, P., Porada, P., Thurner, M., Winterdahl, M., Beer, C., et al. (2018). Reviews and syntheses: carbon use efficiency from organisms to ecosystems – definitions, theories, and empirical evidence. Biogeosciences 15, 5929–5949. doi: 10.5194/bg-15-5929-2018
Manzoni, S., Schaeffer, S. M., Katul, G., Porporato, A., and Schimel, J. P. (2014). A theoretical analysis of microbial eco-physiological and diffusion limitations to carbon cycling in drying soils. Soil Biol. Biochem. 73, 69–83. doi: 10.1016/j.soilbio.2014.02.008
Manzoni, S., Taylor, P., Richter, A., Porporato, A., and Ågren, G. I. (2012). Environmental and stoichiometric controls on microbial carbon-use efficiency in soils. New Phytol. 196, 79–91. doi: 10.1111/j.1469-8137.2012.04225.x
Martiny, J. B. H., Jones, S. E., Lennon, J. T., and Martiny, A. C. (2015). Microbiomes in light of traits: a phylogenetic perspective. Science 350:aac9323. doi: 10.1126/science.aac9323
Maynard, D. S., Bradford, M. A., Covey, K. R., Lindner, D., Glaeser, J., Talbert, D. A., et al. (2019). Consistent trade-offs in fungal trait expression across broad spatial scales. Nat. Microbiol. 4:846–853. doi: 10.1038/s41564-019-0361-5
McBride, S. G., and Strickland, M. S. (2019). Quorum sensing modulates microbial efficiency by regulating bacterial investment in nutrient acquisition enzymes. Soil Biol. Biochem. 136:107514. doi: 10.1016/j.soilbio.2019.06.010
McMahon, S., and Parnell, J. (2014). Weighing the deep continental biosphere. FEMS Microbiol. Ecol. 87, 113–120. doi: 10.1111/1574-6941.12196
Melke, P., Sahlin, P., Levchenko, A., and Jönsson, H. (2010). A cell-based model for quorum sensing in heterogeneous bacterial colonies. PLoS Comput. Biol. 6:e1000819. doi: 10.1371/journal.pcbi.1000819
Mellage, A., Eckert, D., Grösbacher, M., Inan, A. Z., Cirpka, O. A., and Griebler, C. (2015). Dynamics of suspended and attached aerobic toluene degraders in small-scale flow-through sediment systems under growth and starvation conditions. Environ. Sci. Technol. 49, 7161–7169. doi: 10.1021/es5058538
Millington, R. J., and Quirk, J. P. (1961). Permeability of porous solids. Trans. Faraday Soc. 57:1200. doi: 10.1039/tf9615701200
Moller, J., Syversveen, A. R., and Waagepetersen, R. P. (1998). Log Gaussian Cox processes. Scand. J. Stat. 25, 451–482. doi: 10.1111/1467-9469.00115
Moyano, F. E., Vasilyeva, N., and Menichetti, L. (2018). Diffusion limitations and Michaelis-Menten kinetics as drivers of combined temperature and moisture effects on carbon fluxes of mineral soils. Biogeosciences 15, 5031–5045. doi: 10.5194/bg-15-5031-2018
Mund, A., Kuttler, C., Pérez-Velázquez, J., and Hense, B. A. (2016). An age-dependent model to analyse the evolutionary stability of bacterial quorum sensing. J. Theor. Biol. 405, 104–115. doi: 10.1016/j.jtbi.2015.12.021
Negassa, W. C., Guber, A. K., Kravchenko, A. N., Marsh, T. L., Hildebrandt, B., and Rivers, M. L. (2015). Properties of soil pore space regulate pathways of plant residue decomposition and community structure of associated bacteria. PLoS ONE 10:e0123999. doi: 10.1371/journal.pone.0123999
Neill, C., and Guenet, B. (2010). Comparing two mechanistic formalisms for soil organic matter dynamics: a test with in vitro priming effect observations. Soil Biol. Biochem. 42, 1212–1221. doi: 10.1016/j.soilbio.2010.04.016
Nunan, N., Leloup, J., Ruamps, L. S., Pouteau, V., and Chenu, C. (2017). Effects of habitat constraints on soil microbial community function. Sci. Rep. 7:4280. doi: 10.1038/s41598-017-04485-z
Oren, A., and Chefetz, B. (2012). Successive sorption-desorption cycles of dissolved organic matter in mineral soil matrices. Geoderma 189–190, 108–115. doi: 10.1016/j.geoderma.2012.05.004
Pagel, H., Ingwersen, J., Poll, C., Kandeler, E., and Streck, T. (2014). Micro-scale modeling of pesticide degradation coupled to carbon turnover in the detritusphere: model description and sensitivity analysis. Biogeochemistry 117, 185–204. doi: 10.1007/s10533-013-9851-3
Pagel, H., Poll, C., Ingwersen, J., Kandeler, E., and Streck, T. (2016). Modeling coupled pesticide degradation and organic matter turnover: From gene abundance to process rates. Soil Biol. Biochem. 103, 349–364. doi: 10.1016/j.soilbio.2016.09.014
Pausch, J., Hünninghaus, M., Kramer, S., Scharroba, A., Scheunemann, N., Butenschoen, O., et al. (2018). Carbon budgets of top- and subsoil food webs in an arable system. Pedobiologia 69, 29–33. doi: 10.1016/j.pedobi.2018.06.002
Perveen, N., Barot, S., Alvarez, G., Klumpp, K., Martin, R., Rapaport, A., et al. (2014). Priming effect and microbial diversity in ecosystem functioning and response to global change: a modeling approach using the SYMPHONY model. Glob. Change Biol. 20, 1174–1190. doi: 10.1111/gcb.12493
Placella, S. A., Brodie, E. L., and Firestone, M. K. (2012). Rainfall-induced carbon dioxide pulses result from sequential resuscitation of phylogenetically clustered microbial groups. Proc. Natl. Acad. Sci. U.S.A. 109, 10931–10936. doi: 10.1073/pnas.1204306109
Poll, C., Ingwersen, J., Stemmer, M., Gerzabek, M. H., and Kandeler, E. (2006). Mechanisms of solute transport affect small-scale abundance and function of soil microorganisms in the detritusphere. Eur. J. Soil Sci. 57, 583–595. doi: 10.1111/j.1365-2389.2006.00835.x
Portell, X., Pot, V., Garnier, P., Otten, W., and Baveye, P. C. (2018). Microscale heterogeneity of the spatial distribution of organic matter can promote bacterial biodiversity in soils: insights from computer simulations. Front. Microbiol. 9:1583. doi: 10.3389/fmicb.2018.01583
Pratama, A. A., and van Elsas, J. D. (2018). The ‘Neglected' soil virome – potential role and impact. Trends Microbiol. 26, 649–662. doi: 10.1016/j.tim.2017.12.004
R Core Team (2018). R: A Language and Environment for Statistical Computing. Vienna: R Foundation for Statistical Computing. Available online at: https://www.R-project.org
Rath, K. M., Fierer, N., Murphy, D. V., and Rousk, J. (2019). Linking bacterial community composition to soil salinity along environmental gradients. ISME J. 13, 836–846. doi: 10.1038/s41396-018-0313-8
Raynaud, X., and Nunan, N. (2014). Spatial ecology of bacteria at the microscale in soil. PLoS ONE 9:e87217. doi: 10.1371/journal.pone.0087217
Ruamps, L. S., Nunan, N., Pouteau, V., Leloup, J., Raynaud, X., Roy, V., et al. (2013). Regulation of soil organic C mineralisation at the pore scale. FEMS Microbiol. Ecol. 86, 26–35. doi: 10.1111/1574-6941.12078
Saad, Y. (1993). A flexible inner-outer preconditioned GMRES algorithm. SIAM J. Sci. Comput. 14, 461–469. doi: 10.1137/0914028
Salazar, A., Lennon, J. T., and Dukes, J. S. (2019). Microbial dormancy improves predictability of soil respiration at the seasonal time scale. Biogeochemistry 144, 103–116. doi: 10.1007/s10533-019-00574-5
Schimel, J., Becerra, C. A., and Blankinship, J. (2017). Estimating decay dynamics for enzyme activities in soils from different ecosystems. Soil Biol. Biochem. 114, 5–11. doi: 10.1016/j.soilbio.2017.06.023
Schimel, J., and Schaeffer, S. M. (2012). Microbial control over carbon cycling in soil. Front. Microbiol. 3:348. doi: 10.3389/fmicb.2012.00348
Schimel, J. P. (2018). Life in dry soils: effects of drought on soil microbial communities and processes. Annu. Rev. Ecol. Evol. Syst. 49, 409–432. doi: 10.1146/annurev-ecolsys-110617-062614
Schmidt, M. W. I., Torn, M. S., Abiven, S., Dittmar, T., Guggenberger, G., Janssens, I. A., et al. (2011). Persistence of soil organic matter as an ecosystem property. Nature 478, 49–56. doi: 10.1038/nature10386
Schmidt, R., Ulanova, D., Wick, L. Y., Bode, H. B., and Garbeva, P. (2019). Microbe-driven chemical ecology: past, present and future. ISME J. 13, 2656–2663. doi: 10.1038/s41396-019-0469-x
Schmidt, S. I., Kreft, J.-U., Mackay, R., Picioreanu, C., and Thullner, M. (2018). Elucidating the impact of micro-scale heterogeneous bacterial distribution on biodegradation. Adv. Water Resour. 116, 67–76. doi: 10.1016/j.advwatres.2018.01.013
Sergaki, C., Lagunas, B., Lidbury, I., Gifford, M. L., and Schäfer, P. (2018). Challenges and approaches in microbiome research: from fundamental to applied. Front. Plant Sci. 9:1205. doi: 10.3389/fpls.2018.01205
Sinsabaugh, R. L., Belnap, J., Findlay, S. G., Shah, J. J. F., Hill, B. H., Kuehn, K. A., et al. (2014). Extracellular enzyme kinetics scale with resource availability. Biogeochemistry 121, 287–304. doi: 10.1007/s10533-014-0030-y
Sokol, N. W., Sanderman, J., and Bradford, M. A. (2019). Pathways of mineral-associated soil organic matter formation: integrating the role of plant carbon source, chemistry, and point of entry. Glob. Change Biol. 25, 12–24. doi: 10.1111/gcb.14482
Stolpovsky, K., Fetzer, I., Van Cappellen, P., and Thullner, M. (2016). Influence of dormancy on microbial competition under intermittent substrate supply: Insights from model simulations. FEMS Microbiol. Ecol. 92, 1–10. doi: 10.1093/femsec/fiw071
Stolpovsky, K., Martinez-Lavanchy, P., Heipieper, H. J., Van Cappellen, P., and Thullner, M. (2011). Incorporating dormancy in dynamic microbial community models. Ecol. Model. 222, 3092–3102. doi: 10.1016/j.ecolmodel.2011.07.006
Streck, T., Poletika, N. N., Jury, W. A., and Farmer, W. J. (1995). Description of simazine transport with rate-limited, two-stage, linear and nonlinear sorption. Water Resour. Res. 31:811. doi: 10.1029/94WR02822
Strong, D. T., De Wever, H., Merckx, R., and Recous, S. (2004). Spatial location of carbon decomposition in the soil pore system. Eur. J. Soil Sci. 55, 739–750. doi: 10.1111/j.1365-2389.2004.00639.x
Thakur, M. P., and Geisen, S. (2019). Trophic regulations of the soil microbiome. Trends Microbiol. 27, 771–780. doi: 10.1016/j.tim.2019.04.008
Trivedi, P., Delgado-Baquerizo, M., Trivedi, C., Hu, H., Anderson, I. C., Jeffries, T. C., et al. (2016). Microbial regulation of the soil carbon cycle: evidence from gene-enzyme relationships. ISME J. 10, 2593–2604. doi: 10.1038/ismej.2016.65
Valdés-Parada, F. J., Porter, M. L., Narayanaswamy, K., Ford, R. M., and Wood, B. D. (2009). Upscaling microbial chemotaxis in porous media. Adv. Water Resour. 32, 1413–1428. doi: 10.1016/j.advwatres.2009.06.010
Vandenbruwane, J., De Neve, S., Qualls, R. G., Sleutel, S., and Hofman, G. (2007). Comparison of different isotherm models for dissolved organic carbon (DOC) and nitrogen (DON) sorption to mineral soil. Geoderma 139:144. doi: 10.1016/j.geoderma.2007.01.012
Wang, B., and Allison, S. D. (2019). Emergent properties of organic matter decomposition by soil enzymes. Soil Biol. Biochem. 136:107522. doi: 10.1016/j.soilbio.2019.107522
Wang, G., Mayes, M. A., Gu, L., and Schadt, C. W. (2014). Representation of dormant and active microbial dynamics for ecosystem modeling. PLoS ONE 9:e89252. doi: 10.1371/journal.pone.0089252
Wang, G., and Post, W. M. (2012). A theoretical reassessment of microbial maintenance and implications for microbial ecology modeling. FEMS Microbiol. Ecol. 81, 610–617. doi: 10.1111/j.1574-6941.2012.01389.x
Wang, G., Post, W. M., and Mayes, M. A. (2013). Development of microbial-enzyme-mediated decomposition model parameters through steady-state and dynamic analyses. Ecol. Appl. 23, 255–272. doi: 10.1890/12-0681.1
Webb, C. T., Hoeting, J. A., Ames, G. M., Pyne, M. I., and LeRoy Poff, N. (2010). A structured and dynamic framework to advance traits-based theory and prediction in ecology. Ecol. Lett. 13, 267–283. doi: 10.1111/j.1461-0248.2010.01444.x
Wieder, W. R., Grandy, A. S., Kallenbach, C. M., Taylor, P. G., and Bonan, G. B. (2015). Representing life in the earth system with soil microbial functional traits in the MIMICS model. Geosci. Model Dev. 8, 1789–1808. doi: 10.5194/gmd-8-1789-2015
Williams, E. K., and Plante, A. F. (2018). A bioenergetic framework for assessing soil organic matter persistence. Front. Earth Sci. 6:143. doi: 10.3389/feart.2018.00143
Williams, P., Winzer, K., Chan, W. C., and Cámara, M. (2007). Look who's talking: communication and quorum sensing in the bacterial world. Philos. Trans. R. Soc. B Biol. Sci. 362, 1119–1134. doi: 10.1098/rstb.2007.2039
Worch, E. (1993). Eine neue Gleichung zur Berechnung von Diffusionskoeffizienten gelöster Stoffe. Vom Wasser J. Exklus. Für DEV-Plus-Abonn. Mitglieder Wasserchem. Ges. 81, 289–297.
Keywords: microbial functional groups, trait-based model, microbial biogeography, upscaling, soil organic matter cycling, log gaussian cox process point pattern
Citation: Pagel H, Kriesche B, Uksa M, Poll C, Kandeler E, Schmidt V and Streck T (2020) Spatial Control of Carbon Dynamics in Soil by Microbial Decomposer Communities. Front. Environ. Sci. 8:2. doi: 10.3389/fenvs.2020.00002
Received: 14 September 2019; Accepted: 09 January 2020;
Published: 30 January 2020.
Edited by:
Ali Ebrahimi, Massachusetts Institute of Technology, United StatesReviewed by:
Xavier Portell, Cranfield University, United KingdomMichelle Y. Quigley, Michigan State University, United States
Stefano Manzoni, Stockholm University, Sweden
Copyright © 2020 Pagel, Kriesche, Uksa, Poll, Kandeler, Schmidt and Streck. This is an open-access article distributed under the terms of the Creative Commons Attribution License (CC BY). The use, distribution or reproduction in other forums is permitted, provided the original author(s) and the copyright owner(s) are credited and that the original publication in this journal is cited, in accordance with accepted academic practice. No use, distribution or reproduction is permitted which does not comply with these terms.
*Correspondence: Holger Pagel, holgerp@uni-hohenheim.de