Effects of Temperature and Water Availability on Northern European Boreal Forests
 Guiomar Ruiz-Pérez
 Giulia Vico
- Department of Crop Production Ecology, Swedish University of Agricultural Sciences, Uppsala, Sweden
Boreal forests are warming faster than the rest of the planet. Do the benefits of higher temperatures and longer growing seasons for forest productivity exceed the negative effects of more frequent dry spells and heat waves, shifting precipitation patterns, and higher evaporative demands? And are the effects uniformly distributed geographically? To answer to these questions, the relationship between climatic variables and NDVI—a proxy of forest productivity at regional scale—was explored via Partial Least Square (PLS) regression analyses. We focused on Northern Europe, where contrasting findings on the effects of warming have been reported and that has so far been overlooked by systematic large-scale explorations of the linkages between boreal forest productivity and climatic conditions. The results show that the effects of warmer temperatures on boreal forest productivity are not uniformly positive and that water stress is already negatively affecting these forests. Indeed, increased temperatures appear beneficial in northern and wetter regions, while warmer temperatures mostly reduce forest productivity in southern and drier areas. These results are suggestive of already existing limitations due to water availability and warm temperatures, even in mesic regions like Northern Europe. These conditions are expected to become more frequent and intense in the future, potentially reducing the ability of boreal forests to provide their essential ecosystem services unless forest management practices are adapted to the new conditions.
Introduction
Global warming is more pronounced in boreal forests than elsewhere, with temperatures increasing twice as fast as the rest of the planet (Intergovernmental Panel on Climate Change, 2014). They are considered largely unaffected by or even benefitting from climate change (Boisvenue and Running, 2006), particularly if compared to ecosystems experiencing drier or more variable conditions (Allen et al., 2010; Anderegg et al., 2013). So far, rising temperatures have mostly enhanced boreal forest productivity and some forests might still be able to cope with further temperature increases (Myneni et al., 1997; Kauppi et al., 2014). Nevertheless, there is increasing evidence that boreal ecosystems are also negatively affected by climate change (Martin-Benito and Pederson, 2015), suggesting that their vulnerability to future conditions is currently severely underestimated (Allen et al., 2015). Indeed, future climates can lead to more frequent stress events, including longer periods without precipitation (hereafter “dry spells”) and potentially damaging high temperatures, which can cause widespread reduction in productivity and enhance mortality (Anderegg et al., 2013; Buermann et al., 2014). Dry spells can also cancel out the beneficial effects of higher temperatures (Belyazid and Zanchi, 2019).
Based on remotely sensed data, a prolonged and extensive regional decline in forest productivity [termed “browning trend” by Goetz et al. (2005); Lloyd and Bunn (2007)] has already been observed in eastern Alaska and western Canada (Beck and Goetz, 2011), western central Eurasia and western North America (Buermann et al., 2014). Additionally, tree rings and wood density measurements suggest that in recent decades there has been a divergence between warming and tree growth, with localized shifts to a negative correlation between temperature and growth (D'Arrigo et al., 2008; Porter and Pisaric, 2011). Moreover, boreal forests appear increasingly vulnerable to indirect effects of rising temperatures, including temperature-induced drought stress (Barber et al., 2000; Beck and Goetz, 2011), increased frequency of fires (Kasischke and Turetsky, 2006; Rubtsov et al., 2011), increased risk of insect outbreaks (Kurz et al., 2008) and more frequent climate extremes (Mulder et al., 2019). Nevertheless, in Northern Europe, the effects of rising temperatures are still largely unclear and partially contrasting. For example, positive correlations emerged between tree growth and monthly mean temperature in June and July of the year prior to the ring formation at latitudes higher than ~65°N, whereas correlations were negative at lower latitudes (Babst et al., 2012). Reports of forest growing stocks showed that forest productivity has been increasing in the region (Gauthier et al., 2015), whereas analysis based on remotely-sensed variables found mostly stable productivity in boreal forests (Bjerke et al., 2014). Northern Europe is also not exempt from indirect damaging effects of rising temperatures, with recent reports of detrimental effects of dry spells and high temperatures on forest productivity in southern Sweden, symptoms of drought-induced top dieback in southern Norway, several drought-affected sites over Finland, and reductions in the carbon (C) sequestration potential of forests (Muukkonen et al., 2015; Rosner et al., 2018; Belyazid and Zanchi, 2019).
These partially contrasting observations regarding the effects of changing climatic conditions on Northern European forests can be due to differences in the proxy of forest productivity being used in each study—from remotely sensed vegetation indices such as NDVI (Olofsson et al., 2008) to in-situ measures such as tree-rings (Babst et al., 2012); the extent and diversity of the study site(s)—from specific species (Rosner et al., 2018) to mixed forests (Piao et al., 2017); the spatial resolution and coverage—from images at different spatial resolutions (Olofsson et al., 2008 and Sulla-Menashe et al., 2018) to experimental plots (Rosner et al., 2018); the temporal resolution of observations and the length of the period analyzed—from analyses based on monthly averages (Babst et al., 2012) to seasonal and annual averages (Beck and Goetz, 2011). These discrepancies call for an updated analysis extending over the entire region, in order to elucidate the key drivers of forest productivity and hence how future conditions can affect these forests and where management should focus on climate adaptation. Ensuring continued forest productivity in Northern Europe in the future is key for European climate mitigation actions and economy. Indeed, one of the pathways toward the reduction of CO2 stipulated in the Paris Agreement of the United Nations Framework Convention on Climate Change (UNFCCC) is the use of harvested biomass to substitute fossil fuel (Kallio et al., 2013; Smyth et al., 2017). Northern European forests are the main source of biomass in Europe and hence they are necessary for the achievement of the European targets for CO2 emission reduction in energy and climate policies (Rytter et al., 2015, 2016). Already today, 40% of energy used in the Nordic countries is obtained from renewable sources, mostly from forest biomass (~60% of the total renewable energy; Nordic Statistics, 2017). In Sweden and Finland, the consumption of wood-based energy by the rural population is more than five times the European average (Köhl et al., 2011). Northern European forests act as a C sink in the global C cycle, with an estimated annual C gain around 20,000 Gg [the highest proportion of European forests; United Nations Framework Convention on Climate Change (2011)]. Moreover, Northern European forests are also a key economic resource, especially in Finland and Sweden, constituting around 5.5 and 3.5% of national GDP, respectively. The pressure to produce biomass already clashes with the provision of other ecosystem services, such as those linked to soil and water quality (Koskiaho et al., 2003), mental and physical health (Grahn and Stigsdotter, 2003), and opportunities for recreational activities and tourism (Hall et al., 2009; Tangeland et al., 2013). Aside from their importance for climate actions and economy, investigating the effects of Northern European forests is interesting because of the intrinsic differences between these forests and other boreal regions. From the management standpoint, Northern European forests differ from other boreal forests in species composition and use. Scots pine, Norway spruce, mountain birch and downy birch dominate the boreal forest of Europe, with a minor component of European aspen ({Boonstra et al., 2016 #128}). Furthermore, forests in Northern European have been harvested for longer periods and more intensively than in North America and Russia, so that there is considerably less primary forest left (Ruckstuhl et al., 2008; Elbakidze et al., 2013). Climatically, Northern Europe is subject generally to milder and wetter conditions when compared to similar latitudes in Asia and North America (mostly characterized by continental climates). These conspicuous differences prevent the direct extrapolation of results and conclusions obtained elsewhere (Kong et al., 2017).
Because of the importance of boreal forests in Northern Europe for the delivery of the aforementioned ecosystem services, there is the need to quantify the forest sensitivity to climatic conditions at regional scale and identify which climatic conditions are beneficial and which are detrimental for these forests. Future climates are expected to result in a substantial increase in temperatures, in particular at high latitudes. The projected changes in precipitation are less clear, but an increase in winter precipitation and a decrease during the summers is expected (Ruosteenoja et al., 2018). Even if the amount of precipitation remained unaltered, the expected increase in temperature will enhance losses via evapotranspiration and result in more frequent periods of low water availability (Ruosteenoja et al., 2018). As such, extreme conditions in terms of heat and drought like the ones observed in summer 2018 are expected to become common in the next few decades (Toreti et al., 2019). Therefore, the importance of water availability for forest productivity on Northern Europe is expected to increase; and management approaches should consider this aspect in increasing detail at least in more vulnerable regions. With a focus on the interplay between warmer temperatures and water availability, the following hypotheses were tested:
• Even though classified as temperature- and light-limited, the productivity of Northern European forests is also affected by water availability;
• The effects of warmer temperature on forest productivity are not homogeneously positive over Northern Europe;
• The correlation between temperature and forest productivity is positive in cold and moist locations while shifting to negative in warm and dry ones;
• By driving vegetation water availability, the timing of precipitation plays a more important role than the total precipitation amount.
To this aim, we explore the relationship between the MODIS-derived Normalized Difference Vegetation Index (NDVI)—a measure of vegetation activity and a proxy of forest productivity—and high-resolution gridded meteorological data (E-OBS) across Northern Europe for the period 2000–2015. Such large-scale study allows going beyond site-specific observations, potentially providing explanations for existing conflicting findings on Norther European forest responses to climate change. In particular, the response of forests to variations in climatic drivers within this period is examined and regions where forest productivity is positively and negatively affected by warming are identified. The potential mechanisms behind different responses are discussed, with special focus on the joint role of temperatures and water availability. The results have implications in the face of climate change because boreal regions are predicted to shift from short, cool summers toward longer, warmer summers. It will also serve to identify the most problematic hotspots where specific management strategies—species choices, planting density, rules of thinning and final felling, harvest intensities (e.g., Baul et al., 2017)—should be implemented.
Data and Methods
Study Area
Northern Europe has a heterogeneous landscape, characterized by extensive forests, agricultural lands mostly in the southernmost regions and sparsely vegetated areas at higher elevations and in the northernmost areas. Here the focus is forested areas extending from latitude 55° to 70°N in Norway, Sweden and Finland (Figure 1—Denmark and Baltic countries were not included).
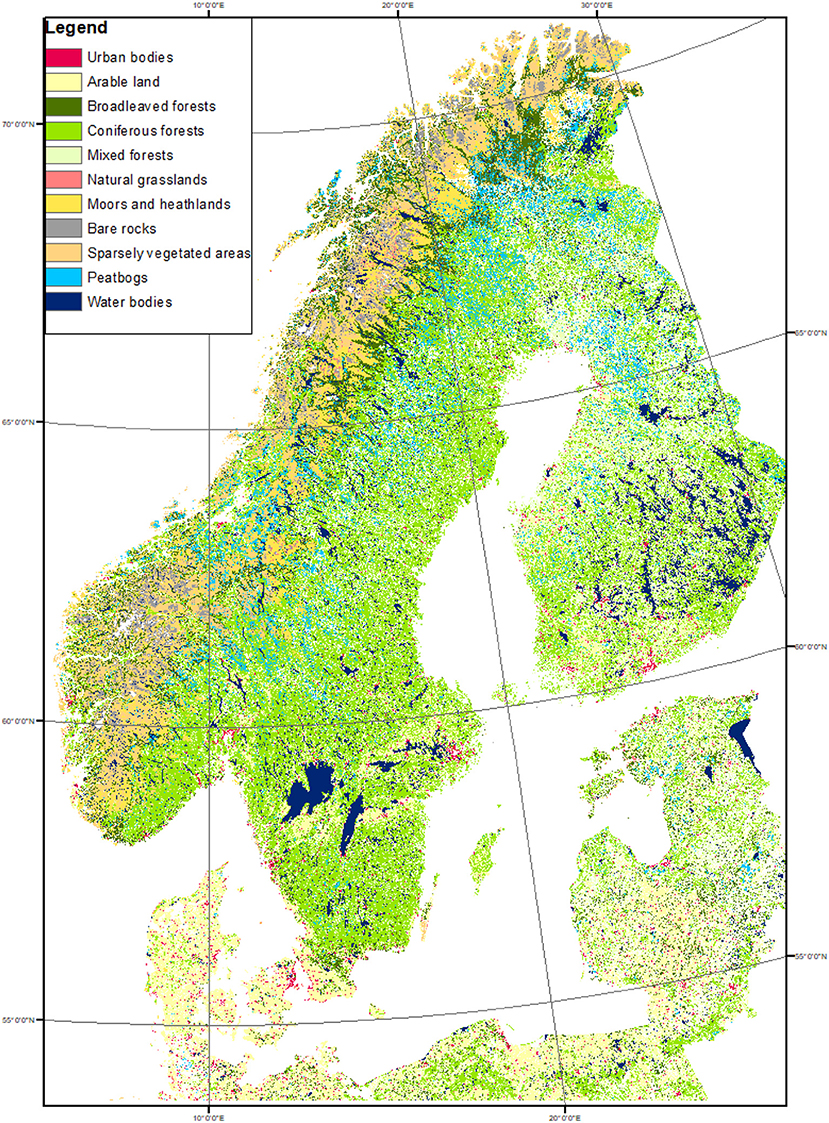
Figure 1. Scandinavian land-use map extracted from CORINE (2012). The statistical analyses were performed in all pixels classified as forest (broad-leaved, coniferous, and mixed forests; green shades).
The forested areas were identified based on the CORINE land cover dataset (version 2012, 100 × 100 m of resolution, provided by the European Environment Agency). CORINE land cover is widely used for environmental modeling and land cover/land use change analyses in Europe (Büttner, 2014). CORINE land cover is widely used for environmental modeling and land cover/land use change analyses in Europe (Büttner, 2014). Two European validation studies have shown that the achieved accuracy is above the 85%, lending support to the use of this product (Soukup et al., 2016). The analyses were extended to all pixels identified in CORINE as dominated by coniferous, broadleaf or mixed forests. More than 90% of those pixels were classified as coniferous. This approach allowed excluding the non-vegetated or sparsely vegetated areas, grasslands, croplands, water bodies and urban areas.
Source of Data
Moderate Resolution Imaging Spectroradiometer (MODIS)—Normalized Difference Vegetation Index (NDVI)
To explore the entire study area, the Normalized Difference Vegetation Index (NDVI) was used as a proxy of forest productivity. NDVI is a radiometric measure of the amount of photosynthetically active radiation (~400–700 nm) absorbed by vegetation and provides an indirect measure of vegetation photosynthetic activity, among other ecosystems, also in boreal forests (Park et al., 2016). Even though some aspects of productivity are not well-captured by this index (Fernández-Martínez et al., 2019; Tei et al., 2019), NDVI is often used as proxy of forest productivity (Olofsson et al., 2008; Sulla-Menashe et al., 2018) because it is well-correlated with tree growth, according to several independent validations against tree rings (Beck and Goetz, 2011; Berner et al., 2011). Further, NDVI has some advantages with respect to other remotely-sensed products. For example, Enhanced Vegetation Index (EVI) is often more sensitive than NDVI to variations in the viewing geometry, surface albedo, and sun elevation angle across variable terrain (Matsushita et al., 2007; Sesnie et al., 2012). These factors are particularly relevant at middle-to-high latitudes (Walther et al., 2016). Similarly, even though promising, other recent products such as the Solar Induced Fluorescence (SIF) and/or the Photochemical Reflectance Index (PRI) appear to be negatively affected by atmospheric effects and random noises (Walther et al., 2016). On these bases, and similar to other recent studies (Sulla-Menashe et al., 2018; Mulder et al., 2019), NDVI was selected as the most suitable variable to perform a regional analysis of how boreal forest is affected by climate conditions.
NDVI data for the period 2000–2015 were extracted from tiles h18v02, h18v03, and h19v03 of the level 3 MOD13Q1 and MYD13Q1 provided by the Terra and Aqua satellites, respectively (NASA Land Processes Distributed Active Archive Center), at 16 day temporal resolution and 250 × 250 m spatial resolution. In these products, NDVI is retrieved from daily, atmosphere-corrected, bidirectional surface reflectance, via a MODIS-specific compositing procedure that discards low quality pixels. This product provides the maximum NDVI observed over the 16-day period, so that most of the effects of clouds and other atmospheric noises are effectively removed [see Didan (2015) for details]. Because the MODIS sensors aboard Terra and Aqua satellites are identical and, for each one, the maximum NDVI observed over the 16-day period is computed 8 days apart from one another, we combined both products so that, in practical terms, the temporal resolution of the NDVI dataset used here was 8 days.
Meteorological Data: The E-OBS Dataset
Meteorological data for the study region for the period 2000–2015 were obtained from the E-OBS dataset. E-OBS is a high-resolution gridded dataset providing daily precipitation, minimum, maximum, and mean temperatures from 1950 (Haylock et al., 2008). This dataset was generated via innovative interpolation techniques combined with an accurate pre-processing of the raw data retrieved from meteorological stations [see Haylock et al. (2008) for details]. The accuracy of E-OBS meteorological data depends on the number of meteorological stations and their spatial distribution. The station list updated to November 2016 reported more than 11,000 stations, of which over 1,900 were located in the region of interest.
This particular product was selected mainly because of its high spatial resolution (0.25° × 0.25°)—higher than most of the current available gridded dataset of climatic variables. To our knowledge, there are only two precipitation products with finer resolution (CHIRPS and GSMap-MVK with 0.05° and 0.10°, respectively), but they do not cover high latitudes. E-OBS has been previously used with satisfactory results (Kysely and Plavcova, 2010; Nikulin et al., 2011) and recently tested explicitly for Sweden (Ledesma and Futter, 2017).
Data Preparation
NDVI Data
The NDVI data were prepared for the analyses following a three-step approach. First, NDVI data were filtered based on their quality, exploiting the pixel reliability map included in each MOD13 file. This layer contains a flag describing the overall pixel quality at each time step [−1: No data; 0: Good data, 1: Marginal data (useful); 2: Snow/Ice and 3: Cloudy]. For each pixel, only NDVI values with reliability level of 0 or 1 were considered. The NDVI values with reliability 1 were further contrasted against the previous and subsequent value. Differences between the current NDVI and previous or subsequent values higher than the long-term mean NDVI in each pixel were considered as indicative of potential inconsistencies and the corresponding value discarded. Areas with sparse vegetation were masked out, by completely excluding pixels with long-term mean NDVI below 0.12, as recommended by Bjerke et al. (2014). Indeed, according to NASA providers, NDVI values between −0 and 0.12 correspond to scarce vegetation cover or bare soil.
Second, for each pixel, NDVI values were averaged over the growing season (see definition of growing season in the following sub-section). Finally, following Buermann et al. (2014), the data were aggregated to a 0.25° × 0.25° spatial grid to match the spatial resolution of the gridded meteorological data (details on the resampling approach can be found in section Spatial resampling). In this way, we obtained a proxy of annual vegetation productivity, to be analyzed for its interannual variability and linked to observed meteorological conditions. These spatial aggregation and seasonal averaging have also the advantage of decreasing the effect of low quality pixels, mostly caused by long cloudy periods.
Definition of the Climatic Variables of Interest
To capture different mechanisms, we considered six climatic variables, and their values relative to both the whole year and the growing season only (subscript A and GS, respectively). Among the basic meteorological variables, we selected the annual and seasonal precipitation totals (PPTA, PPTGS), daily average temperature (T, TGS) and daily maximum temperature (TMAX, A, TMAX.GS). Totals of reference evapotranspiration (ET0, A and ET0, GS) were used as a measure of the ecosystem water demand; they include the role of temperature and solar radiation (and hence, indirectly, day length). Further, two additional variables were considered: (1) the ET0, A /PPTA ratio (ET0, GS/PPTGS ratio) describing the potential for annual (seasonal) water imbalances; and (2) the maximum number of consecutive days without precipitation (DWPA, DWPGS), characterizing the length of dry spells. These additional indicators allow exploring the potential effects of water shortage. The ET0/PPT ratios quantify the water available in comparison to the evapotranspiration demand, thus summarizing the combined effects of precipitation, temperature and day length (i.e., warm temperatures and long days lead to high ET0). The ratio ET0/PPT allows distinguishing between water-limited and energy-limited ecosystems (Budyko, 1964). DWP was suggested by the World Meteorological Organization Expert Team of Climate Change Detection and Indices as one indicator of extremes in climate and also by the Swedish Commission on Climate and Vulnerability for similar purposes (Persson et al., 2007). DWP informs about the precipitation timing and an increase in DWP indicates that rainfall is clustering more strongly into wet and dry periods, which will affect soil moisture dynamics (Folwell et al., 2016). All the climatic variables are summarized in Table 1, along with their definitions, symbols, and units.
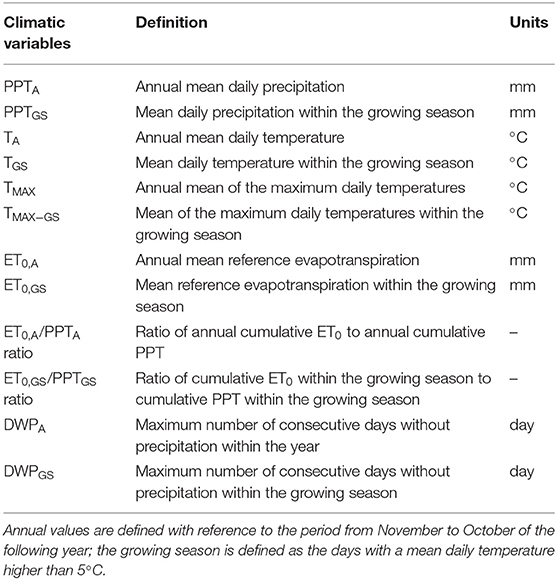
Table 1. Symbols, definitions, and units of the climatic variables considered in this research.
The climatic variables of interest were extracted from the meteorological data for every forested pixel in Northern Europe from 55 to 70° N and for each year over the period for which both NDVI and E-OBS data were available (2000–2015). Annual values (subscript A) are means or totals relative to the months from November of 1 year to October of the following year, i.e., they are relative to the period from the approximate beginning of winter dormancy to the end of the growing season during the following calendar year. Growing season values (subscript GS) refer to those observed within the thermal growing season (Ruosteenoja et al., 2016). Here, the thermal growing season was defined as the period with daily mean air temperature above 5°C for two or more consecutive days (Skaugen and Tveito, 2004; Kauppi et al., 2014; Peichl et al., 2014). The 5°C threshold is commonly employed in temperate and boreal ecosystems; it emerged also by comparing the thermal growing season with the actual onset of the growing season as inferred from satellite observations in Fennoscandia (Karlsen et al., 2007).
ET0, A and ET0, GS were determined as totals of daily reference evapotranspiration values determined according to the Hargreaves and Samani formula (Hargreaves, 1983). This approach has the advantage of requiring only the maximum, minimum and mean daily temperatures, and an estimate of the potential solar radiation.
Spatial Resampling
The spatial resolution of the E-OBS meteorological data is 0.25°, whereas the CORINE land cover data and the NDVI data have spatial resolutions of 100 and 250 m, respectively. Therefore, both the land use and the NDVI data were resampled to the 0.25° spatial resolution for consistency. In the case of the discrete land use data from CORINE, the spatial aggregation scheme could affect the prevalence of the different classes and the spatial coherence of each land use class within the aggregated product. Here, to assign the prevailing land cover class, a majority approach was adopted, as proposed by de Jong et al. (2013), among others.
Conversely, NDVI data were aggregated to 0.25° using the cubic convolution method (ArcGis 10.4.2, ESRI, Redlands, CA, USA). This method was deemed more appropriate than bilinear interpolation when using satellite data because it reduces potential noises and it does not have the disjointed appearance of the nearest neighbor interpolation (Wu et al., 2008). It is important to note that the NDVI resampling was performed on the pre-processed maps (i.e., the steps detailed in section NDVI data were carried out at the original resolution).
Once all the datasets were resampled at the same spatial resolution, the pixels classified as forest were identified based on the resampled CORINE. These pixels-−7,020 in total—were retained for the analyses detailed below.
Data Analyses: Partial Least Square (PLS) Regression and Their Rationale
NDVI and meteorological data for all pixels classified as forest were analyzed by Partial Least Square (PLS) regression. The goal was to assess the role played by each climatic driver and whether such role varied with location (and hence climatic conditions). PLS is a generalization of the Principal Components Regression (PCR) analysis (Geladi and Kowalski, 1986; Wold et al., 2001). Similar to PCR, PLS is used to analyze the relationship between a set of dependent (y-variables: in our case, NDVIGS) and independent variables (x-variables: the climatic variables reported in Table 1). It extracts from the x-variables the set of new components with the best explanatory power of the y-variable. Different from simple regression techniques, both PCR and PLS can handle collinear predictors (Gunst and Mason, 1979), thus making these techniques suitable when considering multiple, potentially partially correlated, climatic indicators. This advantage makes PLS and/or PCR appropriate for our aims, since we expect that some of the climatic variables involved (Table 2) are correlated (Zscheischler and Seneviratne, 2017). The main difference between PCR and PLS is that with PCR, the principal components are determined solely based on the data values of the x-variables, whereas with PLS the data values of both the x and y-variables influence the construction of the components. Thus, PLS is particularly useful when considering a high number of x-variables in comparison with the number of y-variables (Abdi, 2010)—as it is the case in this study. A similar approach was used by Peichl et al. (2014) to investigate the combined effect of temperature and water table level on the net CO2 exchange of a boreal fen. We apply the PLS analyses over a substantially larger area, i.e., Northern European forests within 55 and 70°N.
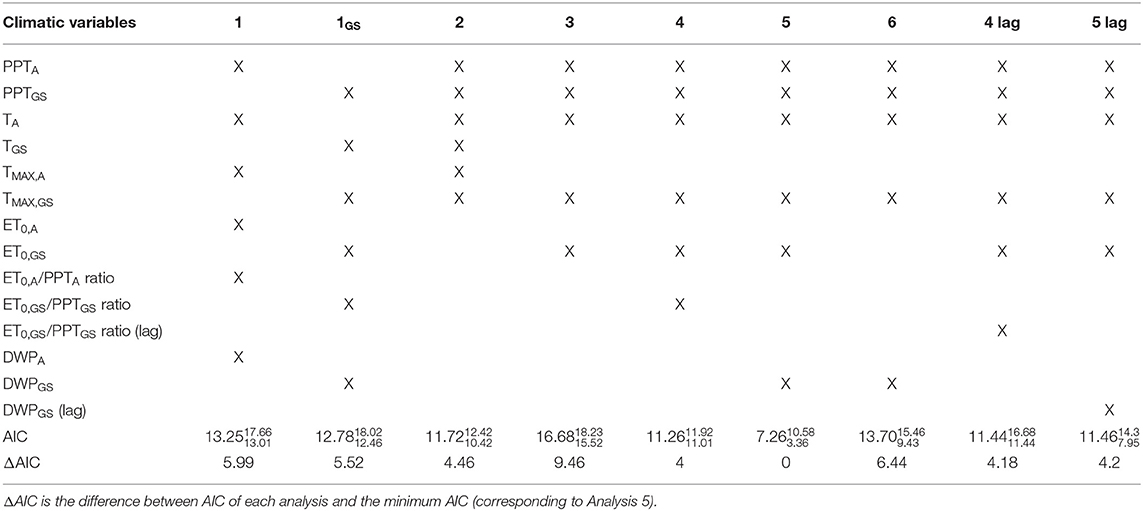
Table 2. Combinations of climatic variables considered in each PLS analysis and median, maximum, and minimum AIC score attached to each combination of climatic variables over the study site.
To better understand the role of the climatic variables, in each pixel, we performed nine different PLS analyses with different choices of climatic (explanatory) variables (Table 2). Each analysis considered five to six climatic variables, chosen as discussed next and listed in Table 2. In summary, this choice of climatic variables led to the six PLS analyses (referred to as 1–6) listed and justified below. Further analyses complemented this set, by considering the same set of climatic variables of analyses 1, 4 and 5, but by focusing just on the growing season (Analysis 1GS) or on the values of the climatic variables pertaining the previous year (Analyses 4 and 5 lag). The second-order Akaike Information Criterion (AIC) allowed the estimate of the relative quality of each statistical model. The AIC measures the relative model fit and it is proportional to the likelihood of the model and the number of parameters used to generate it (Burnham et al., 2011). A set of climatic variables with high explanatory power and low AIC value are suggestive of those variables being adequate to explain the changes in NDVI.
The explanatory variables were chosen as follows. The first two PLS analyses aimed at quantifying the explanatory power of the climatic variables when considering only their annual means [Analysis 1, as e.g., in Ichii et al. (2002) and Yuan et al. (2009)] or within growing season means (Analysis 1GS, as e.g., in Zhao et al., 2018).
Analysis 2 involved only the basic meteorological variables: PPT, T and TMAX for the whole year and within the growing season. As such, Analysis 2 represents the baseline for comparison to other choices of the explanatory variables. Comparison of the results of Analysis 2 and those of Analyses 1 and 1GS shows whether annual and seasonal variables need to be combined to explain the observed patterns of NDVI.
Four additional sets of explanatory variables were considered, based on the following rationale. Since the maximum temperature is likely to occur during the growing season, we only considered TMAX within the growing season (TMAX, GS), while keeping annual T (TA), while keeping annual T, including thus both climatic variables but computed over different periods. Further, ET0 and both the water stress indicators (ET0/PPT ratio and DWP) likely have a higher explanatory power of forest productivity when computed within the growing season rather than over the whole year. Hence, the basic climatic variables were complemented by ET0, GS in Analysis 3, ET0, GS/PPTGS ratio in Analysis 4, and DWPGS in Analysis 5. Analysis 6 included a water stress index but it did not consider ET0, GS. When compared to the results of Analysis 5, Analysis 6 allowed assessing the relative importance of including a water stress indicator in lieu of ET0, GS.
All the analyses mentioned above were based on the climatic and vegetation data of the same year in which the NDVI was observed, as in Buermann et al. (2014). Indeed, no apparent lag effect longer than 1–2 months, i.e., no lag effect beyond the current year, emerged in previous analyses of NDVI data at higher northern latitudes (Wu et al., 2015). However, other studies showed that climatic conditions during the previous growing season can affect vegetation activities and NDVI in some locations over the northern high latitude region (<20% of Northern Europe) (Tei and Sugimoto, 2018). Moreover, a 1 year-long lag effect of droughts (or periods with low water availability) emerged in some regions located in northern latitudes (Vicente-Serrano et al., 2013). To explore the possibility of a lag effect of water scarcity, two additional PLS analyses were performed, with the same configuration as Analyses 4 and 5, but considering ET0, GS/PPTGS ratio and DWPGS relative to the previous growing season (Analyses 4 and 5 lag).
Moreover, the non-parametric Kruskal-Wallis test (Kruskal, 1952) was used to test whether the median cumulated explanatory power of the PLS were significantly (at 5%) different among the nine analyses performed. When the Kruskal-Wallis test indicated that there were significant differences among the medians, multiple pairwise comparisons based on the Dunn's test (Dunn, 1964) allowed identifying which specific groups of analyses led to significantly different results from the others.
Finally, we computed the correlation coefficient between NDVIGS and each climatic variable (Table 2) in each pixel and we extracted the 90th and 10th percentile of those values. Aiming to focus on those locations where the response of NDVIGS to the climatic variables was the strongest, the pixels with the highest correlation (i.e., above the 90th percentile) and the lowest correlation (i.e., below the 10th percentile) were singled out. Then, the median and variability of the mean annual temperature and total precipitation for each group were compared. To ensure that values higher/lower than these extremes corresponded to highly positive/negative correlations between the variables and NDVIGS, we tested that both percentiles were significantly (at 5%) different from zero.
Results
Climatic Conditions
The long-term average annual temperature for the period 1960–2013 was 4.8°C in Sweden, 1oC in Norway, and 2°C in Finland. Among the 15 study years (2000–2015), all years except 2010 were warmer than these long-term averages (Table 3). As expected, the average annual temperature decreased with latitude.
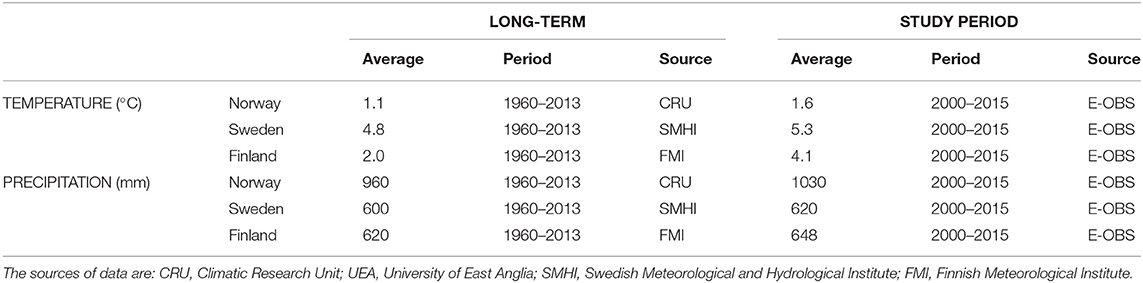
Table 3. Long-term and study-period annual average temperature, precipitation, and length of the growing season.
The length of the growing season decreased with latitude along with temperature. In the northernmost regions, the average growing season length over the period 1960–2013 was <170 days in all years, while it was around 210 days in southern Sweden. A substantial increase of the duration of the growing season has been observed from 1960 to 2014 in Sweden as a consequence of warming (Kauppi et al., 2014).
Regarding precipitation, the long-term average annual total for the period 1960–2013 was 960 mm in Norway, 600 mm in Sweden, and 620 mm in Finland. All the years within the study period had annual average precipitation similar to the long-term precipitation averages (Table 3).
In summary, over the period 2000–2015, the study region experienced warmer temperatures and longer growing seasons without significant changes in precipitation, when compared to the long-term averages (Table 3). This combination can lead to more frequent temperature-induced water stress.
Abiotic Controls on NDVIGS: PLS Analysis
A PLS analysis was performed for each set of explanatory variables (Table 2) and pixel. For our purposes, the key outputs of the PLS analyses are (1) the variance explained by each component; and (2) the correlation coefficients, the sign of which allows distinguishing negative and positive correlations between the climatic conditions and the NDVIGS (x and y-variables, respectively). Due to the large area analyzed, the results of the PLS analyses can differ from pixel to pixel. The results are presented mostly in an aggregated form, i.e., as distributions of values across pixels, to facilitate the comparison among locations and the different combinations of explanatory variables.
Variance Explained by the Components
Figure 2 summarizes the distribution of the cumulated explanatory power for the component 1 to 5, and its variability across pixels, for the components 1–5. The bottom panel reports the total explanatory power for each set of predictor variables.
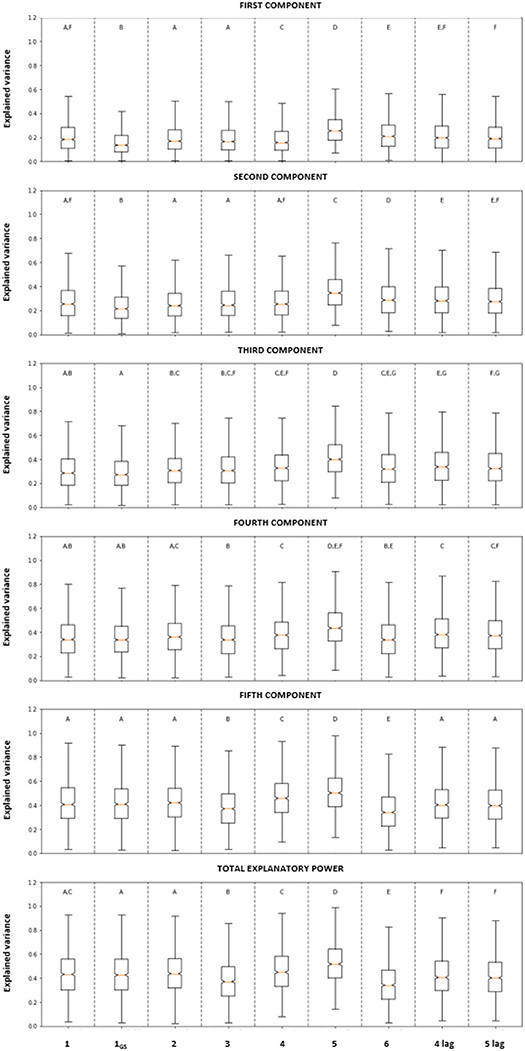
Figure 2. Fraction of cumulated variance of NDVIGS explained by the components 1 to 5 (rows 1–5) and total explanatory power (bottom panel) of the combination of the climatic variables considered in each PLS analysis (details in Table 2). For the analyses involving just 5 climatic variables, the content of the last two panels is the same. The boxes extend from the first and the third quartile, the end of the whiskers are computed as 1.5*IQR (Interquantile Range). The median values are indicated by the orange line. The notches extend over the 95% confidence intervals of the median, as determined by bootstrapping. Bars with the same letter are not significantly different at p = 5% (as determined by the Kruskal-Wallis and Dunn tests).
Analyses 1 and 1GS had a low median explanatory power (Figure 2; median total explanatory power of 43.7 and 42.5%, respectively), despite the inclusion of all the climatic variables for the whole year and the growing season, respectively. The variables included in Analysis 1 (i.e., variations within the whole year) provided a small but significantly (at 5%) higher explanatory power in the first two components than Analysis 1GS (top two plots) but there was no difference between these two analyses when considering their total explanatory power (bottom plot).
Analysis 2 combined the basic meteorological variables for both the whole year and the growing season (TA, TMAX, A and PPTA and TGS, TMAX, GS and PPTGS, Table 2). The median explanatory power of the first three components was 27.2%, while the median total explanatory power was 42.5%. There was no significant difference in the total explanatory power between Analysis 2 and those considering the annual and growing season variables in isolation (Analyses 1 and 1GS).
Analysis 3 was designed to quantify the importance of ET0, GS (and hence, indirectly day-length and potential solar radiation) to explain the observed patterns in NDVIGS. Thus, it considered the basic meteorological variables plus ET0, GS (Table 2) but neglected TMAX, GS and TGS. The median explanatory power of the three first components was not significantly different from those of the previously discussed choices of explanatory variables (Figure 2, three first panels).
Analyses 4 and 5 were designed to better understand the effects of water availability on the observed NDVI. By including either the ET0, GS/PPTGS ratio or the days without precipitation (DWPGS), the total explained variance of NDVIGS significantly (at 5%) increased with respect to the analyses not considering any proxy of water availability. Between the two water availability proxies, the explanatory power was significantly (at 5%) higher when considering DWPGS (Analysis 5) than that including ET0, GS/PPTGS ratio (Analysis 4).
Analyses 3 and 6, which involved the same number of explanatory variables (5 in total), presented similar results regarding the first three components with a median explanatory power of 30.5 and 31.8%, respectively (Figure 2). However, the total explanatory power of Analysis 3 was significantly (at 5%) higher than Analysis 6 (Figure 2), pointing to the importance of including ET0, GS as predictor of the NDVIGS.
Finally, Analyses 4-lag and 5-lag were designed to evaluate the potential lag effect of the climatic conditions on plant productivity. In both cases, considering the climatic variables during the same growing season in which NDVIGS was measured (i.e., Analyses 4 and 5) resulted in a significantly (at 5%) higher explanatory power than those based on lagged climatic variables.
In summary, despite having the same number of climatic variables as Analysis 1, 1GS, 2, and 4, Analysis 5 (which included PPTA, PPTGS, TA, TMAX, GS, ET0, GS, and DWPGS) had a significantly higher explanatory power than any other choice of climatic variables investigated here, both in each component and in total. Analysis 5 emerged as the best fitting model also based on the AIC (Table 2). It should be noted that, in practical terms, models with AIC differing from the minimum AIC (corresponding to the best fitting model) of <2 all have plausible support, i.e., no differences between models (Burnham and Anderson, 2002). The differences obtained in our analyses were higher than that threshold in all cases, showing that there were significant differences between the models and Analysis 5 had the highest performance (Table 2).
Correlation Coefficients
Focusing on the set of climatic variables with the highest explanatory power (Analysis 5), we considered the sign of the correlation coefficients between the climatic (x-)variables and NDVIGS (y-variable), and whether positive or negative correlations were co-occurring with specific mean annual temperature and precipitation total. Positive correlations imply that higher values of the climatic variable result in higher values of NDVIGS; and, vice versa, negative correlations imply that higher values of the variable results in lower NDVIGS.
To focus on the locations where the response of NDVIGS to the climatic conditions was strongest, the pixels with the highest (above the 90th percentile) and lowest (below the 10th percentile) correlation coefficients between NDVIGS and each climatic variable were singled out. All the correlation coefficients above the 90th percentile were positive, while all the ones below the 10th percentile were negative. The values of these percentiles for each climatic variable are reported in Table 4. Both percentiles for all climatic variables are significantly (at 5%) different from zero, indicating that values higher/lower than these extremes correspond to high correlations between the variables and NDVIGS. Figure 3 summarizes the median and variability of mean annual temperature (top panel) and precipitation (bottom panel) of the pixels with the highest (green) and lowest (brown) correlation coefficients between NDVIGS and each climatic variable.
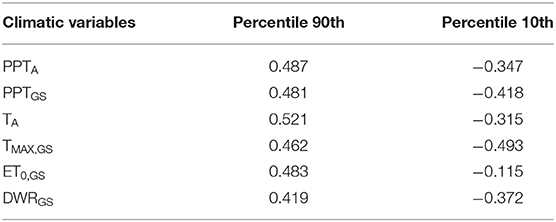
Table 4. Values of the percentile 90th and 10th of the correlation coefficient between NDVIGS and each climatic variable included in Analysis 5.
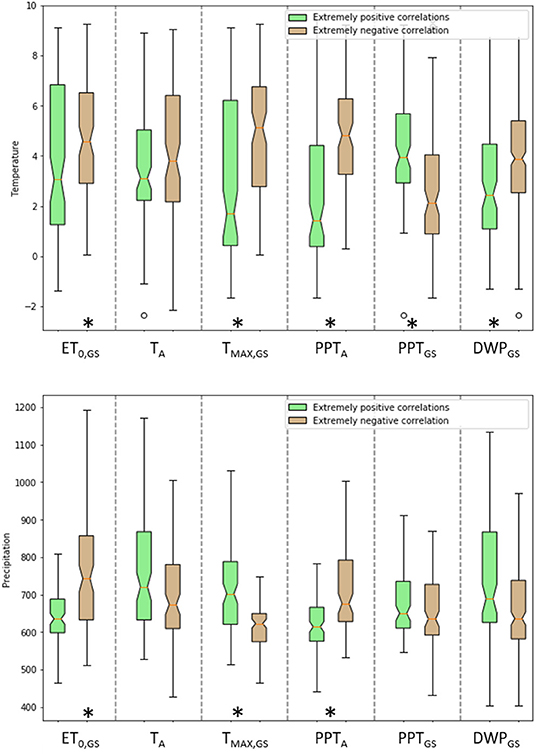
Figure 3. Box plot of annual mean temperature (TA–top panel) and annual mean PPT (PPTA–bottom panel) of cells with correlations between each climatic variable and NDVIGS below 10th percentile (negative correlations, in brown) and above 90th percentile (positive correlations, in green). The orange line represents the median, the ends of the whiskers are computed as 1.5* IQR and the bottom and the top of the boxes correspond to the first and third quartile, respectively. The notches extend over the 95% confidence intervals of the median, as determined by bootstrapping. Stars at the bottom of each pair of bars denotes significant (at 5%) differences in the median values of mean TA (top) or mean PPTA (bottom) between pixels when the correlations with the corresponding climatic variable are extremely positive and extremely negative.
The highest (and positive) and lowest (and negative) correlation coefficients were found in a wide range of thermal regimes (Figure 3, top panel). However, focusing on the medians, pixels with extremely negative correlation coefficients between NDVIGS and any of the climatic variables (except PPTGS and TA) were located in significantly (at 5%) warmer regions (Figure 3 top panel and Figure 4). The same pattern holds also for TA, but the difference between the median correlation coefficients is not significant at 5%. This general pattern is suggestive that higher ET0, GS, TA, TMAX, GS, PPTA, and DWPGS result in lower values of NDVIGS in warmer places. Regarding mean annual PPT (Figure 3, bottom panel), median correlations between TMAX, GS and NDVIGS where significantly (at 5%) higher in wetter than drier pixels. Also extremely positive correlations between TA and DWPGS with NDVIGS were more common in wetter pixels. Hence, higher temperatures and higher number of days without precipitation appear more beneficial when precipitation totals are higher. Conversely, extremely positive correlations between NDVIGS and PPTA and ET0, GS occurs significantly (at 5%) more in pixels with lower mean PPTA.
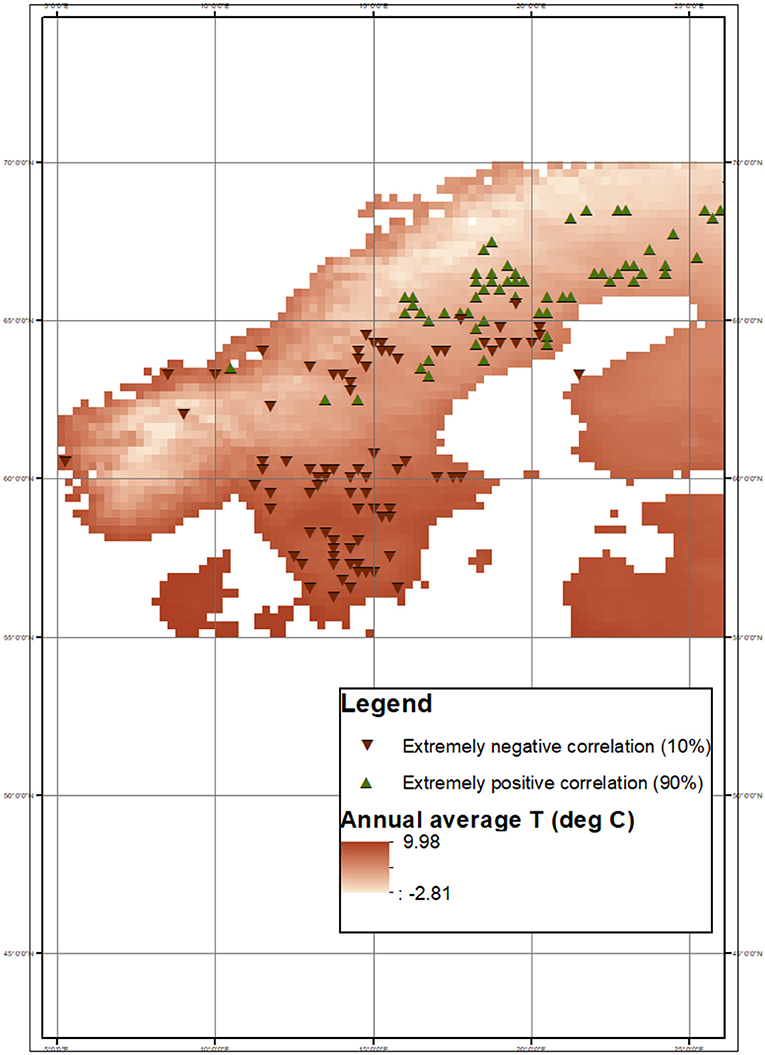
Figure 4. Pixels where extremely positive (90th percentile) and negative (10th percentile) correlation between NDVIGS and TMAX−GS occur. The annual average TA map was obtained from E-OBS gridded dataset.
Discussion
Drivers of Boreal Forest Productivity in Northern Europe: the Key Role of Water Availability
A set of PLS analyses was performed to identify the main drivers of boreal forest productivity. While statistical analyses such as the one presented here cannot reveal the mechanistic cause of the observed patterns, the comparison of different choices of explanatory variables allows identifying the key drivers and is suggestive of the mechanisms at play. Our pairwise comparison of the seven analyses without time lags highlighted that considering proxies of water availability markedly increases the explanatory power of the climatic variables. Indeed, even though Analyses 1, 1GS, 2, 4, and 5 included the same number of climatic variables (Table 2), the total explanatory power of Analysis 5 was significantly higher than that of the other analyses (Figure 2). Analysis 5 is also ranked as the best model based on AIC, followed by Analysis 4 (Table 2). Altogether, these findings support our first hypothesis, suggesting that water availability can limit plant productivity also across boreal forests in Northern Europe—an ecosystem so far considered as light- and temperature-limited, but not water-limited (Allen et al., 2010).
It has long been recognized that water availability can affect plant photosynthetic capacity, growth, and physiological stress responses (Hsiao, 1973). Nevertheless, so far the response of boreal forests to reduced soil water availability has been seldom considered (Solberg, 2004; Grossiord et al., 2014). A decrease in aboveground growth rates as a consequence of water limitation and a clear interaction between biodiversity and water availability emerged in a boreal forest stand located in Finland (Grossiord et al., 2014). In southeastern Norway, dry and warm summers led to defoliation, yellowing, scarce cone formation and high mortality in Norway spruce (Solberg, 2004; Andreassen et al., 2006). However, these results are based on specific sites and conditions, while our analyses show that the sensitivity of boreal forest to water limitations is common in most of Northern Europe.
Finally, the potential lag effect of water scarcity on forest productivity was explored by Analysis 4-lag and 5-lag. Regional dendroclimatological studies have shown that tree growth is better correlated to the conditions during the previous growing season than those of the current one (Carrer et al., 2010; Babst et al., 2012). Nevertheless, while lag effects in tree-rings and autocorrelation in ring width measurements are well-established (Berner et al., 2011), lag effects in NDVI measurements have not been widely examined. Further, a high correlation between tree rings and NDVI does not imply that tree rings adjust immediately to changes in NDVI (Kaufmann et al., 2008). As such, even though a lagged effect of growing conditions on tree ring formation has been observed, a similar delay might not emerge when considering NDVI (Wu et al., 2015; Tei and Sugimoto, 2018). Indeed, our results show that current year conditions have a higher explanatory power than those of the previous year, suggesting that NDVIGS mostly responds to current conditions. This result is consistent with previous analyses showing that conditions of the previous year are dominant in <20% of high latitude study sites in Europe (Wu et al., 2015; Tei and Sugimoto, 2018).
Effects of Temperature on Boreal Forest Productivity: From Positive to Negative
To disentangle the role of different climatic variables on NDVIGS, we considered the combination of climatic variables with the highest explanatory power (Analysis 5) and explored the sign and level of correlation between the different climatic variables and NDVIGS across locations and climatic conditions. Special attention was devoted to temperature in an attempt to unravel the potentially opposite effects of the predicted increase in temperatures on boreal forest productivity. On the one hand, warmer temperatures reduce the constraints on productivity imposed by low temperature and growing season length typical of higher latitudes; on the other hand, warmer temperatures can lead to more frequent and severe heat stress but also to water stress, even if not associated to reductions in precipitation (Ruiz-Pérez et al., 2019). Temperature was included in Analysis 5, directly through TA and TMAX, GS, indirectly through ET0, GS. Temperature plays a key role on boreal forest productivity regardless of latitude—a conclusion consistent with previous results on boreal ecosystems and their dependency on temperatures (e.g., Bonan and Shugart, 1989). Nevertheless, our results show that the correlations between TA (and TMAX, GS) and NDVIGS were far from uniformly positive across the study region (Figure 4). In other words, the expectation that an increase in temperatures is beneficial for boreal forests does not always hold.
Patterns emerged when comparing the climatic conditions under which the extremely negative (below the 10th percentile) and the extremely positive (above the 90th percentile) correlations occurred (Figures 3, 4). Regardless of the temperature-related climatic variable considered, extremely positive correlations occurred mostly in locations with lower annual mean temperature. A similar divergence between increased temperatures and tree-ring formation was observed in the southernmost regions of Scandinavia [Babst et al. (2012) and Trahan and Schubert (2016)]. Nevertheless, being based on satellite data and standard meteorological data, our approach permits analyses at regional scale, thus facilitating the identification of regions that are potentially more sensitive to specific climatic conditions.
Geographically, the effects of warming temperatures on forest productivity depend on the mean annual temperature (as apparent in Figure 3, top panel) and hence substantially on latitude. The majority of pixels with extremely positive correlation between temperature-related climatic variables and NDVIGS are located in northern/colder regions. Conversely, the pixels with extremely negative correlation are mostly located at lower latitudes. An example of this geographical distribution is reported in Figure 4, which refers to the case of the correlation between TMAX, GS and NDVIGS. 65°N emerges as the latitudinal threshold at which the correlation between TMAX, GS and NDVIGS shifts from extremely positive at higher latitudes to extremely negative at lower ones. Only one pixel with extremely negative correlation is located north of 65°N, while 65.9% of those with extremely positive correlation are. This latitudinal threshold is consistent with the one emerging from analyses based on the European Tree Ring Width (TRW) network, suggesting that Northern Europe can be divided into two regions according to similarities in the annual growth variability (Babst et al., 2012). A similar threshold emerges also outside Northern Europe. In Eurasia, the correlation between summer temperatures and tree ring increments increases linearly with latitude from negative to positive values, with positive correlations at latitudes above 65°N, and negative elsewhere (Hellmann et al., 2016). Across the whole circumboreal region such emerging latitudinal threshold was 67°N (Tei and Sugimoto, 2018). Due to the clear link between temperature and latitude in these regions, the latitudinal threshold is most likely to be interpreted as a threshold in terms of temperature. In other words, at latitudes below 65°N, the air temperature might have already exceeded a limit above which boreal forests do not benefit from increases in air temperature. As apparent from Figure 4, this temperature threshold ranges from 14.5 to 17.8°C (average maximum air temperature within the growing season). Future warmer temperatures could shift this geographic boundary farther north.
Hence, these results confirm the hypothesis that the effects of warmer temperature of forest productivity are not uniformly positive over Northern Europe. Rather, an increase in temperature is currently beneficial (as indicated by a positive correlation) mainly in the coldest (i.e., northernmost) regions, while negative correlations were observed in warmer regions (i.e., southernmost regions). Further, the emerging patterns are suggestive of a threshold-like pattern in the correlation between temperature and forest productivity. However, some exceptions emerged, i.e., some pixels with extremely positive correlations were located in southern regions and vice versa. These exceptions might be driven by local features such as soil properties or wind patterns. In particular, deeper soils and higher water retention capacity can reduce the effects of low precipitation amount in general and dry spells in particular, buffering dry, and warm periods.
Interplay Between Temperature and Water Availability
In most circumstances, plants are able to cope well with high temperatures for short periods as long as they have access to sufficient water resources. Under well-watered conditions, plants can maintain their stomata fully open, ensuring not only a high net CO2 uptake, but also leaf evaporative cooling. Conversely, low soil water availability reduces not only stomatal aperture, CO2 uptake via photosynthesis and thus potentially plant growth (Hsiao, 1973), but also evaporative cooling, so that water limitations can exacerbate the negative effects of warm temperatures. If air temperature and solar radiation are high, then leaf temperature can become such that net CO2 assimilation rate is reduced (Yamori et al., 2014) and permanent damage could occur (O'Sullivan et al., 2017).
This role of the water availability on the response of tree growth to warmer temperatures has already been observed also in boreal regions. Indeed, one key consequence of global warming in boreal North America has been regional drought stress leading to reduced tree growth (Verbyla, 2015) and even enhanced tree mortality [(e.g., Williams et al. (2013)]. In Norway, tree-ring formation of Norway spruce was shown to respond negatively to warm summers in dry locations, while the response was positive in moist regions Solberg, 2004; Andreassen et al., 2006. Our results point to a similar pattern, but over a larger region and species set: most of the pixels with extremely negative correlations between NDVIGS and TA and TMAX, GS are located in places with lower annual mean precipitation (Figure 3, bottom panel). These findings support our initial hypothesis, suggesting that the correlation between temperature and forest productivity varies not only according to a thermal gradient but also according to a moisture one, being positive in cold and moist regions and negative in warm and dry ones.
The analysis of the correlation coefficients between NDVIGS and DWPGS also shows the influence of water availability on boreal forest productivity. Extremely negative correlations between NDVIGS and DWPGS coefficients were more common in drier and warmer conditions, while extremely positive correlation coefficients occurred mostly in well-watered and cooler pixels (Figure 3). These results suggest that the effect of temperature is mediated by water availability and its timing. Hence, a (direct or indirect) role of water stress is to be expected not only in dry regions (Anderegg et al., 2013), but also in the relatively mesic Northern European boreal forests. Furthermore, most of the extremely negative correlations between TMAX, GS and NDVIGS are located over southern Sweden.
Geographically, similarly to temperature-related climatic variables, most pixels with extremely positive correlation between DWPGS and NDVIGS are located in northern/colder regions, whereas the pixels with extremely negative correlation are at lower latitudes (Figure 5). Moreover, even though less evident, this dichotomy between north and south was also observed when comparing “less extreme” correlation coefficients (corresponding to the 80th−20th and 70th−30th percentiles) as shown in the Supplementary Material.
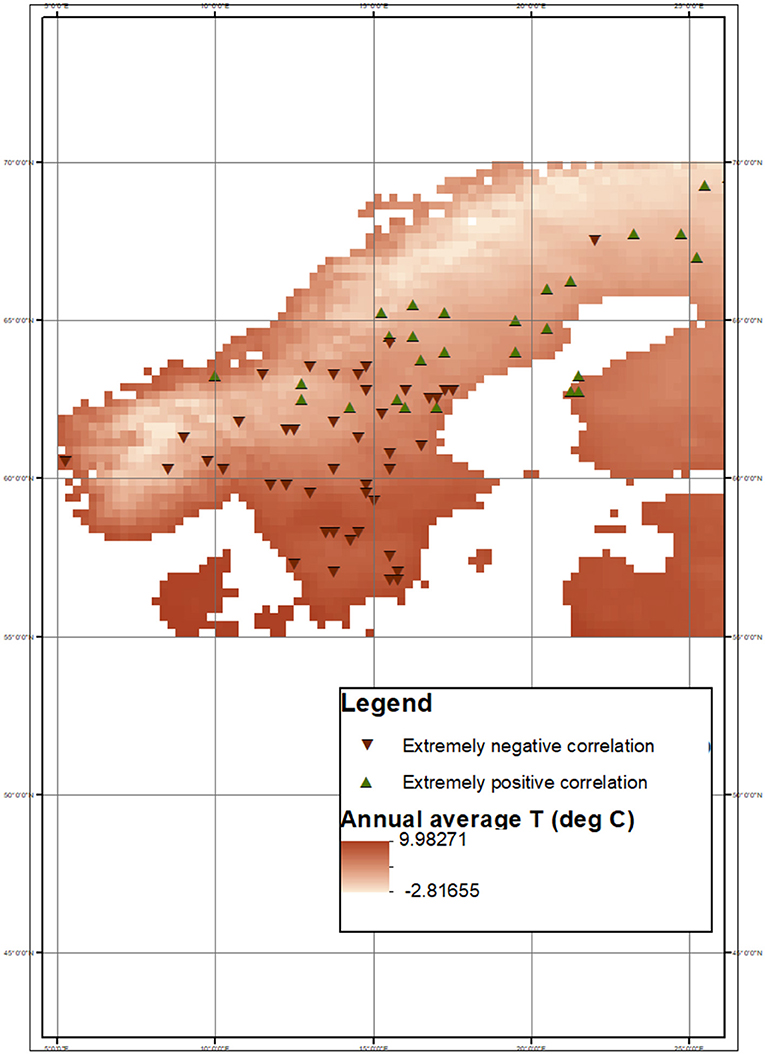
Figure 5. Pixels where extremely positive (90th percentile) and negative (10th percentile) correlation between NDVIGS and DWPGS occur. The annual average TA map was obtained from E-OBS gridded dataset.
Importance of Precipitation Timing
As shown by the Kruskall-Wallis and Dunne's tests, significant differences in the explanatory power emerged between the two proxies of water stress explored here (the ET0, GS/PPTGS ratio and DWPGS). The inclusion of DWPGS (i.e., Analysis 5) led to the highest total explanatory power (Figure 2). PPT and ET0 are the key drivers of the water balance. Their ratio, ET0/PPT, represents the water available for evapotranspiration and allows distinguishing between water-limited and energy-limited ecosystems (Budyko, 1964). This ratio is based on the precipitation and transpiration totals over the growing season or whole year. Cumulative values can mask fluctuations, so that wet periods can compensate dry periods. Conversely, the maximum number of consecutive days without precipitation, DWP, does not depend on the total amount of the precipitation but on its timing. The higher explanatory power of DWPGS supports our hypothesis that changes in the distribution in time of the precipitation have a larger effect on the inter-annual variability of NDVIGS than variations in precipitation totals. Indeed, several previous studies showed that DWP is well-correlated with ecosystem functions in different pedoclimatic conditions. For example, the radial growth of six deciduous species in southern Appalachia (Eastern USA) were more sensitive to the number of storms and the number of dry days than to the total precipitation (Elliott et al., 2015). Moreover, in the Northern Hemisphere forests, DWP correlates well with the C turnover rate—a measure of the net effect of several ecosystem processes, including background mortality, mortality by disturbances, and forest management (Thurner et al., 2016). These results have potential implications under future climates. Predictions of no change or even increase in the annual mean precipitation do not imply that Northern European forest productivity will not be affected by such changes, as the timing of precipitation will be critical.
DWP highlights periods when soil water availability could become low, as a result of an extended lack of precipitation. While the actual water stress level during a dry spell also depends on the soil water availability at the beginning of the dry period and the evapotranspiration rate during the period, periods without precipitation are often associated with high solar irradiance and potentially high temperature and low air humidity, i.e., conditions that enhance losses via evapotranspiration. It follows that even relatively short precipitation-free periods can lead to marked water losses (Folwell et al., 2016). A simple model representing the land surface energy and water balance applied over Europe showed that evapotranspiration rates decline (i.e., the surface shifts to a water-limited regime) after only four consecutive days without precipitation, given initial soil moisture conditions ~ 20% above the minimum soil water conditions that do not limit transpiration rates (i.e., well-watered conditions) (Folwell et al., 2016). This estimated length of the period before the decline in evapotranspiration rates study is shorter or comparable to the DWPGS observed over Northern Europe during our study period (12 days average length; range 5–20 days). Hence, even though the effects of a period without precipitation depend on the actual properties of the system and the atmospheric conditions, the DWPGS occurring in Northern Europe are already long enough to be associated with reduced evapotranspiration rates, suggesting the occurrence of water stressed conditions. Thus, the explanatory power of DWP emerging from our analyses is suggestive of an effect of water stress in Northern European boreal forests—an ecosystem generally considered light- or energy-limited.
The analysis of the correlation coefficients of the combination of climatic variables with the highest explanatory power (Analysis 5) allows assessing the effects on NDVIGS of precipitation and its timing in further detail. As apparent in Figure 3, higher PPTA and PPTGS (i.e., annual and seasonal daily mean precipitation, respectively) have opposite effects on NDVIGS. In other words, the response of the Northern European forests to variations in precipitation totals depends on whether precipitation increases within the growing season or during the rest of the year. Extremely positive correlations between NDVIGS and PPTGS are apparent in warmer locations. There, higher temperatures enhance soil water depletion via evapotranspiration, so that higher precipitation amounts might be key to maintain well-watered conditions. In colder places, where the evaporative atmospheric demand is lower, the correlation between NDVIGS and PPTGS was negative. This is likely the result of reduced solar radiation with increasing precipitation, which could exceed the benefits of increasing water availability (Churkina and Running, 1998; Mulder et al., 2019). Conversely, extremely positive correlations between NDVIGS and PPTA were found in colder and drier locations, while they were negative in warmer and wetter ones. Unlike precipitation within the growing season, precipitation outside the growing season can occur as snow in Northern Europe. Winter snow accumulation affects forest productivity in different and potentially opposite ways. On the one hand, reduced winter snow accumulation is generally related to earlier complete snowmelt, in turn leading to earlier leaf onset (Korner, 2003; Inouye, 2008; Ernakovich et al., 2014). As such, reduced snow accumulation could be beneficial for forest productivity by extending the growing season (Piao et al., 2017). On the other hand, larger snow accumulation can have positive effects on soil water availability during a large part of the growing season. Moreover, an earlier onset of the spring could also lead to drier soils later in the growing season, unless the larger water losses due to extended periods with non-negligible evapotranspiration are compensated by larger precipitation amounts (Buermann et al., 2013). Which of these opposite effects of snow is dominant depends on the location and climate. A multivariate analyses based on remotely-sensed snow water equivalent and NDVI showed that in Northern Europe snow accumulation primarily affects the date of leaf onset rather than soil water availability during the growing season (Wang et al., 2018). Nevertheless, in the northernmost regions, spring leaf onset did not prove to be well-synchronized with snowmelt date, due to other environmental constraints preventing trees from taking full advantage of earlier snowmelt (e.g., insufficient heat accumulation after snowmelt and light limitation) (Basler and Körner, 2012; Zohner and Renner, 2015). Therefore, in this region, reduced snow accumulation was not related to earlier spring onset, while it still affected soil water availability. This might explain why in our analyses extremely positive correlation between PPTA and NDVIGS emerged in cold and dry places. Conversely, in the southernmost regions, earlier snowmelt allows earlier spring onset, longer growing seasons and potentially higher average NDVIGS, when the growing season precipitation ensures well-watered conditions, leading to extremely negative correlations between PPTA and NDVIGS in warm and wet locations.
Conclusions
Understanding the links between climatic variables and boreal forest productivity is considered one of the grand challenges for global change scientists (Williams et al., 2011). This is a stepping stone for robust projections of the response of boreal forests to shifts in climatic conditions, their role in the global C balance, and their ability to provide a number of ecosystem and socioeconomic services. Yet, systematic large-scale studies that explore the linkages between vegetation dynamics and climatic variability in the boreal region are still limited (Buermann et al., 2014) and have provided contradictory results for Northern Europe (Babst et al., 2012; Bjerke et al., 2014; Gauthier et al., 2015). It is thus still unknown whether the negative effects of global warming on forest productivity will exceed the positive ones and whether such effects are uniformly distributed in this region. To address this knowledge gap, we used high-resolution gridded meteorological data and satellite NDVI data—a proxy of forest productivity—to explore how boreal forests in Northern Europe respond to variation in climatic drivers.
Our results are suggestive of the main drivers of boreal forest productivity and they provide essential and innovative information about the general response of the Northern European forest. Indeed, while only few studies have focused on the response of boreal forests to water availability, our results show that soil water availability does play a key role in boreal forest productivity, even in a relatively mesic region as Northern Europe. Further exploration of the correlation coefficients between NDVIGS and several climatic variables highlighted that boreal forests may indeed be negatively affected by water stress, in particular in southern and warmer regions. Further, the correlation between forest productivity and temperature is not uniformly positive over the region, rather it varies according to a thermal and moisture gradient. Indeed, warmer temperatures appears beneficial mainly in the northernmost (cooler) and wetter locations, whereas their effects appear negative in the southern (warmer) and drier ones. These different responses can partially explain the conflicting findings reported so far regarding the effects of increasing temperatures. Moreover, the timing of precipitation has a higher explanatory power for boreal forest productivity than precipitation totals, because of its role on the occurrence of water stress. These results and their interpretation are suggestive of likely mechanisms driving the interplay between climatic conditions and forest productivity in Northern Europe. We acknowledge that statistical analyses as the one performed here do not inform about the actual processes and depend on the temporal and spatial resolution of both meteorological and forest productivity data. As such, further testing via specific experiments is needed.
Our results have implications in the face of climate change and management for climate adaptation. Boreal regions are predicted to shift from short, cool summers to longer, warmer summers (Jylha et al., 2010). Even under unaltered precipitation patterns, warmer and longer summers can result in more frequent occurrence of periods with low water availability, potentially transitioning Northern Europe forests from “greening” to “browning,” as already observed in North America. Regarding climate adaptation, our large scale analysis supports the identifications of regions where the projected future conditions will most likely have negative rather than positive effects, thus allowing the prioritization of management actions. Furthermore, unequivocal scientific evidence of the already occurring effects of climatic conditions on boreal forests can facilitate management decisions toward better adapted ecosystems, now currently mostly based on subjective factors (Vulturius et al., 2018).
This large scale analysis shows that the expected benefits of rising temperatures are reduced or even reversed by water shortage and that there are regions or hot spots over Northern Europe particularly vulnerable to the projected changes in climatic conditions. Synergetic efforts via in-situ experiments and the implementation of physically-based models should thus focus on those likely most vulnerable regions, in order to understand the actual mechanisms, make predictions under a changing climate, and potentially even identify suitable management approaches to reduce the vulnerability.
Data Availability Statement
The datasets generated for this study are available on request to the corresponding author.
Author Contributions
GR-P and GV have contributed equally to the conception and design of the work and the interpretation of the data. GR-P acquired and performed the data analysis and led the drafting of the manuscript. GV revised it critically and guided all the analysis process and design.
Funding
This research was supported by Trees and Crops for the Future (TC4F)—a co-operative project between established research environments at the Swedish University of Agriculture (SLU), Umeå University and Skogforsk. Partial support was also received by the Swedish Research Council for Sustainable Development (FORMAS), through grants 2018-01820 and 2018-00968, and the European Commission and Swedish Research Council for Sustainable Development (FORMAS), in the frame of the collaborative international consortium WaterWorks 2017 ERA-NET Joint Programming Initiative Water challenges for a changing world, under cofound grant 2018-02787 (iAqueduct).
Conflict of Interest
The authors declare that the research was conducted in the absence of any commercial or financial relationships that could be construed as a potential conflict of interest.
Acknowledgments
We acknowledge the E-OBS dataset from the EU-FP6 project ENSEMBLES (http://ensembles-eu.metoffice.com) and the data providers in the ECA&D project (http://www.ecad.eu). The MODIS data were obtained through the online Data Pool at the NASA Land Processes Distributed Active Archive Center (LP DAAC), USGS/Earth Resources Observation and Science (EROS) Center, Sioux Falls, South Dakota (https://lpdaac.usgs.gov/get_data). All the data used in this work are freely available from the above-mentioned sources.
Supplementary Material
The Supplementary Material for this article can be found online at: https://www.frontiersin.org/articles/10.3389/ffgc.2020.00034/full#supplementary-material
References
Abdi, H. (2010). Partial least squares regression and projection on latent structure regression (PLS Regression). Wiley Interdiscip. Rev. Comput. Stat. 2, 97–106. doi: 10.1002/wics.51
Allen, C. D., Breshears, D. D., and McDowell, N. G. (2015). On underestimation of global vulnerability to tree mortality and forest die-off from hotter drought in the Anthropocene. Ecosphere 6, 1–55. doi: 10.1890/ES15-00203.1
Allen, C. D., Macalady, A. K., Chenchouni, H., Bachelet, D., McDowell, N., Vennetier, M., et al. (2010). A global overview of drought and heat-induced tree mortality reveals emerging climate change risks for forests. For. Ecol. Manage. 259, 660–684. doi: 10.1016/j.foreco.2009.09.001
Anderegg, W. R. L., Kane, J. M., and Anderegg, L. D. L. (2013). Consequences of widespread tree Mortality triggered by drought and temperature stress. Nat. Clim. Chang. 3, 30–36. doi: 10.1038/nclimate1635
Andreassen, K., Solberg, S., Tveito, O. E., and Lystad, S. L. (2006). Regional differences in climatic responses of Norway spruce (Picea abies L. Karst) growth in Norway. For. Ecol. Manage. 222, 211–221. doi: 10.1016/j.foreco.2005.10.029
Babst, F., Carrer, M., Poulter, B., Urbinati, C., Neuwirth, B., and Frank, D. (2012). 500 years of regional forest growth variability and links to climatic extreme events in Europe. Environ. Res. Lett. 7, 45705–45711. doi: 10.1088/1748-9326/7/4/045705
Barber, V. A., Juday, G. P., and Finney, B. P. (2000). Reduced growth of Alaskan white spruce in the twentieth century from temperature-induced drought stress. Nature 405, 668–673. doi: 10.1038/35015049
Basler, D., and Körner, C. (2012). Photoperiod sensitivity of bud burst in 14 temperate forest tree species. Agric. For. Meteorol. 165, 73–81. doi: 10.1016/j.agrformet.2012.06.001
Baul, T., Alam, A., Ikonen, A., Strandman, H., Asikainen, A., Peltola, H., et al. (2017). Climate change mitigation potential in boreal forests: impacts of management, harvest intensity and use of forest biomass to substitute fossil resources. Forests 8:455. doi: 10.3390/f8110455
Beck, P. S. A., and Goetz, S. J. (2011). Satellite observations of high northern latitude vegetation productivity changes between 1982 and 2008: ecological variability and regional differences. Environ. Res. Lett. 6:045501. doi: 10.1088/1748-3182/6/4/049501
Belyazid, S., and Zanchi, G. (2019). Water limitation can negate the effect of higher temperatures on forest carbon sequestration. Eur. J. For. Res. 138, 287–297. doi: 10.1007/s10342-019-01168-4
Berner, L. T., Beck, P. S. A., Bunn, A. G., Lloyd, A. H., and Goetz, S. J. (2011). High-latitude tree growth and satellite vegetation indices: correlations and trends in Russia and Canada (1982-2008). J. Geophys. Res. Biogeo. 116:G01015. doi: 10.1029/2010JG001475
Bjerke, J. W., Karlsen, S. R., Hogda, K. A., Malnes, E., Jepsen, J. U., Lovibond, S., et al. (2014). Record-low primary productivity and high plant damage in the nordic arctic region in 2012 caused by multiple weather events and pest outbreaks. Environ. Res. Lett. 9:084006. doi: 10.1088/1748-9326/9/8/084006
Boisvenue, C., and Running, S. W. (2006). Impacts of climate change on natural forest productivity–evidence since the middle of the 20th century. Glob. Chang. Biol. 12, 862–882. doi: 10.1111/j.1365-2486.2006.01134.x
Bonan, G. B., and Shugart, H. H. (1989). Environmental-factors and ecological processes in boreal forests. Annu. Rev. Ecol. Syst. 20, 1–28. doi: 10.1146/annurev.es.20.110189.000245
Boonstra, R., Andreassen, H. P., Boutin, S., Husek, J., Ims, R. A., Krebs, C. J., et al. (2016). Why do the boreal forest ecosystems of northwestern europe differ from those of Western North America? Bioscience 66, 722–734. doi: 10.1093/biosci/biw080
Budyko, M. I. (1964). Contribution to theory explaining influence of climatic factors on photosynthesis. Doklady Akademii Nauk Sssr 158, 331.
Buermann, W., Bikash, P. R., Jung, M., Burn, D. H., and Reichstein, M. (2013). Earlier springs decrease peak summer productivity in North American boreal forests. Environ. Res. Lett. 8:024027. doi: 10.1088/1748-9326/8/2/024027
Buermann, W., Parida, B., Jung, M., MacDonald, G. M., Tucker, C. J., and Reichstein, M. (2014). Recent shift in Eurasian boreal forest greening response may be associated with warmer and drier summers. Geophys. Res. Lett. 41, 1995–2002. doi: 10.1002/2014GL059450
Burnham, K. P., and Anderson, D. R. (2002). A Practical Information Theoretic Approach. Model Selection and Multimodel Inference, 2nd Edn. New York, NY: Springer.
Burnham, K. P., Anderson, D. R., and Huyvaert, K. P. (2011). AIC model selection and multimodel inference in behavioral ecology: some background, observations, and comparisons. Behav. Ecol. Sociobiol. 65, 23–35. doi: 10.1007/s00265-010-1029-6
Büttner, G. (2014). “CORINE land cover and land cover change products,” in Land Use and Land Cover Mapping in Europe. Remote Sensing and Digital Image Processing, Vol. 18, 55–74. eds I. Manakos, M. Braun (Springer: Dordrecht).
Carrer, M., Nola, P., Motta, R., and Urbinati, C. (2010). Contrasting tree-ring growth to climate responses of Abies alba toward the southern limit of its distribution area. Oikos 119, 1515–1525. doi: 10.1111/j.1600-0706.2010.18293.x
Churkina, G., and Running, S. W. (1998). Contrasting climatic controls on the estimated productivity of global terrestrial biomes. Ecosystems 1, 206–215. doi: 10.1007/s100219900016
D'Arrigo, R., Wilson, R., Liepert, B., and Cherubini, P. (2008). On the 'Divergence Problem' in northern forests: a review of the tree-ring evidence and possible causes. Glob. Planet. Change 60, 289–305. doi: 10.1016/j.gloplacha.2007.03.004
de Jong, R., Schaepman, M. E., Furrer, R., De Bruin, S., and Verburg, P. H. (2013). Spatial relationship between climatologies and changes in global vegetation activity. Glob. Chang. Biol. 19, 1953–1964. doi: 10.1111/gcb.12193
Didan, K. (2015). MOD13Q1 MODIS/Terra Vegetation Indices 16-Day L3 Global 250m SIN Grid V006 [Data set]. NASA EOSDIS LP DAAC.
Dunn, O. J. (1964). Multiple comparisons using rank sums. Technometrics 6, 241–252. doi: 10.1080/00401706.1964.10490181
Elbakidze, M., Andersson, K., Angelstam, P., Armstrong, G. W., Axelsson, R., Doyon, F., et al. (2013). Sustained yield forestry in Sweden and Russia: how does it correspond to sustainable forest management policy? Ambio 42, 160–173. doi: 10.1007/s13280-012-0370-6
Elliott, K. J., Miniat, C. F., Pederson, N., and Laseter, S. H. (2015). Forest tree growth response to hydroclimate variability in the southern Appalachians. Glob. Chang. Biol. 21, 4627–4641. doi: 10.1111/gcb.13045
Ernakovich, J. G., Hopping, K. A., Berdanier, A. B., Simpson, R. T., Kachergis, E. J., Steltzer, H., et al. (2014). Predicted responses of arctic and alpine ecosystems to altered seasonality under climate change. Glob. Chang. Biol. 20, 3256–3269. doi: 10.1111/gcb.12568
Fernández-Martínez, M., Yu, R., Gamon, J., Hmimina, G., Filella, I., Balzarolo, M., et al. (2019). Monitoring spatial and temporal variabilities of gross primary production using MAIAC MODIS data. Remote Sens. 11:874. doi: 10.3390/rs11070874
Folwell, S. S., Harris, P. P., and Taylor, C. M. (2016). Large-Scale surface responses during european dry spells diagnosed from land surface temperature. J. Hydrometeorol. 17, 975–993. doi: 10.1175/JHM-D-15-0064.1
Gauthier, S., Bernier, P., Kuuluvainen, T., Shvidenko, A. Z., and Schepaschenko, D. G. (2015). Boreal forest health and global change. Science 349, 819–822. doi: 10.1126/science.aaa9092
Geladi, P., and Kowalski, B. R. (1986). Partial least-squares regression - a tutorial. Anal. Chim. Acta 185, 1–17. doi: 10.1016/0003-2670(86)80028-9
Goetz, S. J., Bunn, A. G., Fiske, G. J., and Houghton, R. A. (2005). Satellite-observed photosynthetic trends across boreal North America associated with climate and fire disturbance. Proc. Natl. Acad. Sci. U.S.A. 102, 13521–13525. doi: 10.1073/pnas.0506179102
Grahn, P., and Stigsdotter, U. (2003). Landscape planning and stress. Urban For. Urban Green. 2, 1–18. doi: 10.1078/1618-8667-00019
Grossiord, C., Granier, A., Gessler, A., Jucker, T., and Bonal, D. (2014). Does drought influence the relationship between biodiversity and ecosystem functioning in boreal forests? Ecosystems 17, 394–404. doi: 10.1007/s10021-013-9729-1
Gunst, R. F., and Mason, R. L. (1979). Some considerations in the evaluation of alternate prediction equations. Technometrics 21, 55–63. doi: 10.1080/00401706.1979.10489722
Hall, C. M., Muller, D. K., and Saarinen, J. (2009). “Nature based tourism in Northern Wilderness,” in Nordic Tourism - Issues and Cases (Bristol: Channel View Publications).
Hargreaves, G. H. (1983). Estimating potential evapo-transpiration - closure. J. Irrig. Drain. Eng -Asce 109, 343–344. doi: 10.1061/(ASCE)0733-9437(1983)109:3(343)
Haylock, M. R., Hofstra, N., Tank, A. M. G. K., Klok, E. J., Jones, P. D., and New, M. (2008). A European daily high-resolution gridded data set of surface temperature and precipitation for 1950–2006. J. Geophys. Res-Atmos. 113:D20119. doi: 10.1029/2008JD010201
Hellmann, L., Agafonov, L., Ljungqvist, F. C., Churakova, O., Duthorn, E., Esper, J., et al. (2016). Diverse growth trends and climate responses across Eurasia's boreal forest. Environ. Res. Lett. 11:074021. doi: 10.1088/1748-9326/11/7/074021
Hsiao, T. C. (1973). Plant responses to water stress. Annu. Rev. Plant Physiol. Plant Mol. Biol. 24, 519–570. doi: 10.1146/annurev.pp.24.060173.002511
Ichii, K., Kawabata, A., and Yamaguchi, Y. (2002). Global correlation analysis for NDVI and climatic variables and NDVI trends: 1982-1990. Int. J. Remote Sens. 23, 3873–3878. doi: 10.1080/01431160110119416
Inouye, D. W. (2008). Effects of climate change on phenology, frost damage, and floral abundance of montane wildflowers. Ecology 89, 353–362. doi: 10.1890/06-2128.1
Intergovernmental Panel on Climate Change (2014). Climate Change 2014–Impacts, Adaptation and Vulnerability: Regional Aspects. Cambridge: Cambridge University Press. doi: 10.1017/CBO9781107415416
Jylha, K., Tuomenvirta, H., Ruosteenoja, K., Niemi-Hugaerts, H., Keisu, K., and Karhu, J. A. (2010). Observed and projected future shifts of climatic zones in Europe and their use to visualize climate change information. Weather Clim. Soc. 2, 148–167. doi: 10.1175/2010WCAS1010.1
Kallio, A. M. I., Salminen, O., and Sievanen, R. (2013). Sequester or substitute-consequences of increased production of wood based energy on the carbon balance in Finland. J. For. Econ. 19, 402–415. doi: 10.1016/j.jfe.2013.05.001
Karlsen, S. R., Solheim, I., Beck, P. S. A., Hogda, K. A., Wielgolaski, F. E., and Tommervik, H. (2007). Variability of the start of the growing season in Fennoscandia, 1982-2002. Int. J. Biometeorol. 51, 513–524. doi: 10.1007/s00484-007-0091-x
Kasischke, E. S., and Turetsky, M. R. (2006). Recent changes in the fire regime across the North American boreal region - Spatial and temporal patterns of burning across Canada and Alaska. Geophys. Res. Lett. 33:L09703. doi: 10.1029/2006GL025677
Kaufmann, R. K., D'Arrigo, R. D., Paletta, L. F., Tian, H. Q., Jolly, W. M., and Myneni, R. B. (2008). Identifying climatic controls on ring width: the timing of correlations between tree rings and NDVI. Earth Interact. 12, 1–14. doi: 10.1175/2008EI263.1
Kauppi, P. E., Posch, M., and Pirinen, P. (2014). Large impacts of climatic warming on growth of boreal forests since 1960. PLoS ONE 9:e111340. doi: 10.1371/journal.pone.0111340
Köhl, M., Bastup-Birk, A., Marchetti, M., Cimini, D., Corona, P., Thorsen, B., et al. (2011). “Criterion 3: Maintenance and encouragement of productive functions of forest,” in FOREST EUROPE, UNECE and FAO 2011: State of Europe's Forests 2011 (Oslo: Status and Trends in Sustainable Forest Management in Europe).
Kong, D., Zhang, Q., Singh, V. P., and Shi, P. (2017). Seasonal vegetation response to climate change in the Northern Hemisphere (1982–2013). Glob. Planetar. Change 148, 1–8. doi: 10.1016/j.gloplacha.2016.10.020
Korner, C. (2003). Carbon limitation in trees. J. Ecol. 91, 4–17. doi: 10.1046/j.1365-2745.2003.00742.x
Koskiaho, J., Ekholm, P., Raty, M., Riihimaki, J., and Puustinen, M. (2003). Retaining agricultural nutrients in constructed wetlands - experiences under boreal conditions. Ecol. Eng. 20, 89–103. doi: 10.1016/S0925-8574(03)00006-5
Kruskal, W. H. (1952). A nonparametric test for the several sample problem. Ann. Math. Stat. 23, 525–540. doi: 10.1214/aoms/1177729332
Kurz, W. A., Stinson, G., Rampley, G. J., Dymond, C. C., and Neilson, E. T. (2008). Risk of natural disturbances makes future contribution of Canada's forests to the global carbon cycle highly uncertain. Proc. Natl. Acad. Sci. U.S.A. 105, 1551–1555. doi: 10.1073/pnas.0708133105
Kysely, J., and Plavcova, E. (2010). A critical remark on the applicability of E-OBS European gridded temperature data set for validating control climate simulations. J. Geophys. Res-Atmos. 115:D23118. doi: 10.1029/2010JD014123
Ledesma, J. L. J., and Futter, M. N. (2017). Gridded climate data products are an alternative to instrumental measurements as inputs to rainfall-runoff models. Hydrol. Process. 31, 3283–3293. doi: 10.1002/hyp.11269
Lloyd, A. H., and Bunn, A. G. (2007). Responses of the circumpolar boreal forest to 20th century climate variability. Environ. Res. Lett. 2:045013. doi: 10.1088/1748-9326/2/4/045013
Martin-Benito, D., and Pederson, N. (2015). Convergence in drought stress, but a divergence of climatic drivers across a latitudinal gradient in a temperate broadleaf forest. J. Biogeogr. 42, 925–937. doi: 10.1111/jbi.12462
Matsushita, B., Yang, W., Chen, J., Onda, Y., and Qiu, G. Y. (2007). Sensitivity of the enhanced vegetation index (EVI) and Normalized difference vegetation index (NDVI) to topographic effects: a case study in high-density cypress forest. Sensors 7, 2636–2651. doi: 10.3390/s7112636
Mulder, V. L., van Eck, C. M., Friedlingstein, P., Arrouays, D., and Regnier, P. (2019). Controlling factors for land productivity under extreme climatic events in continental Europe and the Mediterranean Basin. CATENA 182:104124. doi: 10.1016/j.catena.2019.104124
Muukkonen, P., Nevalainen, S., Lindgren, M., and Peltoniemi, M. (2015). Spatial occurrence of drought-associated damages in Finnish boreal forests: results from forest condition monitoring and GIS analysis. Boreal Environ. Res. 20, 172–180.
Myneni, R. B., Keeling, C. D., Tucker, C. J., Asrar, G., and Nemani, R. R. (1997). Increased plant growth in the northern high latitudes from 1981 to 1991. Nature 386, 698–702. doi: 10.1038/386698a0
Nikulin, G., Kjellstrom, E., Hansson, U., Strandberg, G., and Ullerstig, A. (2011). Evaluation and future projections of temperature, precipitation and wind extremes over Europe in an ensemble of regional climate simulations. Tellus 63, 41–55. doi: 10.1111/j.1600-0870.2010.00466.x
Nordic Statistics (2017). Nordic Statistics 2017. Nordic Co-operation Nordiska ministerrådets sekretariat, Nordic Council of Ministers, Oslo.
Olofsson, P., Lagergren, F., Lindroth, A., Lindström, J., Klemedtsson, L., Kutsch, W., et al. (2008). Towards operational remote sensing of forest carbon balance across Northern Europe. Biogeosciences 5, 817–832. doi: 10.5194/bg-5-817-2008
O'Sullivan, O. S., Heskel, M. A., Reich, P. B., Tjoelker, M. G., Weerasinghe, L. K., Penillard, A., et al. (2017). Thermal limits of leaf metabolism across biomes. Glob. Chang. Biol. 23, 209–223. doi: 10.1111/gcb.13477
Park, T., Ganguly, S., Tommervik, H., Euskirchen, E. S., Hogda, K. A., Karlsen, S. R., et al. (2016). Changes in growing season duration and productivity of northern vegetation inferred from long-term remote sensing data. Environ. Res. Lett. 11:084001. doi: 10.1088/1748-9326/11/8/084001
Peichl, M., Oquist, M., Lofvenius, M. O., Ilstedt, U., Sagerfors, J., Grelle, A., et al. (2014). A 12-year record reveals pre-growing season temperature and water table level threshold effects on the net carbon dioxide exchange in a boreal fen. Environ. Res. Lett. 9:055006. doi: 10.1088/1748-9326/9/5/055006
Persson, G., Bärring, L., Kjellström, E., Strandberg, G., and Rummukainen, M. (2007). Climate Indices for Vulnerability Assessments. Norrköpping: SMHI.
Piao, S. L., Liu, Z., Wang, T., Peng, S. S., Ciais, P., Huang, M. T., et al. (2017). Weakening temperature control on the interannual variations of spring carbon uptake across northern lands. Nat. Clim. Change 7, 359–363. doi: 10.1038/nclimate3277
Porter, T. J., and Pisaric, M. F. J. (2011). Temperature-growth divergence in white spruce forests of old crow flats, Yukon Territory, and adjacent regions of northwestern North America. Glob. Chang. Biol. 17, 3418–3430. doi: 10.1111/j.1365-2486.2011.02507.x
Rosner, S., Gierlinger, N., Klepsch, M., Karlsson, B., Evans, R., Lundqvist, S. O., et al. (2018). Hydraulic and mechanical dysfunction of Norway spruce sapwood due to extreme summer drought in Scandinavia. For. Ecol. Manage. 409, 527–540. doi: 10.1016/j.foreco.2017.11.051
Rubtsov, A. V., Sukhinin, A. I., and Vaganov, E. A. (2011). System analysis of weather fire danger in predicting large fires in Siberian forests. Izv. Atmos. Ocean. Phys. 47, 1049–1056. doi: 10.1134/S0001433811090143
Ruckstuhl, K. E., Johnson, E. A., and Miyanishi, K. (2008). Introduction. The boreal forest and global change. Philos. Trans. R. Soc. B-Biol. Sci. 363, 2245–2249. doi: 10.1098/rstb.2007.2196
Ruiz-Pérez, G., Launiainen, S., and Vico, G. (2019). Role of plant traits in photosynthesis and thermal damage avoidance under warmer and drier climates in boreal forests. Forests 10:398. doi: 10.3390/f10050398
Ruosteenoja, K., Markkanen, T., Venalainen, A., Raisanen, P., and Peltola, H. (2018). Seasonal soil moisture and drought occurrence in Europe in CMIP5 projections for the 21st century. Clim. Dyn. 50, 1177–1192. doi: 10.1007/s00382-017-3671-4
Ruosteenoja, K., Raisanen, J., Venalainen, A., and Kamarainen, M. (2016). Projections for the duration and degree days of the thermal growing season in Europe derived from CMIP5 model output. Int. J. Climatol. 36, 3039–3055. doi: 10.1002/joc.4535
Rytter, L., Andreassen, K., Bergh, J., Eko, P. M., Gronholm, T., Kilpelainen, A., et al. (2015). Availability of biomass for energy purposes in nordic and baltic countries: land areas and biomass amounts. Balt. For. 21, 375–390.
Rytter, L., Ingerslev, M., Kilpelainen, A., Torssonen, P., Lazdina, D., Lof, M., et al. (2016). Increased forest biomass production in the Nordic and Baltic countries - a review on current and future opportunities. Silva Fenn. 50:1660. doi: 10.14214/sf.1660
Sesnie, S. E., Dickson, B. G., Rosenstock, S. S., and Rundall, J. M. (2012). A comparison of Landsat TM and MODIS vegetation indices for estimating forage phenology in desert bighorn sheep (Ovis canadensis nelsoni) habitat in the Sonoran Desert, USA. Int. J. Remote Sens. 33, 276–286. doi: 10.1080/01431161.2011.592865
Skaugen, T. E., and Tveito, O. E. (2004). Growing-season and degree-day scenario in Norway for 2021-2050. Clim. Res. 26, 221–232. doi: 10.3354/cr026221
Smyth, C., Kurz, W. A., Rampley, G., Lempriere, T. C., and Schwab, O. (2017). Climate change mitigation potential of local use of harvest residues for bioenergy in Canada. Glob. Change Biol. Bioenergy 9, 817–832. doi: 10.1111/gcbb.12387
Solberg, S. (2004). Summer drought: a driver for crown condition and mortality of Norway spruce in Norway. For. Pathol. 34, 93–104. doi: 10.1111/j.1439-0329.2004.00351.x
Soukup, T., Büttner, G., Feranec, J., Hazeu, G., Jaffrain, G., Jindrova, M., et al. (2016). CORINE Land Cover 2006–2012 changes: analysis and assessment. Eur. Landscape Dyn. 1, 111–119. doi: 10.1201/9781315372860-17
Sulla-Menashe, D., Woodcock, C. E., and Friedl, M. A. (2018). Canadian boreal forest greening and browning trends: an analysis of biogeographic patterns and the relative roles of disturbance versus climate drivers. Environ. Res. Lett. 13:014007. doi: 10.1088/1748-9326/aa9b88
Tangeland, T., Aas, O., and Odden, A. (2013). The socio- demographic influence on participation in outdoor recreation activities - implications for the norwegian domestic market for nature-based tourism. Scand. J. Hosp. Tour. 13, 190–207. doi: 10.1080/15022250.2013.819171
Tei, S., and Sugimoto, A. (2018). Time lag and negative responses of forest greenness and tree growth to warming over circumboreal forests. Glob. Change Biol. 24, 1–13. doi: 10.1111/gcb.14135
Tei, S., Sugimoto, A., Kotani, A., Ohta, T., Morozumi, T., Saito, S., et al. (2019). Strong and stable relationships between tree-ring parameters and forest-level carbon fluxes in a Siberian larch forest. Polar Sci. 21, 146–157. doi: 10.1016/j.polar.2019.02.001
Thurner, M., Beer, C., Carvalhais, N., Forkel, M., Santoro, M., Tum, M., et al. (2016). Large-scale variation in boreal and temperate forest carbon turnover rate related to climate. Geophys. Res. Lett. 43, 4576–4585. doi: 10.1002/2016GL068794
Toreti, A., Belward, A., Perez-Dominguez, I., Naumann, G., Luterbacher, J., Cronie, O., et al. (2019). The exceptional 2018 European water seesaw calls for action on adaptation. Earth's Fut. 7, 652–663. doi: 10.1029/2019EF001170
Trahan, M. W., and Schubert, B. A. (2016). Temperature-induced water stress in high-latitude forests in response to natural and anthropogenic warming. Glob. Chang. Biol. 22, 782–791. doi: 10.1111/gcb.13121
United Nations Framework Convention on Climate Change (2011). Report of the United Nations Climate Change Conference, Durban, South Africa.
Verbyla, D. (2015). Remote sensing of interannual boreal forest NDVI in relation to climatic conditions in interior Alaska. Environ. Res. Lett. 10:125016. doi: 10.1088/1748-9326/10/12/125016
Vicente-Serrano, S. M., Gouveia, C., Camarero, J. J., Begueria, S., Trigo, R., Lopez-Moreno, J. I., et al. (2013). Response of vegetation to drought time-scales across global land biomes. Proc. Natl. Acad. Sci. U.S.A. 110, 52–57. doi: 10.1073/pnas.1207068110
Vulturius, G., André, K., Swartling, Å. G., Brown, C., Rounsevell, M. D. A., and Blanco, V. (2018). The relative importance of subjective and structural factors for individual adaptation to climate change by forest owners in Sweden. Reg. Environ. Change 18, 511–520. doi: 10.1007/s10113-017-1218-1
Walther, S., Voigt, M., Thum, T., Gonsamo, A., Zhang, Y. G., Kohler, P., et al. (2016). Satellite chlorophyll fluorescence measurements reveal large-scale decoupling of photosynthesis and greenness dynamics in boreal evergreen forests. Glob. Change Biol. 22, 2979–2996. doi: 10.1111/gcb.13200
Wang, X. Y., Wang, T., Guo, H., Liu, D., Zhao, Y. T., Zhang, T. T., et al. (2018). Disentangling the mechanisms behind winter snow impact on vegetation activity in northern ecosystems. Glob. Chang. Biol. 24, 1651–1662. doi: 10.1111/gcb.13930
Williams, A. P., Allen, C. D., Macalady, A. K., Griffin, D., Woodhouse, C. A., Meko, D. M., et al. (2013). Temperature as a potent driver of regional forest drought stress and tree mortality. Nat. Clim. Chang. 3, 292–297. doi: 10.1038/nclimate1693
Williams, J., Crowley, J., Fischer, H., Harder, H., Martinez, M., Petaja, T., et al. (2011). The summertime Boreal forest field measurement intensive (HUMPPA-COPEC-2010): an overview of meteorological and chemical influences. Atmos. Chem. Phys. 11, 10599–10618. doi: 10.5194/acp-11-10599-2011
Wold, S., Sjostrom, M., and Eriksson, L. (2001). PLS-regression: a basic tool of chemometrics. Chemometr. Intell. Lab. Syst. 58, 109–130. doi: 10.1016/S0169-7439(01)00155-1
Wu, D. H., Zhao, X., Liang, S. L., Zhou, T., Huang, K. C., Tang, B. J., et al. (2015). Time-lag effects of global vegetation responses to climate change. Glob. Chang. Biol. 21, 3520–3531. doi: 10.1111/gcb.12945
Wu, S., Li, J., and Huang, G. H. (2008). A study on DEM-derived primary topographic attributes for hydrologic applications: sensitivity to elevation data resolution. Appl. Geogr. 28, 210–223. doi: 10.1016/j.apgeog.2008.02.006
Yamori, W., Hikosaka, K., and Way, D. A. (2014). Temperature response of photosynthesis in C-3, C-4, and CAM plants: temperature acclimation and temperature adaptation. Photosyn. Res. 119, 101–117. doi: 10.1007/s11120-013-9874-6
Yuan, W. P., Luo, Y. Q., Richardson, A. D., Oren, R., Luyssaert, S., Janssens, I. A., et al. (2009). Latitudinal patterns of magnitude and interannual variability in net ecosystem exchange regulated by biological and environmental variables. Glob. Chang. Biol. 15, 2905–2920. doi: 10.1111/j.1365-2486.2009.01870.x
Zhao, L., Dai, A. G., and Dong, B. (2018). Changes in global vegetation activity and its driving factors during 1982-2013. Agric. For. Meteorol. 249, 198–209. doi: 10.1016/j.agrformet.2017.11.013
Zohner, C. M., and Renner, S. S. (2015). Perception of photoperiod in individual buds of mature trees regulates leaf-out. N. Phytol. 208, 1023–1030. doi: 10.1111/nph.13510
Keywords: boreal forest, temperature, precipitation, water stress, NDVI, Northern Europe
Citation: Ruiz-Pérez G and Vico G (2020) Effects of Temperature and Water Availability on Northern European Boreal Forests. Front. For. Glob. Change 3:34. doi: 10.3389/ffgc.2020.00034
Received: 28 October 2019; Accepted: 06 March 2020;
Published: 02 April 2020.
Edited by:
Matthew D. Hurteau, University of New Mexico, United StatesReviewed by:
Tanya Doody, Commonwealth Scientific and Industrial Research Organisation (CSIRO), AustraliaCourtney M. Siegert, Mississippi State University, United States
Copyright © 2020 Ruiz-Pérez and Vico. This is an open-access article distributed under the terms of the Creative Commons Attribution License (CC BY). The use, distribution or reproduction in other forums is permitted, provided the original author(s) and the copyright owner(s) are credited and that the original publication in this journal is cited, in accordance with accepted academic practice. No use, distribution or reproduction is permitted which does not comply with these terms.
*Correspondence: Guiomar Ruiz-Pérez, guiomar.ruiz.perez@slu.se