 Xuelian Ma
 Hansheng Zhao
 Wenying Xu1
 Qi You
 Zhen Su
- 1State Key Laboratory of Plant Physiology and Biochemistry, College of Biological Sciences, China Agricultural University, Beijing, China
- 2State Forestry Administration Key Open Laboratory on the Science and Technology of Bamboo and Rattan, Institute of Gene Science for Bamboo and Rattan Resources, International Center for Bamboo and Rattan, Beijing, China
Bamboo is one of the fastest-growing non-timber forest plants. Moso bamboo (Phyllostachys edulis) is the most economically valuable bamboo in Asia, especially in China. With the release of the whole-genome sequence of moso bamboo, there are increasing demands for refined annotation of bamboo genes. Recently, large amounts of bamboo transcriptome data have become available, including data on the multiple growth stages of tissues. It is now feasible for us to construct co-expression networks to improve bamboo gene annotation and reveal the relationships between gene expression and growth traits. We integrated the genome sequence of moso bamboo and 78 transcriptome data sets to build genome-wide global and conditional co-expression networks. We overlaid the gene expression results onto the network with multiple dimensions (different development stages). Through combining the co-expression network, module classification and function enrichment tools, we identified 1,896 functional modules related to bamboo development, which covered functions such as photosynthesis, hormone biosynthesis, signal transduction, and secondary cell wall biosynthesis. Furthermore, an online database (http://bioinformatics.cau.edu.cn/bamboo) was built for searching the moso bamboo co-expression network and module enrichment analysis. Our database also includes cis-element analysis, gene set enrichment analysis, and other tools. In summary, we integrated public and in-house bamboo transcriptome data sets and carried out co-expression network analysis and functional module identification. Through data mining, we have yielded some novel insights into the regulation of growth and development. Our established online database might be convenient for the bamboo research community to identify functional genes or modules with important traits.
Introduction
Bamboo, an important fast-growing non-timber forest plant worldwide, has been an essential forest resource with an annual trade value of >2.5 billion US dollars, and approximately 2.5 billion people depend on it economically (Peng et al., 2013a,b; Zhao et al., 2017). Moso bamboo (Phyllostachys edulis, once known as Phyllostachys heterocycla) is the most economically valuable bamboo in Asia, especially in China. With the release of the whole-genome sequence of moso bamboo, there are increasing demands for refined annotation of bamboo genes on the whole-genome level. Considering the small proportion of annotated genes in the bamboo genome and high accumulation of data, it is necessary and urgent to conduct big-data mining to yield novel insights into bamboo growth and development.
Generally, genes with coordinated expression across a variety of experimental conditions indicate the presence of functional linkages between genes. Thus, co-expression gene networks can associate these genes of unknown function with biological processes in an intuitive way. An increasing number of studies have supported the versatility of co-expression analysis for inferring and annotating gene functions (D’Haeseleer et al., 2000; Aoki et al., 2007; Usadel et al., 2009; Morenorisueno et al., 2010; Li et al., 2015; Serin et al., 2016). Through data mining tools and algorithms that describe complex co-expression patterns of multiple genes in a pairwise fashion, global co-expression network analyses consider all samples (multiple data sources with independence) together and establish connections between genes based on the collective information available (Bassel et al., 2011). Compared with such a network, the conditional co-expression network aims to enhance our understanding of gene function from a portion of transcriptome data sets that have much in common, such as having the same source and a similar acquisition of raw materials and inferring gene transcriptional regulatory mechanisms in developmental processes based on a series of selected associated samples. In co-expression analysis, gene expression views can help clearly present the tendency of differential gene expression between samples. Consequently, co-expression networks with expression views can be used to associate genes of unknown function with biological processes, to discern gene transcriptional regulatory mechanisms in vivo and to prioritize candidate regulatory genes or modules of vital traits.
Based on the de novo sequencing data, together with the full-length complementary DNA and RNA-seq data of moso bamboo, BambooGDB has become the first genome database with comprehensively functional annotation for bamboo (Zhao et al., 2014). It is also an analytical platform composed of comparative genomic analysis, protein-protein interaction networks, pathway analysis and visualization of genomic data. However, it has only 12 RNA-seq data sets in different tissues of moso bamboo, which falls far short of existing RNA-seq data sets and does not meet the needs of researchers. Moreover, there are no analyses of co-expression networks, functional modules, cis-elements and gene set enrichment in BambooGDB. ATTED-II (Aoki et al., 2016), a co-expression database for plant species, provides a view of multiple co-expression data sets for nine species (Arabidopsis, field mustard, soybean, barrel medic, poplar, tomato, grape, rice and maize). Only two of them are members of the grass family (Poaceae), like bamboo. It is exceedingly necessary to present co-expression networks for bamboo.
Recently, large amounts of transcriptome data have become available on bamboo for the establishment of co-expression gene networks associated with plant growth and development. We collected 52 high-quality genome-wide transcriptome data sets on moso bamboo covering six tissues from the NCBI SRA database (He et al., 2013; Peng et al., 2013a; Huang et al., 2016; Wei et al., 2016; Zhao et al., 2016, 2018). In addition, we have newly produced 26 in-house transcriptome data sets across six tissues of different growth stages from the Genome Atlas of Bamboo and Rattan (GABR). To efficiently extract information from large data sets, we applied in silico methods to build genome-wide global and conditional co-expression networks, and further, to identify functional modules for annotating and predicting bamboo gene functions. Furthermore, we constructed the BambooNET database1 to integrate the high-throughput transcriptome data, co-expression networks, functional modules, etc. BambooNET also included co-expression network analysis, cis-element analysis and GSEA tools, which might be an online server for refining annotation of bamboo gene functions.
Materials and Methods
Moso Bamboo Samples From ICBR
Twenty-six moso bamboo (Phyllostachys edulis) samples of ICBR were collected from six main bamboo-producing areas in China during the spring of 2015, including (1) Yixing, Jiangsu Province (N:31°15′08.41″, E:119°43′42.55″, 212 M); (2) Tianmu Mountain, Zhejiang Province (N:30°19′13.42″, E:119°26′55.21″, 480 M); (3) Xianning, Hubei Province (N:29°81′10.02″, E:114°31′21.12″ 150 M); (4) Taojiang, Hunan Province (N:28°28′39.74″, E:112°11′18.62″, 320 M); (5) Guilin, Guangxi Province (N:28°28′39.74″, E:112°11′18.62″, 216 M) and (6) Chishui, Guizhou Province (N:28°28′15.27″, E:105°59′41.43″, 120 M), which covered rhizome, root, shoot, leaf, sheath, and bud during different development stages. Each mixed sample was collected from the above six areas.
Data Process and Gene Expression Profiling Analysis
The whole-genome sequence of moso bamboo was accessed from the 2013 public version 1 (Peng et al., 2013a) and corresponded to a genome size of ∼2 Gb and 31,987 protein-coding genes. The reads of 78 RNA-seq samples were aligned to the bamboo genome (version 1.0) using TopHat v2.1.1 software (Trapnell et al., 2009). Calculation of FPKM and the identification of differentially expressed genes were performed using Cuffdiff in Cufflinks v2.2.1 software (Trapnell et al., 2010). GO enrichment analysis was performed using the agriGO website (Du et al., 2010).
To determine the minimum threshold of the gene expression value (FPKM) among 78 bamboo samples, the lowest 5% of all gene FPKM values in each RNA-seq sample and the SD of each experimental group were computed. Then, the mathematical formula “threshold = average(5% value) + 3 ∗ SD” (You et al., 2016, 2017) was used to calculate the minimum expression value of each experimental group. The minimum threshold of FPKM was 0.1474.
Co-expression Network Construction Algorithm and Parameters
The PCC represents the co-expression relationship between two genes among the 78 samples. The closer the relationships between the genes were, the higher the PCC scores. MR, an algorithm for calculating the rank of PCC, takes a geometric average of the PCC rank from gene A to gene B and from gene B to gene A. Specifically, when gene A is the third highest co-expressed gene for gene B, the PCC rank of gene A to gene B is 3. Thus, MR ensures more credible co-expression gene pairs would be left out, so the PCC and MR were used to construct a co-expression network.
Pearson correlation coefficient:
MR:
Here, we retained co-expressed gene pairs with a single direction rank of PCC (RankAB or RankBA) less than 3 and MR score less than 30 in a co-expression network (Aoki et al., 2016), and these gene pairs were regarded as having positive co-expression relationships when their PCC values were more than zero and negative co-expression relationships when their values were less than zero.
All samples were used to construct global networks, while ICBR samples were used for conditional networks. Following a similar procedure, 65 data sets without the stress treatment were selected to define tissue-preferentially expressed genes, and 10 data sets associated with dehydration and cold treatment were selected for stress-differentially expressed genes.
Modules Identification Algorithm and Parameters
The CPM (Adamcsek et al., 2006) was used to find modules with nodes more densely connected to each other than to nodes outside the group in the bamboo co-expression networks. Parameter selection was based on the number of modules, the coverage rate of genes and the overlap rate of community. Hence, we selected a k = 6 clique size, which meant each node had co-expression interactions with at least five nodes in a module (Supplementary Figure S5). The functions of modules were predicted by gene set analysis (Yi et al., 2013) through integrating annotations such as GO, gene families (transcription regulators, kinases, and carbohydrate-active enzymes), and KEGG. The TF family and kinase family classifications were collected from iTAK (Yi et al., 2016) and PlantTFDB (Jin et al., 2017). A total of 3,305 TFs and 1,598 kinases were identified. Moreover, non-significant entries were filtered by the Fisher’s exact test and multiple hypothesis testing (FDR ≤ 0.05). In the end, 1,896 modules containing at least 6 genes each were found in bamboo, covering functions such as metabolism, hormones, development, and transcriptional regulation.
Cis-Element Significance Analysis
The cis-element significance test is a statistical algorithm based on Z score and P-value filtering. When scanned in the 3 kb promoter region of bamboo genes, motifs with a P-value less than 0.05 were significantly enriched in a regulatory module (Yu et al., 2014; You et al., 2016).
The Z score was calculated as
where is the sum value of a motif in the promoters of a list of genes, μ is the mean value of the same motif in 1000(n) random lists of genes with same scale, and σ is the SD of the 1000-mean value based on random selection.
Ortholog Identification in Arabidopsis
Bidirectional blast alignments were conducted for the analysis of protein sequences in moso bamboo and Arabidopsis. Our criteria for the orthologous search were as follows: the top three hits in each bidirectional blast alignment were selected as the best orthologous pairs; in addition, pairs with an E-value less than 1E-25 were regarded as secondary orthologous pairs. Table 3 lists the results of the orthologous search, including for NST1, SND1 and VND7.
Search and Visualization Platform
The network search function was based on MySQL, Apache and PHP scripts. Cytoscape.js, an open source java script package, can dynamically display the components, construction and variation of the network.
Results
Network Construction and Module Identification
We integrated 78 transcriptome data sets for moso bamboo (Phyllostachys edulis), which can be divided into two parts according to the data source: 52 public data sets from NCBI and 26 in-house data sets from ICBR (Table 1). The data sets spanned most tissues of bamboo, including leaf, culm (stem), shoot, root, rhizome, bud and panicle as well as stress-treated (dehydration and cold) samples from the public platform. The data sets from ICBR were available for the construction of conditional network, covering different portions from tissue root, shoot, bud, leaf and so forth. Furthermore, each ICBR sample was a mixture from six areas of bamboo production in China. This variety is beneficial for the study of fast growth and development regulation in bamboo.
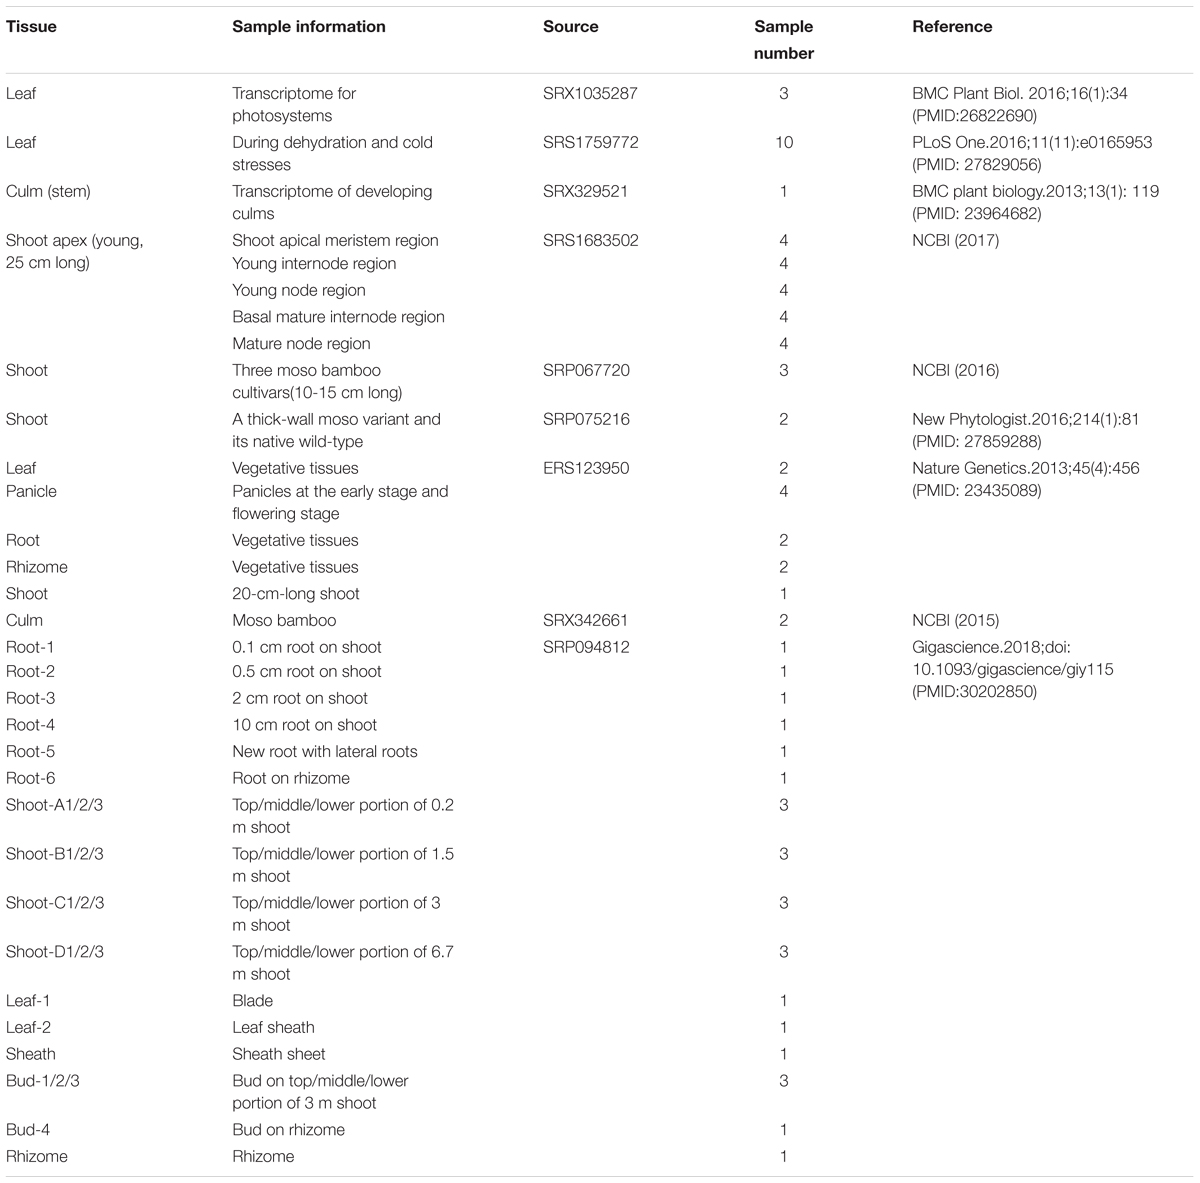
TABLE 1. Details of RNA-seq sample resources.
A well-developed integrated strategy was used for network construction (You et al., 2016, 2017). First, the raw RNA-seq reads of bamboo samples were mapped to the moso bamboo reference genome by TopHat, and then the FPKM of genes were calculated by Cufflinks. Since the read mapping ratios of 7 RNA-seq samples (culm tissue) were too low (<25%), we ultimately retained 78 RNA-seq samples for global co-expression network construction (details of mapping results shown in Supplementary Table S1). Through the FPKM value distribution boxplot of all samples (Supplementary Figure S1), the minimum threshold FPKM value of 0.1474 among 78 bamboo samples was chosen as a cut-off value to identify whether the gene was expressed according to all genes’ FPKM values in each sample. The PCC was adopted as the correlation coefficient between two genes and to measure the co-expression relationship. The lowest 5% PCC (-0.4) and highest 5% PCC values (0.6) were considered thresholds for negative and positive correlation, respectively, in the PCC distribution diagram of all gene pairs (Supplementary Figure S2A). The MR method (Aoki et al., 2016) was widely used in many species such as the model plant Arabidopsis. Strict parameters were set to get optimal co-expressed gene pairs in this way. It mainly classified co-expressed gene pairs into three levels: MR top3, MR ≤ 5 and 5 < MR ≤ 30. As a result, the PCC cut-off of 0.6 and the MR top3 + MR cut-off of ≤30 were better for the construction of co-expression network. Finally, there were 302,383 and 185,044 pairs with 31,681 nodes in the positive co-expression network (PCC value > 0) and negative co-expression network (PCC value < 0), respectively. The network was inferred to be scale-free from the distribution of nodes and their linked edges numbers (Supplementary Figure S2B).
All transcriptome data sets were used to construct the global networks in this study, while the 26 data sets from ICBR were used for conditional networks as a parallel analysis with the same method (MR) and procedure as global networks. In addition, 65 data sets without stress treatment were selected to define tissue-preferentially expressed genes, and 10 data sets associated with dehydration and cold treatment were selected for stress-differentially expressed genes. We overlaid the gene expression results onto the co-expression network with multiple dimensions (development and stress).
Furthermore, co-expression networks allow modularized analysis of biological processes to discover regulatory genes or modules of vital traits. The CPM (Adamcsek et al., 2006; Li et al., 2014) together with function enrichment tools was applied to classify possible function modules. As a result, 1,896 functional modules containing at least 6 genes each were identified in bamboo, covering functions such as metabolism, hormones, development, and transcriptional regulation.
Gene Network Analysis of Photosynthesis-Related Genes
Photosynthesis provides energy for the fast growth and development of bamboo. It may possess a unique carbon assimilation mechanism, and it would be interesting to study the light-harvesting process in bamboo (Jiang et al., 2012). Additionally, an efficient light-harvesting step is critical for the success of photosynthesis (Cheng and Fleming, 2009; Zhao et al., 2016). We selected three light-harvesting complex (LHC) genes of photosystem I and photosystem II in bamboo (Table 2), including PH01003036G0080 (orthologous gene of LHCA1), PH01001378G0550 (orthologous gene of CAB1 or LHCB1.3) and PH01000242G0150 (orthologous gene of CAB2 or LHCB1.1), and searched their global co-expression networks with a tissue-preferential gene expression view in bamboo. Based on the LHCB-related gene expression views among different tissues, three samples for each tissue were used to detect different expression levels, which were quantified by FPKM value (Figure 1A). These genes preferentially expressed in leaf compared to other tissues, while they were almost not expressed in root. To validate the robustness and credibility of the networks and further study the possible regulatory mechanisms of LHCA1 and their co-expressed genes in bamboo, we selected the LHCA1 gene (PH01003036G0080) as an example to visualize the global co-expression network (Figure 1B). Through GO enrichment analysis of all genes from this network by using agriGO (Du et al., 2010; Tian et al., 2017) (Figure 1D), the results showed that these co-expressed genes were strongly associated with the GO terms of photosynthesis and light harvesting, light reaction, and generation of precursor metabolites and energy, which matched the previous findings that the primary function of LHC protein was the absorption of light through chlorophyll excitation and transfer of absorbed energy to photochemical reaction centers (Dolganov et al., 1995; Li et al., 2000; Montané and Kloppstech, 2000; Zhao et al., 2016). A similar result was also obtained in CAB1, CAB2 and their co-expressed genes following the above process (Figure 1C). Zhao et al. (2016) found that more copies of LHC genes indicated more energy may be required in the fast-growth stage of moso bamboo. LHCA and LHCB coexist with some other LHC genes in these global co-expression networks (Figure 1B). From the perspective of only LHCA and LHCB genes’ co-expression (Figure 1E), LHCA and LHCB are intimately linked with each other.
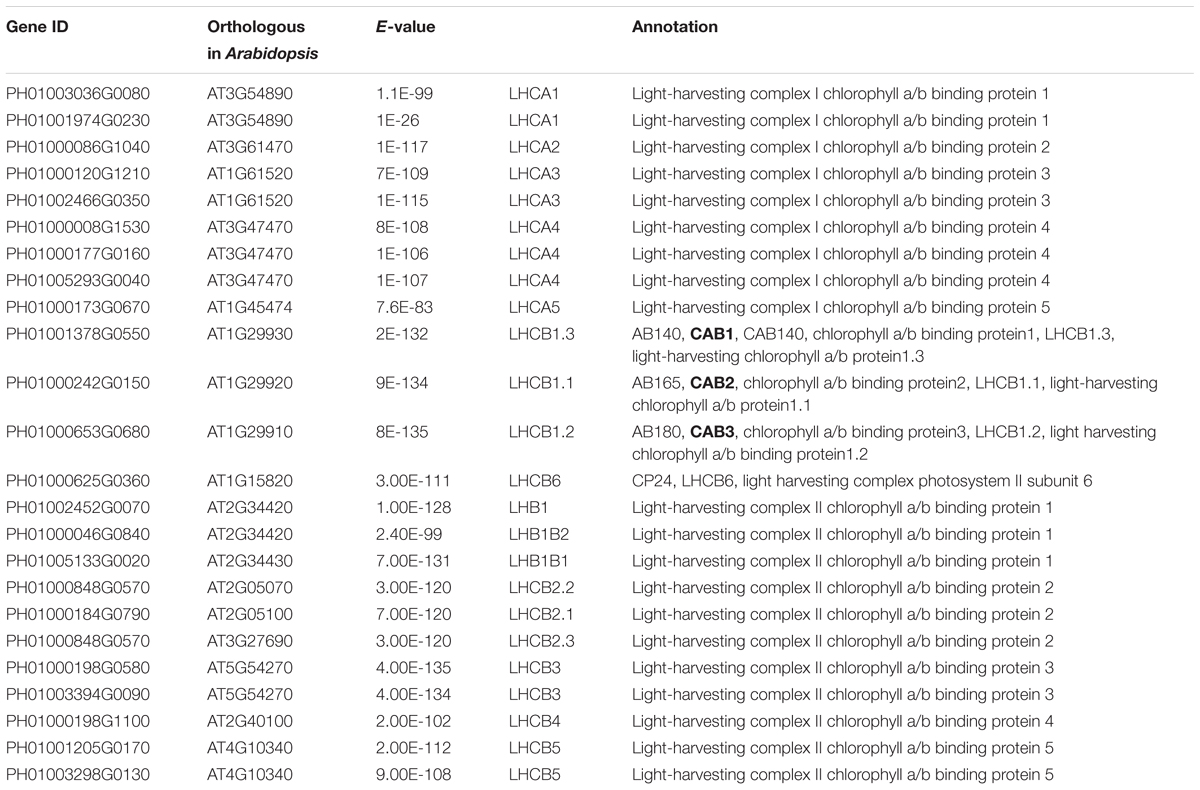
TABLE 2. The genes of light-harvesting complex genes of photosystems I and II in bamboo.
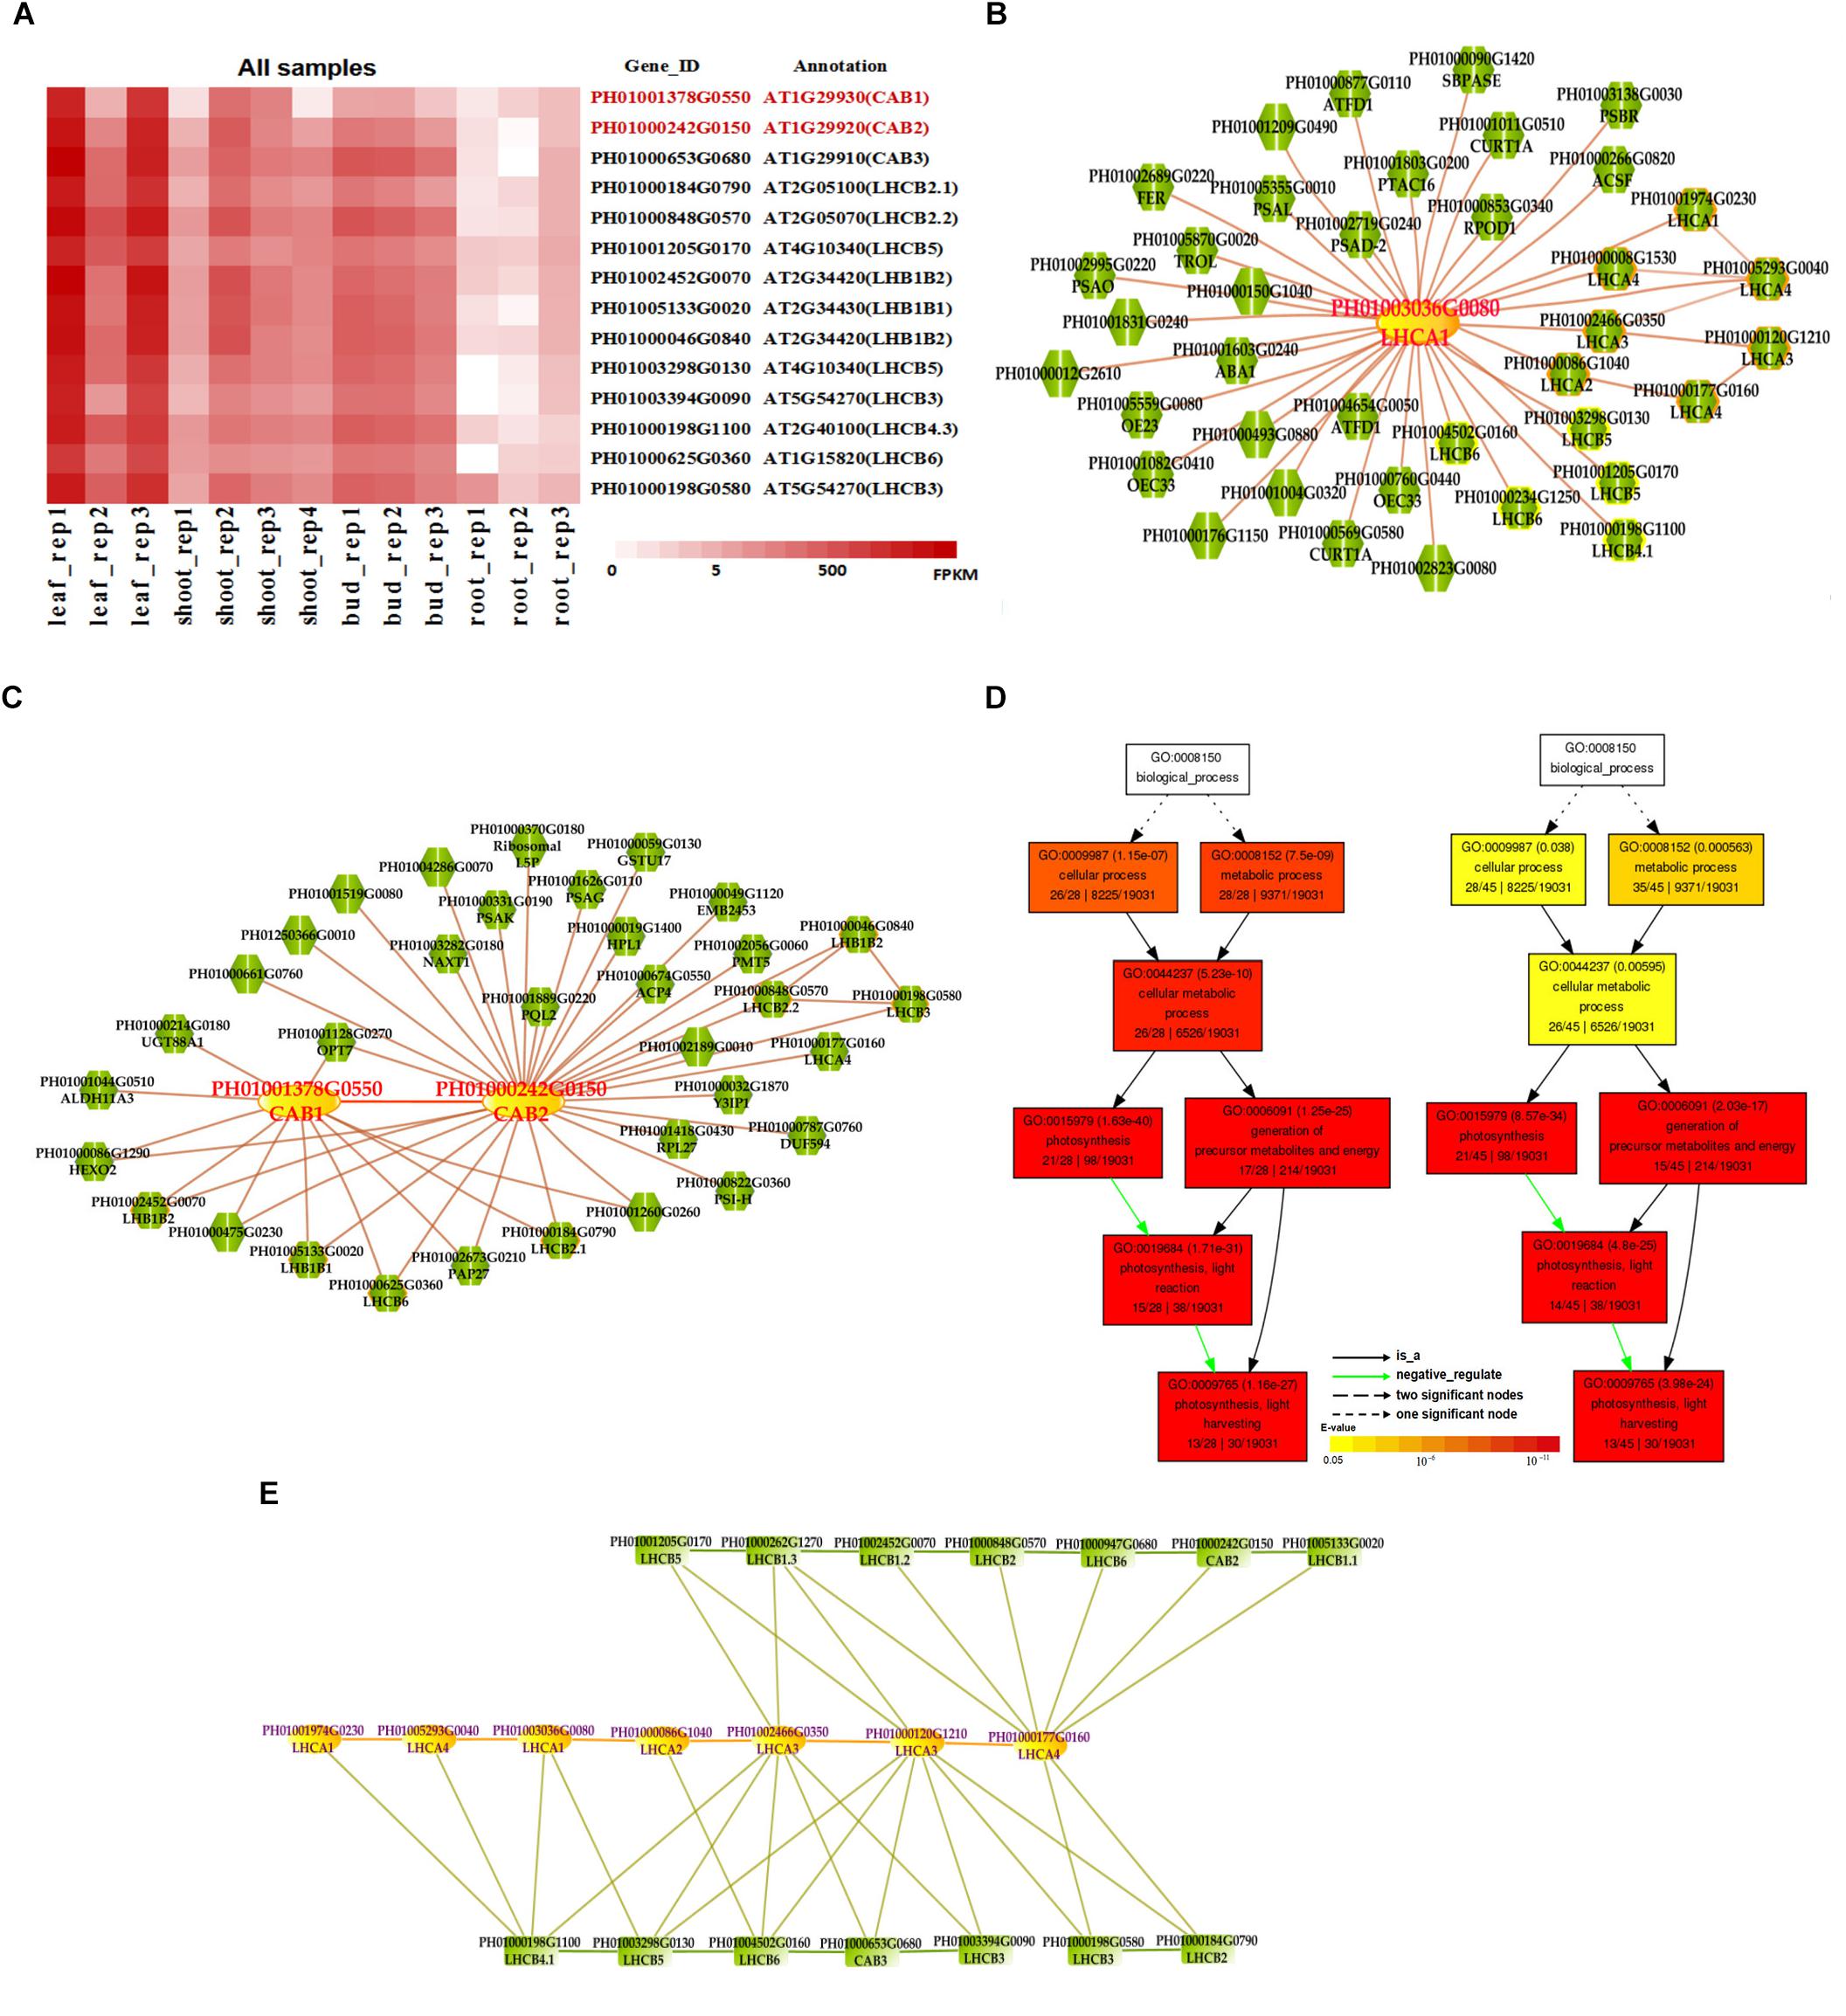
FIGURE 1. The global co-expression network analysis of bamboo light-harvesting complex genes of photosystem I and photosystem II. (A) Heatmap of LHCB genes expressed in leaf, shoot, bud, and root samples. (B) A global co-expression network of the gene LHCA1 (PH01003036G0080) in bamboo. The other LHCA genes are highlighted with orange borders, while nodes with yellow borders are LHCB genes. (C) A global co-expression network of CAB1 (PH01001378G0550, LHCB1.3) and CAB2 (PH01000242G0150, LHCB1.1). The other LHCB genes are also highlighted with orange borders. (D) GO enrichment analysis (left) of all genes from the global co-expression network for LHCA1 (PH01003036G0080) and GO enrichment analysis (right) of all genes from the global co-expression network for CAB1 (PH01001378G0550) and CAB2 (PH01000242G0150) by agriGO. (E) The co-expression network between genes LHCA and LHCB in bamboo.
In addition, we also searched the co-expression network of photosynthesis-related genes in the conditional co-expression network. We performed the same procedure for the global network analysis as in the conditional network of LHC genes. The gene expression views in the conditional network (Figure 2A) showed a similar tendency to those in the global network. Meanwhile, we conducted GO enrichment analysis of all genes from the conditional co-expression network for LHCA1 (PH01003036G0080), CAB1 (PH01001378G0550) and CAB2 (PH01000242G0150) by agriGO (Du et al., 2010; Tian et al., 2017). The GO terms were associated with photosynthesis, light reaction and light harvesting (Figure 2D). In addition to overlaps, the conditional co-expression network had some specific genes that were different from the global network (Figures 2B,C).
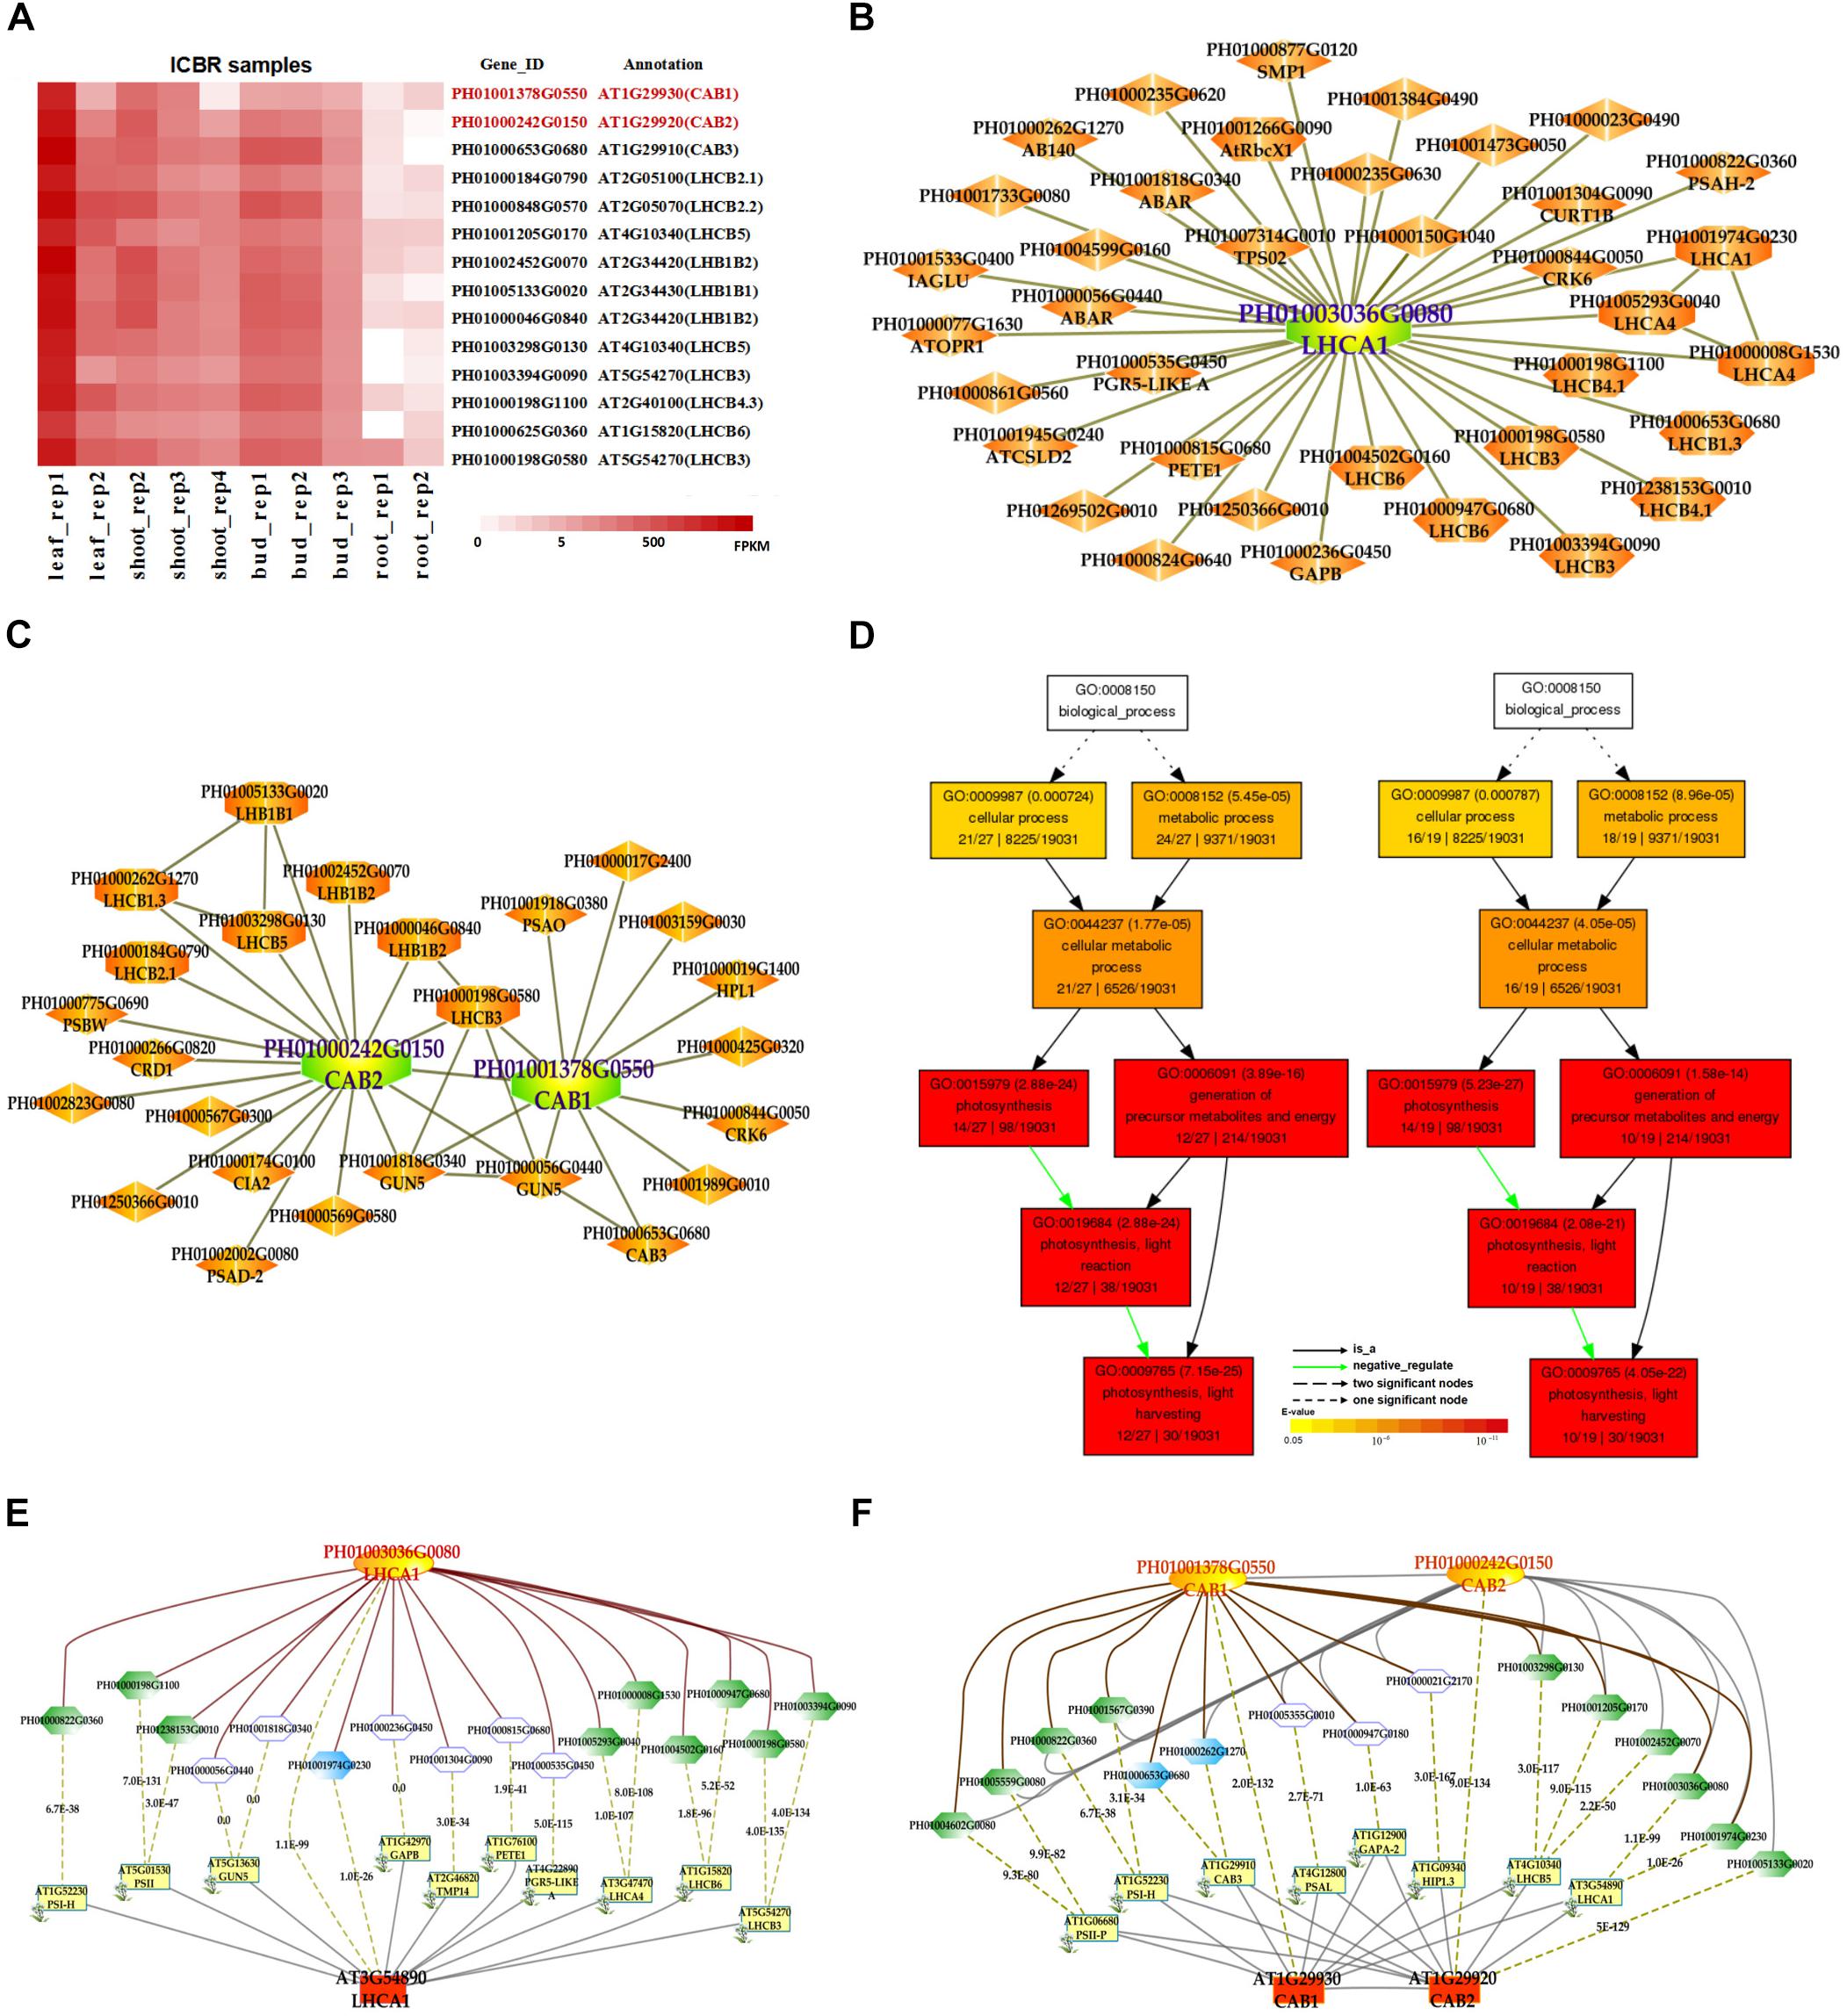
FIGURE 2. The conditional co-expression network analysis of bamboo light-harvesting complex genes of photosystem I and photosystem II. (A) Heatmap of LHCB genes expressed in conditional leaf, shoot, bud, and root samples. (B) A conditional co-expression network of the gene LHCA1 (PH01003036G0080) in bamboo. The other LHCA genes are highlighted with orange borders, while nodes with yellow borders are LHCB genes. (C) A conditional co-expression network of CAB1 (PH01001378G0550, LHCB1.3) and CAB2 (PH01000242G0150, LHCB1.1). The other LHCB genes are also highlighted with orange borders. (D) GO enrichment analysis (left) of all genes from the conditional co-expression network for LHCA1 (PH01003036G0080) and GO enrichment analysis (right) of all genes from the conditional co-expression network for CAB1 (PH01001378G0550) and CAB2 (PH01000242G0150) by agriGO. (E) Comparison of conditional co-expression networks between LHCA1 in bamboo and AT3G54890 (LHCA1) in Arabidopsis. Dotted lines link orthologous pairs between the two species, and the numbers in the middle of the dotted lines are the E-values of the BLAST results. (F) Comparison of conditional co-expression networks between CAB1 and CAB2 in bamboo and AT1G29930 (CAB1) and AT1G29920 (CAB2) in Arabidopsis. Dotted lines link orthologous pairs between the two species, and the numbers in the middle of the dotted lines are the E-values of the BLAST results.
Comparative genomics might help to construct and identify functional modules in bamboo. We made a comparison between the top 300 PCC co-expressed genes in bamboo and in Arabidopsis (collected from ATTED-II and AraNet) (Figures 2E,F). The co-expression networks of PH01003036G0080 and AT3G54890 (LHCA1) showed high similarity, suggesting the reliability of our bamboo co-expression network.
Network Analysis of Genes Related to Brassinosteroid Biosynthetic and Signal Transduction Pathways
Phytohormones are indispensable in plant development and various environment adaption (Lacombe and Achard, 2016). BRs are a group of plant steroidal hormones that play vital roles in almost all aspects of plant growth and development (Du et al., 2017). Several key enzymes in BR biosynthesis pathways have been found in Arabidopsis, such as DET2/DWF6, CYP90B1/DWF4, CYP90A1/CPD/DWF3, CYP90C1/ROT3, CYP90D1, and CYP85A2/BR6OX2 (Fujioka et al., 1997; Choe et al., 1998; Yukihisa et al., 2003; Kim et al., 2005; Ohnishi et al., 2012). First, we searched the global network for gene PH01003419G0030 (orthologous gene of CYP90A1/CPD/DWF3), PH01000278G0580 (orthologous gene of CYP85A1/BR6OX1), PH01001995G0390 (orthologous gene of CYP85A2/BR6OX2), and PH01003429G0090 (orthologous gene of CYP90D1) (Figure 3A). Second, we conducted GSEA analysis of GO, gene family, PlantCyc and KEGG categories for all genes from this global network by using PlantGSEA (Yi et al., 2013) (Figure 3C). The GO terms of BR biosynthetic process, BR metabolic process and steroid biosynthetic process were significantly enriched, suggesting that this network corresponds to the BR biosynthetic pathway and the genes from this network may be involved in BR biosynthesis in bamboo. Third, we chose the genes CYP85A1/BR6OX1 and CYP85A2/BR6OX2 in bamboo and their top 300 co-expressed genes and compared them with their orthologous genes and their top 300 from ATTED-II in Arabidopsis (Figure 3B). There were many orthologous gene pairs between them, which could indicate these co-expressed genes were conserved and increased the credibility of predicting BR biosynthetic functional modules in bamboo. We also searched the global network for PH01000234G0890 (orthologous gene of BAK1, also known as BRI1-associated receptor kinase), PH01000584G0630 (orthologous gene of BIN2, also known as BR-insensitive 2) and their co-expressed genes (Figure 3D). With the GO enrichment analysis by agriGO on all the genes from this network, some GO terms were enriched such as the BR-mediated signaling pathway, steroid hormon mediated signaling pathway and responses to steroid hormone stimuli (Supplementary Figure S4).
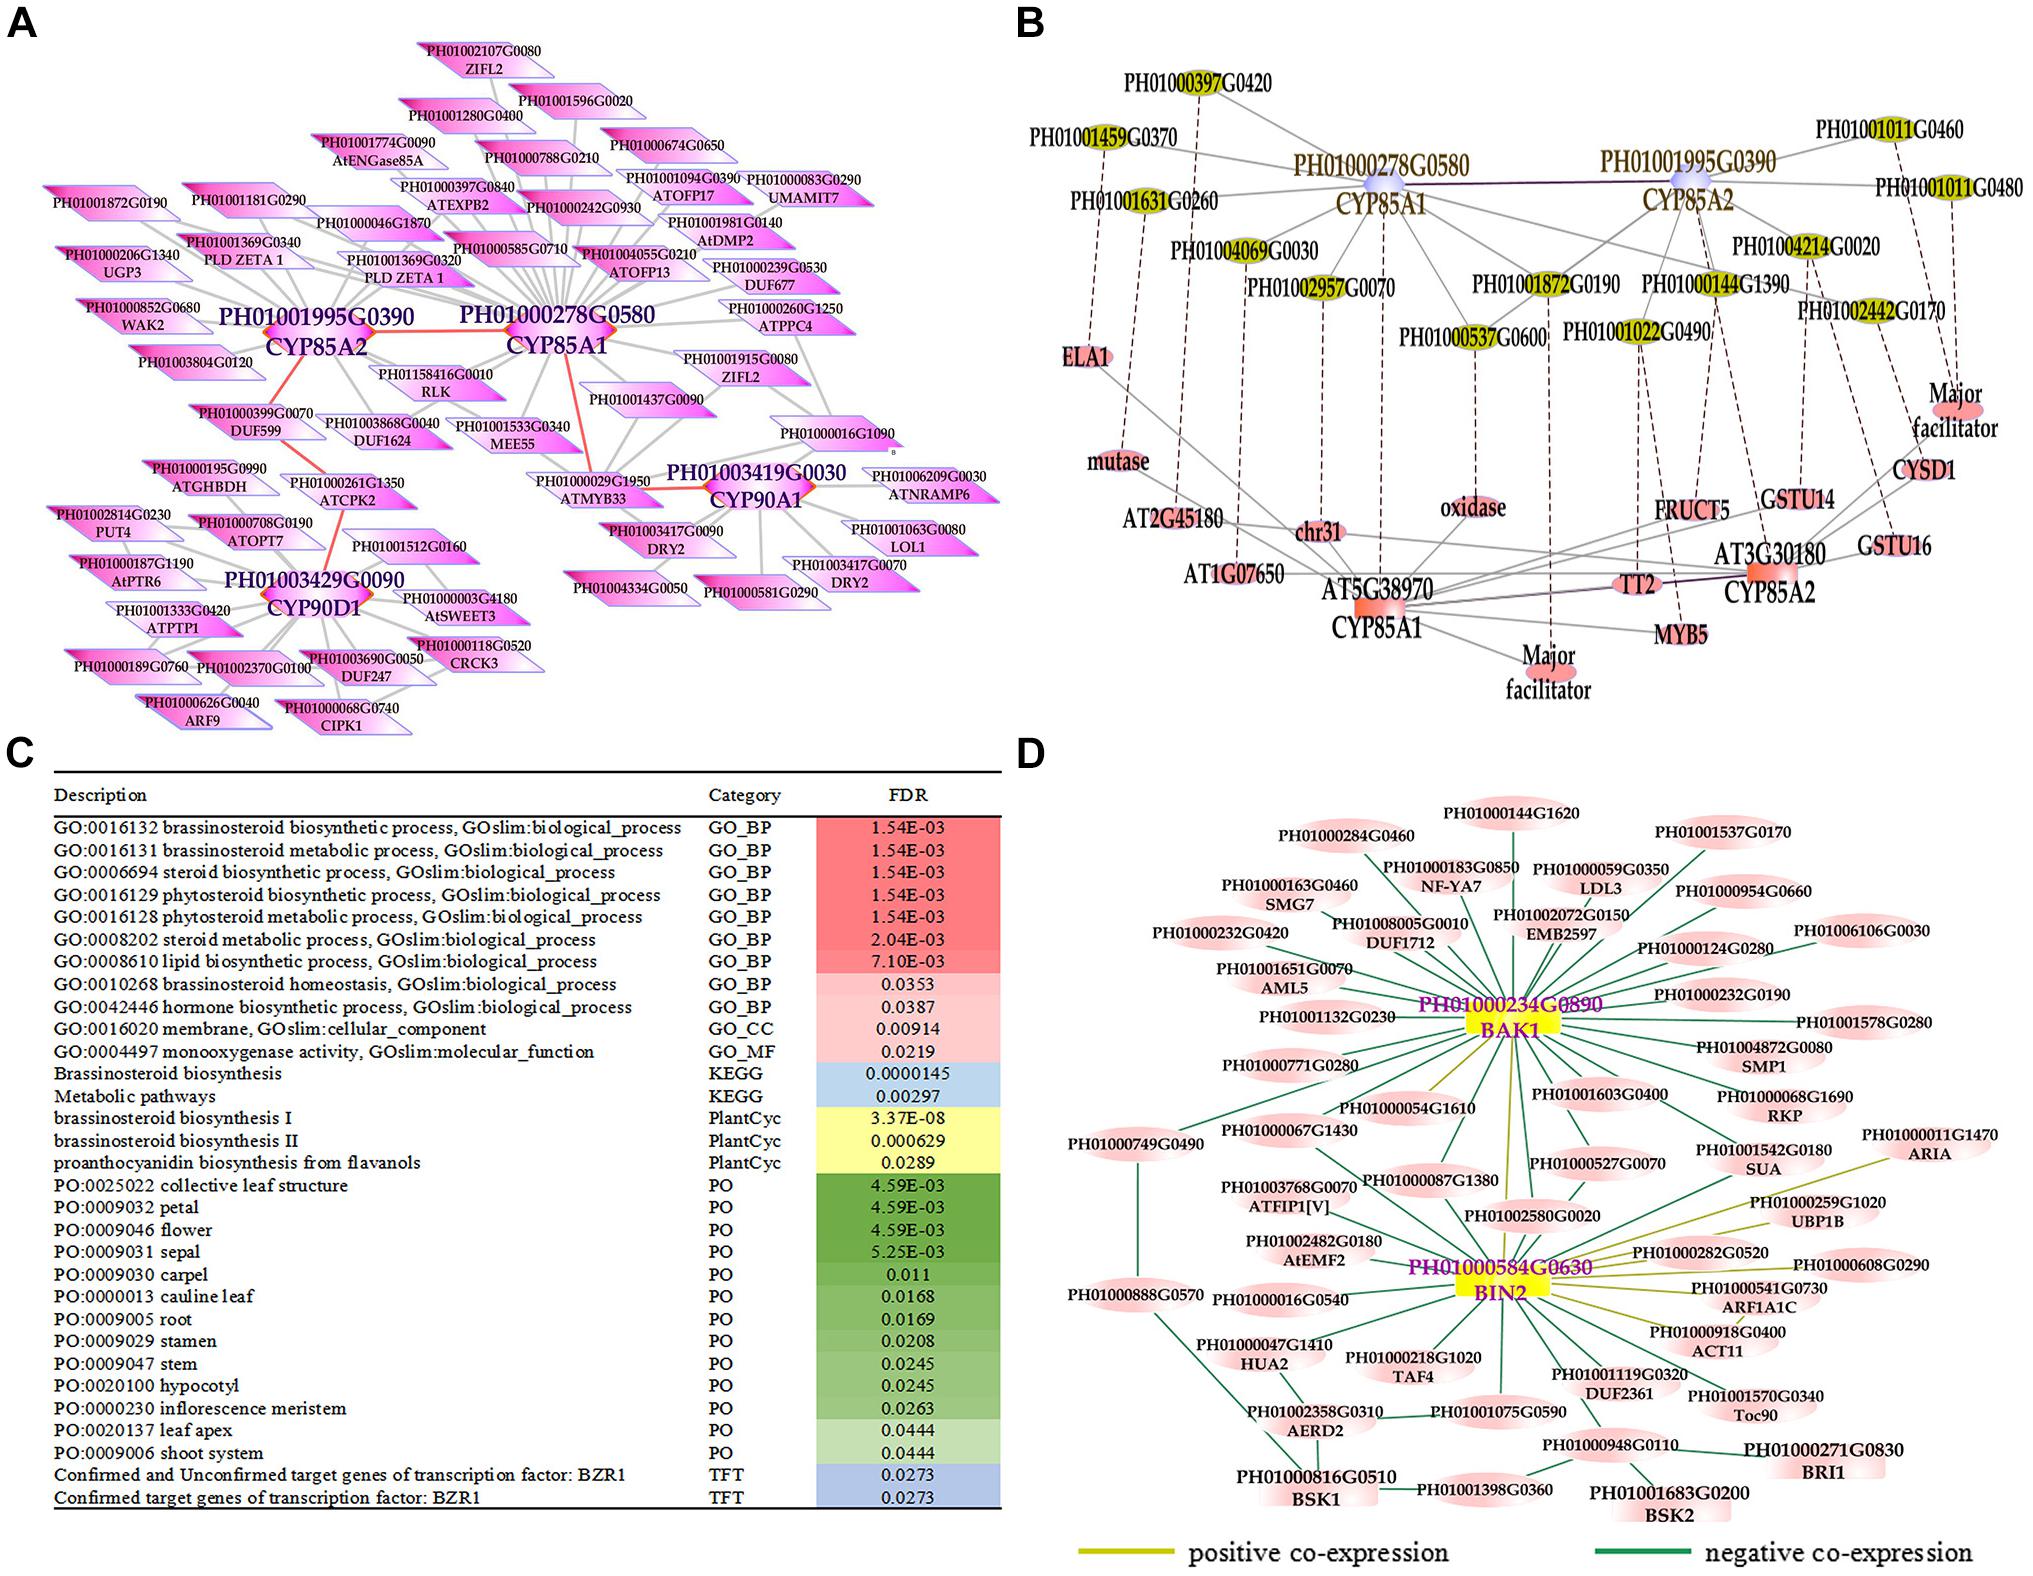
FIGURE 3. The global co-expression network analysis of bamboo brassinosteroid (BR) biosynthesis genes and signal transduction genes. (A) A global co-expression network of BR biosynthesis genes CYP85A1 (PH01000278G0580), CYP85A2 (PH01001995G0390), CYP90A1 (PH01003419G0030) and CYP90D1 (PH01003429G0090) in bamboo. (B) Comparison of global co-expression networks between BRs biosynthesis genes CYP85A1 and CYP85A2 in bamboo and AT5G38970 (CYP85A1) and AT3G30180 (CYP85A2) in Arabidopsis. Dotted lines link orthologous pairs between the two species. (C) GSEA analysis of all genes from Figure 3A. The results shown in this table list the description, category and FDR value. The red bar on the right represents the FDR value of the enriched GO terms. The darker the red color becomes, the lower the FDR value is. Other colored bars, including blue, yellow, green, and purple bars, represent KEGG pathways, Plantcyc, PO terms and TFT, respectively. (D) A global co-expression network of BR signal transduction genes BAK1 (PH01000234G0890) and BIN2 (PH01000584G0630) in bamboo. A yellow line between two nodes indicates a positive co-expression relationship, and a green line between two nodes indicates a negative co-expression relationship.
Co-expression Network Analysis of Secondary Cell Wall Biosynthesis
Transcription factors in the NAC family, including VNDs, SNDs, and NSTs, acting as master switches for SCW thickening, play important roles in the SCW formation process, including the deposition of hemicellulose, cellulose and lignin (Table 3). MYB46 directly binds to the promoters and activates the transcription of genes involved in lignin and xylan biosynthesis, functioning as a central and direct regulator of the genes involved in the biosynthesis of all three major secondary wall components in Arabidopsis (Kim et al., 2013, 2014a). Thus, we selected some key NAC and MYB TFs to study their functions in regulating SCW formation and strong lignified culms in bamboo (Table 4). The gene expression profiling of SCW-related NAC family genes was statistically analyzed with the Z-score test in ICBR samples. The hierarchical cluster results of these genes demonstrated that NST/SND genes were highly expressed in the bamboo shoot compared to other tissues (Figure 4). We searched the constructed global and conditional networks with a gene expression view for these clustered NAC genes. The networks might indicate the possible regulatory mechanism of the SCW thickening process during bamboo development (Figure 5).
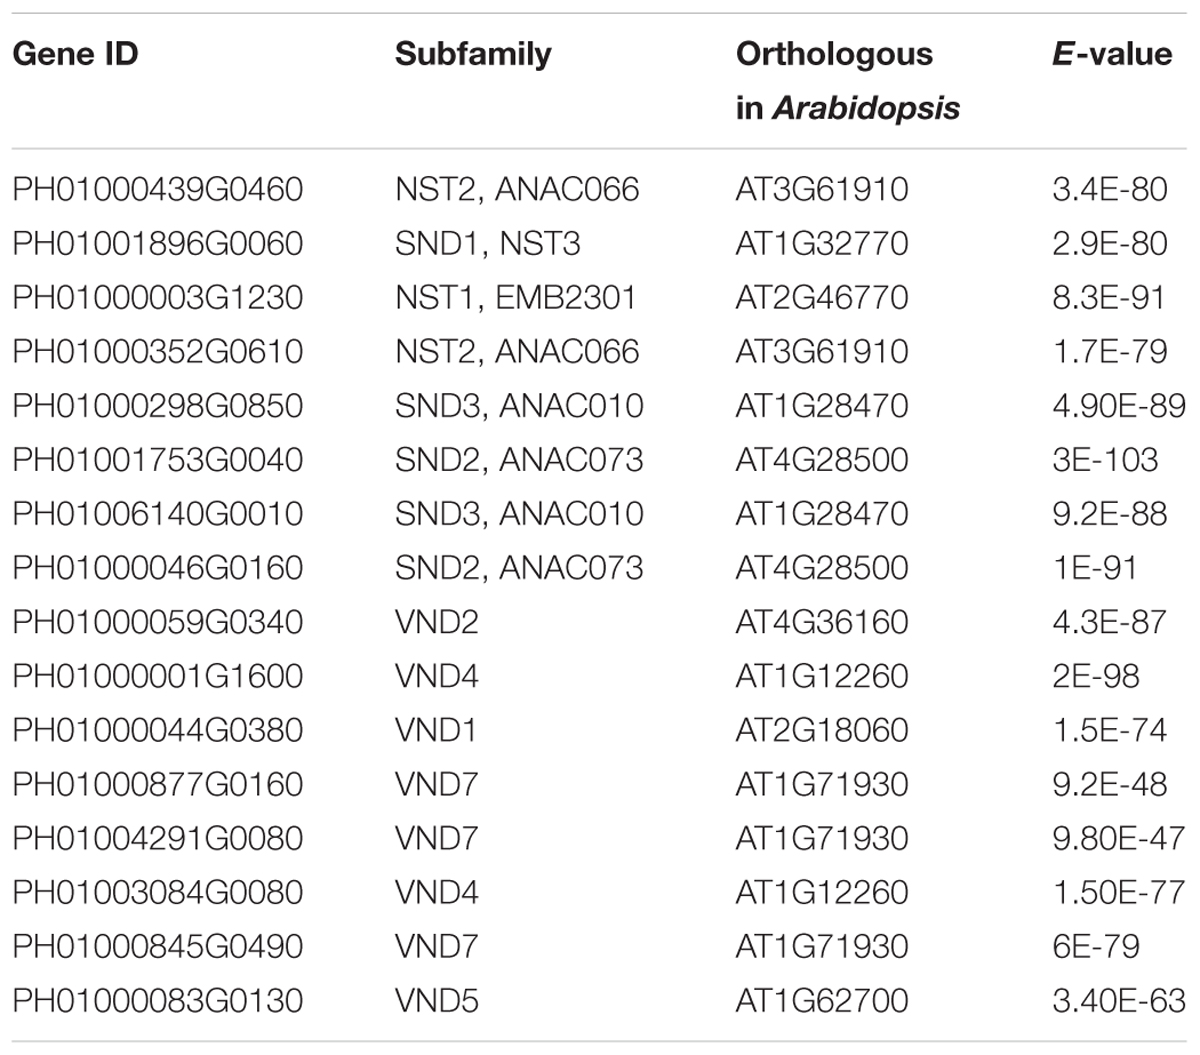
TABLE 3. Information of NAC family in bamboo.
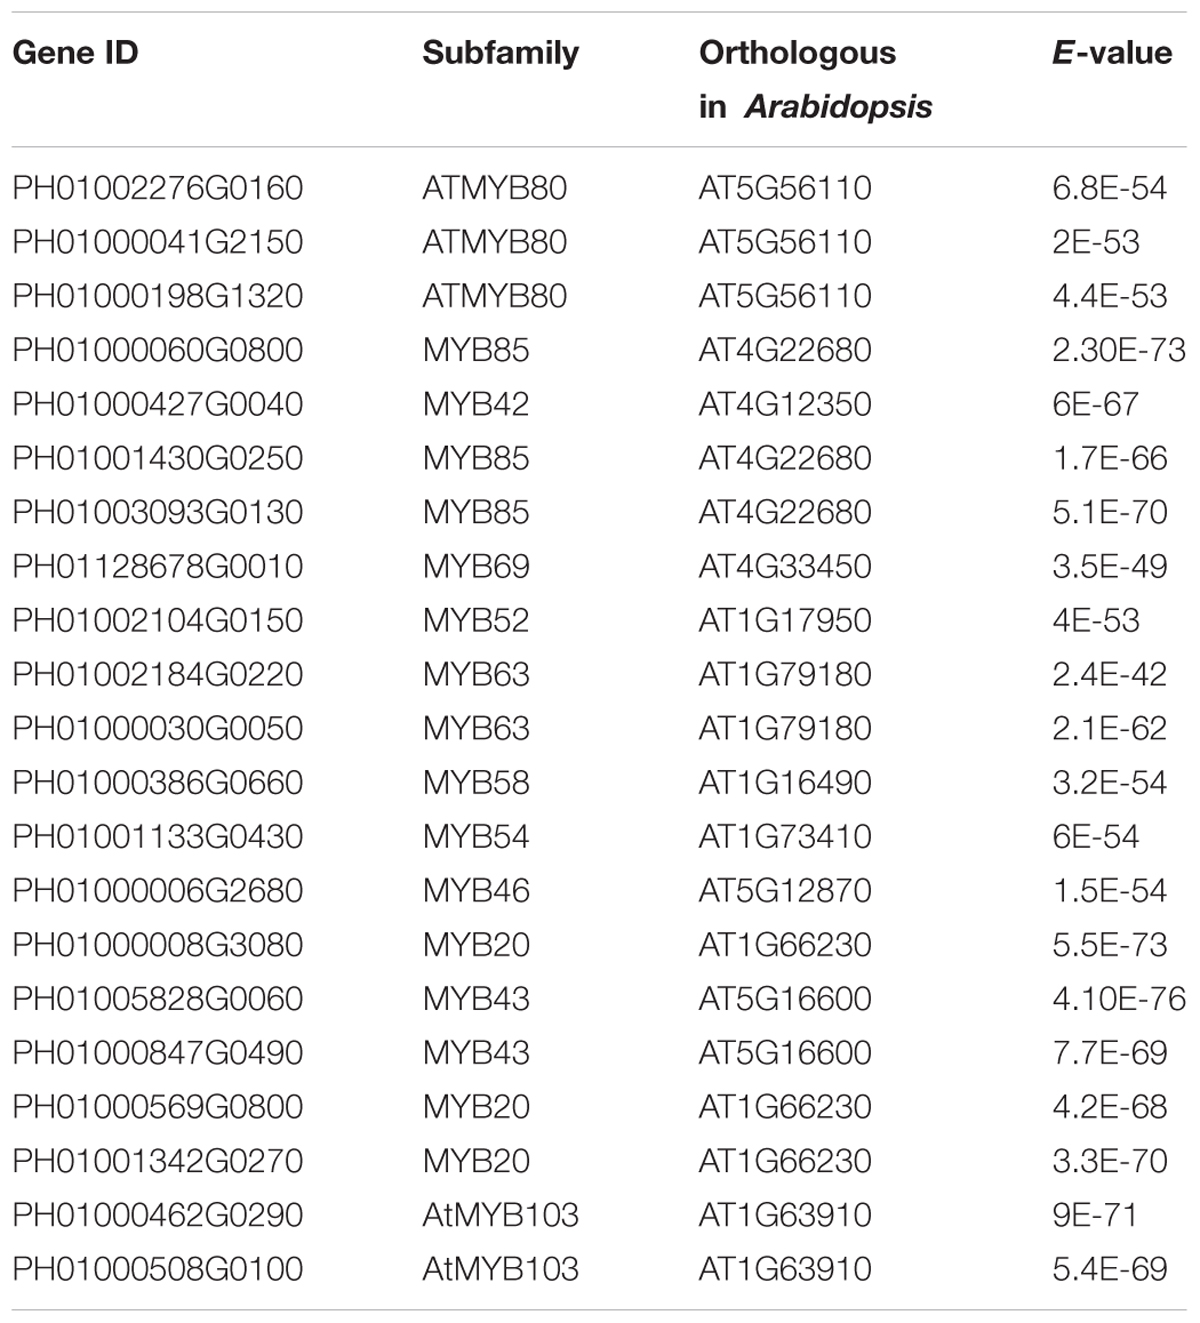
TABLE 4. Information of MYB family in bamboo.
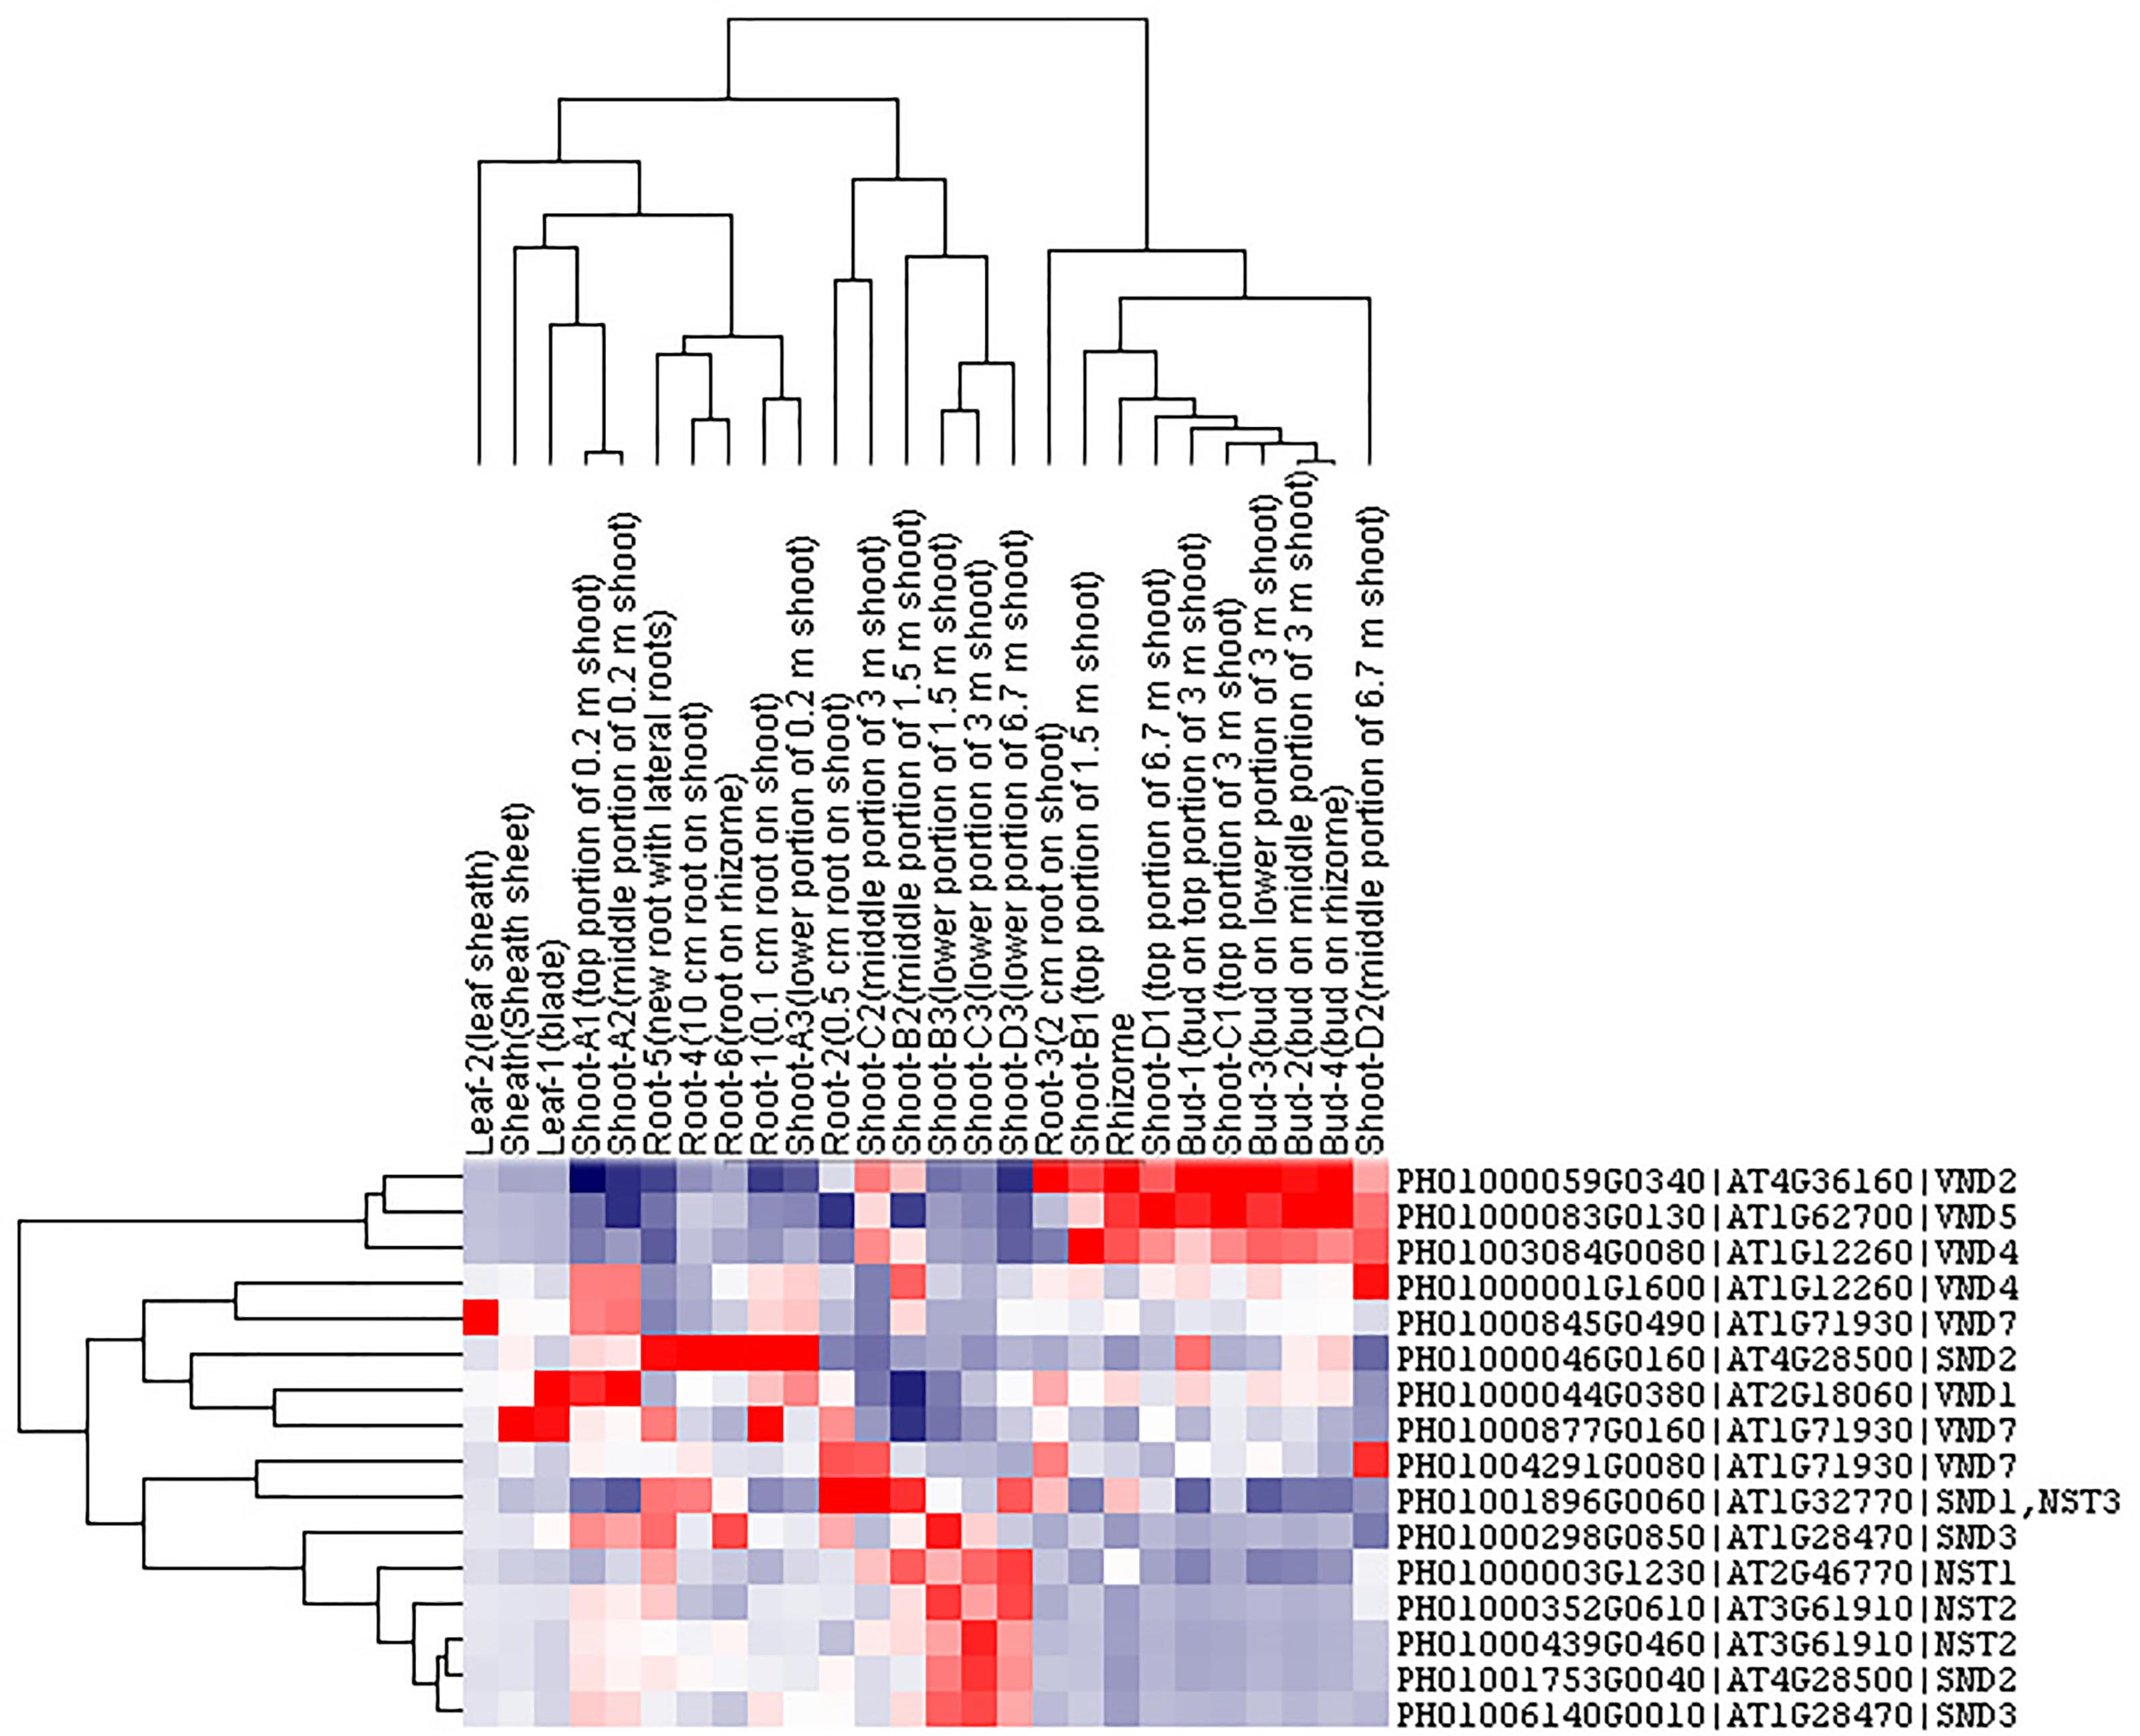
FIGURE 4. Cluster analysis of SND, NST and VND genes from ICBR samples of bamboo. The gene names are indicated on the right, while the tissue types are shown above each column. High, average and low levels of expression in a specific tissue are indicated by red, white, and blue, respectively.
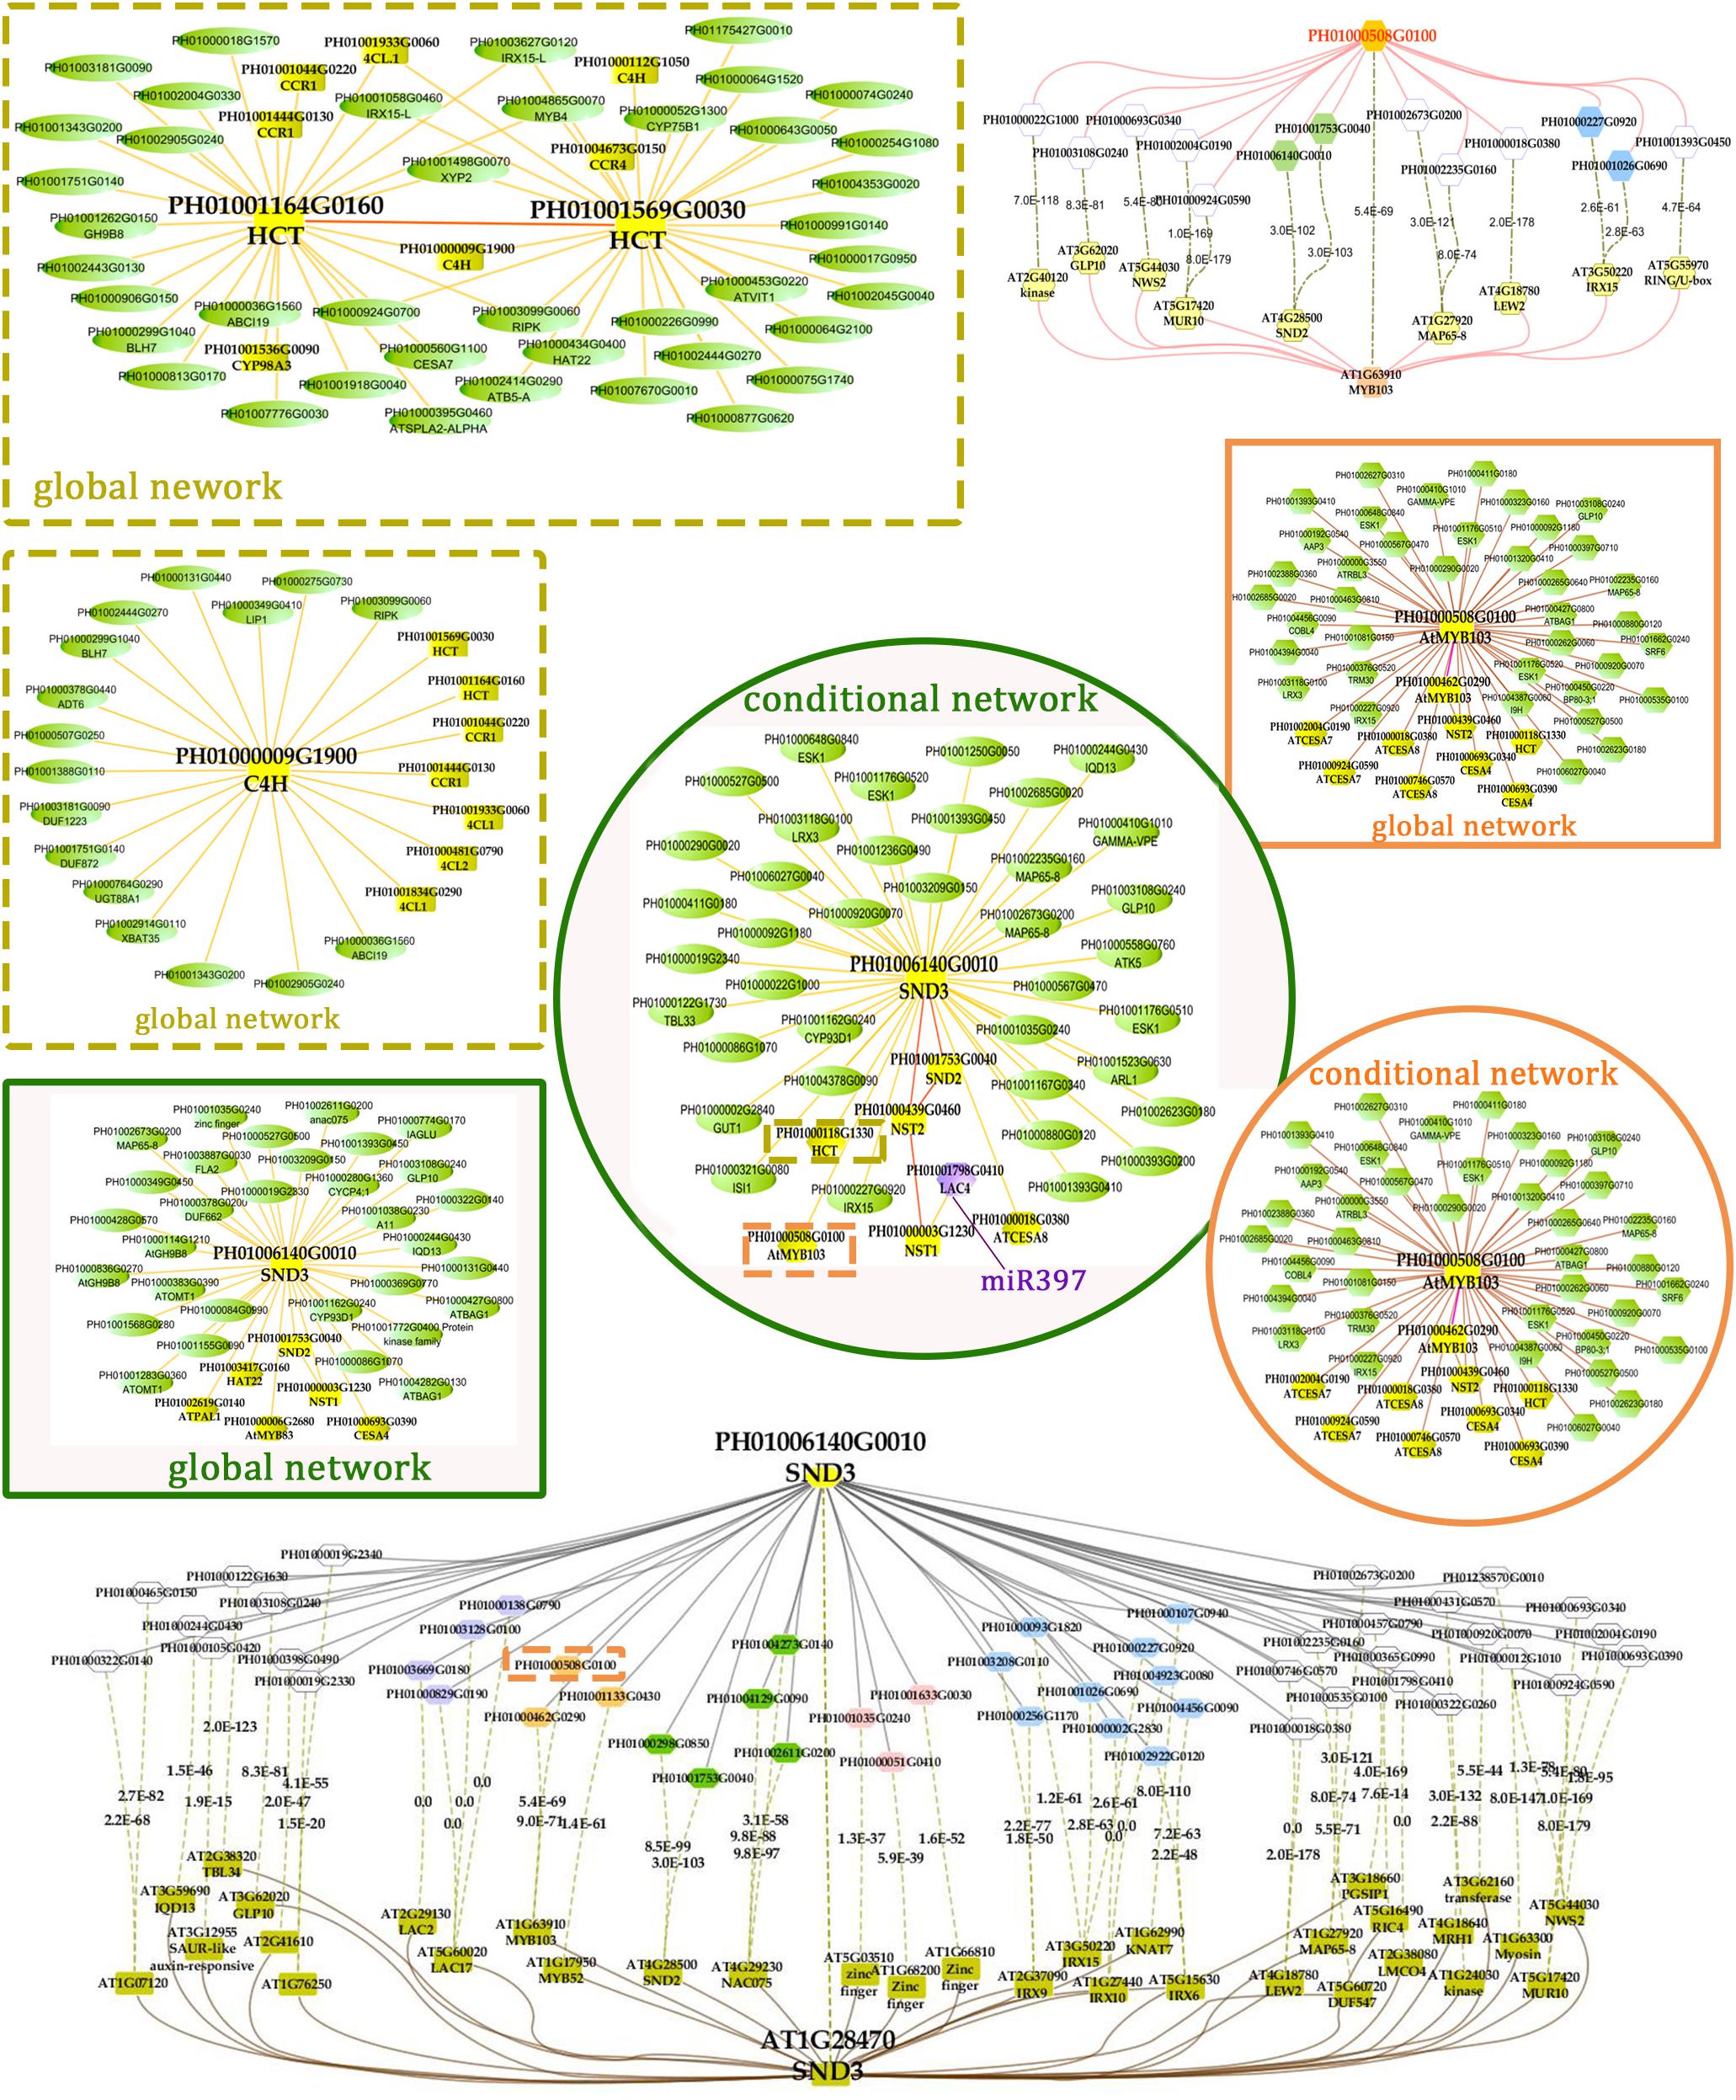
FIGURE 5. A co-regulatory network for NSTs/SNDs-related genes in bamboo. PH01006140G0010 (SND3) and PH01000508G0100 (orthologous to AtMYB103) were used to present regulatory networks with all samples (global network) and partial samples (conditional network). The rounded boxes represent conditional networks, while the rectangular boxes represent global networks. The networks for the genes PH01006140G0010 (SND3) and PH01000508G0100 (orthologous to AtMYB103) are in the boxes with green solid borders and orange solid borders, respectively. The networks for HCT (PH01001164G0160 and PH01001569G0030) and C4H (PH01000009G1900) are in the boxes with yellow-dotted borders. The comparison views of conditional co-expression networks are also shown. The gray edges link to SND3 in bamboo, and brown edges link to AT1G28470 (SND3) in Arabidopsis. The red edges link the AtMYB103 (AT1G63910) gene and orthologs of AtMYB103 in bamboo (PH01000508G0100). Dotted lines link orthologous pairs between the two species, and the numbers in the middle of the dotted lines are the E-values of the BLAST results. The NAC, MYB, zinc finger, IRX and LAC genes are highlighted with green, orange, pink, blue, and purple nodes, respectively. In the conditional co-expression network for PH01006140G0010 (SND3), the LAC4 gene PH01001798G0410 is highlighted in purple, which is a miR397 target gene.
In the conditional network, some NST/SND genes, such as PH01006140G0010 (SND3), PH01001753G0040 (SND2), PH01000439G0460 (NST2) and PH01000003G1230 (NST1), were co-expressed together with LAC4, one of the key SCW metabolism-related genes. Xu et al. (2014) has discovered that the putative targets of miRNA-397 are several family members of laccase precursors in bamboo, including the LAC4 gene PH01001798G0410. Additionally, SND3 was co-expressed with the IRREGULAR XYLEM gene IRX15 (PH01000227G0920), AtMYB103 in bamboo (PH01000508G0100), AtCESA8 in bamboo (PH01000018G0380) and the phenylpropanoid biosynthesis pathway gene HCT (PH01000118G1330).
In the global network, SND3 was co-expressed with SND2 and NST1, CESA4, HAT22, PAL1 and an ortholog of AtMYB83 in bamboo (PH01000006G2680). In Arabidopsis, both MYB46 and MYB83 act in the regulation of secondary wall biosynthesis by binding to the promoters of the xylan and lignin biosynthetic genes (Mccarthy et al., 2009; Kim et al., 2014b).
With regard to the global network for PH01000508G0100 (orthologous gene of AtMYB103), the co-expressed genes were mainly HCT, ATCESA7, ATCESA8, CESA4, and some NAC genes SND2, SND3. There were a few specific co-expressed genes, the NAC gene NST2 and another ortholog of AtMYB103 in bamboo (PH01000462G0290). Meanwhile, we supplied a visualization of global networks for some genes related to the phenylpropanoid biosynthesis pathway, such as PH01001164G0160 (orthologous gene of HCT), PH01001569G0030 (orthologous gene of HCT) and PH01000009G1900 (orthologous gene of C4H) (Figure 5). These genes were also co-expressed with some genes related to phenylpropanoid biosynthesis pathways, including CCR1, CCR4, 4CL1, 4CL2, and CYP98A, whose promoter regions share a cis-acting motif called ‘AC element’ that is recognized by MYB58 and MYB63 in Arabidopsis (Zhou et al., 2009). Through motif analysis of 3 kb of these bamboo genes’ promoter regions, the ‘AC element’ was found to be significantly enriched.
To increase the reliability of networks in bamboo, we further made a comparison between the top 300 PCC co-expressed genes of SND3 and MYB103 in Arabidopsis (from ATTED-II) and those in bamboo. Plenty of orthologous gene pairs in SND3 network comparison could be grouped into several sections, such as LAC genes, MYB genes, zinc finger genes, IRX family genes and other NAC genes. Generally, our co-expression network analysis, together with the cis-element and GO enrichment analyses, efficiently identified components and recapitulated a regulatory module of the SCW biosynthetic process.
A Combination of Several Functional Regulatory Modules Related to Bamboo Development
The function modules contained nodes that were more densely connected to each other than to nodes outside the group in bamboo co-expression networks. We identified an important functional module related to photosynthesis by co-expression network analysis, and the function of this module was predicted to associate with photosynthesis and light harvesting (FDR: 2.00E-8) by GSEA (Figure 6). We also identified functional modules related to BR biosynthetic pathways (FDR: 1.83E-3) and diterpenoid biosynthetic pathways (FDR: 6.18E-3) based on a similar approach (Figure 6). In addition, three regulatory modules were found to possibly participate in phenylpropanoid biosynthetic pathways. For example, one functional module was significantly related to phenylpropanoid biosynthesis (FDR: 1.07E-7) and flavonoid biosynthesis (FDR: 0.02), including PH01000009G1900 (orthologous gene of C4H), PH01001044G0220 (orthologous gene of CCR1), and PH01001444G0130 (orthologous gene of CCR1).
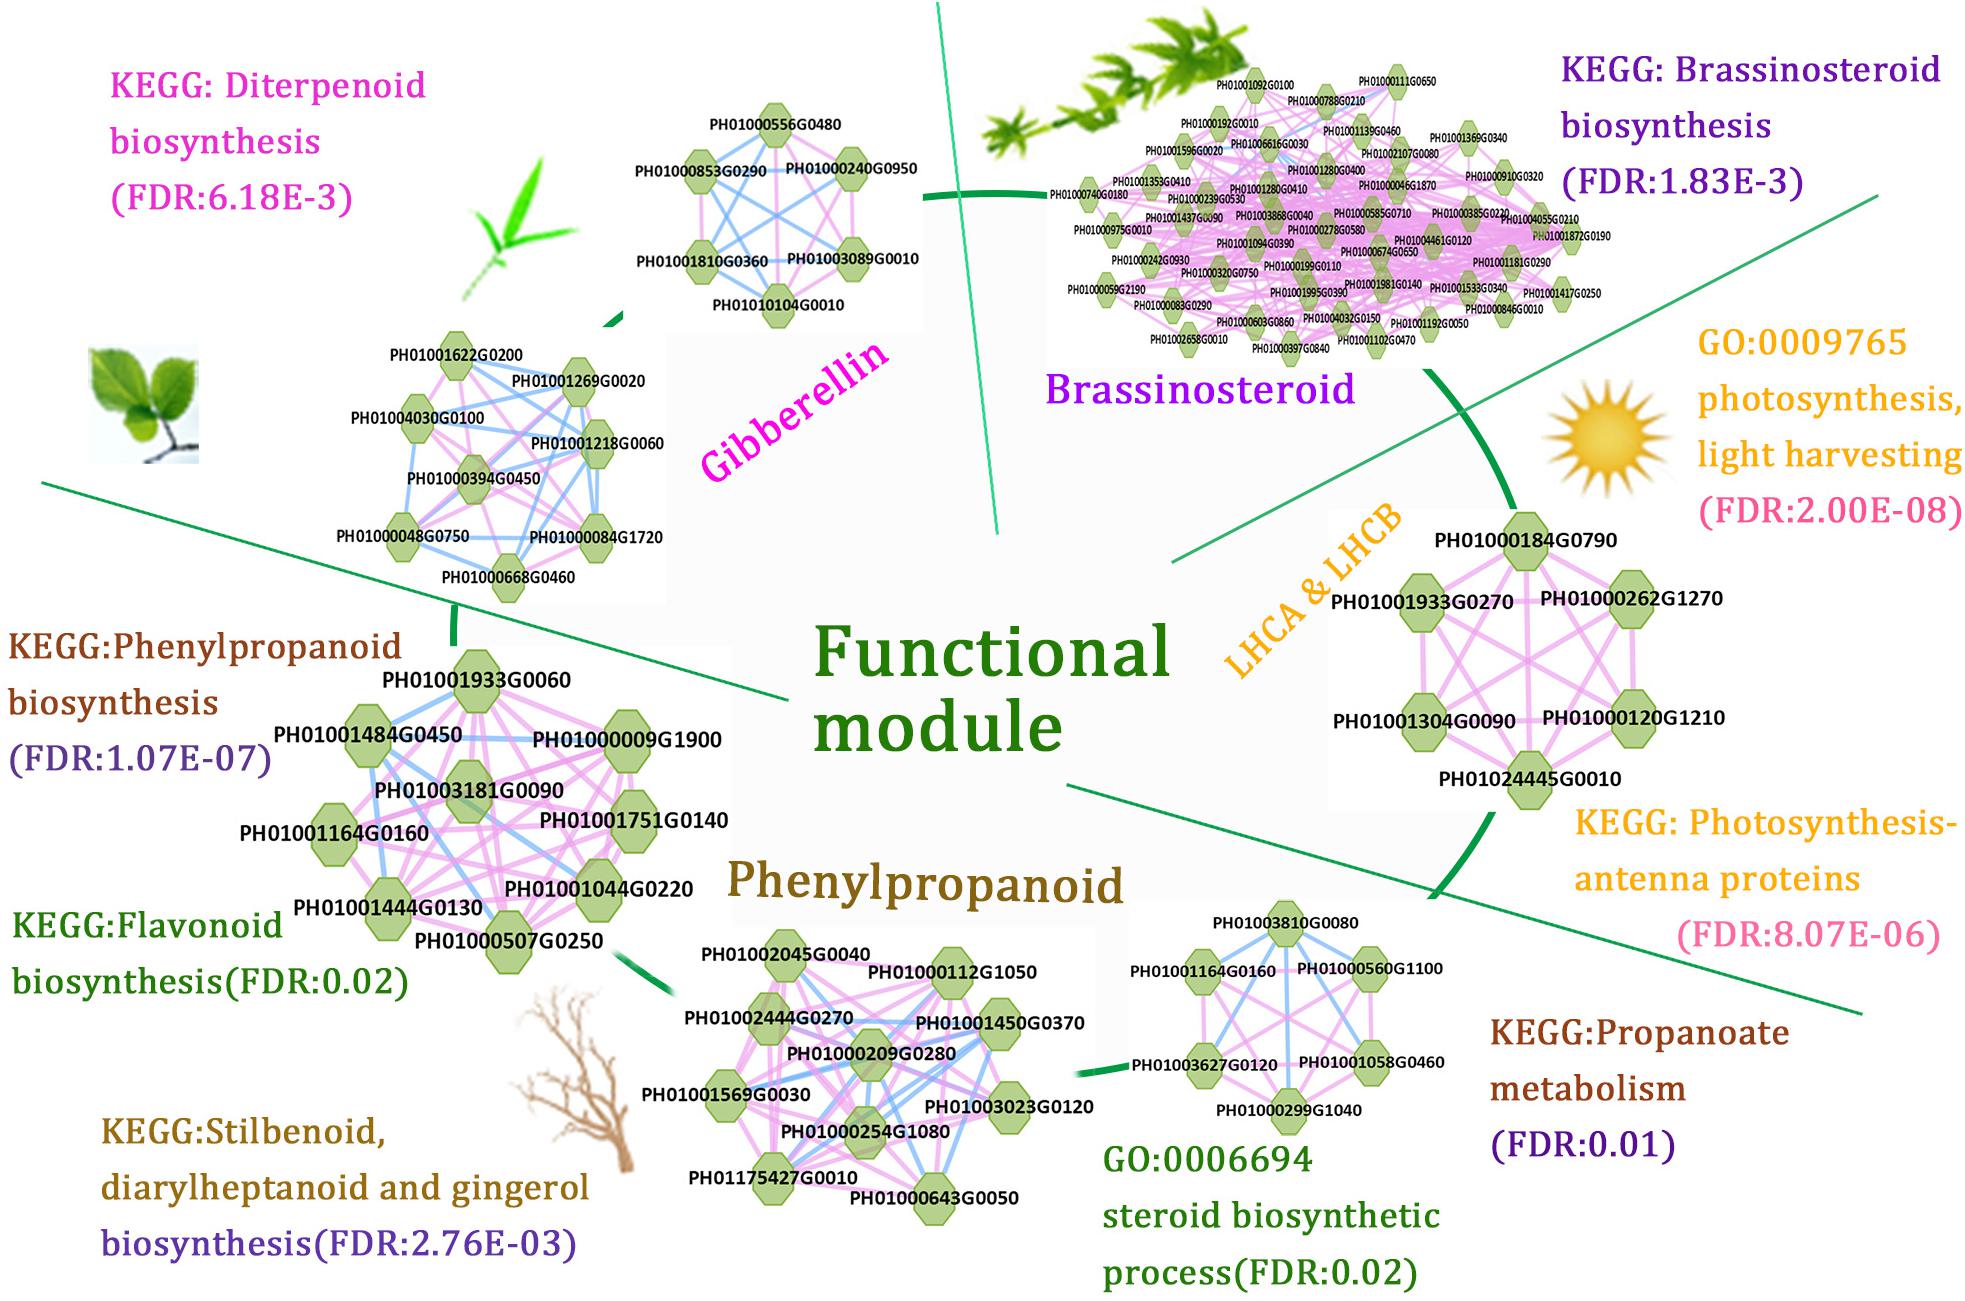
FIGURE 6. A combination of functional regulatory modules related to bamboo development through module prediction. The functions of the modules were predicted through integrating annotations such as GO, gene families (transcription regulators, kinases, and carbohydrate-active enzymes), and KEGG, and non-significant entries were filtered by the Fisher test and multiple hypothesis testing (FDR ≤ 0.05). The different modules with similar functions are in the same section.
We further combined several regulatory gene modules that were identified and conducted module analysis of functions related to fast growth of bamboo culms (Figure 6). All these modules were related to bamboo growth and development, such as photosynthesis, BR biosynthesis, and phenylpropanoid biosynthesis. Among the different modules related to phenylpropanoid biosynthesis, the connected node (PH01001164G0160, orthologous gene of HCT) could play a vital role in the regulatory pathway based on its co-expression network analysis. The connections between functional modules could represent crosslinks between different modules related to the similar function or different pathways. Thus, modules with nodes connected to other modules were selected and displayed in the database to help to further study their key functions. Accordingly, the combination of these functional modules displayed a series of possible key genes from hormone signals to culm development, mimicking the dynamic regulatory process in bamboo and highlighting the connections between these nodes in regulatory modules during growth stages.
Online Co-expression Network Database for Moso Bamboo
Here, we developed the BambooNET database, a platform with co-expression network analysis, cis-element analysis and GSEA tools and provided an online server for gene functional module analyses in multi-dimensional co-expression networks for moso bamboo (Phyllostachys edulis), which will help to refine annotation of bamboo gene functions. In this database, different categories of the co-expression network can be selected to visualize using the Cytoscape web tool, including the global network and the conditional network, which includes a search function for either a single gene or a list of genes. Notably, there are three main analysis options in the co-expression network platform: positive relationship, negative relationship and predicted protein-protein interaction relationship. In the tissue-preferential analysis, there are eight tissues, namely, the shoot, root, culm (stem), leaf, panicle, bud, rhizome and sheath. In addition, the gene expression changes of a certain sub-network among different tissues can be clearly observed. The stress-differential analysis displays not only the differences in gene expression between 2 and 8 h under dehydration and cold stress but also the fold changes of gene expression after each stress treatment. In the view of the network, the nodes in red or blue represent up- or down-regulated genes in leaves after a stress treatment, respectively. Moreover, some tools in this platform are available for the gene lists from the selected specific network to analyze, annotate and identify some functional modules, besides gene set analysis (Yi et al., 2013) and UCSC Genome Browser (Speir et al., 2016), such as BLAST search, keyword search and module enrichment analysis, comprising co-expression network and miRNA-target network. The website can be accessed at http://bioinformatics.cau.edu.cn/bamboo.
Discussion
In this study, we constructed a genome-level co-expression network containing more than 90% of predicted genes and 487,427 positive and negative edges with existing transcriptome data on bamboo. The samples cover most of the development stages of bamboo growth and development, such as the root, leaf, culm (stem), and shoot. In addition, a network-based platform, covering global, conditional and predicted protein-protein interaction networks, has been built successfully to refine the annotation of bamboo genes or modules with functions related to bamboo growth and development. Through the data mining system, networks of various aspects have combined with several functional analysis tools, including ortholog annotation, gene family classification, cis-element analysis and GO analysis, to evaluate the reliability of the predictions.
Although the whole-genome sequence of moso bamboo has been released, the genome annotation is still far from complete. For these sparsely annotated genes, compared with the study of single-gene identifications, modules are a valuable resource for predicting gene function. Combined with genes from co-expression networks, it would be interesting to identify modules associated with the biological process of bamboo growth and development. The potential functional modules related to phytohormones can display the module functions for BR biosynthetic pathways (FDR: 1.83E-3) and diterpenoid biosynthetic pathways (FDR: 6.18E-3) by GSEA analysis of KEGG pathways (Figure 6). These tightly linked genes within the one module may have related key biological functions in the process of fast growth in bamboo and can be used for genetic improvement and molecular regulatory mechanisms of moso bamboo. There is great potential for producing a large number of mutant traits of target genes related to bamboo growth and development using the clustered regularly interspaced short palindromic repeats (CRISPR)-associated protein 9 (CRISPR/Cas9)-based genome-editing systems. Natural variants of these genes in different bamboo species may also be favorable for genetic improvement of traits in crops. Compared with the model plant Arabidopsis, the similar functions of orthologous genes have validated the credibility of the above network analysis and module implications based on the network comparison between Arabidopsis and bamboo (Figure 3B).
The co-expression networks with different samples are usually different. An ideal method should be able to incorporate global networks and conditional networks for different samples. Compared with all samples, there is much less diversity and far more comparability between ICBR samples (Supplementary Figure S3). Moreover, all ICBR samples should be classified as vegetative tissues, which may have parts specifically related to fast growth and the development of shoot and culm. For the co-expression networks for LHC genes (Figures 2B,C), the genes between global and conditional networks have their differences and overlaps. Therefore, the conditional co-expression network together with the global network can be complementary and then imitate the potential LHC genes’ regulatory mechanism of fast-growth stage in bamboo. Specifically, we also investigated whether network modules are associated with specific tissue types and are enriched for specific biological process analysis by agriGO based on cluster analysis of SND, NST and VND genes between conditional samples (from ICBR) and global samples (all source) of bamboo. These genes are preferentially expressed within shoot tissues relative to all other tissue types in conditional samples (Figure 4), which would be essential in the growth of bamboo, especially the tissue shoot. For example, one regulatory module with the gene SND3 for SCW thickening was identified based on the conditional co-expression networks, which might indicate that these genes can fulfill their function in shoot development stages. Meanwhile, the global networks provided additional genes for further exploration of shoot tissue development.
Although BambooGDB (Zhao et al., 2014) has been integrated high-throughput sequencing data and provided researchers worldwide with a central genomic resource and an extensible analysis platform for bamboo genome, it is still necessary to build an online database for refining gene annotation and discovering novel gene functions. Through Cytoscape, our online bamboo co-expression database displays the multi-dimensional network structure and module enrichment for clear visualization and convenient analysis. Based on the co-expression network, the strategy for functional module prediction and refined gene function annotation is general and effective, so more regulatory modules could be identified by the same strategy based on a detailed biological focus or event, such as fast growth. We successfully identified 1,896 functional modules through the CPM method (Adamcsek et al., 2006), which can be searched and studied through the module enrichment in the database. These findings make it more convenient to understand the molecular regulatory mechanisms of bamboo’s vital developmental traits, extremely its fast growth, which can help to dissect the molecular biological processes of bamboo. In addition, the unannotated genes establish connections to their co-expressed genes and can be refined by functional module enrichment analysis to further study unknown functions with biological processes and discern gene transcriptional regulatory mechanisms in vivo with the help of gene expression view in different tissues. With our multi-dimensional co-expression network, more than 90% of unannotated bamboo genes might be predicted potential functions.
However, the results might be unsatisfactory owing to the lack of complete data sets on all kinds of tissues in bamboo development stages. We believe that the detection of function modules will become much more efficient with more comprehensive transcriptome data sets of moso bamboo. Furthermore, our online bamboo co-expression database will be improved to facilitate data visualization. We will further incorporate faster and more efficient tools, such as JBrowse (Buels et al., 2016), which are very convenient for genomic track data visualization. Finally, we expect to functionally characterize modules and to investigate how to alter modules to drive developmental changes across all developmental stages and how genes in these modules act in biological pathways.
Conclusion
Here, multi-dimensional bamboo samples and comparable computing measurements have been used to build a co-expression network to refine the annotation of bamboo genes or functional modules with important agronomic traits, such as growth processes. Meanwhile, module functional enrichment analysis tools, such as gene family classification, cis-element analysis and GO analysis, have been used to evaluate the reliability of the predictions. Based on the gene expression analysis and conditional network, the strategy for functional module prediction and refined gene function annotation is general and effective. Thus, more regulatory modules could be identified by the same strategy based on a detailed biological focus or event, such as fast growth. Therefore, this approach will improve our understanding of the molecular regulatory mechanisms underlying vital agronomic traits, such as growth and development. We hope that more transcriptome data will improve the network analysis for functional module identification and reduce biases or mistakes caused by its current limitations, increasing our understanding of bamboo growth and development.
Author Contributions
ZS, WX, and ZG designed the project. XM, HZ, WX, and HY performed the research. XM, QY, and WX analyzed the data and conducted the bioinformatics analysis. XM, HZ, WX, ZG, and ZS wrote the article.
Funding
This work was supported by grants from the National Natural Science Foundation of China (31771467 and 31371291).
Conflict of Interest Statement
The authors declare that the research was conducted in the absence of any commercial or financial relationships that could be construed as a potential conflict of interest.
Supplementary Material
The Supplementary Material for this article can be found online at: https://www.frontiersin.org/articles/10.3389/fgene.2018.00574/full#supplementary-material
Abbreviations
BR, brassinosteroid; CPD, CONSTITUTIVE PHOTOMORPHOGENESIS AND DWARFISM; CPM, clique percolation method; DET2, DE-ETIOLATED2; FDR, false discovery rate; FPKM, fragments per kilobase of transcript per million mapped reads; GO, Gene Ontology; GSEA, gene set enrichment analysis; ICBR, International Center for Bamboo and Rattan; KEGG, Kyoto Encyclopedia of Genes and Genomes; MR, mutual rank; PCC, Pearson correlation coefficient; ROT3, CYP90C1/ROTUNDIFOLIA; SCW, secondary cell wall; SD, standard deviation; TF, transcription factor.
Footnotes
References
Adamcsek, B., Palla, G., Farkas, I. J., Derényi, I., and Vicsek, T. (2006). CFinder: locating cliques and overlapping modules in biological networks. Bioinformatics 22, 1021–1023. doi: 10.1093/bioinformatics/btl039
Aoki, K., Ogata, Y., and Shibata, D. (2007). Approaches for extracting practical information from gene co-expression networks in plant biology. Plant Cell Physiol. 48, 381–390. doi: 10.1093/pcp/pcm013
Aoki, Y., Okamura, Y., Tadaka, S., Kinoshita, K., and Obayashi, T. (2016). ATTED-II in 2016: a plant coexpression database towards lineage-specific coexpression. Plant Cell Physiol. 57:e5. doi: 10.1093/pcp/pcv165
Bassel, G. W., Glaab, E., Marquez, J., Holdsworth, M. J., and Bacardit, J. (2011). Functional network construction in arabidopsis using rule-based machine learning on large-scale data sets. Plant Cell 23, 3101–3116. doi: 10.1105/tpc.111.088153
Buels, R., Yao, E., Diesh, C. M., Hayes, R. D., Munoz-Torres, M., Helt, G., et al. (2016). JBrowse: a dynamic web platform for genome visualization and analysis. Genome Biol. 17:66. doi: 10.1186/s13059-016-0924-1
Cheng, Y. C., and Fleming, G. R. (2009). Dynamics of light harvesting in photosynthesis. Annu. Rev. Phys. Chem. 60, 241–262. doi: 10.1146/annurev.physchem.040808.090259
Choe, S., Dilkes, B. P., Fujioka, S., Takatsuto, S., Sakurai, A., and Feldmann, K. A. (1998). The DWF4 gene of Arabidopsis encodes a cytochrome P450 that mediates multiple 22alpha-hydroxylation steps in brassinosteroid biosynthesis. Plant Cell 10, 231–243. doi: 10.1105/tpc.10.2.231
D’Haeseleer, P., Liang, S., and Somogyi, R. (2000). Genetic network inference: from co-expression clustering to reverse engineering. Bioinformatics 16, 707–726. doi: 10.1093/bioinformatics/16.8.707
Dolganov, N. A., Bhaya, D., and Grossman, A. R. (1995). Cyanobacterial protein with similarity to the chlorophyll a/b binding proteins of higher plants: evolution and regulation. Proc. Natl. Acad. Sci. U.S.A. 92, 636–640. doi: 10.1073/pnas.92.2.636
Du, J., Zhao, B., Sun, X., Sun, M., Zhang, D., Zhang, S., et al. (2017). Identification and characterization of multiple intermediate alleles of the key genes regulating brassinosteroid biosynthesis pathways. Front. Plant Sci. 7:1893. doi: 10.3389/fpls.2016.01893
Du, Z., Zhou, X., Ling, Y., Zhang, Z., and Su, Z. (2010). agriGO: a GO analysis toolkit for the agricultural community. Nucleic Acids Res. 38, W64–W70. doi: 10.1093/nar/gkq310
Fujioka, S., Li, J., Choi, Y. H., Seto, H., Takatsuto, S., Noguchi, T., et al. (1997). The Arabidopsis deetiolated2 mutant is blocked early in brassinosteroid biosynthesis. Plant Cell 9, 1951–1962. doi: 10.1105/tpc.9.11.1951
He, C., Cui, K., Zhang, J., Duan, A., and Zeng, Y. (2013). Next-generation sequencing-based mRNA and microRNA expression profiling analysis revealed pathways involved in the rapid growth of developing culms in moso bamboo. BMC Plant Biol. 13:119. doi: 10.1186/1471-2229-13-119
Huang, Z., Zhong, X. J., He, J., Jin, S. H., Guo, H. D., Yu, X. F., et al. (2016). Genome-wide identification, characterization, and stress-responsive expression profiling of genes encoding lea (late embryogenesis abundant) proteins in moso bamboo (Phyllostachys edulis). PLoS One 11:e0165953. doi: 10.1371/journal.pone.0165953
Jiang, Z. H., Peng, Z. H., Gao, Z. M., Liu, C., and Yang, C. H. (2012). Characterization of different isoforms of the light-harvesting chlorophyll a/b complexes of photosystem II in bamboo. Photosynthetica 50, 129–138. doi: 10.1007/s11099-012-0009-7
Jin, J., Tian, F., Yang, D. C., Meng, Y. Q., Kong, L., Luo, J., et al. (2017). PlantTFDB 4.0: toward a central hub for transcription factors and regulatory interactions in plants. Nucleic Acids Res. 45, D1040–D1045. doi: 10.1093/nar/gkw982
Kim, G. T., Fujioka, S., Kozuka, T., Tax, F. E., Takatsuto, S., Yoshida, S., et al. (2005). CYP90C1 and CYP90D1 are involved in different steps in the brassinosteroid biosynthesis pathway in Arabidopsis thaliana. Plant J. Cell Mol. Biol. 41, 710–721. doi: 10.1111/j.1365-313X.2004.02330.x
Kim, W. C., Kim, J. Y., Ko, J. H., Kang, H., and Han, K. H. (2014a). Identification of direct targets of transcription factor MYB46 provides insights into the transcriptional regulation of secondary wall biosynthesis. Plant Mol. Biol. 85, 589–599. doi: 10.1007/s11103-014-0205-x
Kim, W. C., Reca, I. B., Kim, Y. S., Park, S., Thomashow, M. F., Keegstra, K., et al. (2014b). Transcription factors that directly regulate the expression of CSLA9 encoding mannan synthase in Arabidopsis thaliana. Plant Mol. Biol. 84, 577–587. doi: 10.1007/s11103-013-0154-9
Kim, W. C., Ko, J. H., Kim, J. Y., Kim, J., Bae, H. J., and Han, K. H. (2013). MYB46 directly regulates the gene expression of secondary wall-associated cellulose synthases in Arabidopsis. Plant J. 73, 26–36. doi: 10.1111/j.1365-313x.2012.05124.x
Lacombe, B., and Achard, P. (2016). Long-distance transport of phytohormones through the plant vascular system. Curr. Opin. Plant Biol. 34, 1–8. doi: 10.1016/j.pbi.2016.06.007
Li, J., Wang, X., and Cui, Y. (2014). Uncovering the overlapping community structure of complex networks by maximal cliques. Physica A 415, 398–406. doi: 10.1016/j.physa.2014.08.025
Li, X. P., Björkman, O., Shih, C., Grossman, A. R., Rosenquist, M., Jansson, S., et al. (2000). A pigment-binding protein essential for regulation of photosyntheticlight harvesting. Nature 403, 391–395. doi: 10.1038/35000131
Li, Y., Pearl, S. A., and Jackson, S. A. (2015). Gene networks in plant biology: approaches in reconstruction and analysis. Trends Plant Sci. 20, 664–675. doi: 10.1016/j.tplants.2015.06.013
Mccarthy, R. L., Zhong, R., and Ye, Z. H. (2009). MYB83 is a direct target of SND1 and acts redundantly with MYB46 in the regulation of secondary cell wall biosynthesis in arabidopsis. Plant Cell Physiol. 50, 1950–1964. doi: 10.1093/pcp/pcp139
Montané, M. H., and Kloppstech, K. (2000). The family of light-harvesting-related proteins (LHCs, ELIPs, HLIPs): was the harvesting of light their primary function? Gene 258, 1–8. doi: 10.1016/S0378-1119(00)00413-3
Morenorisueno, M. A., Busch, W., and Benfey, P. N. (2010). Omics meet networks - using systems approaches to infer regulatory networks in plants. Curr. Opin. Plant Biol. 13, 126–131. doi: 10.1016/j.pbi.2009.11.005
Ohnishi, T., Godza, B., Watanabe, B., Fujioka, S., Hategan, L., Ide, K., et al. (2012). CYP90A1/CPD, a brassinosteroid biosynthetic cytochrome P450 of arabidopsis, catalyzes C-3 oxidation. J. Biol. Chem. 287, 31551–31560. doi: 10.1074/jbc.M112.392720
Peng, Z., Lu, Y., Li, L., Zhao, Q., Feng, Q., Gao, Z., et al. (2013a). The draft genome of the fast-growing non-timber forest species moso bamboo (Phyllostachys heterocycla). Nat. Genet. 45, 456–461. doi: 10.1038/ng.2569
Peng, Z., Zhang, C., Zhang, Y., Hu, T., Mu, S., Li, X., et al. (2013b). Transcriptome sequencing and analysis of the fast growing shoots of moso bamboo (Phyllostachys edulis). PLoS One 8:e78944. doi: 10.1371/journal.pone.0078944
Serin, E. A. R., Harm, N., Hilhorst, H. W. M., and Wilco, L. (2016). Learning from co-expression networks: possibilities and challenges. Front. Plant Sci. 7:444. doi: 10.3389/fpls.2016.00444
Speir, M. L., Zweig, A. S., Rosenbloom, K. R., Raney, B. J., Paten, B., Nejad, P., et al. (2016). The UCSC genome browser database: 2016 update. Nucleic Acids Res. 44, D717–D725. doi: 10.1093/nar/gkv1275
Tian, T., Liu, Y., Yan, H., You, Q., Yi, X., Du, Z., et al. (2017). agriGO v2.0: a GO analysis toolkit for the agricultural community, 2017 update. Nucleic Acids Res. 45, W122–W129. doi: 10.1093/nar/gkx382
Trapnell, C., Pachter, L., and Salzberg, S. L. (2009). TopHat: discovering splice junctions with RNA-Seq. Bioinformatics 25, 1105–1111. doi: 10.1093/bioinformatics/btp120
Trapnell, C., Williams, B. A., Pertea, G., Mortazavi, A., Kwan, G., Van Baren, M. J., et al. (2010). Transcript assembly and quantification by RNA-Seq reveals unannotated transcripts and isoform switching during cell differentiation. Nat. Biotechnol. 28, 511–515. doi: 10.1038/nbt.1621
Usadel, B., Obayashi, T., Mutwil, M., Giorgi, F. M., Bassel, G. W., Tanimoto, M., et al. (2009). Co-expression tools for plant biology: opportunities for hypothesis generation and caveats. Plant Cell Environ. 32, 1633–1651. doi: 10.1111/j.1365-3040.2009.02040.x
Wei, Q., Jiao, C., Guo, L., Ding, Y., Cao, J., Feng, J., et al. (2016). Exploring key cellular processes and candidate genes regulating the primary thickening growth of Moso underground shoots. New Phytol. 214, 81–96. doi: 10.1111/nph.14284
Xu, P., Mohorianu, I., Yang, L., Zhao, H., Gao, Z., and Dalmay, T. (2014). Small RNA profile in moso bamboo root and leaf obtained by high definition adapters. PLoS One 9:e103590. doi: 10.1371/journal.pone.0103590
Yi, X., Du, Z., and Su, Z. (2013). PlantGSEA: a gene set enrichment analysis toolkit for plant community. Nucleic Acids Res. 41, W98–W103. doi: 10.1093/nar/gkt281
Yi, Z., Chen, J., Sun, H., Rosli, H. G., Pombo, M. A., Zhang, P., et al. (2016). iTAK: a program for genome-wide prediction and classification of plant transcription factors,transcriptional regulators, and protein kinases. Mol. Plant 9, 1667–1670. doi: 10.1016/j.molp.2016.09.014
You, Q., Xu, W., Zhang, K., Zhang, L., Yi, X., Yao, D., et al. (2017). ccNET: database of co-expression networks with functional modules for diploid and polyploid Gossypium. Nucleic Acids Res. 45, D1090–D1099. doi: 10.1093/nar/gkw910
You, Q., Zhang, L., Yi, X., Zhang, K., Yao, D., Zhang, X., et al. (2016). Co-expression network analyses identify functional modules associated with development and stress response in Gossypium arboreum. Sci. Rep. 6:38436. doi: 10.1038/srep38436
Yu, J., Zhang, Z., Wei, J., Yi, L., Xu, W., and Su, Z. (2014). SFGD: a comprehensive platform for mining functional information from soybean transcriptome data and its use in identifying acyl-lipid metabolism pathways. BMC Genomics 15:271. doi: 10.1186/1471-2164-15-271
Yukihisa, S., Hideki, G., Ayako, N., Suguru, T., Shozo, F., and Shigeo, Y. (2003). Organ-specific expression of brassinosteroid-biosynthetic genes and distribution of endogenous brassinosteroids in Arabidopsis. Plant Physiol. 131, 287–297. doi: 10.1104/pp.013029
Zhao, H., Gao, Z., Wang, L., Wang, J., Wang, S., Fei, B., et al. (2018). Chromosome-level reference genome and alternative splicing atlas of moso bamboo (Phyllostachys edulis). Gigascience 7:giy115. doi: 10.1093/gigascience/giy115
Zhao, H., Lou, Y., Sun, H., Li, L., Wang, L., Dong, L., et al. (2016). Transcriptome and comparative gene expression analysis of Phyllostachys edulis in response to high light. BMC Plant Biol. 16:34. doi: 10.1186/s12870-016-0720-9
Zhao, H., Peng, Z., Fei, B., Li, L., Hu, T., Gao, Z., et al. (2014). BambooGDB: a bamboo genome database with functional annotation and an analysis platform. Database 2014:bau006. doi: 10.1093/database/bau006
Zhao, H., Zhao, S., International Network for Bamboo and Rattan, Fei, B., Liu, H., Yang, H., et al. (2017). Announcing the genome atlas of bamboo and rattan (GABR) project: promoting research in evolution and in economically and ecologically beneficial plants. Gigascience 6, 1–7. doi: 10.1093/gigascience/gix046
Keywords: bamboo, gene network analysis, functional module, gene expression views, growth and development
Citation: Ma X, Zhao H, Xu W, You Q, Yan H, Gao Z and Su Z (2018) Co-expression Gene Network Analysis and Functional Module Identification in Bamboo Growth and Development. Front. Genet. 9:574. doi: 10.3389/fgene.2018.00574
Received: 21 July 2018; Accepted: 08 November 2018;
Published: 27 November 2018.
Edited by:
Vinicius Maracaja-Coutinho, Universidad de Chile, ChileReviewed by:
Hamed Bostan, North Carolina State University, United StatesDinesh Kumar, Indian Council of Agricultural Research (ICAR), India
Copyright © 2018 Ma, Zhao, Xu, You, Yan, Gao and Su. This is an open-access article distributed under the terms of the Creative Commons Attribution License (CC BY). The use, distribution or reproduction in other forums is permitted, provided the original author(s) and the copyright owner(s) are credited and that the original publication in this journal is cited, in accordance with accepted academic practice. No use, distribution or reproduction is permitted which does not comply with these terms.
*Correspondence: Zhimin Gao, gaozhimin@icbr.ac.cn Zhen Su, zhensu@cau.edu.cn
†These authors have contributed equally to this work