 Yan Tong
 Xin Huang
 Chen-Xing Qi
 Yin Shen
- 1Eye Center, Renmin Hospital of Wuhan University, Wuhan, China
- 2Department of Ophthalmology, Jiangxi Provincial People’s Hospital, Nanchang, China
- 3Frontier Science Center for Immunology and Metabolism, Medical Research Institute, Wuhan University, Wuhan, China
Purpose: To explore the intrinsic functional connectivity (FC) alteration of the primary visual cortex (V1) between individuals with iridocyclitis and healthy controls (HCs) by the resting-state functional magnetic resonance imaging (fMRI) technique, and to investigate whether FC findings be used to differentiate patients with iridocyclitis from HCs.
Methods: Twenty-six patients with iridocyclitis and twenty-eight well-matched HCs were recruited in our study and underwent resting-state fMRI examinations. The fMRI data were analyzed by Statistical Parametric Mapping (SPM12), Data Processing and Analysis for Brain Imaging (DPABI), and Resting State fMRI Data Analysis Toolkit (REST) software. Differences in FC signal values of the V1 between the individuals with iridocyclitis and HCs were compared using independent two-sample t-tests. Significant differences in FC between two groups were chosen as classification features for distinguishing individuals with iridocyclitis from HCs using a support vector machine (SVM) classifier that involved machine learning. Classifier performance was evaluated using permutation test analysis.
Results: Compared with HCs, patients with iridocyclitis displayed significantly increased FC between the left V1 and left cerebellum crus1, left cerebellum 10, bilateral inferior temporal gyrus, right hippocampus, and left superior occipital gyrus. Moreover, patients with iridocyclitis displayed significantly lower FC between the left V1 and both the bilateral calcarine and bilateral postcentral gyrus. Patients with iridocyclitis also exhibited significantly higher FC values between the right V1 and left cerebellum crus1, bilateral thalamus, and left middle temporal gyrus; while they displayed significantly lower FC between the right V1 and both the bilateral calcarine and bilateral postcentral gyrus (voxel-level P<0.01, Gaussian random field correction, cluster-level P<0.05). Our results showed that 63.46% of the participants were correctly classified using the leave-one-out cross-validation technique with an SVM classifier based on the FC of the left V1; and 67.31% of the participants were correctly classified based on the FC of the right V1 (P<0.001, non-parametric permutation test).
Conclusion: Patients with iridocyclitis displayed significantly disturbed FC between the V1 and various brain regions, including vision-related, somatosensory, and cognition-related regions. The FC variability could distinguish patients with iridocyclitis from HCs with substantial accuracy. These findings may aid in identifying the potential neurological mechanisms of impaired visual function in individuals with iridocyclitis.
Introduction
Iridocyclitis is the most common pattern of anterior uveitis among the general population and is characterized by the presence of an inflammatory phenotype within the anterior eye segment that involves the iris and ciliary body (1). The typical clinical features of patients with iridocyclitis include eye redness, eye pain, blurred vision, and photophobia. Aggravating features (e.g., secondary glaucoma, cystoid macular edema, corneal opacities and retinal vascular abnormalities) have also been frequently reported to cause vision loss and may ultimately result in irreversible blindness (2). Many affected patients have no evidence of an underlying disorder and their disease is considered idiopathic; however, iridocyclitis is also often associated with autoimmunity. Human leucocyte antigen (HLA-B27) is a critical risk factor for the onset of iridocyclitis; notably, approximately 40-70% of patients with anterior uveitis are HLA-B27 positive, whereas this proportion is only 8-10% of healthy individuals (3). Iridocyclitis is commonly related to HLA-B27-associated systemic immune-mediated diseases, including ankylosing spondylitis, inflammatory bowel disease and reactive arthritis (4, 5). Topical or systemic corticosteroids are often used; steroid sparing current treatment modalities include disease-modifying anti-rheumatic drugs, such as conventional or synthetic biological drugs (6).
Inflammatory and autoimmune pathologies in iridocyclitis affect both afferent and efferent visual functions. In-depth analysis of immunopathology has demonstrated that autoimmune responses induce or participate in the occurrence and development of iridocyclitis (7). Notably, patients with iridocyclitis can produce cellular or humoral immune responses to retinal tissue antigens, such as S-antigen, recoverin, and interphotoreceptor retinoid-binding protein (8). Additionally, the infiltration of the Th17 and Th1 cells is induced in experimental autoimmune uveitis, such that these cells can be detected in retinal tissues (9). The availability of optical coherence tomography has provided additional structural information concerning changes in the retinal morphology of patients with iridocyclitis. In particular, retinal nerve fiber layer, central foveal, and retinal thicknesses are affected during the active iridocyclitis, even in the presence of mild anterior inflammation (10, 11). Investigations thus far suggest that anterior chamber inflammation in patients with iridocyclitis might lead to various changes in the posterior segment, potentially also modifying brain activity. However, the mechanisms of visual pathway impairment and the patterns of spontaneous neuronal activity alterations in the primary visual cortex (V1) in individuals with iridocyclitis have not been fully elucidated.
Resting-state functional magnetic resonance imaging (rs-fMRI), a noninvasive neuroimaging method dependent on metabolism analysis and brain blood flow, is progressively enabling people to detect functional changes within specific cerebral region (12, 13). Among the rs-fMRI analysis techniques, functional connectivity (FC) technique – in which the temporal correlation is calculated in a low-frequency range (0.01-0.08 Hz) between the mean blood oxygen level-dependent time series of a pre-determined brain region and spatially separated brain regions – is the most extensively used method because of its straightforward nature, sensitive, and efficiently in providing insights into the patterns of neural interactions (14). The FC method has been successfully applied to explore spontaneous neural alterations in some vision-related diseases, such as retinal vein occlusion (15), strabismus (16), retinitis pigmentosa (17), and glaucoma (18). The V1 is located in the occipital lobe; this is the kernel of the visual cortex that involves in perceptual activities. It receives visual input from the lateral geniculate nucleus, conducts initial integration, then transmits that information to senior regions of the visual cortex for complex processing (19). To our knowledge, FC changes in the V1 in patients with iridocyclitis have not been reported.
Recently, MRI-related machine learning methods have provided a systematic approach for developing automatic, objective, and sophisticated classification networks for the analyses of high-dimensional data. These approaches are more sensitive to identify subtle differences in the brain structure than group-level statistics based on multivariate pattern (20, 21). The support vector machine (SVM) method is the most commonly used supervised machine learning algorithm for MRI classification that enables individual-level classification and detects biomarkers on the basis of neuroimaging data. In recent years, it has been used to distinguish patients from healthy controls (HCs) in several diseases [e.g., Parkinson’s disease (22), generalized anxiety disorder (23)] with high accuracy. To our best knowledge, no studies have used the SVM technique based on fMRI data to perform predictive investigations in patients with iridocyclitis.
Based on previous studies, we hypothesized that patients with iridocyclitis may have disturbances in spontaneous neuronal activity and visual function. Thus, this study was performed to assess alterations in FC signal values between the V1 and other cortical areas in individuals with iridocyclitis, with the aim of providing an in-depth analysis of the specific V1 connectivity in those patients. Moreover, machine learning techniques were applied to find out whether aberrant FC could serve to be a feature to distinguish patients with iridocyclitis from normal controls. The results may contribute to explore the potential neuronal mechanisms of impaired visual function in individuals with iridocyclitis and contribute to the diagnosis of iridocyclitis in clinical practice.
Materials and Methods
Participants
A total of 26 individuals with iridocyclitis (14 males and 12 females) were enrolled from the Eye Center, Renmin Hospital of Wuhan University. The inclusion criteria were as follow: (1) diagnosis of iridocyclitis by experienced ophthalmologist based on the Standardization of Uveitis Nomenclature working group classification (1); (2) no other ocular disease (glaucoma, high myopia, strabismus, optic atrophy etc.) (3) right handed preference; (4) no contraindications for MRI examination. The exclusion criteria were as follow: (1) history of eye surgery and ocular trauma; (2) presence of brain parenchyma or other systemic disease (e.g. hypertension, diabetes, and heart disease) (3) psychiatric disorders.
26 HCs (15 males and 11 females) comparably matched for sex, age, as well as education compared to the patient group participated in this research. The inclusion criteria were listed as below: (1) no eye disease (e.g. cataracts, optic neuritis, diabetic retinopathy, etc.); (2) visual acuity ≥ 1.0 in both eyes; (3) right handed preference; (4) no psychiatric diseases; (5) capable of undergoing MRI examination.
The study followed the tenets of the in the Declaration of Helsinki, and was formally approved by the institutional review board of Eye Center, Renmin Hospital of Wuhan University. Each participant was provided signed informed consent to participate in our study.
MRI Parameters
A 3.0-Tesla magnetic resonance scanner (Discovery MR 750W system; Bio-Sciences Corporation) with an eight-channel head coil was used to collect fMRI images. All participates were asked to remain awake, lay still, and keep their eyes closed until the examination was completed. A three-dimensional spoiled gradient-recalled echo sequence was conducted to collect the anatomical T1-weighted images. The whole brain fMRI data was recorded by applying gradient-recalled echo-planar imaging sequence. More detailed parameter setting was displayed in Table 1. In total, 240 volumes of fMRI data were obtained for the next pre-processing analysis.
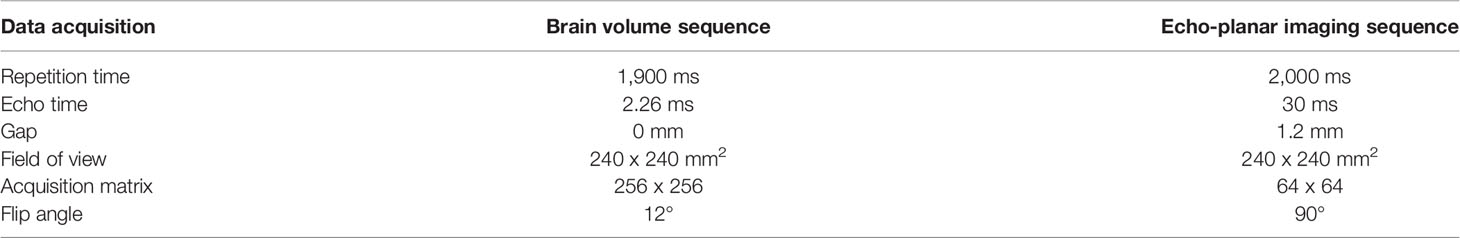
Table 1 Parameters setting of the MRI scanning.
fMRI Data Pre-Processing Analysis
The data were preprocessed using the Statistical Parametric Mapping (SPM12) and Data Processing and Analysis for Brain Imaging (DPABI) toolboxes running on Matlab 2013b (24). The preprocessing applied in the research were as below: (1) the fMRI data were transformed from DICOM format to NIFTI format; (2) the first 10 volumes of the functional images were excluded to reach magnetization equilibrium; (3) the rest 230 functional volumes were corrected with respect to slice timing, and head motion correction, then realigned (fMRI data from participates with greater than 1.5 mm displacement in any direction or more than 1.5° angular motion were discarded). Besides, we compared head motion parameters between the two groups and observed no significant differences (Table 2). (4) individual T1-weighted images were co-registered to the average functional data and the processed data were all segmented through the Diffeomorphic Anatomical Registration Through Exponentiated Lie Algebra algorithm to enhance spatial precision during the normalization of functional data (25). Normalized fMRI data were re-sliced with a resolution of 3 x 3 x 3 mm3; (5) data were smoothed with a 6 x6 x 6 mm3 full-width at half-maximum Gaussian Kernel; (6) removal of data with linear trends; linear regression step was conducted to control for some covariates including six head motion parameters, white matter signal, and cerebrospinal fluid signal; (7) temporal band-pass filtering was performed (0.01-0.08 Hz).
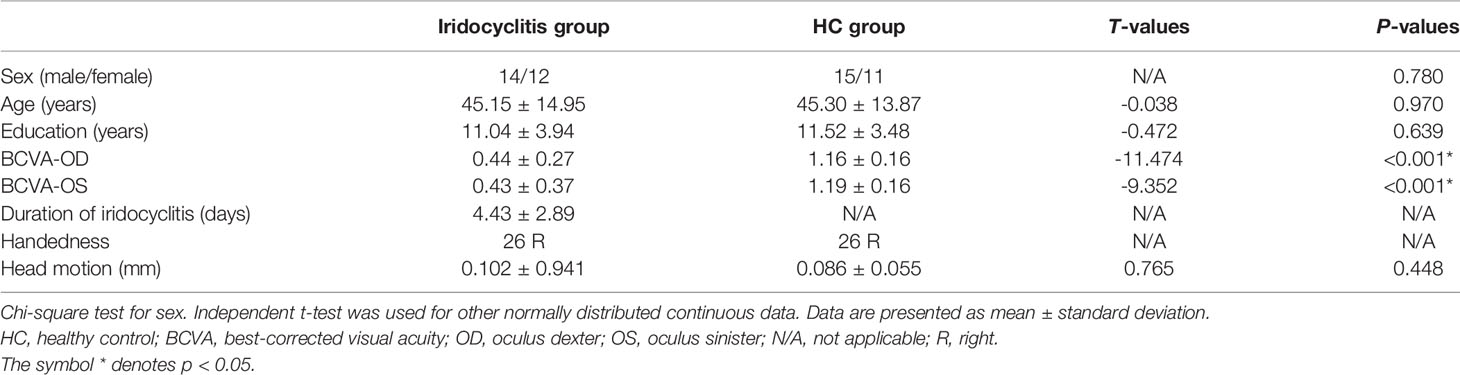
Table 2 Clinical characteristics for patients with iridocyclitis and HCs.
Definition of Region of Interest
In the fMRI data analysis for each participant, regions of interest were defined using the DPABI toolkit. Each side of the V1 was selected, which generally resulted in a region of interest containing Brodmann’s area 17. The center of V1 was selected to be the seed point and the MNI coordinates of the bilateral V1 were (left: -8, -76, 10) and (right: 8, -76, 10), in accordance with previous methods (26). The diameter of the sphere region of interest was 6 mm. Pearson correlation coefficients were computed between the average time series of the regions of interest and the time series for other cerebrum regions. Moreover, Fisher’ r-to-z-transformation was used to acquire an approximate normal distribution and help to reduce the impacts of individual variations for group statistical comparisons.
Statistical Analysis
SPSS 19.0 software was adopted in the study to analyze the cumulative clinical and demographic data. Independent two-samples t-test were used to evaluate continuous variables, while the chi-square test was used to assess proportions (P<0.05 indicates statistically significant). One-sample t-test was conducted to evaluate intragroup patterns of z-value FC; two-samples t-test were performed to compare differences in z-value FC between two groups using SPM12 software (voxel-level: P< 0.01, Gaussian random field (GRF) correction), cluster-level: P<0.05). Furthermore, Pearson correlation coefficients were utilized to evaluate the relationships between the average FC signal values in distinct cerebral areas and the clinical features in patients with iridocyclitis (P<0.05 indicates statistically significant).
Support Vector Machine Analysis
The SVM algorithm based on the Pattern Recognition for Neuroimaging Toolbox (PRoNTo) software (http://www.mlnl.cs.ucl.ac.uk/pronto/prtsoftware.html) was used to conduct diagnostic prediction in patients with iridocyclitis. The PRoNTo software has five main analysis modules: (i) dataset specification; (ii) feature set selection; (iii) model specification; (iv) model estimation; (v) weights computation (27). The SVM approach in PRoNTo utilizes LIBSVM for Matlab, which is an implementation of a linear-kernel SVM for binary classification (28).
In the present study, individual participant’s FC maps served as inputs for the machine learning algorithm. A feature set was prepared on whole brain FC maps and the number of features is the total number of edges . An important feature of SVM is that it does not need the training and test data to be explicitly represented and instead can be trained solely using a kernel, which is a matrix of pairwise similarities between data points constructed from the original features. Thus, the computational complexity of SVM is governed by the number of samples, rather than the number of features, which is advantageous in high-dimensional settings. Above procedures were automatically processed in PRoNTo’s “Prepare feature set” programs.
During the training process, one way to optimize the classifier and estimate the accuracy of the algorithm is by using the cross-validation method. The leave-one-out cross-validation (LOOCV) technique was adopted to perform SVM classifier validation, where the feature selection was performed each time on the training partition of the data. The number of samples in our study was assumed to be n. In each LOOCV fold, FC data from n-1 samples were selected as the training dataset to train the classification model; FC data from the remaining sample were regarded as a test dataset to test the ability of the classifier to classify new cases reliably. This procedure was repeated n times. For classification, two classes were defined (patients group and HCs group) and processed using a soft-margin hyper-parameter approach. The soft-margin parameters take the values 0.01, 0.1, 1, 10, 100 and 1000 in the SVM classifier in the current version of PRoNTo, which make the model obtain the maximum interval hyperplane with the minimum classification error. There is an inner-loop in the PRoNTo software to automatically find the optimal soft-margin parameter. The PRoNTo calculated the total error rate of model classification under six soft-margin parameters, and then selected the soft-margin parameter with the lowest total error rate as the final parameter for each cycle of the cross-validation. Above steps were automatically processed in the “Specify model” program in PRoNTo.
The total accuracy, specificity, sensitivity, and area under the receiver operating characteristic curve (AUC) were determined to assess the classification performance of the machine learning model. The permutation test was applied to assess the statistical significance of the total accuracy of this classification (29). The permutation test was repeated 1,000 times. During each repeat, the SVM model reallocated labels of iridocyclitis and normal controls randomly to the training participants and repeated the whole classification process. The p-value was acquired after all permutations had been completed.
To improve the interpretability of the multivariate pattern recognition results, we calculated the images summarizing the weights of each region of interest (ROI) defined by the Anatomical Automatic Labeling (AAL) atlas, which includes 116 cortical and subcortical anatomical structures (27). The weight map displays the contribution of each voxel in the image for the linear predictive function. Since each cross-validation fold yields a different weight vector, the final weight map is the average map across the folds divided by its Euclidean norm. Here, for each brain region defined by the AAL template, the normalized weight is calculated as the mean of absolute values of all voxel weights within the ROI. Region contributions can be ranked in descending order, and a sorted list of regions is obtained according to their contribution to the classification model based on the percentage of the total normalized average weights (30, 31).
Results
Demographics and Clinical Data Comparison
The results of demographic as well as clinical data are displayed in Table 2. There were no markedly differences in gender (P=0.780), age (P=0.97), or education (P=0.871) between the iridocyclitis patients group and HCs group. By contrast, the statistically differences were observed in the best-corrected visual acuity between the patient group and normal control group (P<0.001). The typical anterior segment photographs were shown in Figure 1.
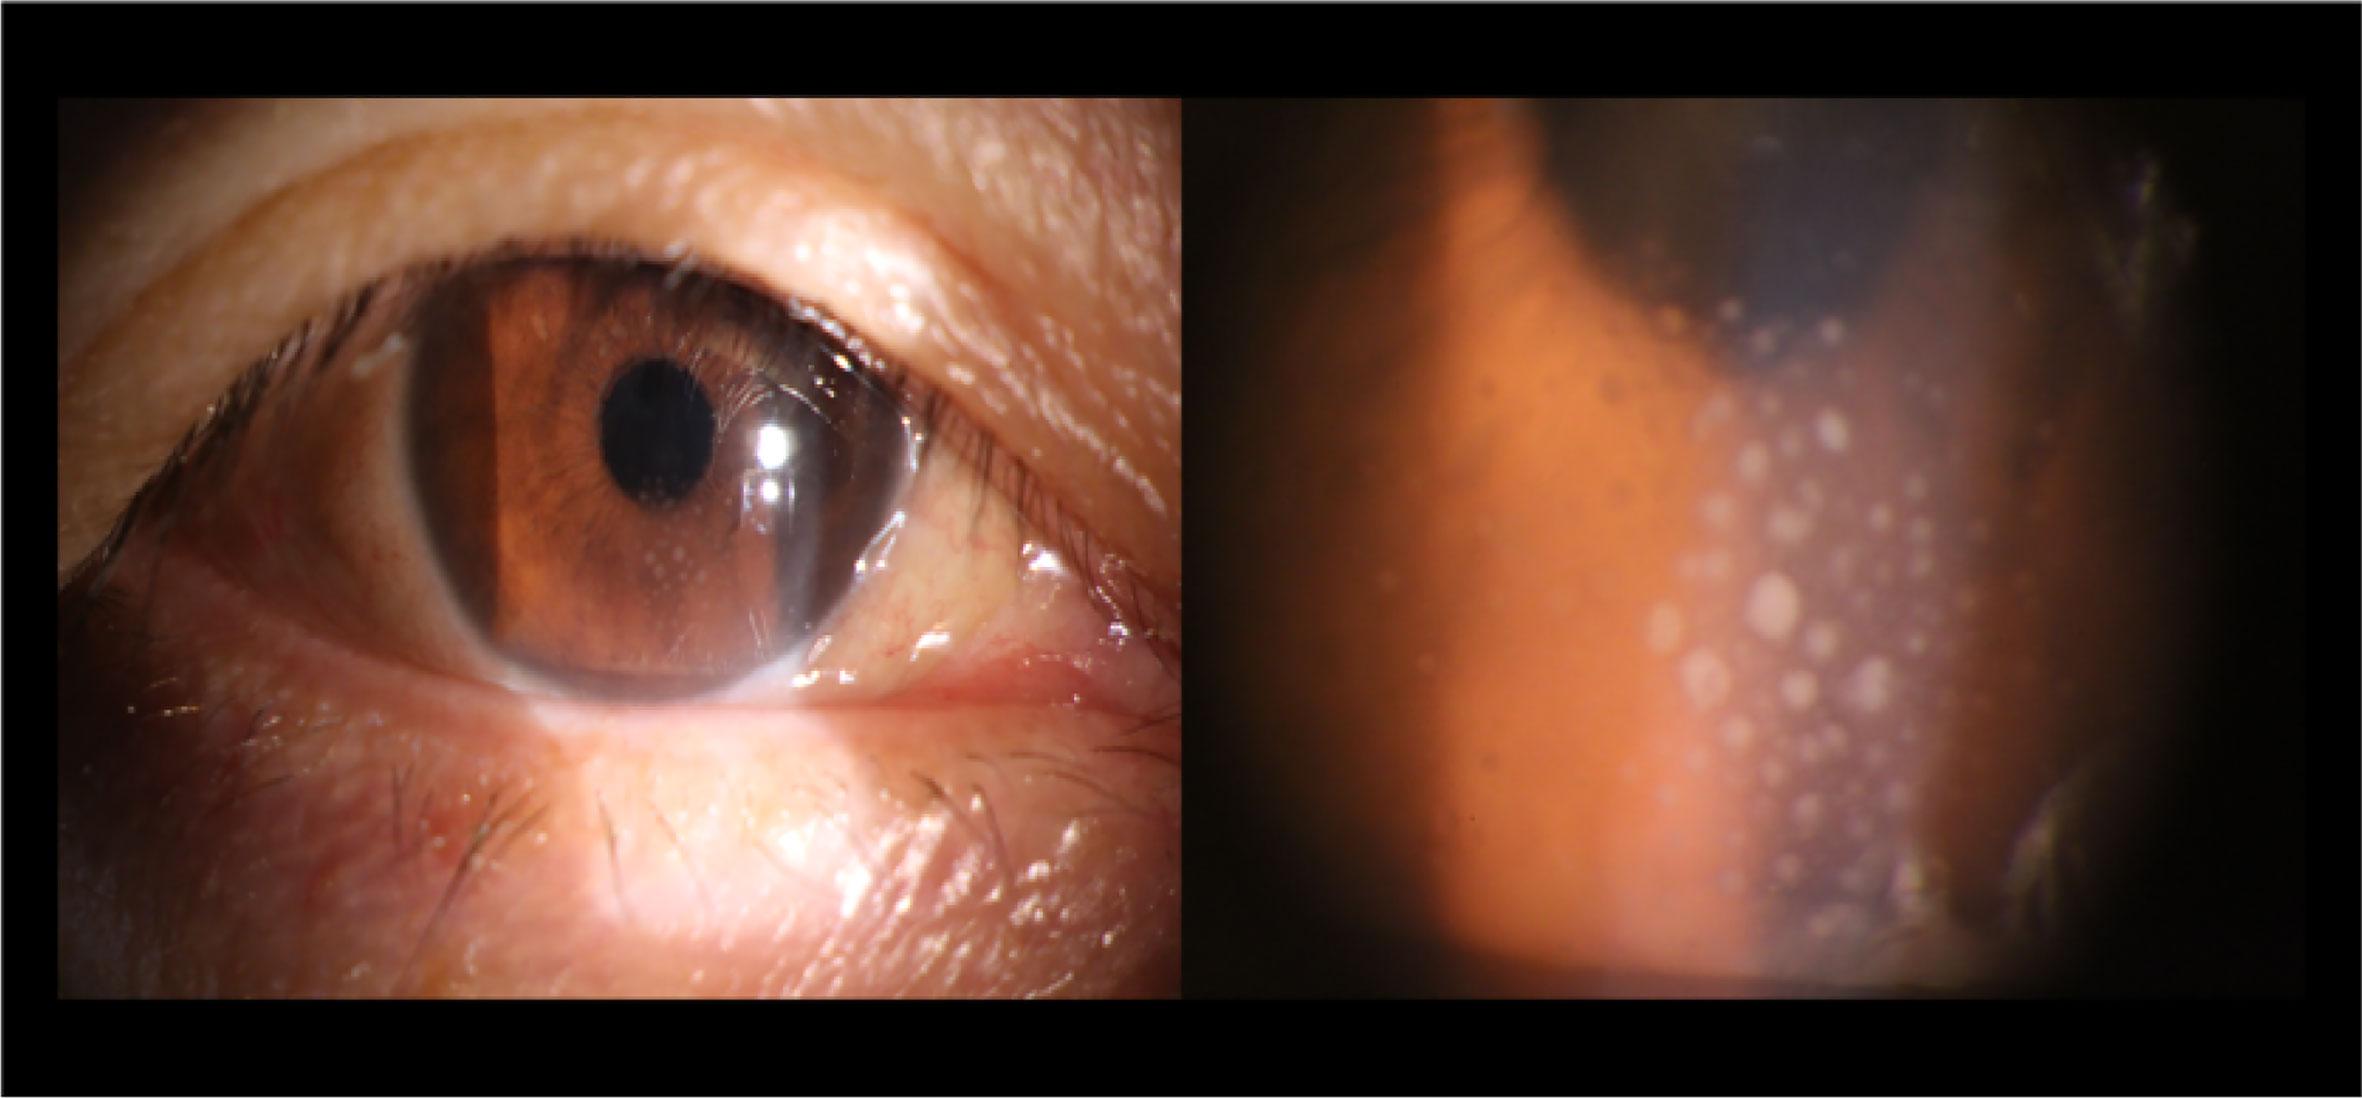
Figure 1 Typical anterior segment photographs of iridocyclitis.
Comparisons of FC Between Patients With Iridocyclitis and HCs
Figure 2 shows the spatial distributions of average zFC values of the bilateral V1 in patients with iridocyclitis and HCs. Compared with HCs, individuals with iridocyclitis displayed markedly higher FC between the left V1 and left cerebellum crus1, left cerebellum 10, bilateral inferior temporal cortex, right hippocampus, and left superior occipital gyrus; they showed significantly lower FC between the left V1 and both the bilateral calcarine and bilateral postcentral gyrus (Figure 3 and Table 3). Furthermore, patients with iridocyclitis displayed significantly increased FC signal values between the right V1 and left cerebellum crus1, bilateral thalamus, and left middle temporal gyrus; they demonstrated significantly lower FC signal values between the right V1 and both the bilateral calcarine and bilateral postcentral gyrus (Figure 4 and Table 4) (voxel-level P<0.01, GRF correction, cluster-level P<0.05).
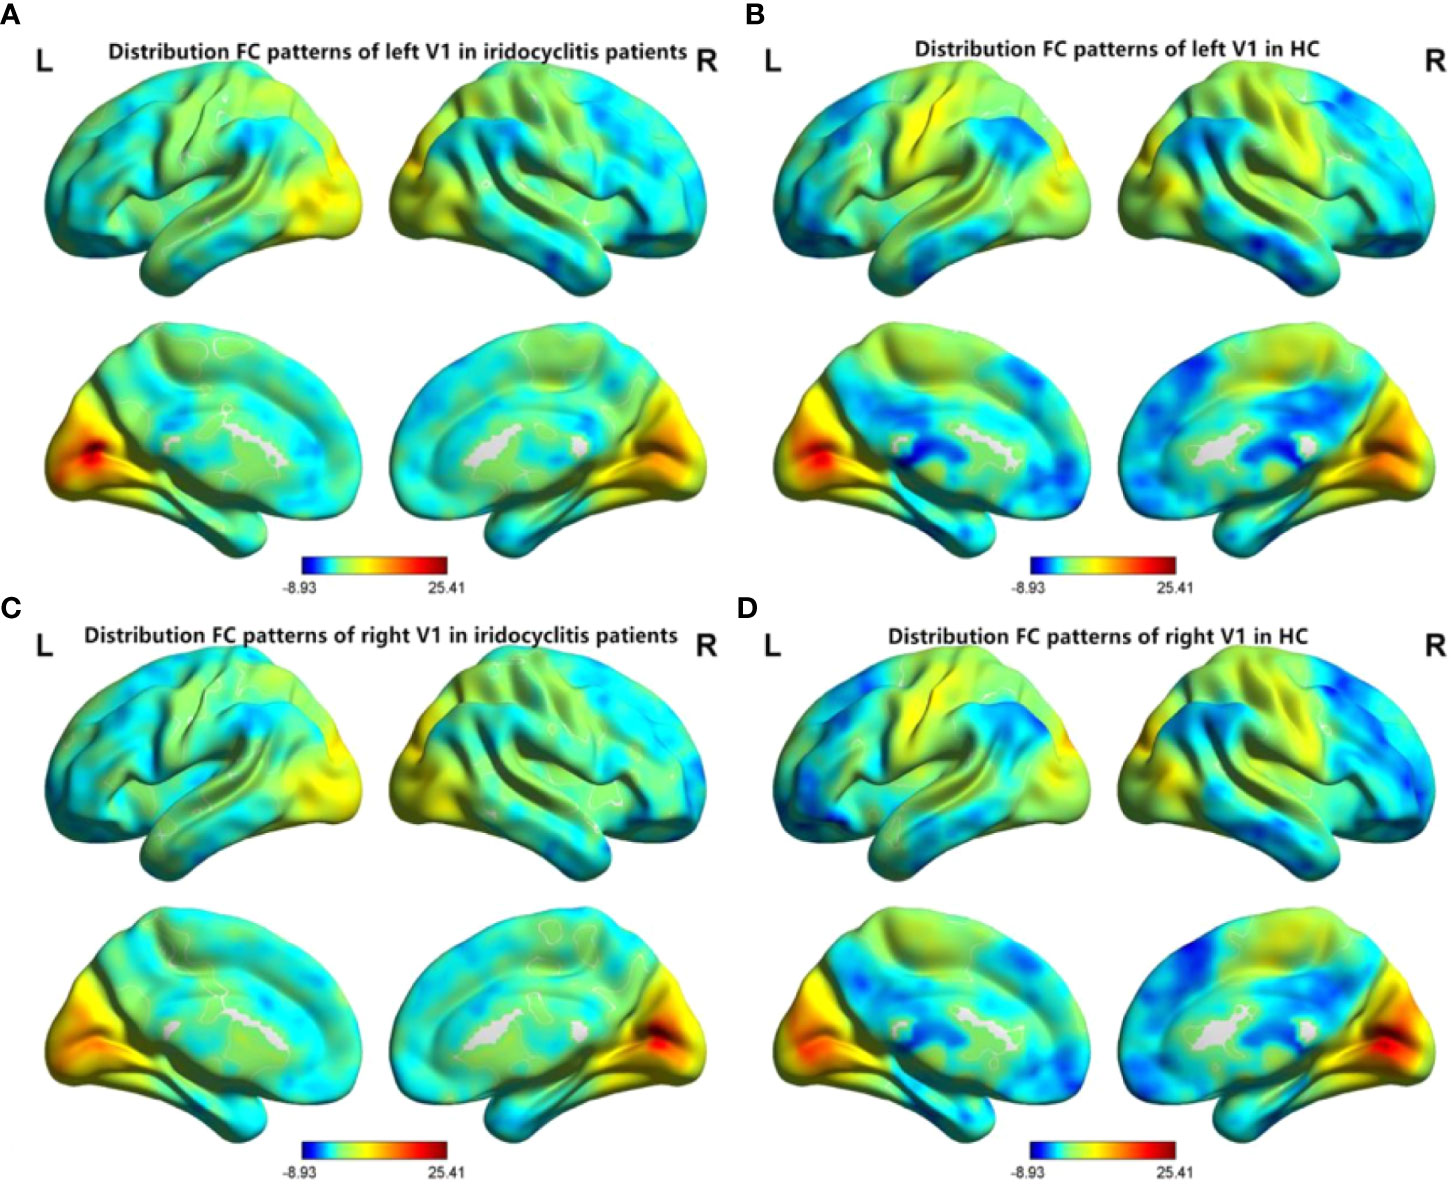
Figure 2 Spatial distributions of FC patterns of the bilateral V1 of the patients with iridocyclitis and HCs. (A) Distribution average zFC values of left V1 in patients with iridocyclitis; (B) Distribution average zFC values of left V1 in HCs; (C) Distribution average zFC values of right V1 in patients with iridocyclitis; (D) Distribution average zFC values of right V1 in HCs. zFC, z-value functional connectivity; HC, healthy control.
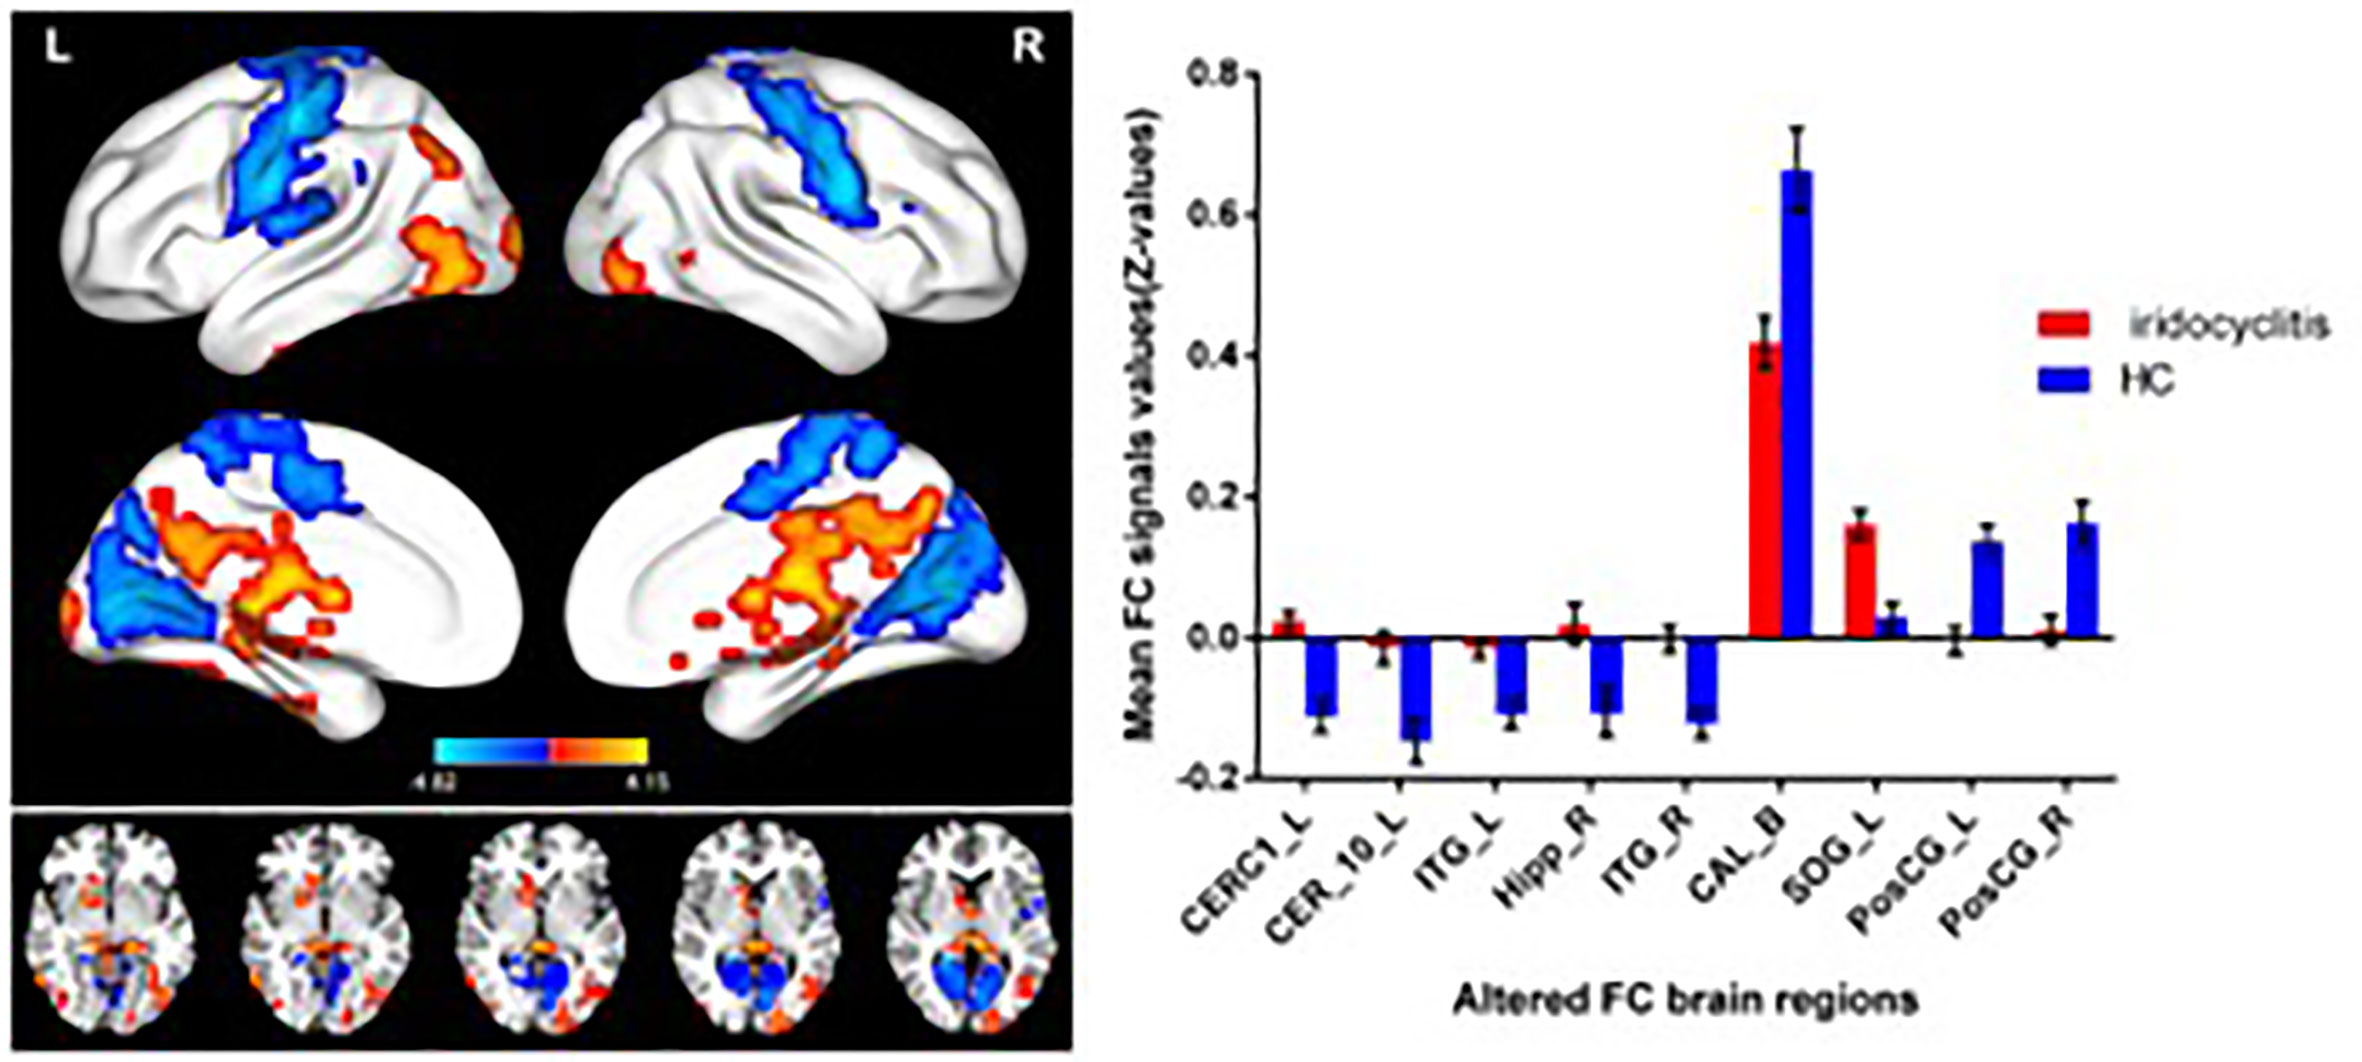
Figure 3 Brain areas with statistically significant differences between two groups in FC of the left V1. Significantly FC differences were shown between the left V1 and CERC1_L, CER_10_L, ITG_L, Hipp_R, ITG_R, CAL_B, SOG_L, PosCG_L and PosCG_R. (voxel-level P<0.01, GRF correction, cluster-level P<0.05). FC, functional connectivity; CERC1_L, left cerebellum crus1; CER_10_L, left cerebellum 10; ITG_L, left inferior temporal gyrus; Hipp_R, right hippocampus; ITG_R, right inferior temporal gyrus; CAL_B, bilateral calcarine; SOG_L, left superior occipital gyrus; PosCG_L, left postcentral gyrus; PosCG_R, right postcentral gyrus.
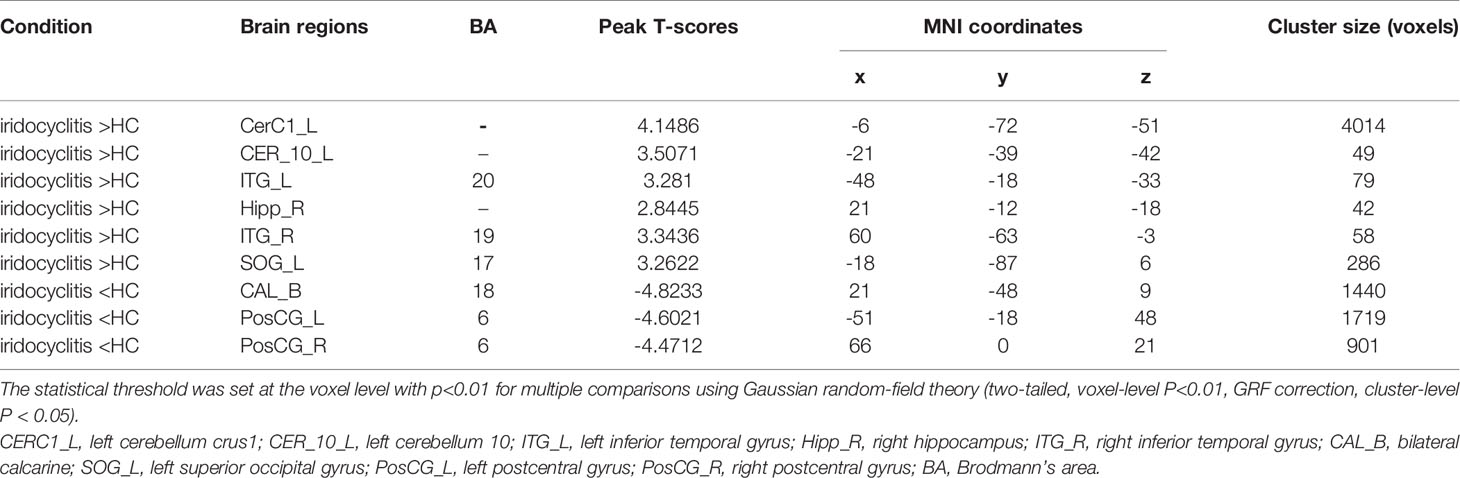
Table 3 Significant differences in the left V1 between two groups.
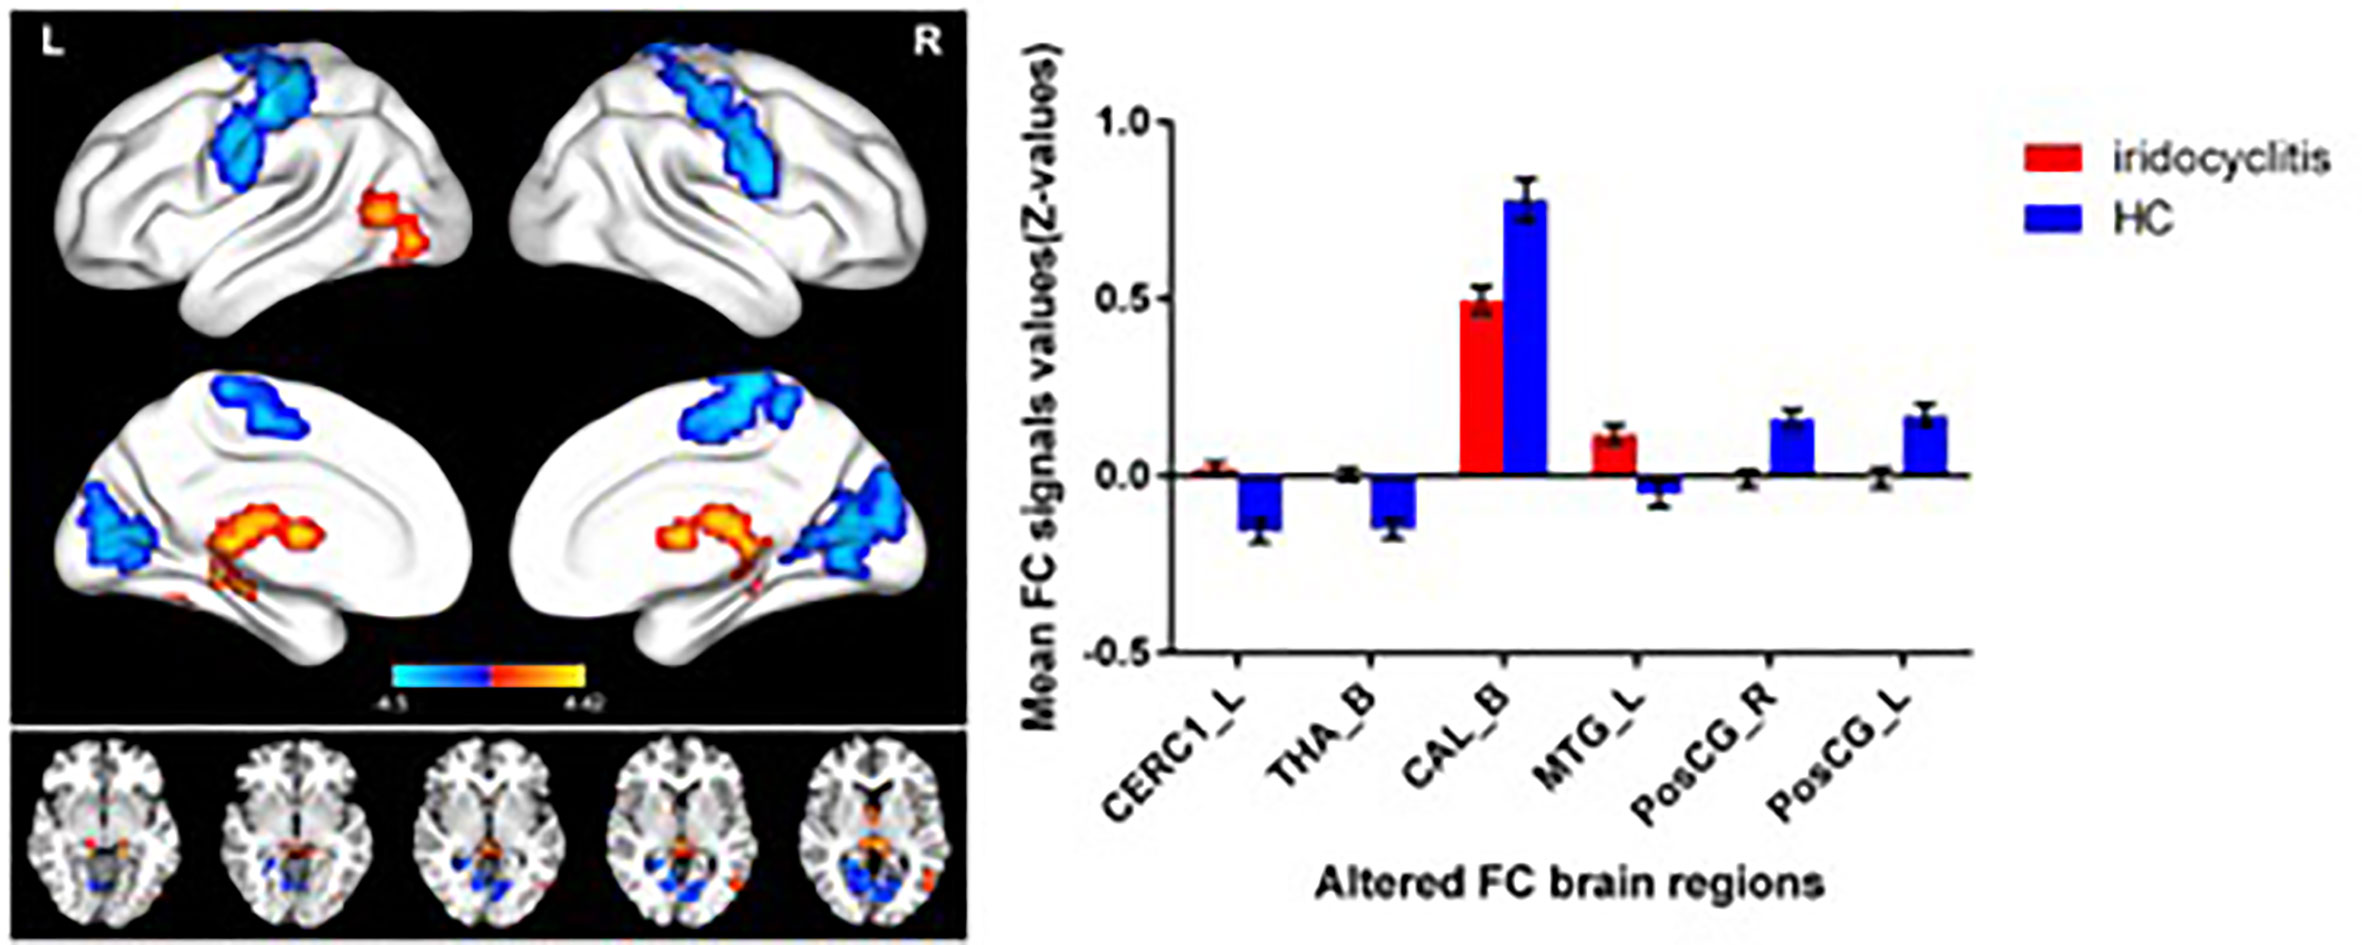
Figure 4 Brain areas with statistically significant differences between two groups in FC of the right V1. Significantly FC differences were shown between the right V1 and CERC1_L, THA_B, MTG_L, CAL_B, PosCG_L and PosCG_R (voxel-level P<0.01, GRF correction, cluster-level P<0.05). FC, functional connectivity; CERC1_L, left Cerebellum Crus1; THA_B, bilateral thalamus; CAL_B, bilateral calcarine; MTG_L, left middle temporal gyrus; PosCG_L, left postcentral gyrus; PosCG_R, right postcentral gyrus.
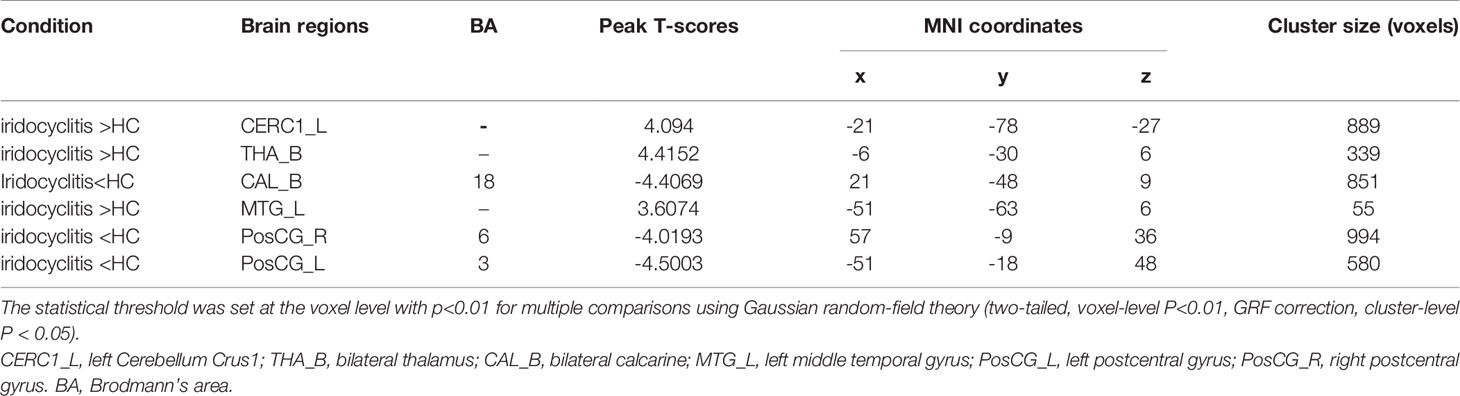
Table 4 Significant differences in the right V1 between two groups.
SVM Classification Results
The overall flowchart of the PRoNTo is shown in Figure 5. Classification results based on FC of the left V1 are displayed in Figure 6. The SVM classification model applying the LOOCV method achieved a total accuracy of 63.46%, sensitivity of 69.23%, and specificity of 65.22%. The AUC of the classification model was 0.72. Additionally, classification results based on FC of the right V1 are displayed in Figure 7. The SVM classification model achieved a total accuracy of 67.31%, sensitivity of 80.77%, and specificity of 53.85%. The AUC of the classification model was 0.75 (P<0.001, non-parametric permutation test).
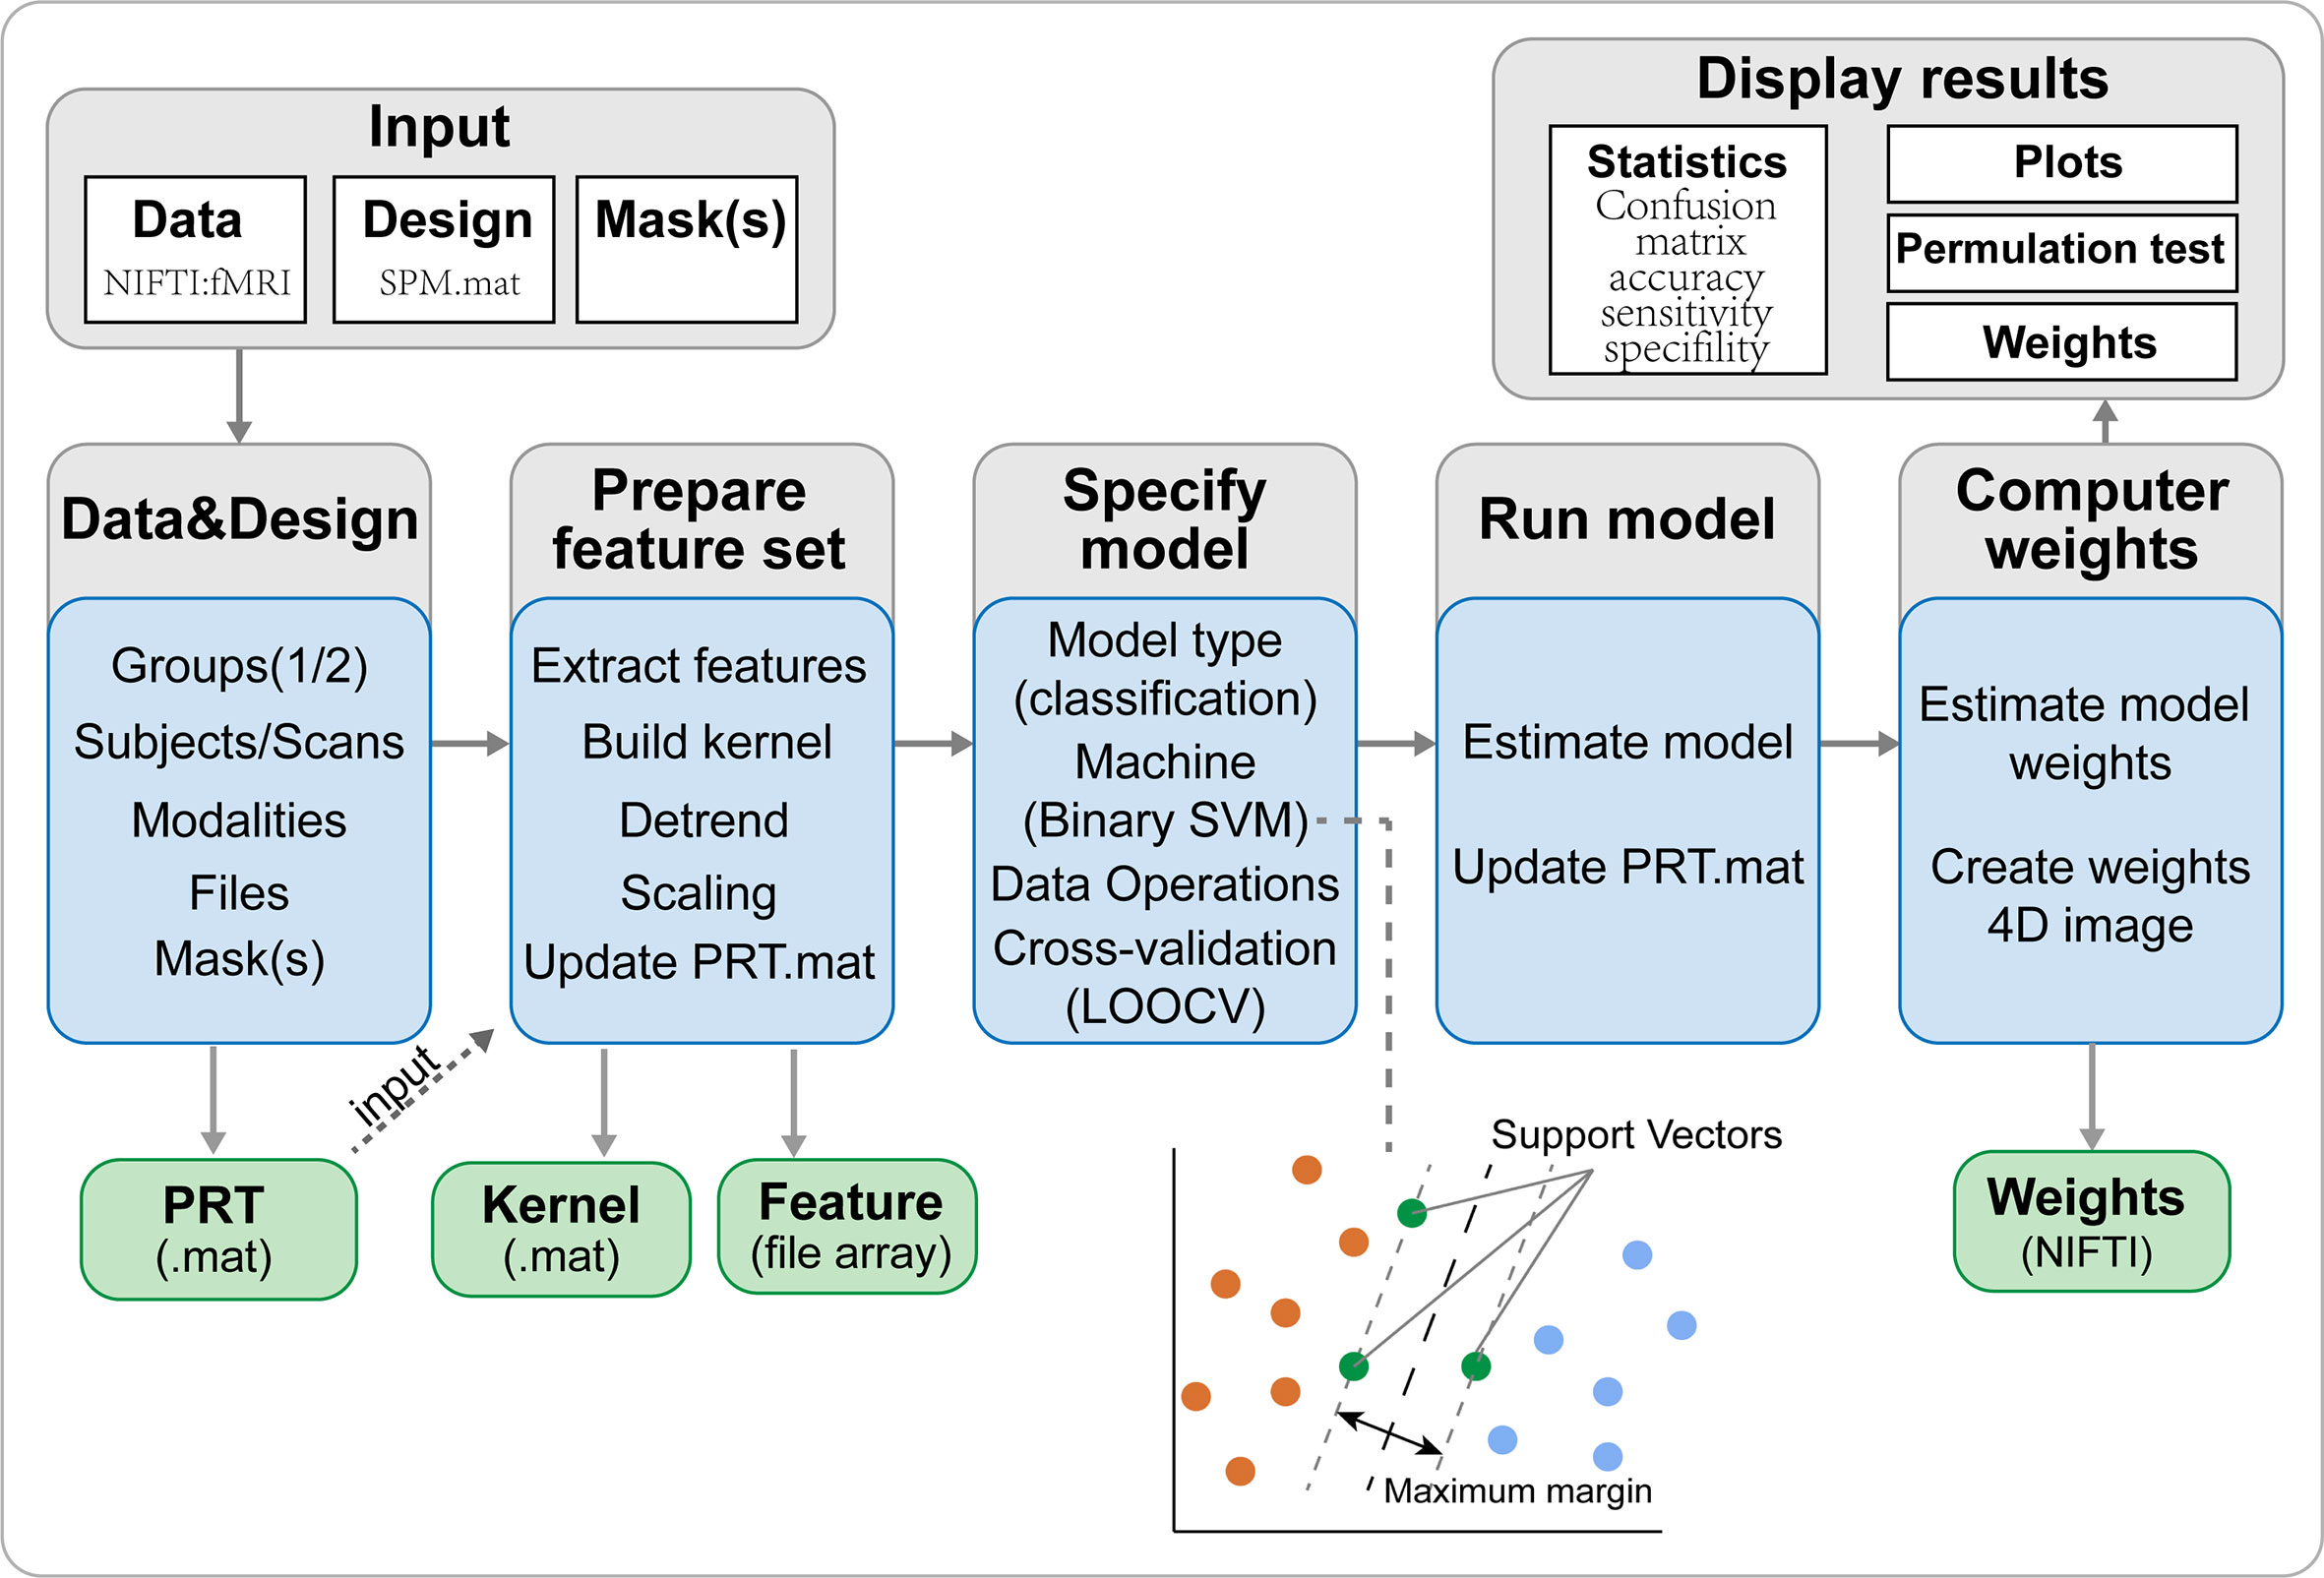
Figure 5 The framework of PRoNTo. The PRoNTo software has five main analysis modules: (i) dataset specification; (ii) feature set selection; (iii) model specification; (iv) model estimation; (v) weights computation. The PRT.mat is the output data structure from PRoNTo. SVM, support vector machine; LOOCV, SVM, support vector machine.
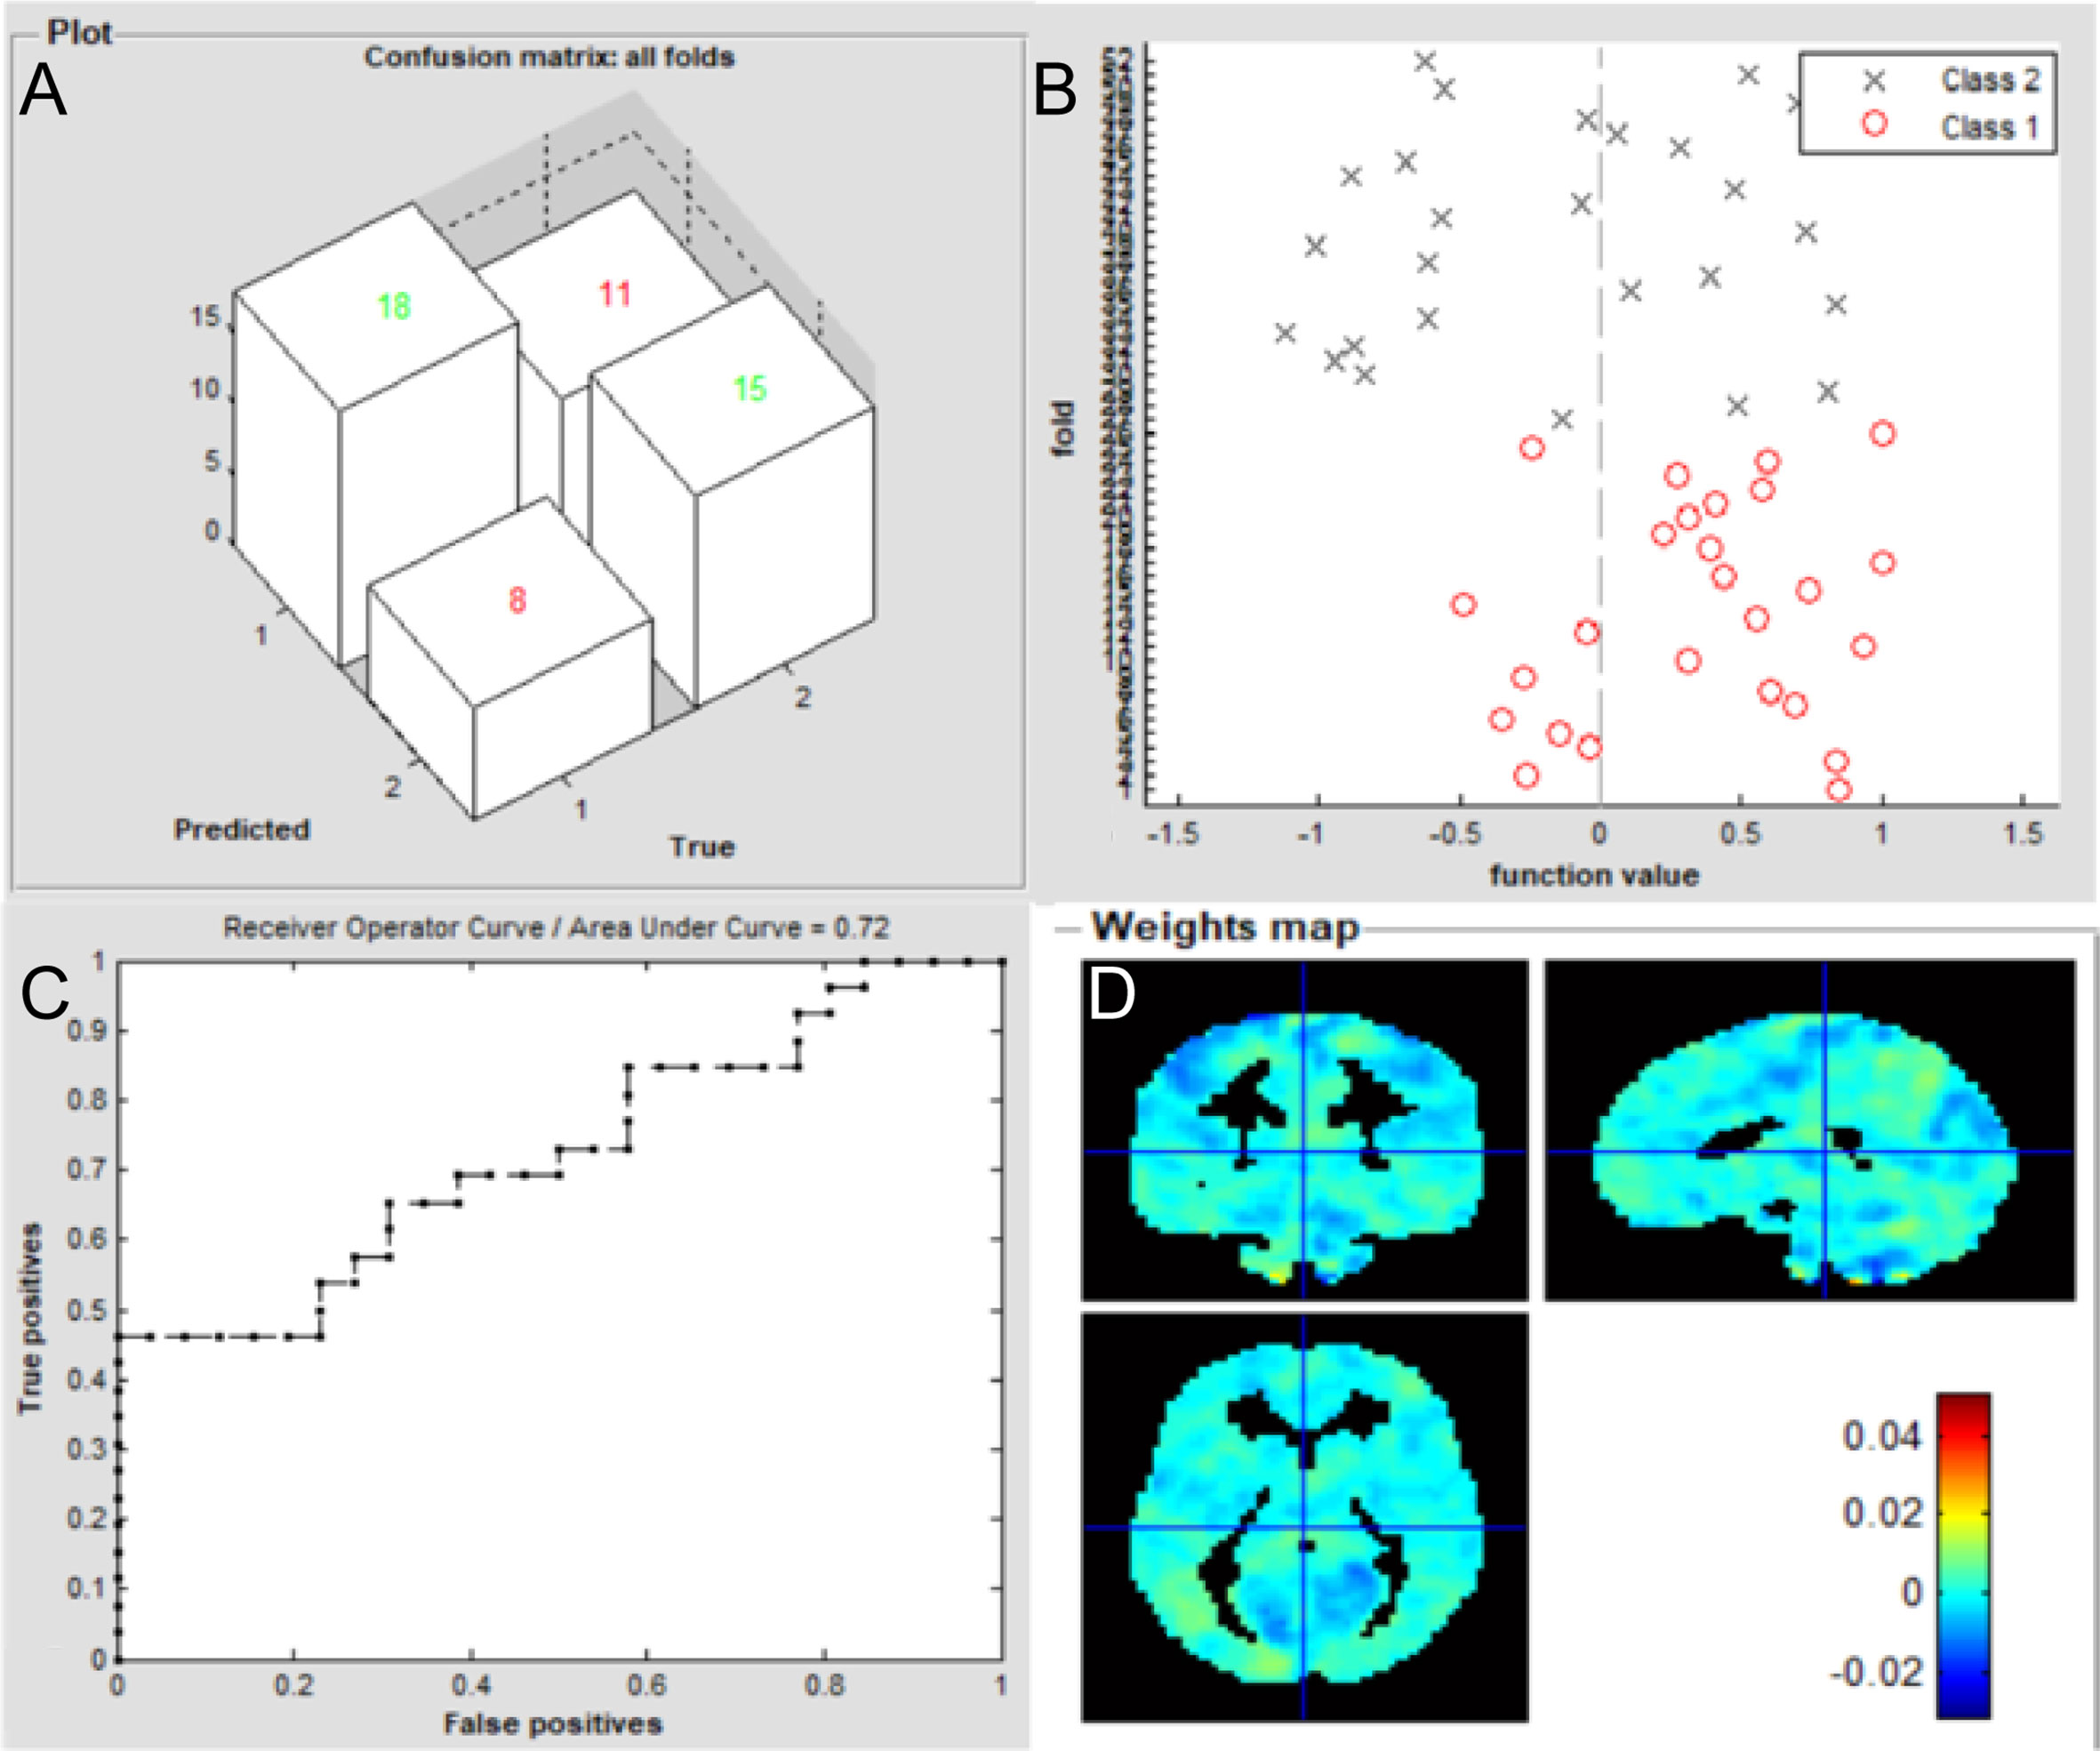
Figure 6 Classification results using machine learning analysis based on FC of the left V1. (A) three-dimensional confusion matrices from machine learning analysis; (B) function values of two groups (class 1: patient group; class 2: HC group); (C) The ROC curve of the classifier, and the AUC was 0.72; (D) Weight maps for SVM models. The weight in each voxel corresponding to its contribution to the model’s prediction.
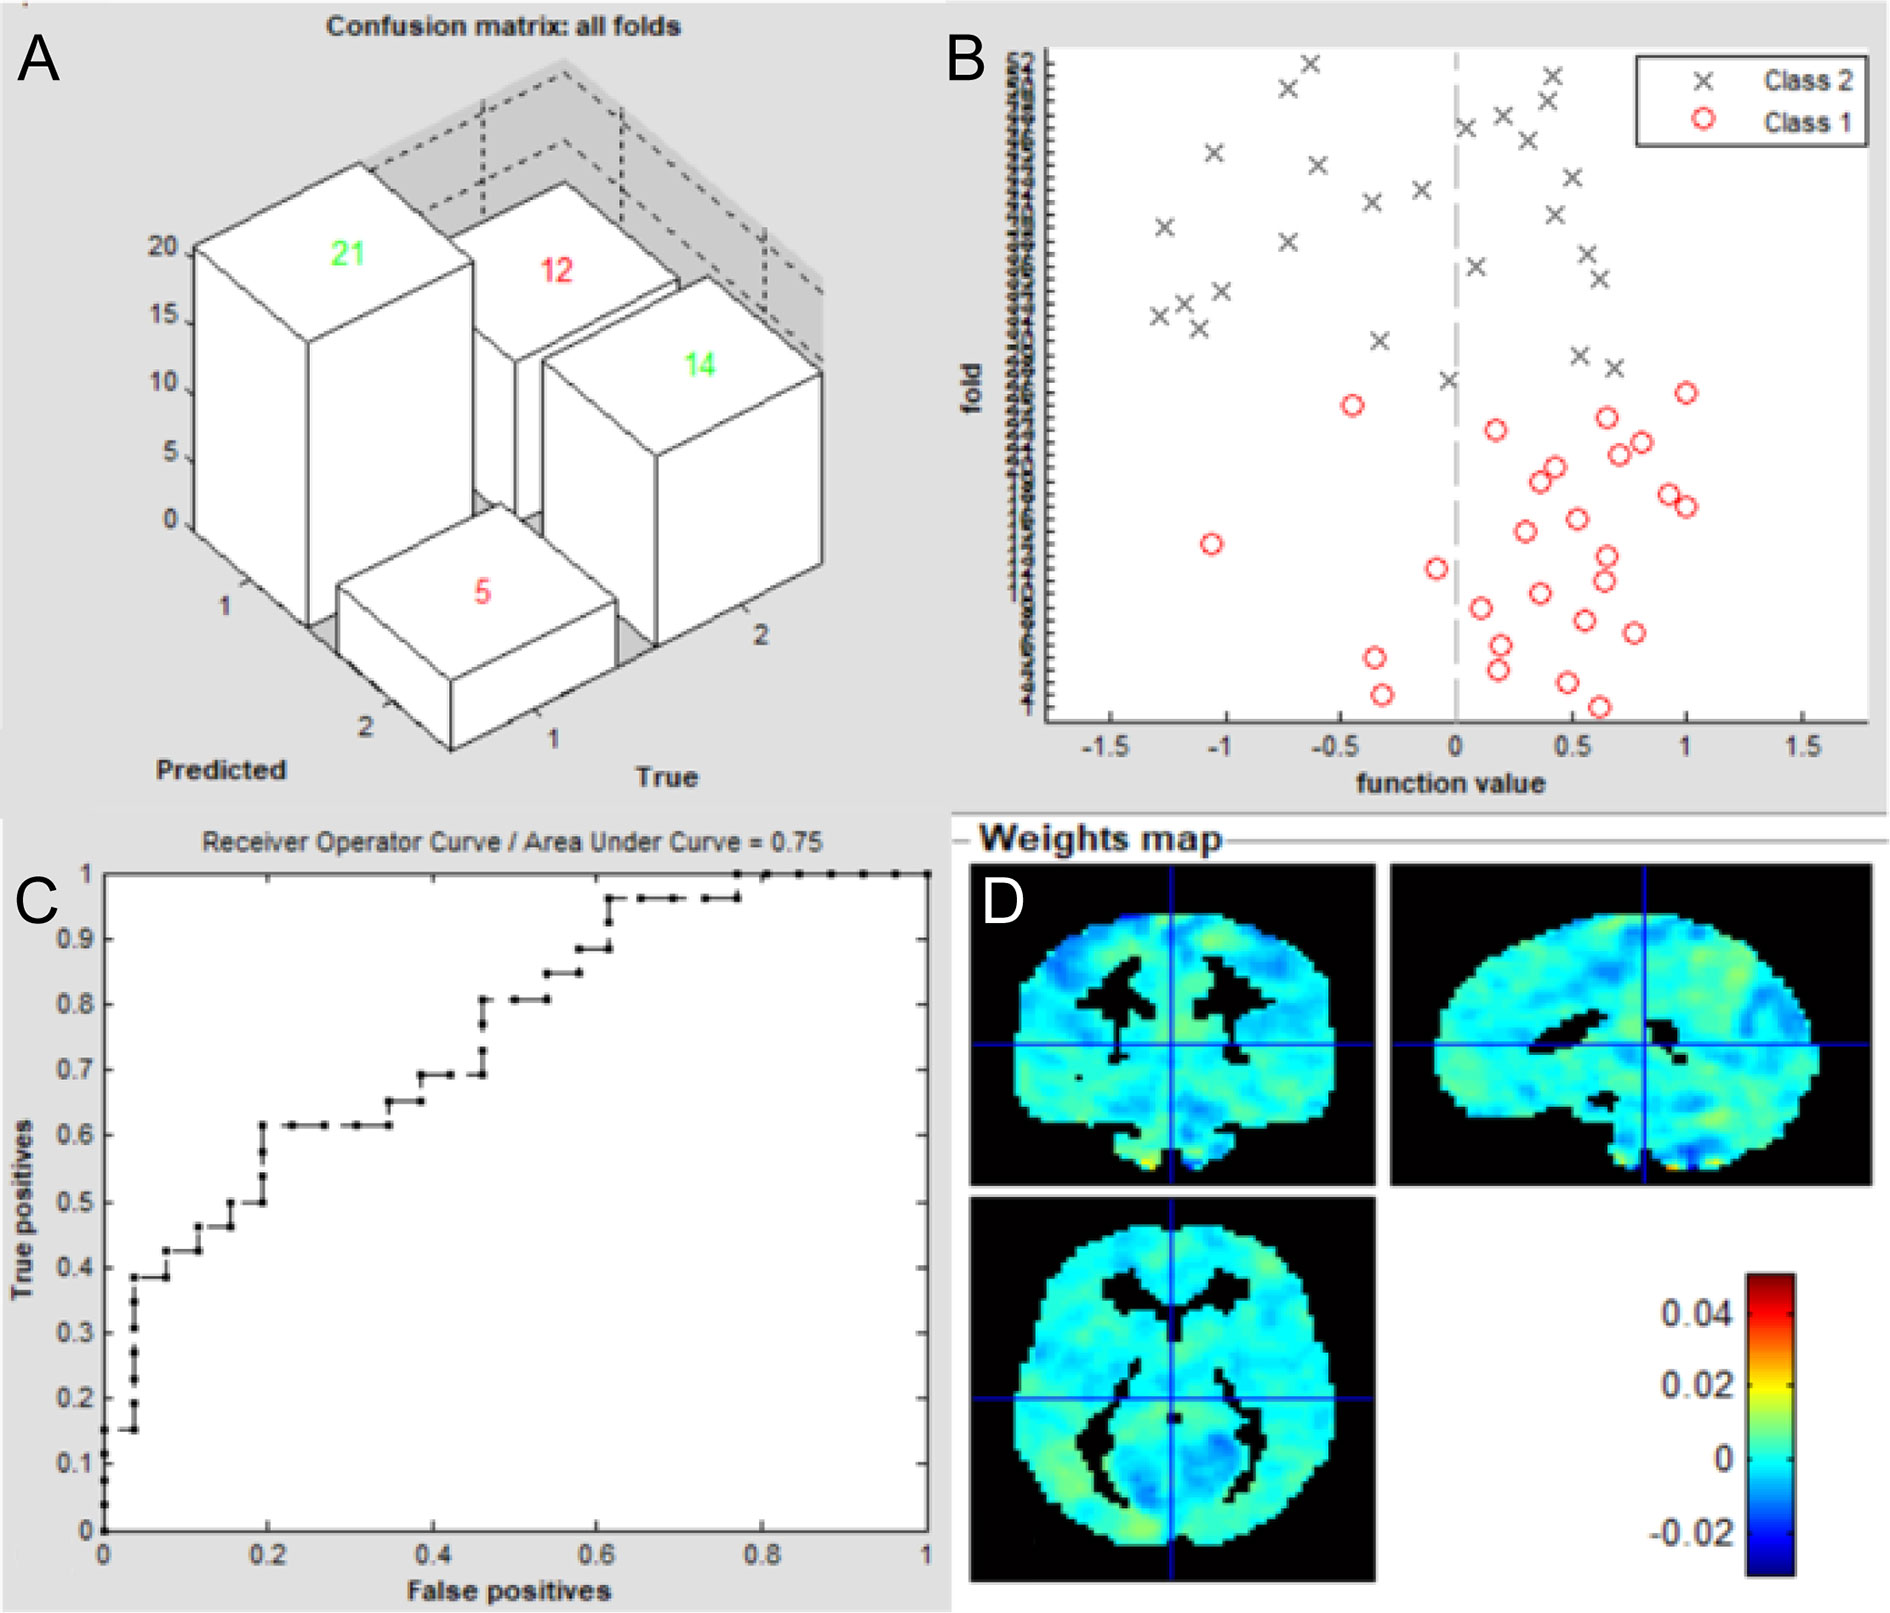
Figure 7 Classification results using machine learning analysis based on FC of the right V1. (A) three-dimensional confusion matrices from machine learning analysis; (B) function values of two groups (class 1: patient group; class 2: HC group); (C) The ROC curve of the classifier, and the AUC was 0.75; (D) Weight maps for SVM models. The weight in each voxel corresponding to its contribution to the model’s prediction.
Regions Contributed Most for Classification
For FC of the left V1, the most informative regions for classification between patients of iridocyclitis and HC included the vermis_9; left inferior occipital gyrus; right inferior occipital gyrus; left postcentral gyrus and cerebelum_6_L. While for FC of the right V1, the most informative regions for classification included the right paracentral lobule; cerebelum_10_L; cerebelum_6_L; right superior parietal gyrus and right inferior occipital gyrus. Detailed results could be obtained in Table 5.
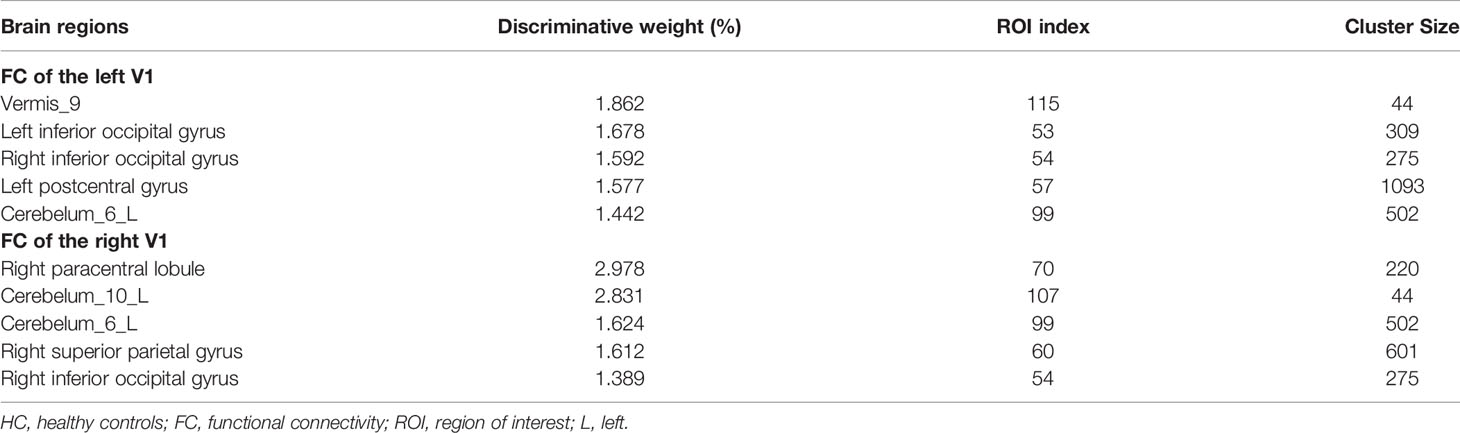
Table 5 Brain areas contributed most for classification between iridocyclitis and HC groups for the FC feature.
Discussion
The seed-based FC technique applied in our study offers a reliable and effective tool to evaluate the correlation coefficients of blood oxygen level-dependent signal time series between distinct brain areas. This approach has been widely applied in patients with ophthalmic diseases and has shown distinct FC disturbances between the V1 and other brain regions (Table 6). To our knowledge, this study was the first to explore FC between the V1 and other brain areas in individuals with iridocyclitis, which may provide a more exhaustive view on the specific connectivity of the V1 in iridocyclitis. In this study, we observed that compared to HCs, patients with iridocyclitis displayed significantly increased FC between the left V1 and left cerebellum crus1, left cerebellum 10, bilateral inferior temporal cortex, right hippocampus and left superior occipital gyrus; and significantly lower FC between the left V1 and bilateral calcarine, bilateral postcentral gyrus. Meanwhile, patients with iridocyclitis displayed significantly increased FC between the right V1 and left cerebellum crus1, bilateral thalamus, left middle temporal gyrus; and significantly lower FC between the right V1 and bilateral calcarine, bilateral postcentral gyrus (Figure 8, voxel-level P<0.01, GRF correction, cluster-level P<0.05). Compared with other fMRI indices (e.g., regional homogeneity) which mainly focus on the local spontaneous brain activity alterations, the FC method is an effective tool to explore the neural activity connections between separated brain regions. Additionally, FC is based on a region of interest, which enables researchers to target a prior brain area before calculating its temporal coherence with other brain regions.
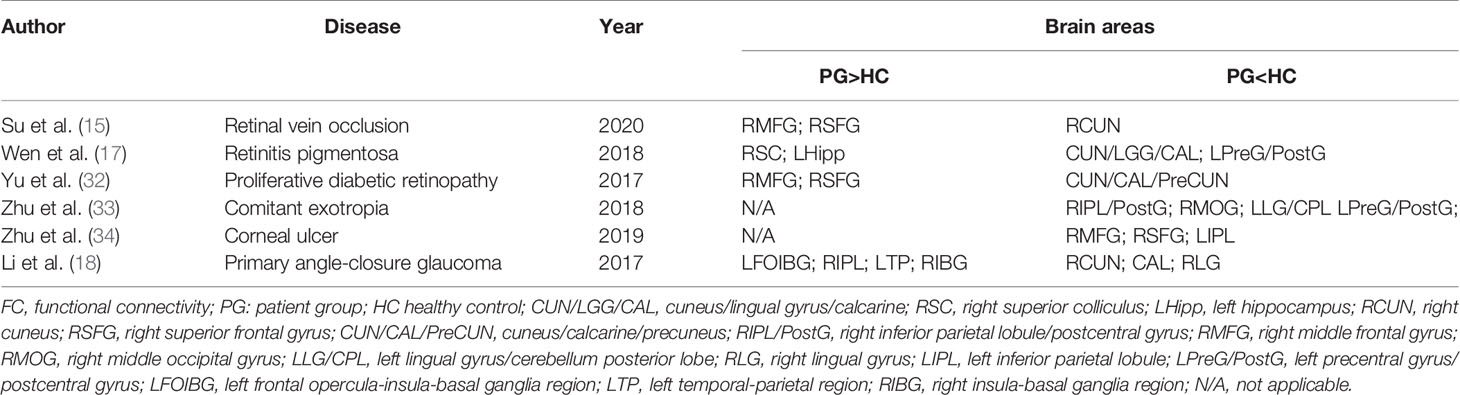
Table 6 FC technique used in ophthalmological diseases.
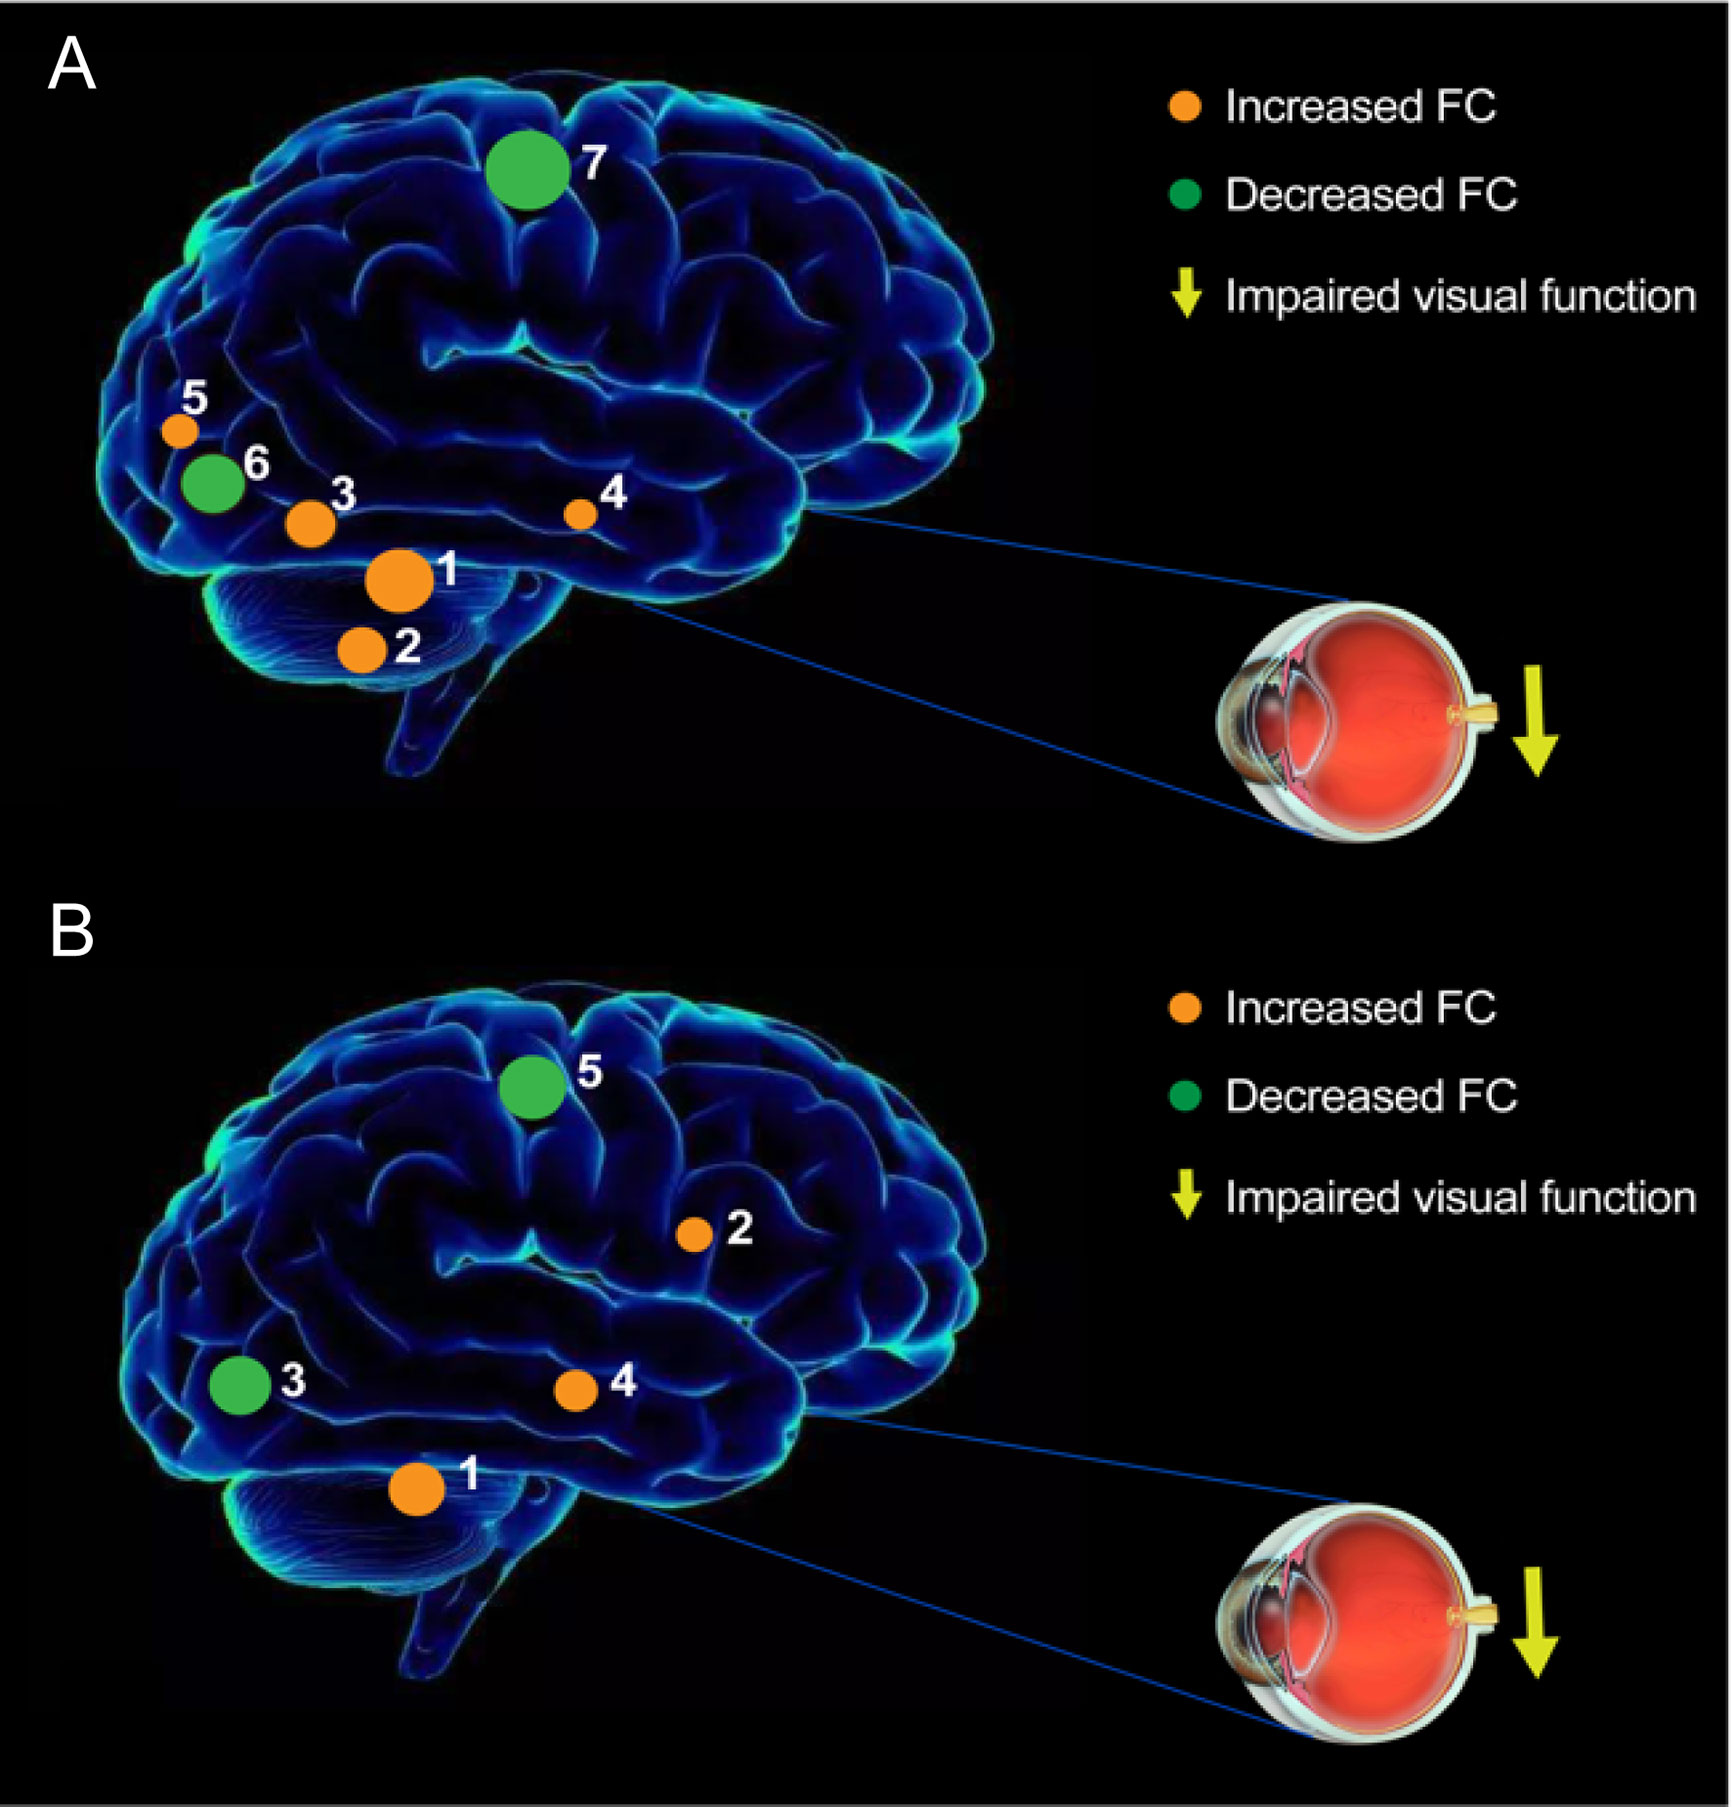
Figure 8 The FC pattern results of left V1 (A) and right V1 (B) in the iridocyclitis group. (A) Compared with HCs, the FC of left V1 in patients with iridocyclitis were increased to various extents: [1] left cerebellum crus1 (t=4.1486); [2] left cerebellum 10 (t=3.5071); [3] left inferior temporal gyrus (t=3.281); [3] right inferior temporal gyrus (t=3.3436); [4] right hippocampus (t=2.8445); [5] left superior occipital gyrus (t=3.2622), and the following areas decreased: [6] bilateral calcarine (t=-4.8233); [7] left postcentral gyrus (t=-4.6021); [7] right postcentral gyrus (t=-4.4712). (B) Compared with HCs, the FC of right V1 in patients with iridocyclitis were increased to various extents: [1] left cerebellum crus1 (t=4.094); [2] bilateral thalamus (t=4.4152); [4] left middle temporal gyrus (t=3.6074), and the following areas decreased: [3] bilateral calcarine (t=-4.4069); [5] left postcentral gyrus (t=-4.0193); [5] right postcentral gyrus (t=-4.5003).
A major FC change was observed between the bilateral V1 and calcarine in patients with iridocyclitis. Anatomically, the calcarine (Brodmann’s area 18) is a constituent part of the occipital lobe, which takes a critical part in the vision network and is involved in visual imagery, visual color, and visual perception (35). Previous neurophysiological studies showed that visual signals were transmitted to the visual cortex through the visual pathway, which consists of dorsal and ventral streams (36). Because of this crucial function in the visual pathway, lesions of the calcarine are reportedly associated with the perceptions of phosphenes and visual field defects (37). Morphological research has implied that retinal nerve fiber layer, central foveal, and retinal thicknesses are affected during the progression of iridocyclitis, which may lead to reduced retinal input and diminished light stimulation at the visual center. Previous researches discovered that patients with iridocyclitis showed vision loss and reduced visual acuity (38). Furthermore, we revealed that patients with iridocyclitis exhibited significant reduction of regional homogeneity in bilateral calcarine and other portions of vison-related areas such as the right inferior occipital gyrus and left superior occipital gyrus in our previous study (39). Consistent with previous findings, our study discovered that individuals with iridocyclitis displayed markedly reduced FC between the bilateral V1 and calcarine. Accordingly, we hypothesized that the lower FC between the V1 and higher order visual cortex contributed to a range of vision loss in patients with iridocyclitis.
We also found significantly lower FC values between the V1 and bilateral postcentral gyrus in individuals with iridocyclitis. The postcentral gyrus is the anatomical area of the primary somatosensory cortex (S1), which participates in various types of sensory perception, including pain and touch (40, 41). The spontaneous neural activity of the visual cortex and S1 exhibit a robust correlation in normal-sighted individuals at rest, which facilitates the combined processing of somatosensory and spatial visual information (42, 43). Notably, we observed that patients with iridocyclitis showed abnormal local synchronization in the right postcentral gyrus during rest state using the regional homogeneity method, which might also contribute to the decrease FC (39). Therefore, we speculate that vision impairment could contribute to declining FC between the V1 and postcentral gyrus in individuals with iridocyclitis. Moreover, decreased visual input may reflect cross-modal plasticity in the V1. Previous fMRI studies have demonstrated that tactile stimuli activate the visual cortex via the somatosensory cortex in individuals with vision impairment (e.g., patients with late blind) (44). Thus, we concluded that the visual cortex participates in visual information transmission to the somatosensory processing pathway; moreover, vision loss and visual cortex representations of sensory modalities might lead to the lower FC between the V1 and S1 in patients with iridocyclitis. Furthermore, various pain-related diseases are reportedly related to S1 dysfunction (45, 46). Patients with iridocyclitis often exhibit typical clinical features of eye pain, consistent with our results.
The cerebellum, which functionally interacts with the frontal eye fields, participates in visuomotor coordination, higher cognitive function, and memory (47, 48). Iridocyclitis is considered the foremost clinical characteristic of ankylosing spondylitis; Li et al. discovered that individuals with ankylosing spondylitis exhibited greater activation in the cerebellum on fMRI analyses (49). In addition, the results of our previous study demonstrated that patients with iridocyclitis had enhanced regional homogeneity values in regions of the right cerebellum (39). Similarly, we found higher FC between the V1 and cerebellum (left cerebellum crus 1 and left cerebellum 10) in the present study. Therefore, patients with iridocyclitis may experience dysfunctional visuomotor function. Additionally, it was implied that neural hyperactivity between the cerebellum and V1 could be a compensatory reaction to vision loss in patients with iridocyclitis.
Patients with iridocyclitis displayed increased FC signal values between the V1 and inferior temporal gyrus (ITG). Importantly, the ITG is located in the protuberance or convolution of the cerebral hemisphere temporal lobe, which is situated below the middle temporal neocortex and the ITG area extends to the inferior sulcus. This area is involved in visual information processing (e.g., the classification of visual shape), object memory, and emotional regulation (50, 51). It is also associated with facial recognition and visual perception (52). Abnormalities in the ITG have been observed in multiple diseases, such as optic neuritis (53), Alzheimer’s disease (54), and blindness (26). Thus, the abnormal FC between the V1 and ITG in our study may result in difficulty with item identification and visual memory, as well as visual selectivity. Notably, Stouter et al. discovered that somatic pain disorder was related to enhanced activation of the temporal lobe (55), which is consistent with our finding that FC signals were markedly increased in the sub-temporal area.
Additionally, we discovered that patients with iridocyclitis had markedly increased FC signal values between the left V1 and right hippocampus. The hippocampus is a critical subcortical nucleus that is closely associated with in memory function and orientation (56); it is also a component of the Papez circuit, which is involved in memory and emotion (57). Therefore, patients with iridocyclitis might experience dysfunction involving both cognition and memory.
The imaging-mediated diagnosis of iridocyclitis still remains challenging because a confirmed diagnosis is generally made on the basis of clinical symptoms. As a multivariate approach, machine learning has the potential to be more sensitive to spatially distributed and subtle effects in the brain than a standard mass-univariate analysis. To date, no studies have assessed the combined effects of FC and supervised machine learning techniques on iridocyclitis. In the present study, we examined whether differences in FC between individuals with iridocyclitis and HCs could serve as a classification feature to discriminate those groups, based on a machine learning approach using a SVM classifier. Receiver operating characteristic (ROC) analysis were used to evaluate the performance of the classifiers. AUC represents the classification power of the SVM classifier, and a larger AUC indicates better classification ability (58). The AUC of this classification was > 70% when the LOOCV technique was applied (P<0.001, non-parametric permutation correction). The LOOCV method uses a single subject from each group as the testing data and the remaining subjects as the training data. The procedure is repeated for each subject; and results from each step are averaged to get a final estimate of classification accuracy (59). These results demonstrated that the SVM approach could reach reliable classification capability with the LOOCV method. In addition, the findings demonstrated that FC methodology could be a promising biological indicator for distinguishing patients with iridocyclitis from HCs.
This study had several limitations. First, its small sample size might have reduced its ability to detect more alterations in neuronal activity; classification power based on the 26 patients with iridocyclitis was still not strong enough. Second, the disease duration and severity of iridocyclitis varied greatly in the included patients, which may also restrict the statistical power of the results. Third, the impacts of physiological noise were not completely eliminated, which may have confounded blood oxygen level-dependent signals. Fourth, although we discovered some changes in FC, the directions of these changes were unknown. Future studies should address these limitations through longitudinal evaluation of a larger dataset and technical improvements in analysis methods. Another independent test sample will also be recruited for testifying classification accuracy in our next work. In addition, multimodal fMRI methods may be conducive to the comprehensive analysis of neuropathological mechanisms in patients with iridocyclitis.
Conclusion
This study explored iridocyclitis-related cerebral function deficits using an FC approach. The results demonstrated that patients with iridocyclitis exhibited complex disturbances in brain networks, particularly between the V1 and brain regions such as vision-related, somatosensory, and cognition-related regions. These findings may enhance the understanding of the pathological mechanisms of iridocyclitis and indicate that FC signals could be effective biomarkers in the clinical evaluation of neurological impairment in patients with iridocyclitis.
Data Availability Statement
The original contributions presented in the study are included in the article/supplementary material. Further inquiries can be directed to the corresponding author.
Ethics Statement
The studies involving human participants were reviewed and approved by Rennin Hospital of Wuhan University. The patients/participants provided their written informed consent to participate in this study.
Author Contributions
YT contributed to study design, fMRI data analysis, and drafted the manuscript. XH contributed to design the protocol, fMRI data analysis, and data collection. C-XQ contributed to data collection and manuscript discussion. YS conceived the study, reviewed, and revised the manuscript. All authors contributed to the article and approved the submitted version.
Funding
This research was supported by the National Key R&D Program of China (Grant No. 2017YFE0103400), and by The National Nature Science Foundation of China (Grant No. 81470628).
Conflict of Interest
The authors declare that the research was conducted in the absence of any commercial or financial relationships that could be construed as a potential conflict of interest.
References
1. Standardization of Uveitis Nomenclature for Reporting Clinical Data. Results of the First International Workshop. A J Ophthalmol (2005) 140:509–16. doi: 10.1016/j.ajo.2005.03.057
2. Papotto PH, Marengo EB, Sardinha LR, Goldberg AC, Rizzo LV. Immunotherapeutic Strategies in Autoimmune Uveitis. Autoimmun Rev (2014) 13:909–16. doi: 10.1016/j.autrev.2014.05.003
3. Huhtinen M. Hla-B27 Typing in the Categorisation of Uveitis in a HLA-B27 Rich Population. Brit J Ophthalmol (2000) 84:413–6. doi: 10.1136/bjo.84.4.413
4. Monnet D. Ophthalmic Findings and Frequency of Extraocular Manifestations in Patients With HLA-B27 Uveitis*1A Study of 175 Cases. Ophthalmology (2004) 111:802–9. doi: 10.1016/j.ophtha.2003.07.011
5. Pathanapitoon K, Dodds EM, Cunningham ET, Rothova A. Clinical Spectrum of HLA-B27-associated Ocular Inflammation. Ocul Immunol Inflamm (2016) 25:569–76. doi: 10.1080/09273948.2016.1185527
6. Kasper M, Walscheid K, Laffer B, Bauer D, Busch M, Wildschütz L, et al. The Phenotype of Monocytes in Anterior Uveitis Depends on the HLA-B27 Status. Front Immunol (2018) 9:1773. doi: 10.3389/fimmu.2018.01773
7. Lin P, Suhler EB, Rosenbaum JT. The Future of Uveitis Treatment. Ophthalmology (2014) 121:365–76. doi: 10.1016/j.ophtha.2013.08.029
8. Ni M, Chan CC, Nussenblatt RB, Li S, Mao W. Iris Inflammatory Cells, Fibronectin, Fibrinogen, and Immunoglobulin in Various Ocular Diseases. Arch Ophthalmol (1988) 106:392–5. doi: 10.1001/archopht.1988.01060130418033
9. Peng Y, Han G, Shao H, Wang Y, Kaplan HJ, Sun D. Characterization of IL-17+Interphotoreceptor Retinoid-Binding Protein-Specific T Cells in Experimental Autoimmune Uveitis. Invest Opthalmol Vis Sci (2007) 48:4153–61. doi: 10.1167/iovs.07-0251
10. Kim M, Choi SY, Park Y-H. Analysis of Choroidal and Central Foveal Thicknesses in Acute Anterior Uveitis by Enhanced-Depth Imaging Optical Coherence Tomography. BMC Ophthalmol (2017) 17:225. doi: 10.1186/s12886-017-0628-7
11. Géhl Z, Kulcsár K, Kiss HJM, Németh J, Maneschg OA, Resch MD. Retinal and Choroidal Thickness Measurements Using Spectral Domain Optical Coherence Tomography in Anterior and Intermediate Uveitis. BMC Ophthalmol (2014) 14:103. doi: 10.1186/1471-2415-14-103
12. Lang S, Duncan N, Northoff G. Resting-State Functional Magnetic Resonance Imaging. Neurosurgery (2014) 74:453–65. doi: 10.1227/neu.0000000000000307
13. Auer DP. Spontaneous Low-Frequency Blood Oxygenation Level-Dependent Fluctuations and Functional Connectivity Analysis of the ‘Resting’ Brain. Magn Reson Imaging (2008) 26:1055–64. doi: 10.1016/j.mri.2008.05.008
14. Ogawa S, Lee TM, Kay AR, Tank DW. Brain Magnetic Resonance Imaging With Contrast Dependent on Blood Oxygenation. P Natl Acad Sci (1990) 87:9868–72. doi: 10.1073/pnas.87.24.9868
15. Su T, Yuan Q, Liao X-L, Shi W-Q, Zhou X-Z, Lin Q, et al. Altered Intrinsic Functional Connectivity of the Primary Visual Cortex in Patients With Retinal Vein Occlusion: A Resting-State fMRI Study. Quant Imaging Med Surg (2020) 10:958–69. doi: 10.21037/qims.2020.03.24
16. Yan X, Wang Y, Xu L, Liu Y, Song S, Ding K, et al. Altered Functional Connectivity of the Primary Visual Cortex in Adult Comitant Strabismus: A Resting-State Functional Mri Study. Curr Eye Res (2018) 44:316–23. doi: 10.1080/02713683.2018.1540642
17. Wen Z, Zhou F-Q, Huang X, Dan HD, Xie B-J, Shen Y. Altered Functional Connectivity of Primary Visual Cortex in Late Blindness. Neuropsychiatr Dis Treat (2018) 14:3317–27. doi: 10.2147/ndt.S183751
18. He H, Li S, Li P, Gong H, Jiang F, Liu D, et al. Intrinsic Functional Connectivity Alterations of the Primary Visual Cortex in Primary Angle-Closure Glaucoma Patients Before and After Surgery: A Resting-State Fmri Study. PloS One (2017) 12:e0170598. doi: 10.1371/journal.pone.0170598
19. Mock VL, Luke KL, Hembrook-Short JR, Briggs F. Dynamic Communication of Attention Signals Between the LGN and V1. J Neurophysiol (2018) 120:1625–39. doi: 10.1152/jn.00224.2018
20. Bryan RN. Machine Learning Applied to Alzheimer Disease. Radiology (2016) 281:665–8. doi: 10.1148/radiol.2016162151
21. Rathore S, Habes M, Iftikhar MA, Shacklett A, Davatzikos C. A Review on Neuroimaging-Based Classification Studies and Associated Feature Extraction Methods for Alzheimer’s Disease and its Prodromal Stages. NeuroImage (2017) 155:530–48. doi: 10.1016/j.neuroimage.2017.03.057
22. Zhang C, Dou B, Wang J, Xu K, Zhang H, Sami MU, et al. Dynamic Alterations of Spontaneous Neural Activity in Parkinson’s Disease: A Resting-State Fmri Study. Front Neurol (2019) 10:1052. doi: 10.3389/fneur.2019.01052
23. Cui Q, Sheng W, Chen Y, Pang Y, Lu F, Tang Q, et al. Dynamic Changes of Amplitude of Low-Frequency Fluctuations in Patients With Generalized Anxiety Disorder. Hum Brain Mapp (2020) 41:1667–76. doi: 10.1002/hbm.24902
24. Yan C-G, Wang X-D, Zuo X-N, Zang Y-F. Dpabi: Data Processing & Analysis for (Resting-State) Brain Imaging. Neuroinformatics (2016) 14:339–51. doi: 10.1007/s12021-016-9299-4
25. Goto M, Abe O, Aoki S, Hayashi N, Miyati T, Takao H, et al. Diffeomorphic Anatomical Registration Through Exponentiated Lie Algebra Provides Reduced Effect of Scanner for Cortex Volumetry With Atlas-Based Method in Healthy Subjects. Neuroradiology (2013) 55:869–75. doi: 10.1007/s00234-013-1193-2
26. Yu C, Liu Y, Li J, Zhou Y, Wang K, Tian L, et al. Altered Functional Connectivity of Primary Visual Cortex in Early Blindness. Hum Brain Mapp (2008) 29:533–43. doi: 10.1002/hbm.20420
27. Schrouff J, Rosa MJ, Rondina JM, Marquand AF, Chu C, Ashburner J, et al. Pronto: Pattern Recognition for Neuroimaging Toolbox. Neuroinformatics (2013) 11:319–37. doi: 10.1007/s12021-013-9178-1
28. Chang C-C, Lin C-J. Libsvm. ACM Trans Intell Syst Technol (2011) 2:1–27. doi: 10.1145/1961189.1961199
29. Fan Y, Liu F, Guo W, Yu D, Gao Q, Gao K, et al. Classification of Different Therapeutic Responses of Major Depressive Disorder With Multivariate Pattern Analysis Method Based on Structural Mr Scans. PloS One (2012) 7:e40968. doi: 10.1371/journal.pone.0040968
30. Portugal LCL, Schrouff J, Stiffler R, Bertocci M, Bebko G, Chase H, et al. Predicting Anxiety From Wholebrain Activity Patterns to Emotional Faces in Young Adults: A Machine Learning Approach. NeuroImage: Clin (2019) 23:101813. doi: 10.1016/j.nicl.2019.101813
31. Zhou C, Cheng Y, Ping L, Xu J, Shen Z, Jiang L, et al. Support Vector Machine Classification of Obsessive-Compulsive Disorder Based on Whole-Brain Volumetry and Diffusion Tensor Imaging. Front Psychiatry (2018) 9:524. doi: 10.3389/fpsyt.2018.00524
32. Yu Y, Lan D-Y, Tang L-Y, Su T, Li B, Jiang N, et al. Intrinsic Functional Connectivity Alterations of the Primary Visual Cortex in Patients With Proliferative Diabetic Retinopathy: A Seed-Based Resting-State fMRI Study. Ther Adv Endocrinol Metab (2020) 11:1–11. doi: 10.1177/2042018820960296
33. Zhu PW, Huang X, Ye L, Jiang N, Zhong YL, Yuan Q, et al. Altered Intrinsic Functional Connectivity of the Primary Visual Cortex in Youth Patients With Comitant Exotropia: A Resting State fMRI Study. Int J Ophthalmol (2018) 11:668–73. doi: 10.18240/ijo.2018.04.22
34. Zhu F, Tang L, Zhu P, Lin Q, Yuan Q, Shi W, et al. Resting-State Functional Magnetic Resonance Imaging (fMRI) and Functional Connectivity Density Mapping in Patients With Corneal Ulcer. Neuropsychiatr Dis Treat (2019) 15:1833–44. doi: 10.2147/ndt.S210658
35. Roland PE, Gulyás B. Visual Memory, Visual Imagery, and Visual Recognition of Large Field Patterns by the Human Brain: Functional Anatomy by Positron Emission Tomography. Cereb Cortex (1995) 5:79–93. doi: 10.1093/cercor/5.1.79
36. Hadjikhani N, Tootell RBH. Projection of Rods and Cones Within Human Visual Cortex. Hum Brain Mapp (2000) 9:55–63. doi: 10.1002/(sici)1097-0193(2000)9:1<55::Aid-hbm6>3.0.Co;2-u
37. Baier B, de Haan B, Müller N, Thömke F, Birklein F, Dieterich M, et al. Anatomical Correlate of Positive Spontaneous Visual Phenomena – a Voxelwise Lesion Study. Klin Neurophysiol (2010) 74:218–22. doi: 10.1055/s-0030-1250833
38. Al-Ani HH, Sims JL, Tomkins-Netzer O, Lightman S, Niederer RL. Vision Loss in Anterior Uveitis. Brit J Ophthalmol (2020) 104:1652–7. doi: 10.1136/bjophthalmol-2019-315551
39. Tong Y, Huang X, Qi C-X, Shen Y. Disrupted Neural Activity in Individuals With Iridocyclitis Using Regional Homogeneity: A Resting-State Functional Magnetic Resonance Imaging Study. Front Neurol (2021) 12:609929. doi: 10.3389/fneur.2021.609929
40. Wrigley PJ, Press SR, Gustin SM, Macefield VG, Gandevia SC, Cousins MJ, et al. Neuropathic Pain and Primary Somatosensory Cortex Reorganization Following Spinal Cord Injury. Pain (2009) 141:52–9. doi: 10.1016/j.pain.2008.10.007
41. Mori K, Osada H, Yamamoto T, Nakao Y, Maeda M. Pterional Keyhole Approach to Middle Cerebral Artery Aneurysms Through an Outer Canthal Skin Incision. Minim Invasive Neurosurg (2007) 50:195–201. doi: 10.1055/s-2007-985837
42. Nir Y, Hasson U, Levy I, Yeshurun Y, Malach R. Widespread Functional Connectivity and fMRI Fluctuations in Human Visual Cortex in the Absence of Visual Stimulation. NeuroImage (2006) 30:1313–24. doi: 10.1016/j.neuroimage.2005.11.018
43. Wang K, Jiang T, Yu C, Tian L, Li J, Liu Y, et al. Spontaneous Activity Associated With Primary Visual Cortex: A Resting-State fMRI Study. Cereb Cortex (2007) 18:697–704. doi: 10.1093/cercor/bhm105
44. Burton H, Snyder AZ, Conturo TE, Akbudak E, Ollinger JM, Raichle ME. Adaptive Changes in Early and Late Blind: A Fmri Study of Braille Reading. J Neurophysiol (2002) 87:589–607. doi: 10.1152/jn.00285.2001
45. Pijnenburg M, Brumagne S, Caeyenberghs K, Janssens L, Goossens N, Marinazzo D, et al. Resting-State Functional Connectivity of the Sensorimotor Network in Individuals With Nonspecific Low Back Pain and the Association With the Sit-to-Stand-to-Sit Task. Brain Connect (2015) 5:303–11. doi: 10.1089/brain.2014.0309
46. Jutzeler CR, Huber E, Callaghan MF, Luechinger R, Curt A, Kramer JLK, et al. Association of Pain and CNS Structural Changes After Spinal Cord Injury. Sci Rep (2016) 6:18534. doi: 10.1038/srep18534
47. Desmond JE, Fiez JA. Neuroimaging Studies of the Cerebellum: Language, Learning and Memory. Trends Cognit Sci (1998) 2:355–62. doi: 10.1016/s1364-6613(98)01211-x
48. Stoodley CJ, Schmahmann JD. Evidence for Topographic Organization in the Cerebellum of Motor Control Versus Cognitive and Affective Processing. Cortex (2010) 46:831–44. doi: 10.1016/j.cortex.2009.11.008
49. Li C, Wei X, Zou Q, Zhang Y, Yin X, Zhao J, et al. Cerebral Functional Deficits in Patients With Ankylosing Spondylitis- an fMRI Study. Brain Imaging Behav (2016) 11:936–42. doi: 10.1007/s11682-016-9565-y
50. Noppeney U, Price CJ. Retrieval of Visual, Auditory, and Abstract Semantics. NeuroImage (2002) 15:917–26. doi: 10.1006/nimg.2001.1016
51. McKee JL, Riesenhuber M, Miller EK, Freedman DJ. Task Dependence of Visual and Category Representations in Prefrontal and Inferior Temporal Cortices. J Neurosci (2014) 34:16065–75. doi: 10.1523/jneurosci.1660-14.2014
52. Tu X, Wang J, Liu X, Zheng J. Aberrant Regional Brain Activities in Alcohol Dependence: A Functional Magnetic Resonance Imaging Study. Neuropsychiatr Dis Treat (2018) 14:847–53. doi: 10.2147/ndt.S158221
53. Shao Y, Huang X, Cai F, Hu P-H, Zhong Y, Zhang Y, et al. Disturbed Spontaneous Brain-Activity Pattern in Patients With Optic Neuritis Using Amplitude of Low-Frequency Fluctuation: A Functional Magnetic Resonance Imaging Study. Neuropsychiatr Dis Treat (2015) 11:3075–83. doi: 10.2147/ndt.S92497
54. Scheff SW, Price DA, Schmitt FA, Scheff MA, Mufson EJ. Synaptic Loss in the Inferior Temporal Gyrus in Mild Cognitive Impairment and Alzheimer’s Disease. J Alzheimers Dis (2011) 24:547–57. doi: 10.3233/jad-2011-101782
55. Stoeter P, Bauermann T, Nickel R, Corluka L, Gawehn J, Vucurevic G, et al. Cerebral Activation in Patients With Somatoform Pain Disorder Exposed to Pain and Stress: An fMRI Study. NeuroImage (2007) 36:418–30. doi: 10.1016/j.neuroimage.2007.01.052
56. Dolleman-van der Weel MJ, Griffin AL, Ito HT, Shapiro ML, Witter MP, Vertes RP, et al. The Nucleus Reuniens of the Thalamus Sits At the Nexus of a Hippocampus and Medial Prefrontal Cortex Circuit Enabling Memory and Behavior. Learn Mem (2019) 26:191–205. doi: 10.1101/lm.048389.118
57. Papez JW. A proposed mechanism of emotion. 1937 [Classical Article]. J Neuropsychiatry Clin Neurosci (1995) 7:103–12. doi: 10.1176/jnp.7.1.103
58. Fawcett T. An Introduction to ROC Analysis. Pattern Recogn Lett (2006) 27:861–74. doi: 10.1016/j.patrec.2005.10.010
Keywords: functional connectivity, iridocyclitis, primary visual area, functional magnetic resonance imaging, support vector machine, machine learning
Citation: Tong Y, Huang X, Qi C-X and Shen Y (2021) Altered Functional Connectivity of the Primary Visual Cortex in Patients With Iridocyclitis and Assessment of Its Predictive Value Using Machine Learning. Front. Immunol. 12:660554. doi: 10.3389/fimmu.2021.660554
Received: 29 January 2021; Accepted: 21 April 2021;
Published: 07 May 2021.
Edited by:
Elena Zaslavsky, Icahn School of Medicine at Mount Sinai, United StatesReviewed by:
Regina Júlia Deák-Meszlényi, Hungarian Academy of Sciences (MTA), HungaryMarianna La Rocca, University of Southern California, United States
Copyright © 2021 Tong, Huang, Qi and Shen. This is an open-access article distributed under the terms of the Creative Commons Attribution License (CC BY). The use, distribution or reproduction in other forums is permitted, provided the original author(s) and the copyright owner(s) are credited and that the original publication in this journal is cited, in accordance with accepted academic practice. No use, distribution or reproduction is permitted which does not comply with these terms.
*Correspondence: Yin Shen, yinshen@whu.edu.cn
†These authors have contributed equally to this work